Access Across America: Transit 2016
|
|
|
- Oscar Gyles Hodges
- 6 years ago
- Views:
Transcription
1 Access Across America: Transit 2016 Final Report Prepared by: Andrew Owen Brendan Murphy Accessibility Observatory Center for Transportation Studies University of Minnesota David Levinson School of Civil Engineering University of Sydney CTS 17-07
2 1. Report No. CTS Title and Subtitle Access Across America: Transit Author(s) Andrew Owen, Brendan Murphy, David Levinson 9. Performing Organization Name and Address Accessibility Observatory University of Minnesota Minneapolis, MN United States 12. Sponsoring Organization Name and Address Center for Transportation Studies University of Minnesota 200 Transportation and Safety Building 511 Washington Ave. SE Minneapolis, MN Supplementary Notes Abstract (Limit: 250 words) Recipients Accession No. Technical Report Documentation Page 5. Report Date November Performing Organization Report No. 10. Project/Task/Work Unit No. CTS Contract (C) or Grant (G) No. 13. Type of Report and Period Covered Final Report 14. Sponsoring Agency Code Accessibility is the ease and feasibility of reaching valued destinations. It can be measured for a wide array of transportation modes, to different types of destinations, and at different times of day. There are a variety of ways to measure accessibility, but the number of destinations reachable within a given travel time is the most comprehensible and transparent as well as the most directly comparable across cities. This study estimates the accessibility to jobs by transit and walking for each of the United States 11 million census blocks, and analyzes these data in 49 of the 50 largest (by population) metropolitan areas. Transit is used for an estimated 5 percent of commuting trips in the United States, making it the second most widely used commute mode after driving. Travel times by transit are calculated using detailed pedestrian networks and full transit schedules for the 7:00 9:00 a.m. period. The calculations include all components of a transit journey, including last-mile access and egress walking segments and transfers, and account for minute-by-minute variations in service frequency. This report presents detailed accessibility values for each metropolitan area, as well as block-level maps that illustrate the spatial patterns of accessibility within each area. A separate publication, Access Across America: Transit 2016 Methodology, describes the data and methodology used in this evaluation. This analysis uses the same tools and techniques as Access Across America: Transit 2015, and at the same fully national scale; availability of GTFS data has increased in consistency. For these reasons, direct comparisons between transit accessibility results of 2015 and 2016 are possible, and comparisons and time-series analysis are included in these reports going forward. 17. Document Analysis/Descriptors accessibility, transit, commuting, work trips, land use, travel time, travel behavior, urban transportation 19. Security Class (this report) Unclassified 20. Security Class (this page) Unclassified 18. Availability Statement No restrictions. Document available from: National Technical Information Services, Alexandria, Virginia No. of Pages Price
3 Access Across America: Transit 2016 Final Report Prepared by: Andrew Owen Brendan Murphy Accessibility Observatory Center for Transportation Studies University of Minnesota David Levinson School of Civil Engineering University of Sydney November 2017 Published by: Center for Transportation Studies University of Minnesota 200 Transportation and Safety Building 511 Washington Ave. S.E. Minneapolis, Minnesota This report represents the results of research conducted by the authors and does not necessarily reflect the official views or policy of the Center for Transportation Studies or the University of Minnesota.
4 Director, Accessibility Observatory University of Minnesota Lead Researcher, Accessibility Observatory University of Minnesota Professor of Transport, School of Civil Engineering University of Sydney The development of this report was made possible by sponsorship from: Arkansas State Highway and Transportation Department California Department of Transportation Federal Highway Administration Florida Department of Transportation Iowa Department of Transportation Maryland Department of Transportation Minnesota Department of Transportation North Carolina Department of Transportation Virginia Department of Transportation Wisconsin Department of Transportation
5 Accessibility is the ease and feasibility of reaching valuable destinations. Accessibility can be measured for a wide array of transportation modes, to different types of destinations, and at different times of day. There are a variety of ways to de ne accessibility, but the number of destinations reachable within a given travel time is the most comprehensible and transparent as well as the most directly comparable between cities, and other geographic areas. This report focuses on accessibility to jobs by transit. Jobs are the most signi cant non-home destination, and job accessibility is an important consideration in the attractiveness and usefulness of a place or area. Transit is used for an estimated 5% of commuting trips in the United States nationwide, making it the second most widely used commute mode after driving. This study estimates the accessibility to jobs by transit and walking for each of the United States 11 million census blocks, and analyzes these data in 49 of the 50 largest (by population) metropolitan areas. Travel times by transit are calculated using detailed pedestrian networks and full transit schedules for the 7:00 9:00 AM period. The calculations include all components of a transit journey, including last mile access and egress walking segments and transfers, and account for minute-by-minute variations in service frequency. Rankings are determined by a weighted average of accessibility, with a higher weight given to closer, easier to access jobs. Jobs reachable within ten minutes are weighted most heavily, and jobs are given decreasing weights as travel time increases up to 60 minutes. Based on this measure, the 10 metropolitan areas with the greatest accessibility to jobs by transit are: 1. New York 2. San Francisco 3. Chicago 4. Washington 5. Los Angeles 6. Boston 7. Philadelphia 8. Seattle 9. San Jose 10. Denver Additionally, rankings based on 1-year changes in weighted average accessibility are also provided, comparing the results of Access Across America: Transit 2015 with the results of the 2016 study. The 10 metropolitan areas with the greatest 1-year relative gains in accessibility to jobs by transit are: 1. Cincinnati
6 2. Orlando 3. Seattle 4. Providence 5. Charlotte 6. Phoenix 7. Riverside 8. Milwaukee 9. Hartford 10. New Orleans This report presents detailed accessibility values for each metropolitan area, as well as block-level maps that illustrate the spatial patterns of accessibility within each area. A separate publication, Access Across America: Transit 2016 Methodology, describes the data and methodology used in this evaluation. This analysis uses the same tools and techniques as Access Across America: Transit 2015, and at the same fully national scale; availability of GTFS data has increased in consistency. For these reasons, direct comparisons between transit accessibility results of 2015 and 2016 are possible, and comparisons and time-series analysis are included in these reports going forward. 4
7
8 Accessibility is the ease and feasibility of reaching valuable destinations. It combines the simpler metric of mobility with the understanding that travel is driven by a desire to reach destinations. Accessibility can be measured for a wide range of transportation modes, to different types of destinations, and at different times of day. There are a variety of ways to de ne accessibility, but the number of destinations reachable within a given travel time is the most comprehensible and transparent as well as the most directly comparable across cities. This report focuses on accessibility to jobs by transit. Jobs are the most signi cant non-home destination, and economic accessibility is an important consideration in the attractiveness and usefulness of a place or area. Transit is used for an estimated 5% of commuting trips in the United States, making it the second most widely used commute mode after driving. 1 The commute mode share of transit can be higher in individual metropolitan areas: 31% in the New York metropolitan area; 11% in Chicago; 8% in Seattle. 2 Accessibility is not a new idea. 3 Historically, however, implementations of accessibility evaluation have typically focused on individual cities or metropolitan areas. Recent work has demonstrated the feasibility and value of systematically evaluating accessibility across multiple metropolitan areas by auto, 4 and by transit. 5 This study estimates the accessibility to jobs by transit and walking for each of the United States 11 million census blocks, and analyzes these data in 49 of the 50 largest (by population) metropolitan areas using transit schedules from The city excluded from comparisons due to lack of available GTFS data is Memphis, TN, which ranks 41st by metropolitan area population. Table 1 lists the included metropolitan areas, ordered by the total employment within each. Travel times by transit are calculated using detailed pedestrian networks and full transit schedules for the 7:00 9:00 AM period. The calculations include all components of a transit journey, including last mile access and egress walking segments and transfers, and account for minute-by-minute variations in service frequency. Section 2 presents the accessibility values for the included metropolitan areas and ranks metropolitan areas by accessibility, as well as by 1-year gains or losses in weighted accessibility between 2016 and Section 3 discusses these results and their implications, and Section 4 provides data and maps describing patterns of accessibility in individual metropolitan areas. A separate document, Access Across America: Transit 2016 Methodology, describes the data and detailed methodology used in the evaluation. 1 McKenzie (2014) 2 American Community Survey year estimates 3 See Hansen (1959) for its origins, and Geurs and Van Eck (2001) and Handy and Niemeier (1997) for reviews. 4 Levinson (2013) Levine et al. (2012) 5 Ramsey and Bell (2014), Tomer et al. (2011) 1
9 Table 1: Metropolitan Areas Ranked by Total Employment Employment totals are based on LEHD estimates and may not match other sources. 2
10 Table 2 gives the accessibility values for each metropolitan area, in alphabetical order, based on January, 2016 transit schedules. The columns represent the number of jobs that a typical worker residing in the city can reach within 10, 20, 30, 40, 50, and 60 minutes of travel, between 7:00 and 9:00 AM, by transit and walking. The rankings of accessibility across U.S. cities for 2016 are shown in Table 3. The ranking is based on a weighted average, where the jobs reachable within each threshold are given a decreasing weight as travel time increases. A job reachable within 10 minutes counts more toward the ranking than a job reachable within 20, and so on. The 10 metro areas where workers can, on average, reach the most jobs are listed below. Within the speci c time thresholds, the rankings vary. 1. New York 2. San Francisco 3. Chicago 4. Washington 5. Los Angeles 6. Boston 7. Philadelphia 8. Seattle 9. San Jose 10. Denver The 1-year relative gains and losses of weighted transit accessibility across U.S. cities between 2015 and 2016 are shown in Table 4. The differences detailed here are relative percentage changes in weighted accessibility. Following are the 10 metro areas which saw the largest gains in relative transit accessibility over 2015 are as follows. 1. Cincinnati 2. Orlando 3. Seattle 3
11 4. Providence 5. Charlotte 6. Phoenix 7. Riverside 8. Milwaukee 9. Hartford 10. New Orleans Additional details about each metropolitan area, including block-level maps of accessibility, are presented in Section 4. 4
12 Table 2: Number of Jobs Reachable by Number of Minutes,
13 Table 3: Rank of Accessibility by Metropolitan Area,
14 Table 4: 1-Year Change in Weighted Accessibility 7
15 This report builds on the work begun in Access Across America: Transit 2014 and continued in Access Across America: Transit 2015, which introduced a new methodology and datasets to enable intermetropolitan comparisons of accessibility by transit in a way that is clearly understood and explainable, tracks with our experience and the available evidence, and incorporates the many factors that determine the usefulness of a transit system. Additionally, in 2015 the work expanded its scope to become fully national accessibility data are calculated for every census block in the U.S.; data are aggregated and summarized within CBSAs for this report. Not all jobs are the same. Some jobs are higher paying, some are lower skilled, and they exist in a variety of industries. Given sufficient data, one could differentiate accessibility by breaking down jobs by type and get different results. Accessibility to non-work locations (shopping, health care, education, etc.) is also important. Regardless of trip purpose, people who experience higher accessibility tend to travel shorter distances because origins and destinations are closer together. But accessibility to jobs is not the only thing that people care about. If it were, cities would be situated on a minimum amount of space so people could live immediately adjacent to their jobs, or everyone would work from home. Measuring (and then valuing) accessibility to other opportunities and considering the trade-off between accessibility and living space are central problems of urban economics, regional science, and transportation and land-use planning. While being more accessible is generally better, there are costs as well as bene ts associated with accessibility. If land is more valuable, its price is higher, and purchasers can afford less. Streets in places with more activities are inherently more crowded, and trips are less peaceful. Accessibility is a function of both transportation networks and land use decisions, which has important policy implications. There are two broad avenues to increasing accessibility: improving transportation systems, and altering land use patterns. Neither of these things can be easily shifted overnight, but over time they do change both through direct plans and action and through market forces. It is important to recognize that aggregate metrics such as these are also affected simply by the size of the areas being studied. For example, residents of central Minneapolis enjoy greater accessibility than those of central Milwaukee, but the expansive Minneapolis Saint Paul metropolitan area, which is over four times as large in land area, includes far more suburban and exurban areas (with little or no transit service) than does the Milwaukee area. Transit transportation improvements within existing infrastructure take the form of speed increases or frequency increases. Speed improvements increase accessibility by making destinations reachable in less time, but they are often difficult to achieve for transit vehicles operating in mixed traffic. Frequency improvements reduce the average amount of time spent waiting for transit vehicles at stops, leaving more time for travel toward valuable destinations. Speed and frequency are also linked: as average speeds increase, a xed number of transit vehicles can serve the same route length with increasing frequency. 6 Improvements involving construction of new transit infrastructure (additional bus stops, 6 Walker (2012) provides a detailed and accessible exploration of transit service fundamentals. 8
16 rail line extensions, or entirely new transit lines) also can heavily in uence accessibility by transit, by providing transit-based access to job centers and destinations previously unreachable. New transit lines which serve already-served areas do not expand the basin of reachable valuable destinations, but could serve to increase service frequency in aggregate. This evaluation re ects the impact of transit service frequency by making the assumption that all departure times are equally valuable to users, and it includes full waiting times before each trip. This is an important difference relative to earlier national evaluations of transit accessibility, which typically use a single departure time and/or a xed wait time. 7 This approach provides two important bene ts. First, it avoids the assumptions that transit service with 30-minute frequency is as valuable as service with 10-minute frequency, and that users suffer no inconvenience from adjusting their personal schedules to match transit schedules. Second, it allows more meaningful comparisons with accessibility evaluations for other transportation modes such as driving, 8 which typically use average speeds over time periods implicitly assuming an equal value of departure times. As a result of this methodological choice, the accessibility results presented here are far more sensitive to service frequency effects than those of earlier transit accessibility evaluations. Cities with robust transit coverage but low service frequency are generally ranked lower than cities with comparable networks but higher frequencies. Land use-based approaches to improving transit accessibility revolve around proximity and density for both origins and destinations. Proximity to transit service is critical in overcoming both the low speed of pedestrian access to and from stops and stations, and the decrease in motivation to make the walking trip with greater distance. Density is the manifestation of the increasing value of more accessible locations. As residential areas become denser, more residents experience the local accessibility; as employment areas become denser, more jobs can be accessed through the same transit system. Density is not determined solely by accessibility, however: land-use policies can restrict density where it would otherwise be high or encourage density where it might otherwise be low. Perhaps the most famous examples of such policies are Oregon s urban growth boundary laws, which encourage density by restricting the amount of land available for urban development, and the Height of Buildings Act of 1910, which restricts density in the District of Columbia by limiting building heights. Other notable areas with urban growth boundary laws in the U.S. include Seattle, San Jose, and Boulder; additionally, Boston limits building heights near its Common central park. Between these most salient examples lie a range of density-focused urban policies, typically embedded in zoning codes, which help enable (and hinder) each city s transit accessibility performance. In general, areas with higher residential and employment density can achieve greater transit accessibility given the same level of transit service. At lower accessibility thresholds, and especially at the 10-minute threshold, the job accessibility experienced by a typical worker is determined primarily by local employment density and only secondarily, if at all, by transit service. With a 10-minute travel time budget, reaching a stop, waiting for a vehicle, and walking to the destination after alighting leave little time available for actually traveling on a transit vehicle. It is likely that most jobs within this threshold are reached solely by walking and do 7 e.g. Tomer et al. (2011), Ramsey and Bell (2014) 8 e.g. Levinson (2013), Levine et al. (2012) 9
17 not involve a transit vehicle at all. The results presented in Table 3 for the 10-minute threshold look much like a ranking by employment and residential density. As the travel time threshold increases, so does the relative contribution of transit service and coverage to the rankings. This analysis uses the same tools and techniques as Access Across America: Transit 2015, and at the same fully national scale. GTFS data availability has steadily improved, and now is sufficiently consistent year-to-year in major metropolitan areas to allow meaningful comparisons of transit accessibility, and to inform discussions of transit coverage and land use changes. As detailed in Access Across America: Transit 2016, this report implements the most recent update to the U.S. Census LEHD dataset, LEHD Access Across America: Transit 2015 relied on LEHD 2013 data. This update of datasource, in combination with increased GTFS consistency, allows observation of signi cant land-use changes (namely, job growth and mixed-use densi cation in certain metropolitan areas), and the impact of landuse on how accessible a city will turn out to be. The precise disentanglement of accessibility changes due to land-use mix or transit improvements (and determining relative percentage apportionment) requires a signi cant increase in the amount of accessibility computations. However, absent signi cant restructuring of an entire transit system (e.g. Houston, TX ca. 2015), or the addition of new corridor lines (e.g. Metro Transit adding the Green Line LRT in the Twin Cities, MN in 2014), it is reasonable to suggest a majority of accessibility changes are due to evolving land use patterns. The cities that make up the top 10 transit accessibility ranks all exhibit a combination of high density land use and fast, frequent transit service. However, there is still signi cant variation within this group. In New York, San Francisco, Washington, and Chicago, fast heavy rail systems connect both urban and suburban areas with a highly employment-dense core. It is instructive to compare these cities to Atlanta, which has a similar, but smaller, rail system but a much more decentralized job and population distribution, and lower accessibility. Seattle and Denver both have rapidly expanding light rail systems, supported by extensive and frequent bus networks. Though Portland is famous for its streetcar service, this covers only a small part of the city, and operates mostly in mixed traffic with very little access to proprietary right-of-way, limiting its service speed. Its urban growth boundary, combined with frequent bus service throughout core areas and light rail connections to suburban areas, likely plays a more important role in providing high accessibility: by encouraging both residents and employers to locate in parts of the city already well served by transit, each new resident enjoys high accessibility but imposes only a small marginal burden on the transit system s existing resources. Additionally, the expanded scope of this report s focus toward analyzing accessibility for every census block in the U.S. affords a look at what impact public transit has on a national scale. The vast majority of the U.S. land mass is quite sparsely-populated outside of metropolitan areas, and the contained metropolitan areas are in many cases very far apart. Also, the type of transit service included in the analysis is strictly limited to public transit, most commonly found in urban areas inter-city bus and rail services, such as Megabus, Greyhound, or Jefferson, and Amtrak, respectively, are not included. Further, such services operate on time-scales greater than the travel times involved in this analysis. 10
18 Given that mostly urban-centric systems are included, only a very small geographical area of the country enjoys mass transit services, and thus the total area experiencing transit accessibility bene ts is quite small. Transportation and land use systems are both dynamic, and this report presents the second annual national evaluation, following that detailed in Access Across America: Transit In constantlyevolving systems like these, it is critical to monitor changes over time. A city that adopts a goal of increasing transit accessibility should be evaluated based on how effectively it advances that goal relative to a baseline. Access Across America: Transit 2014 served as a starting framework for inter-city accessibility evaluation, and Access Across America: Transit 2015 expanded the scope and data availability to allow direct year-to-year comparisons; this report adds 2016 transit accessibility data, and begins the process of monitoring and comparing how accessibility in these metropolitan areas evolves in response to transportation investments and land use decisions. 11
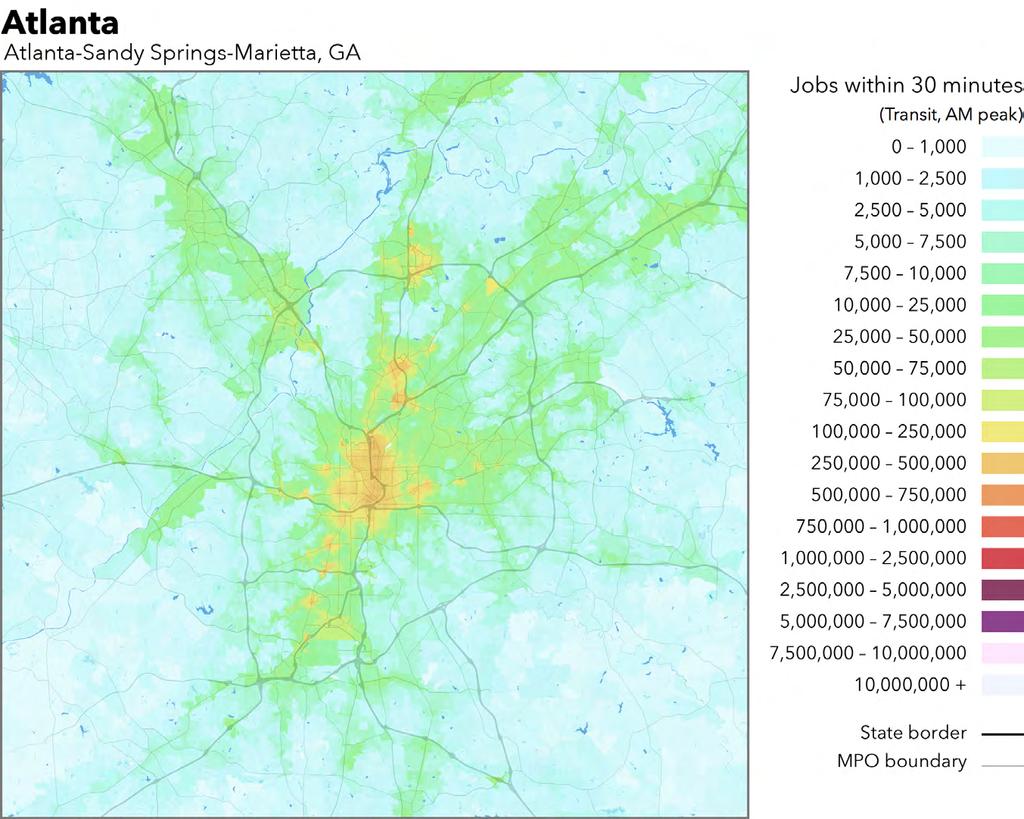
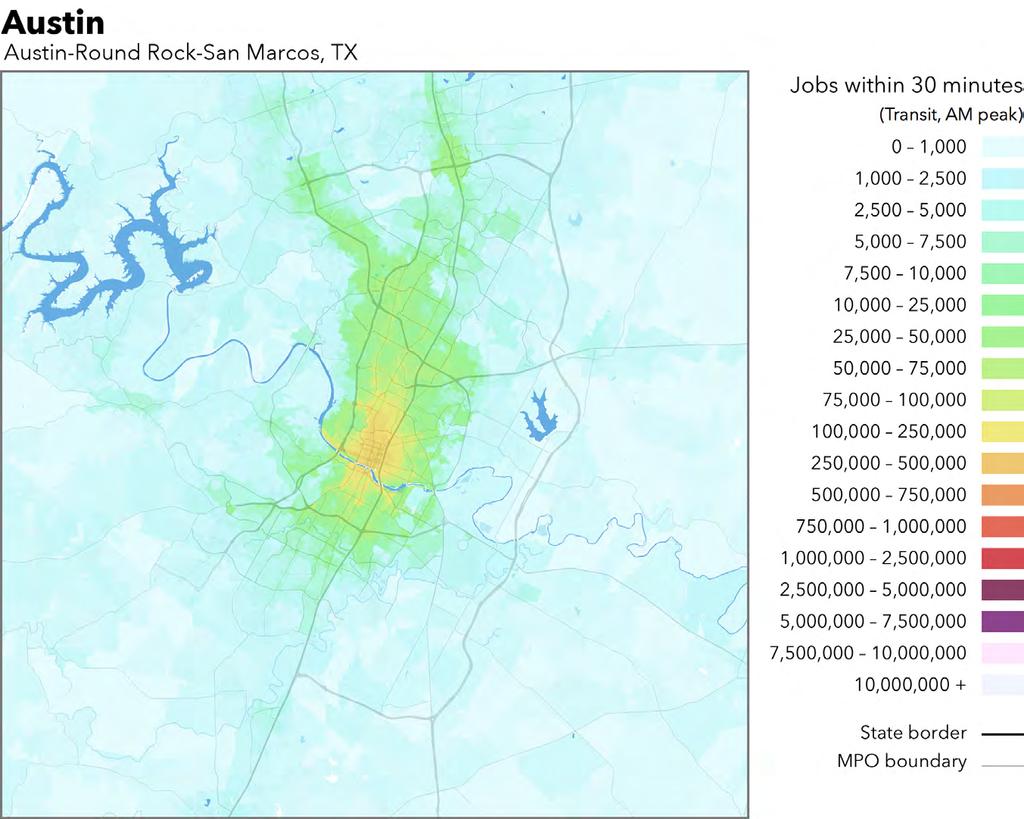
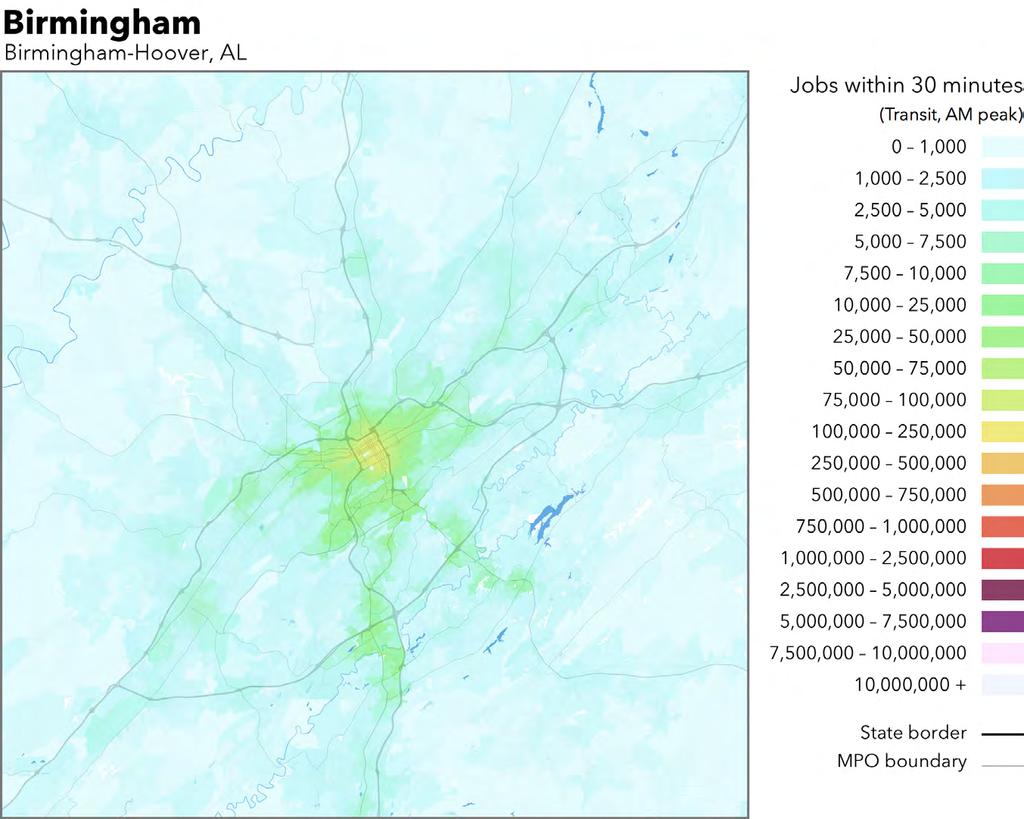
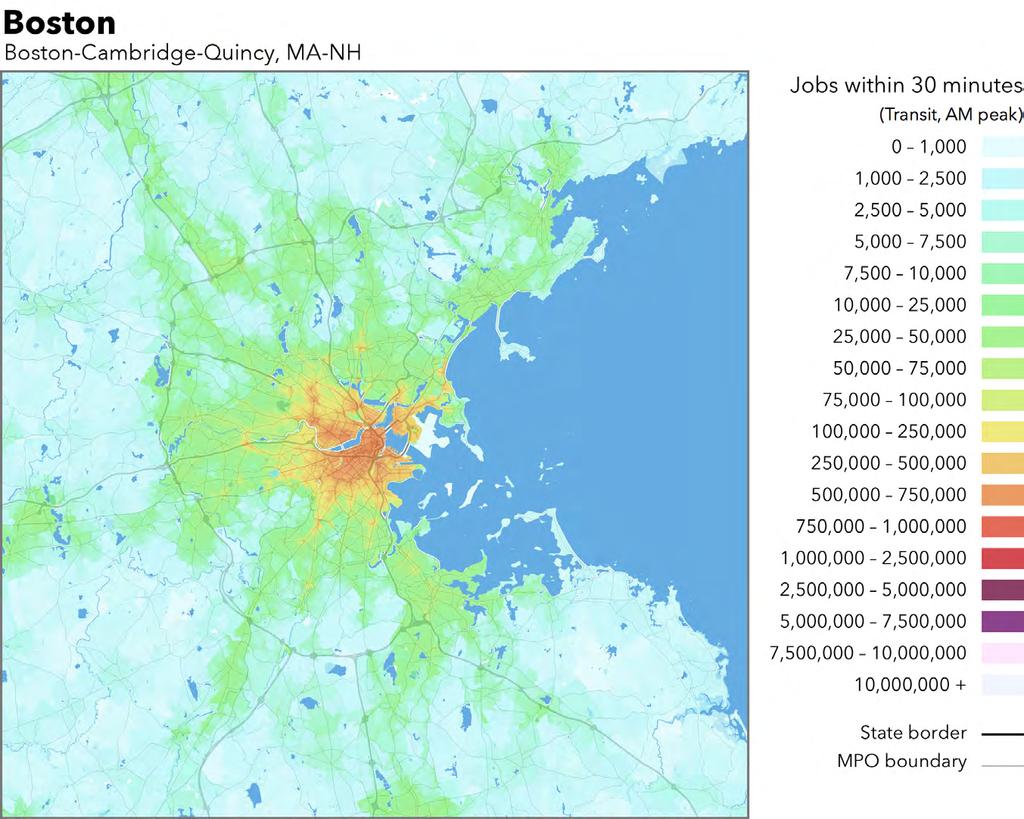
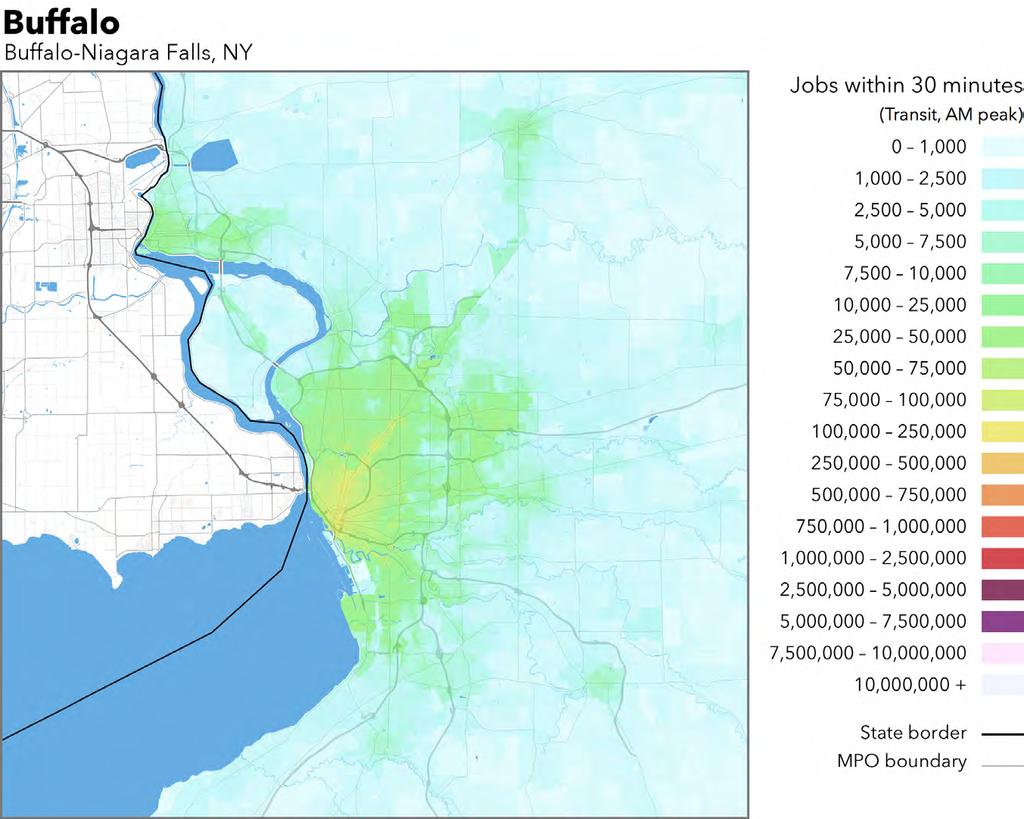
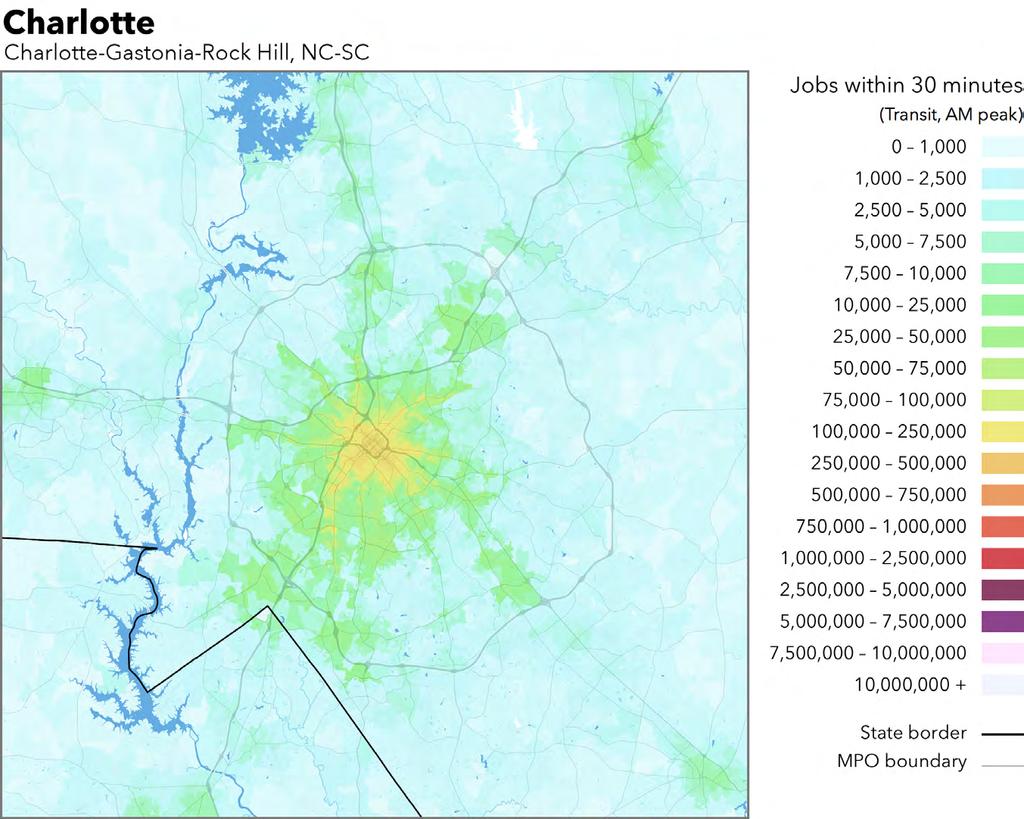
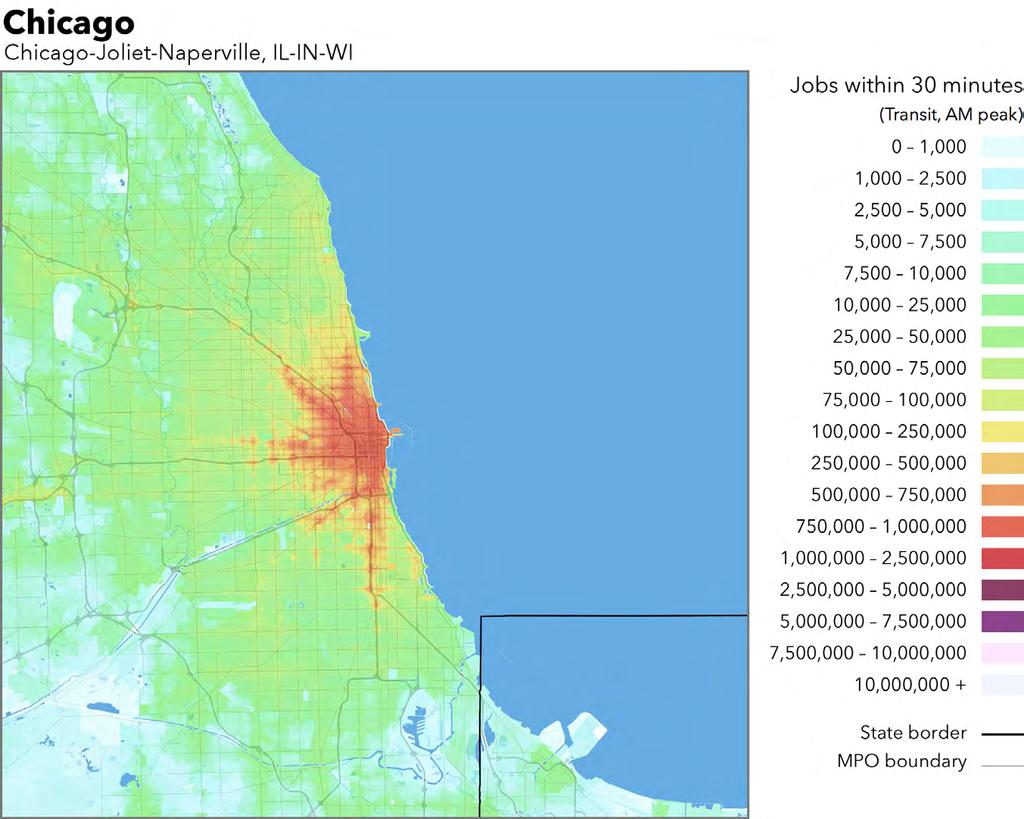
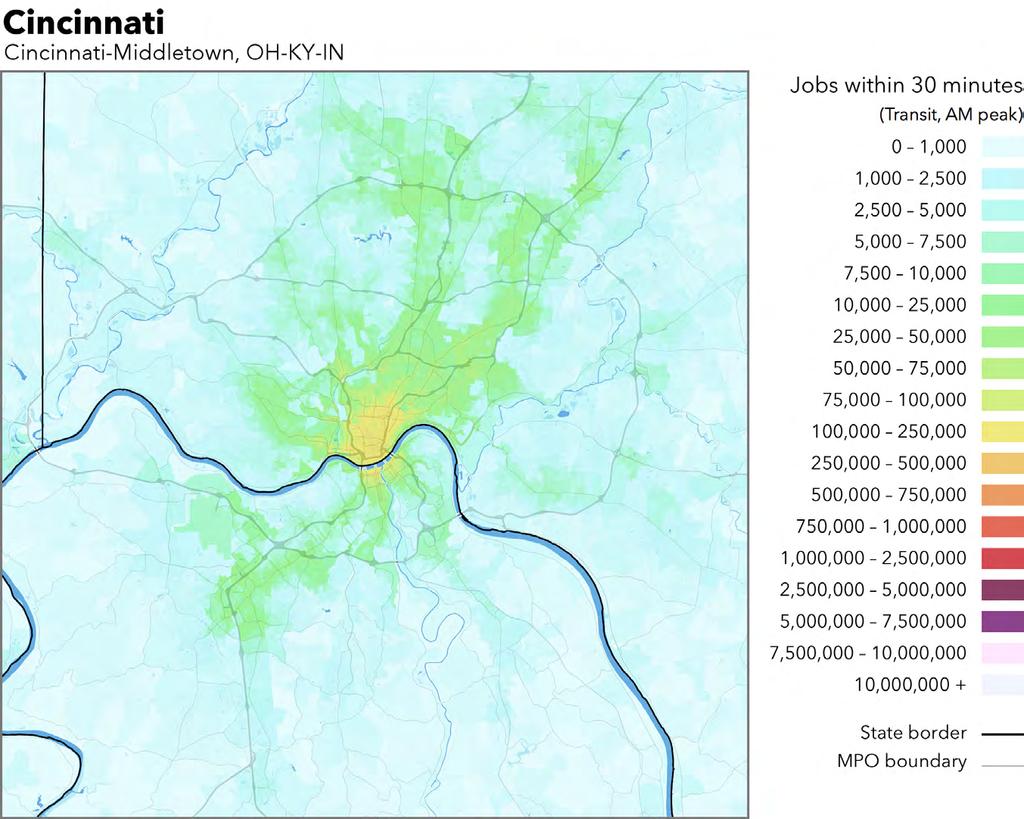
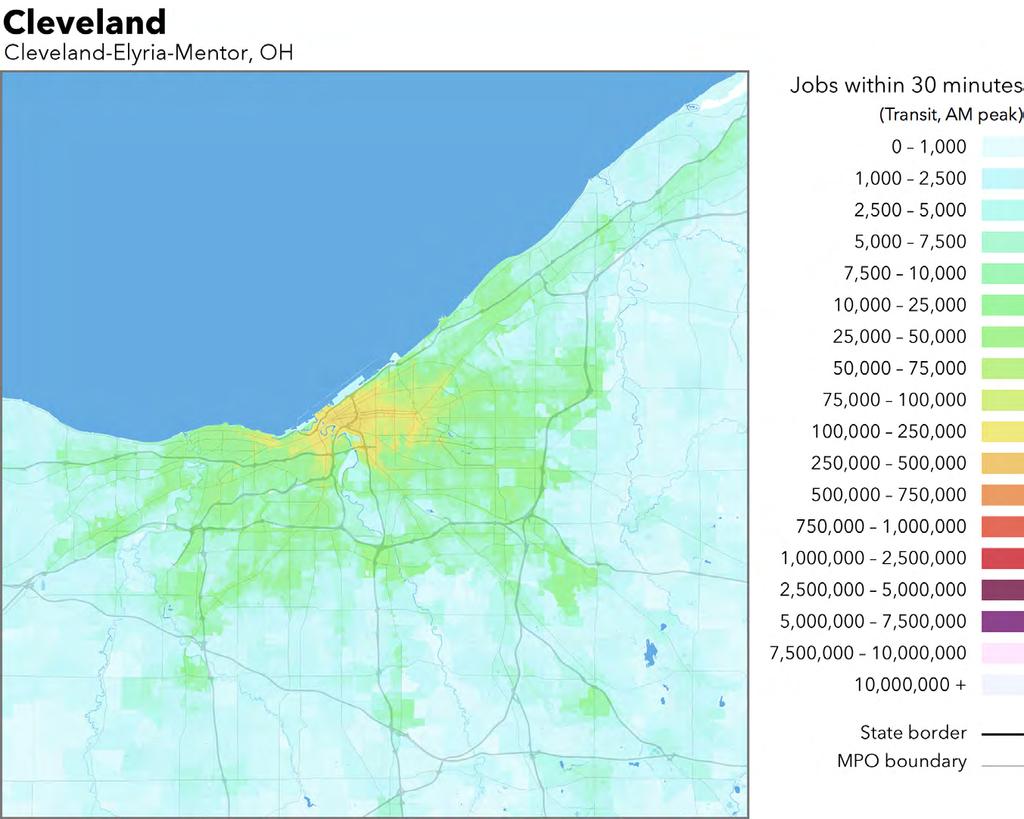
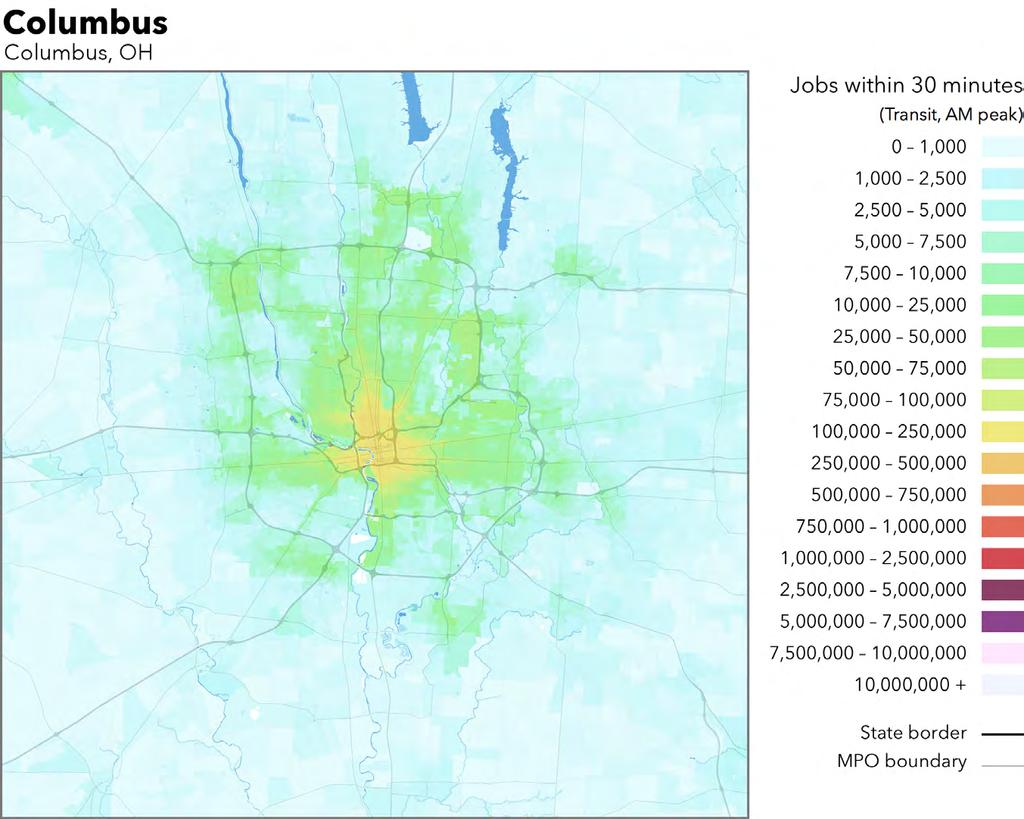
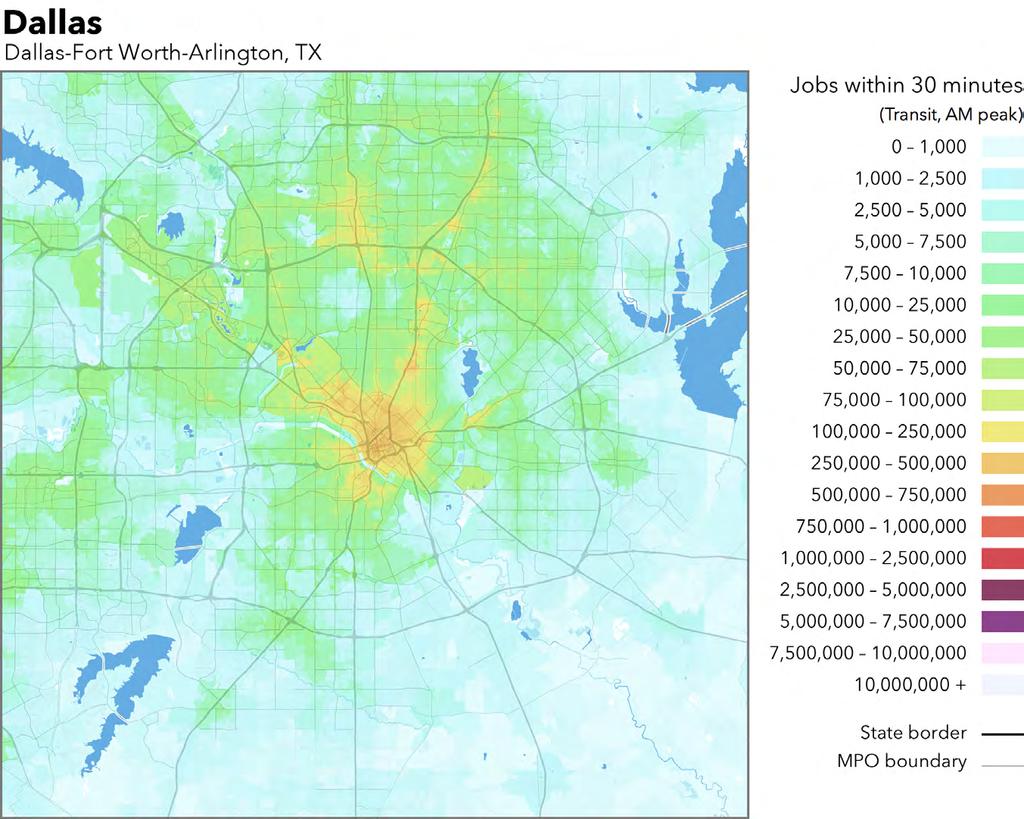
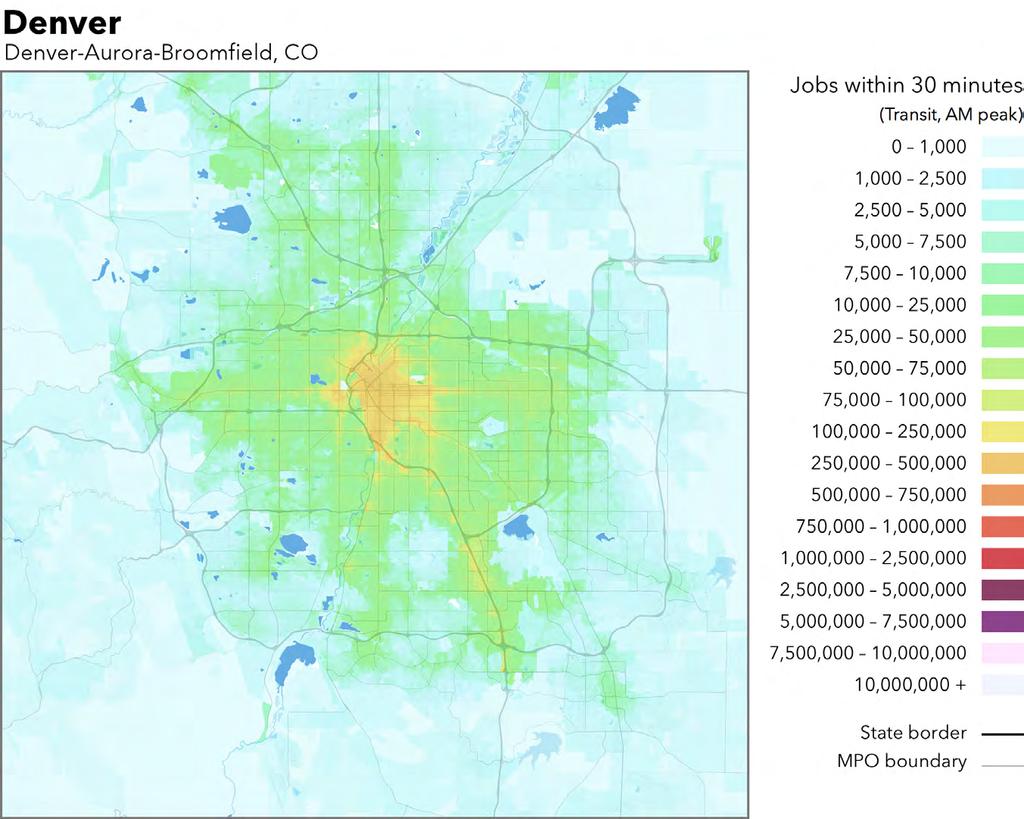
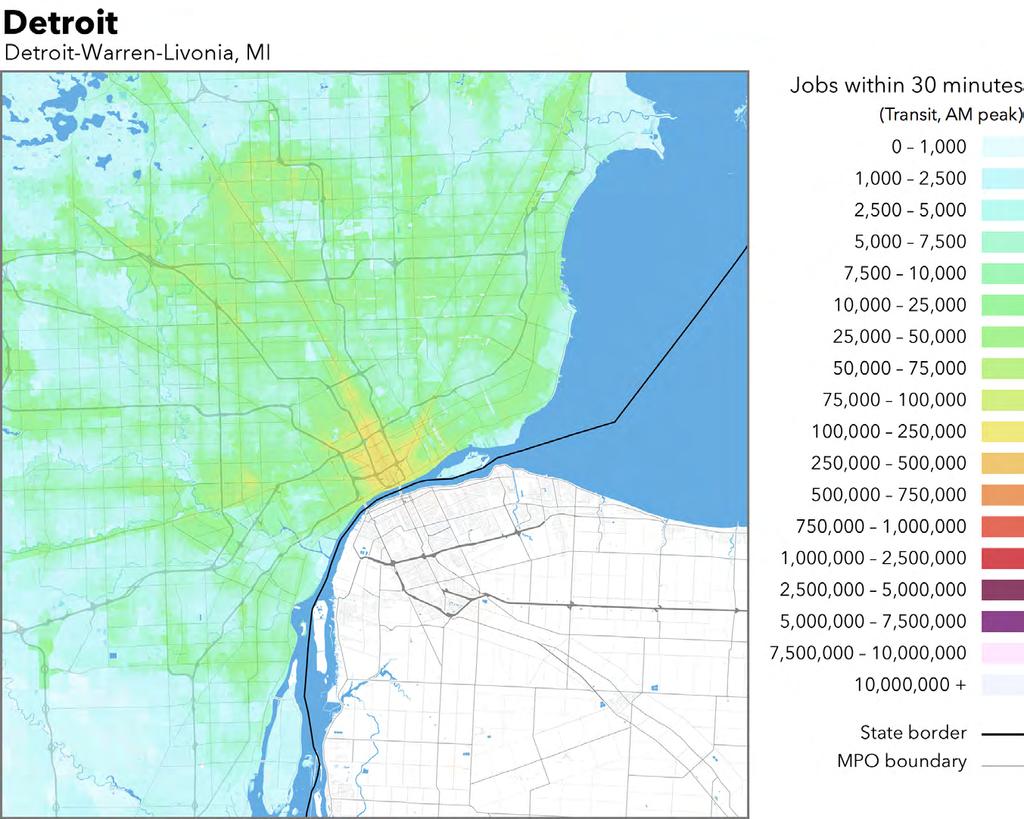
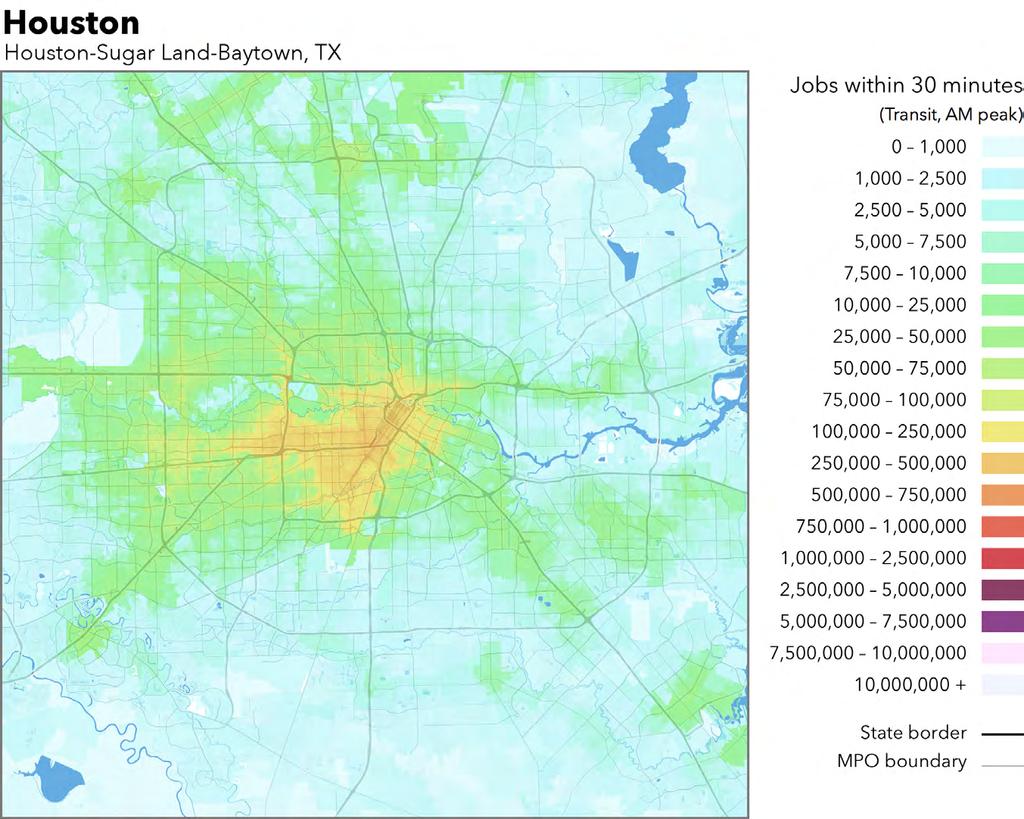
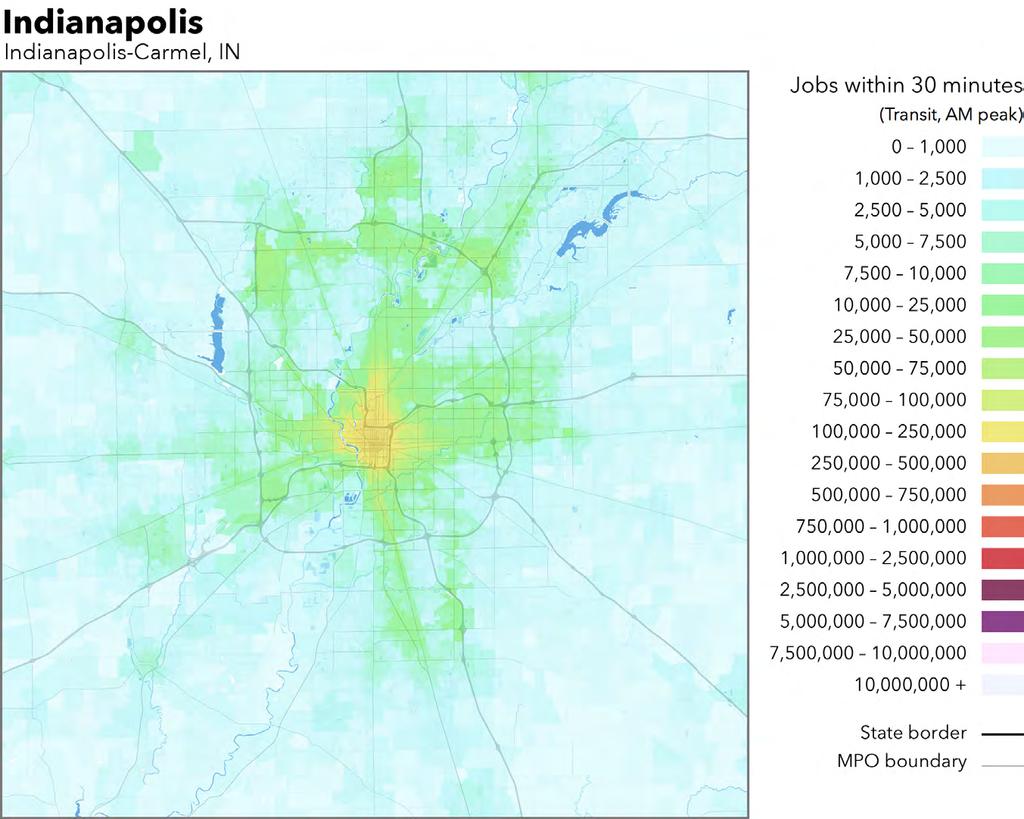
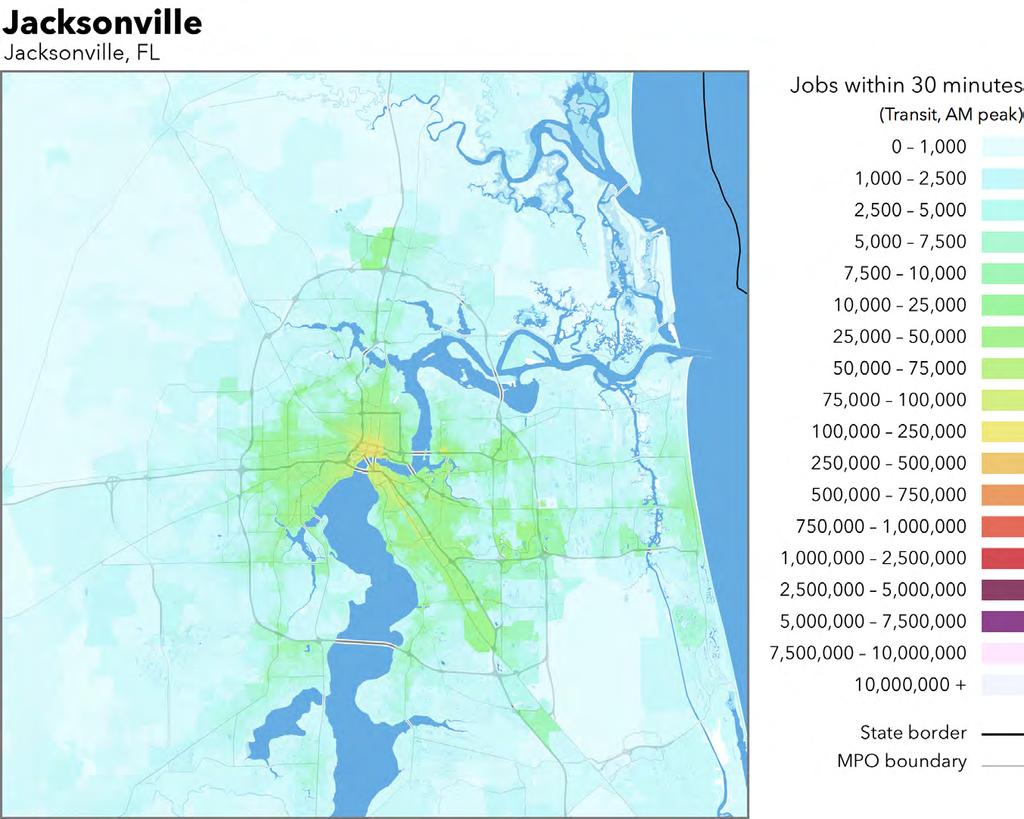
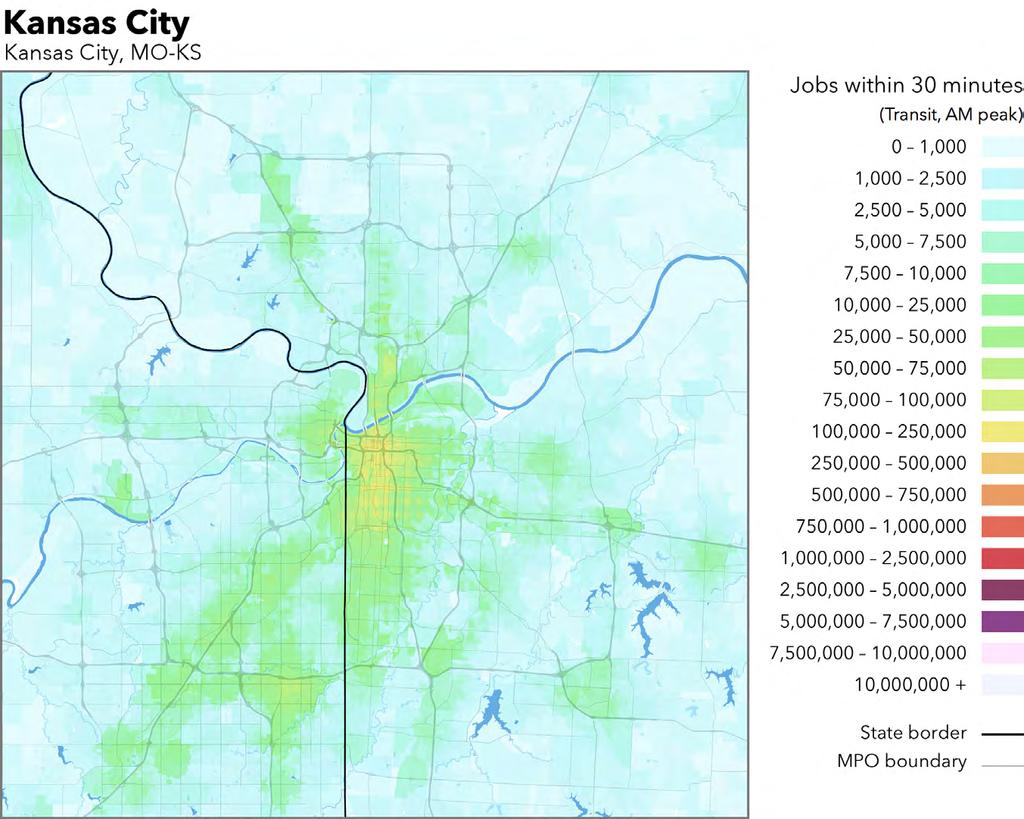
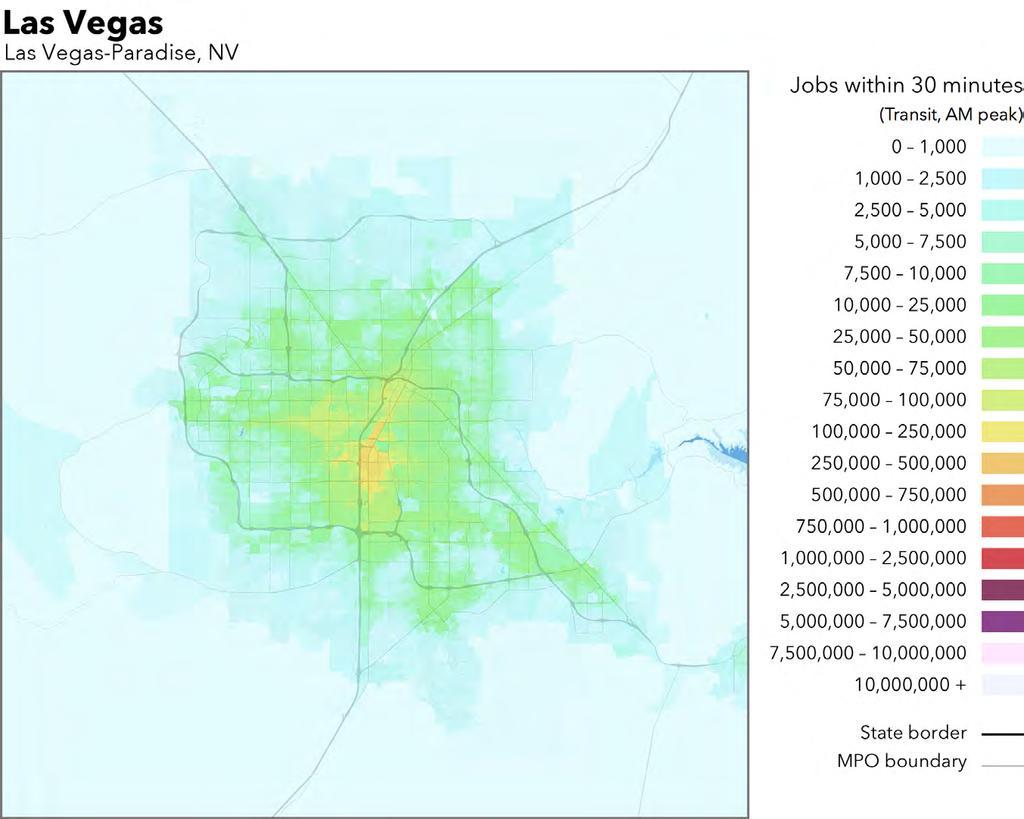
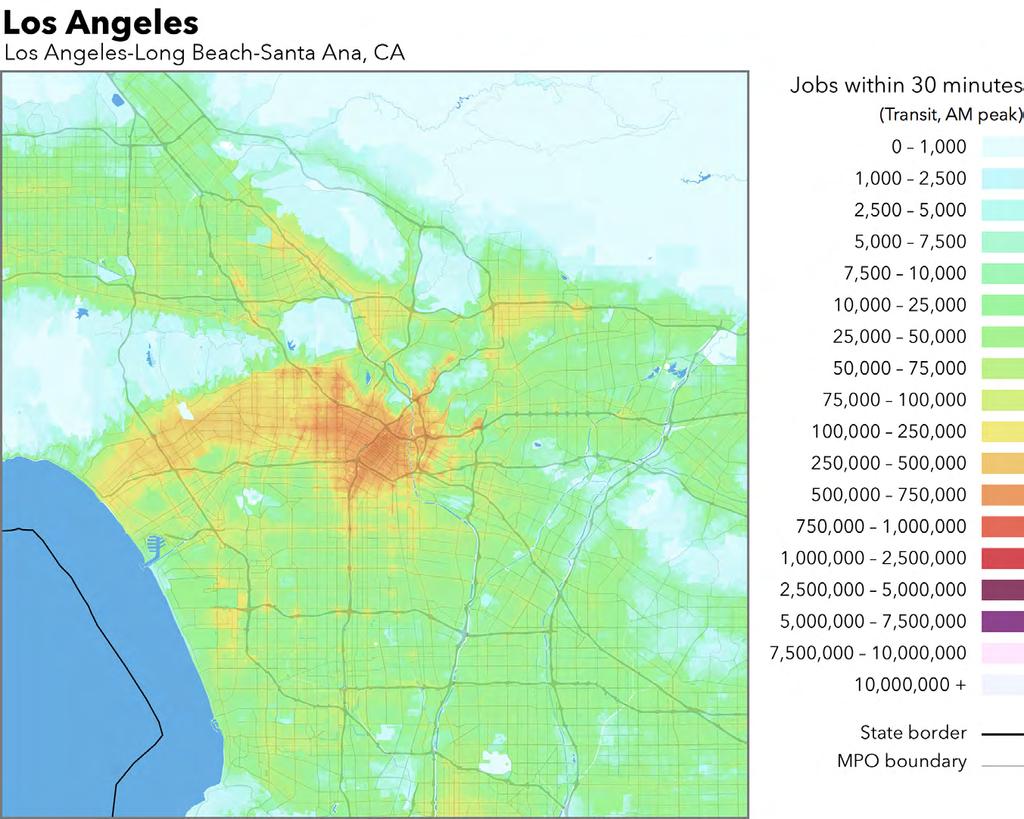
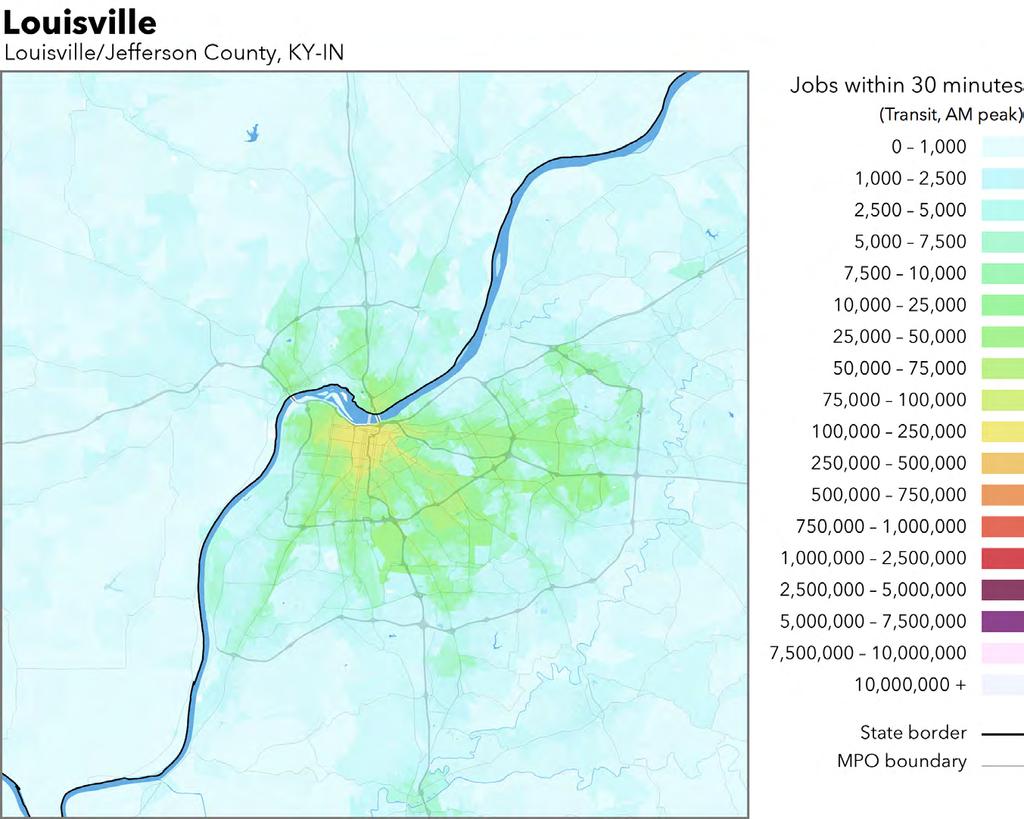
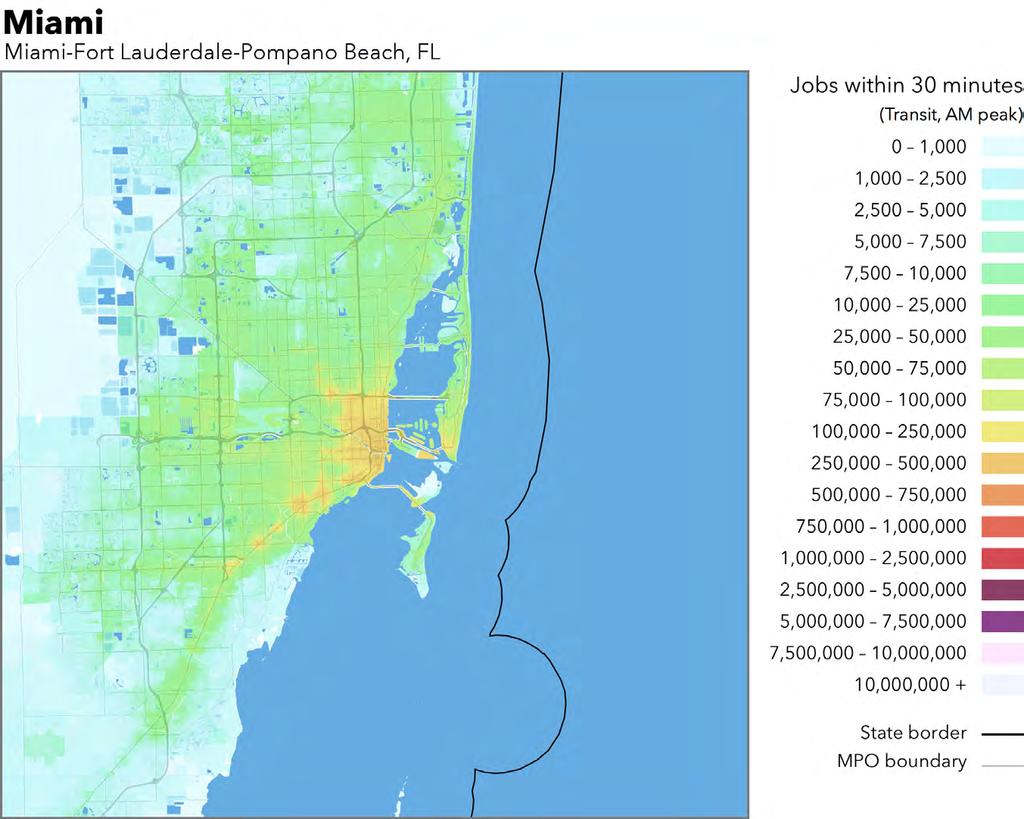
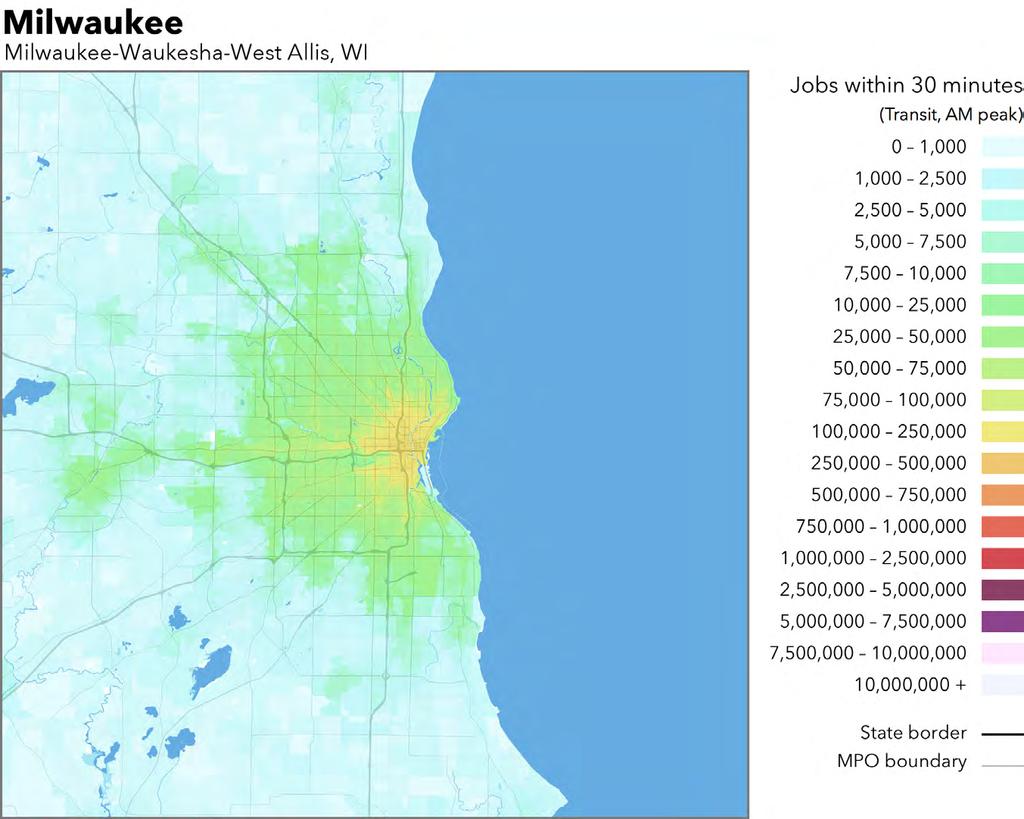
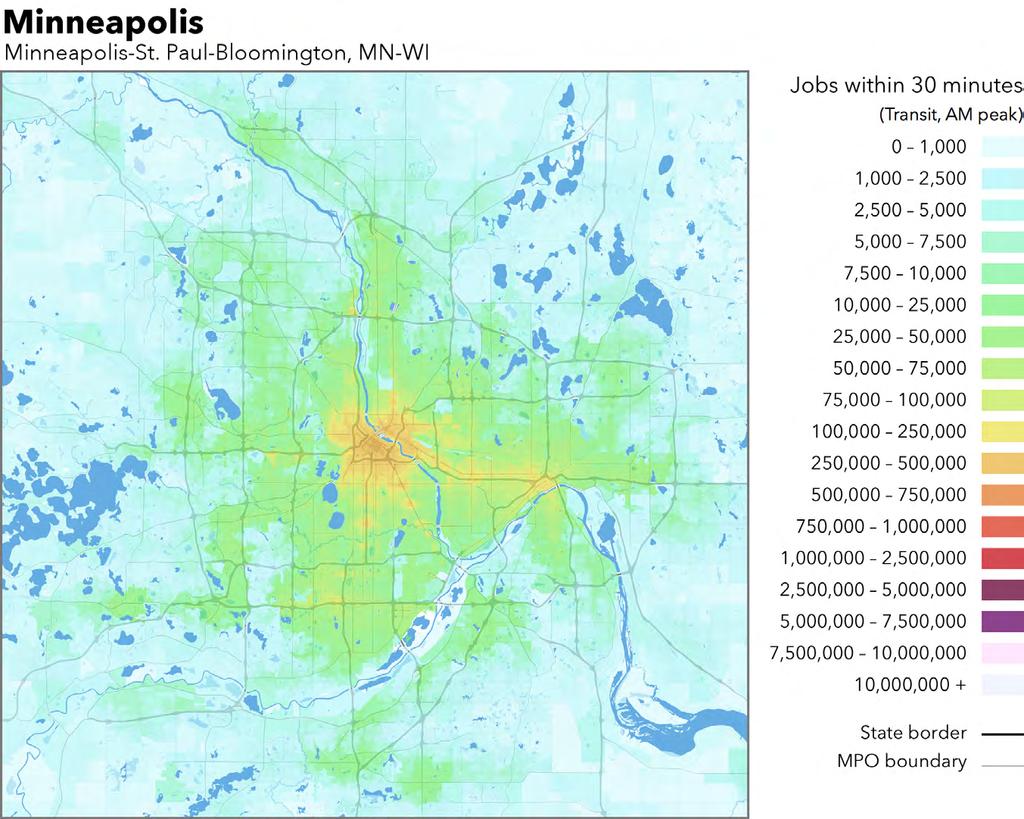
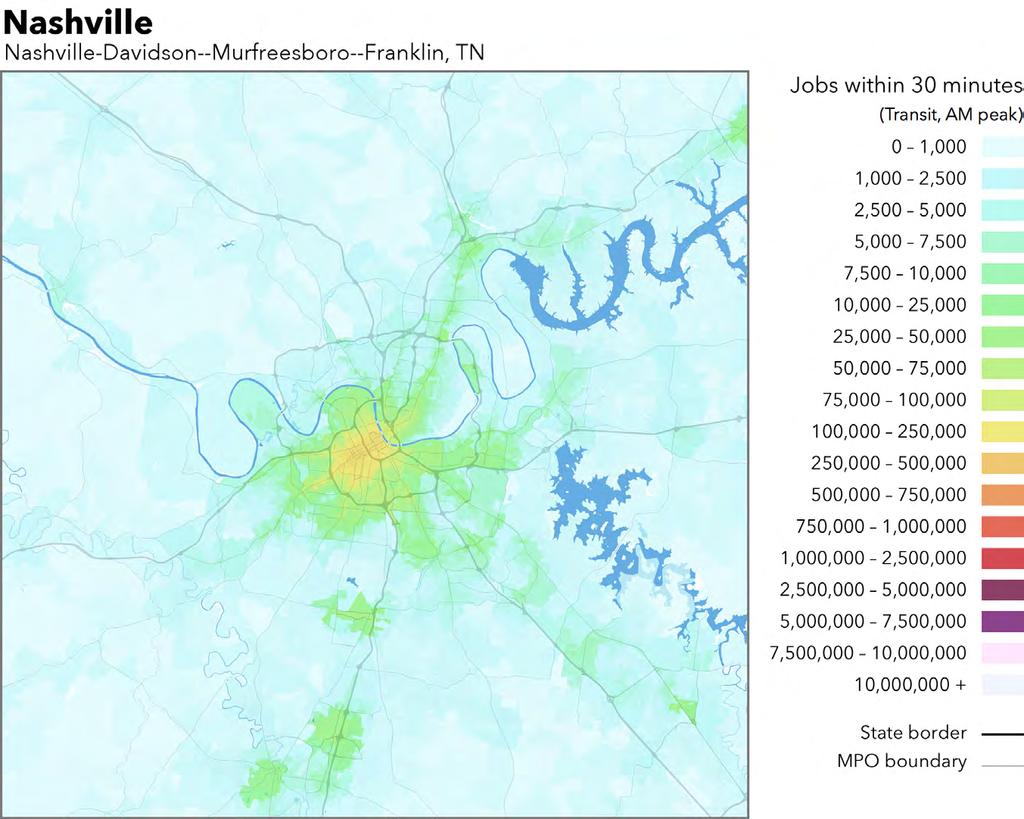
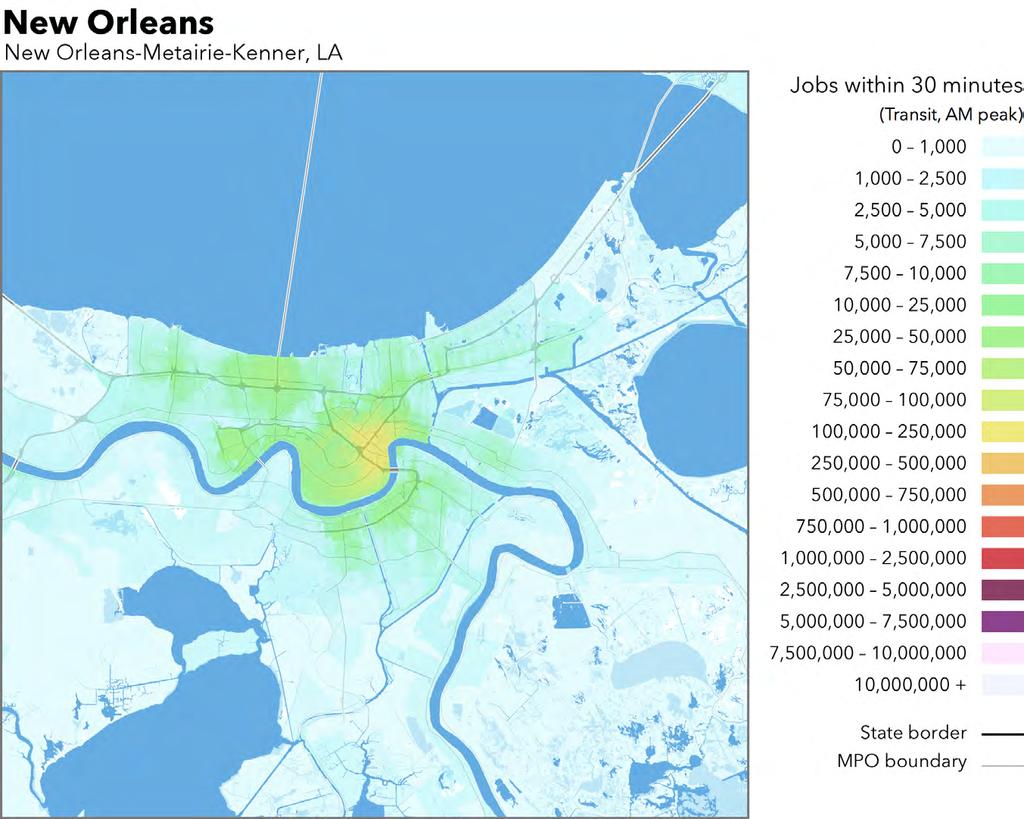
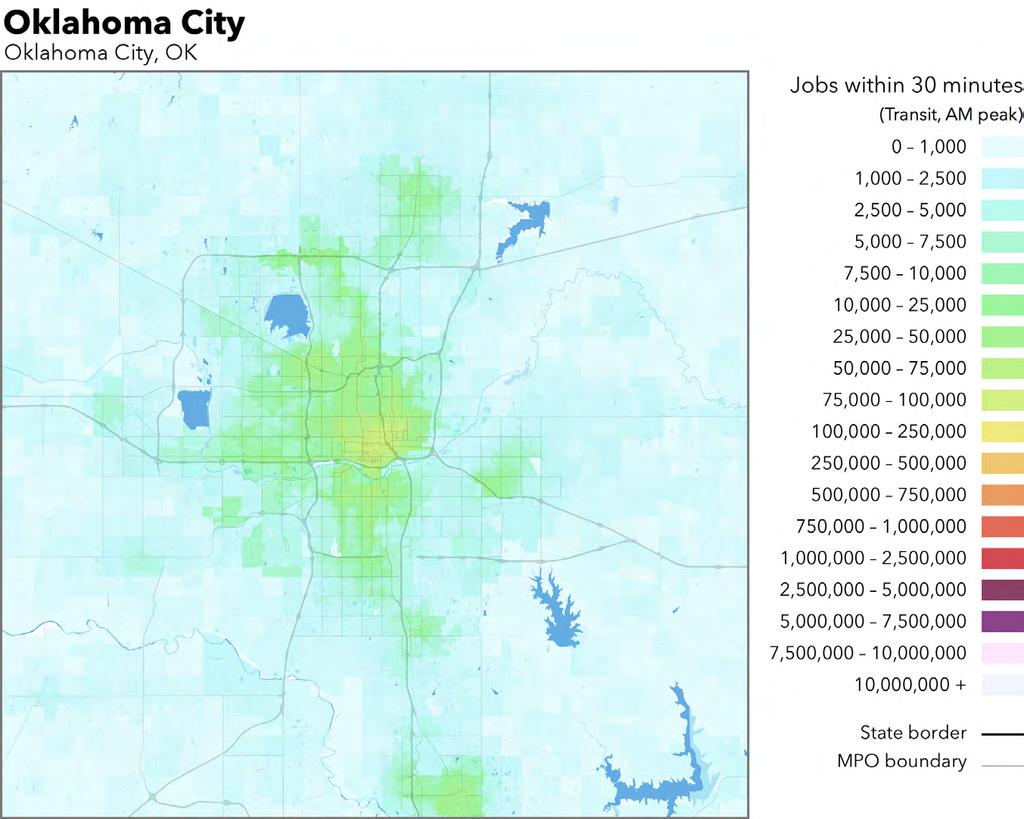
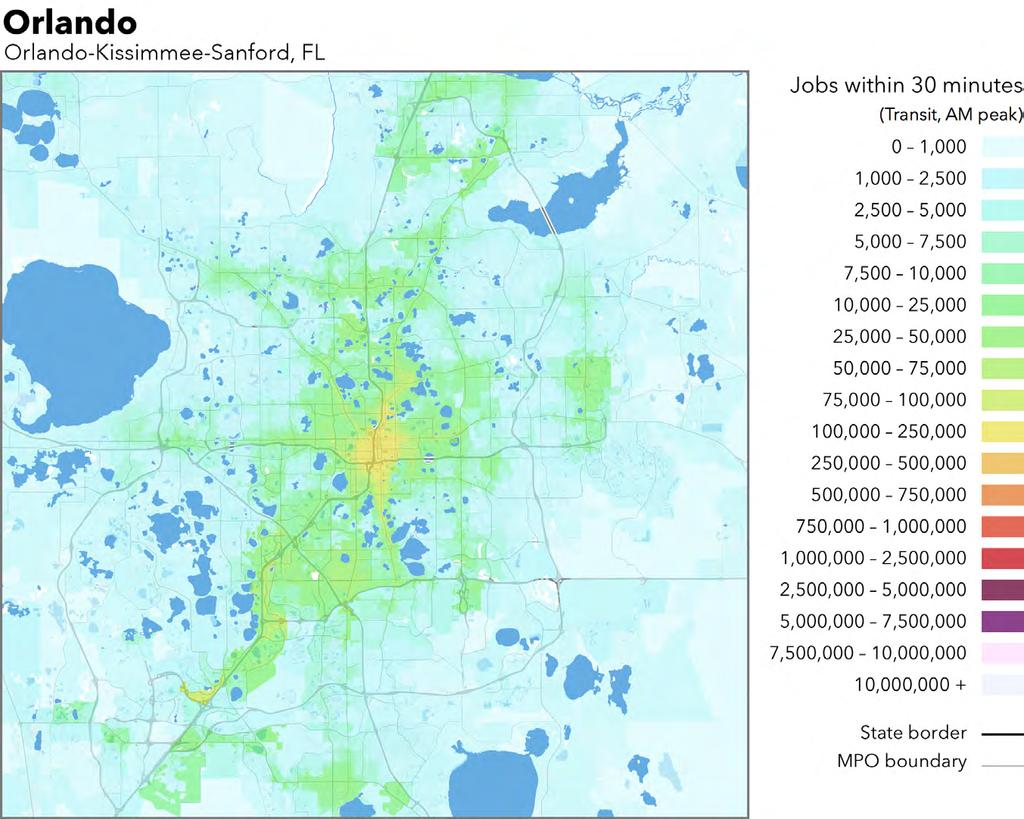
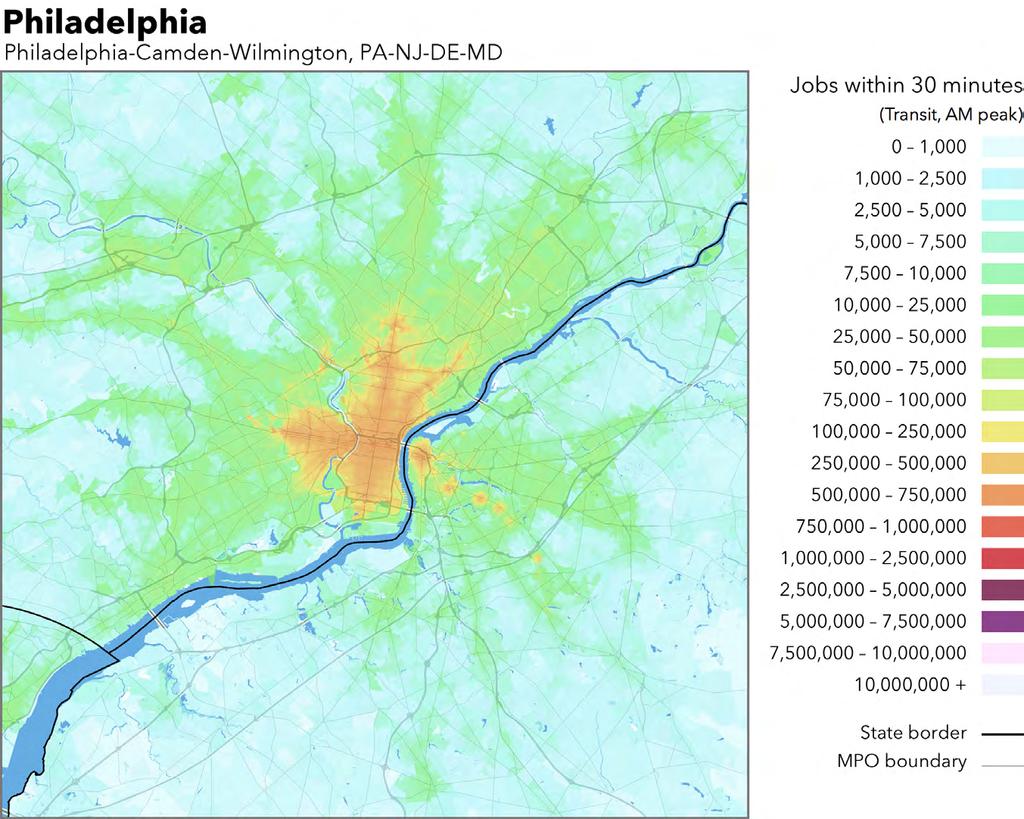
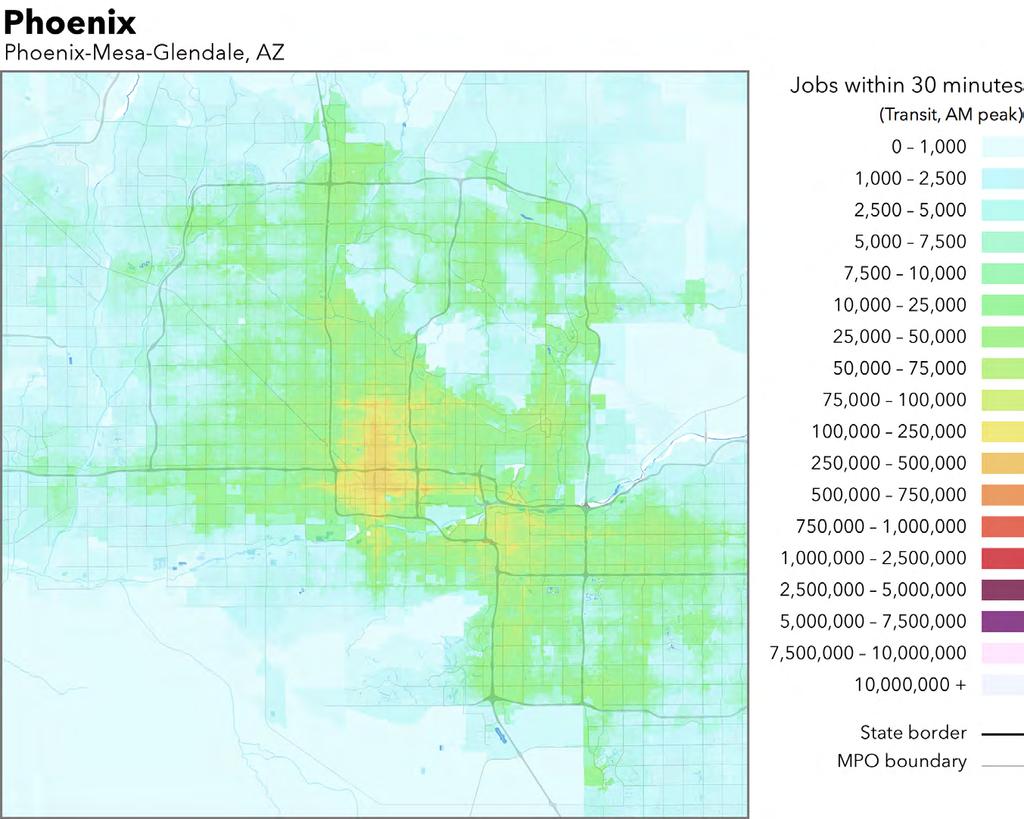
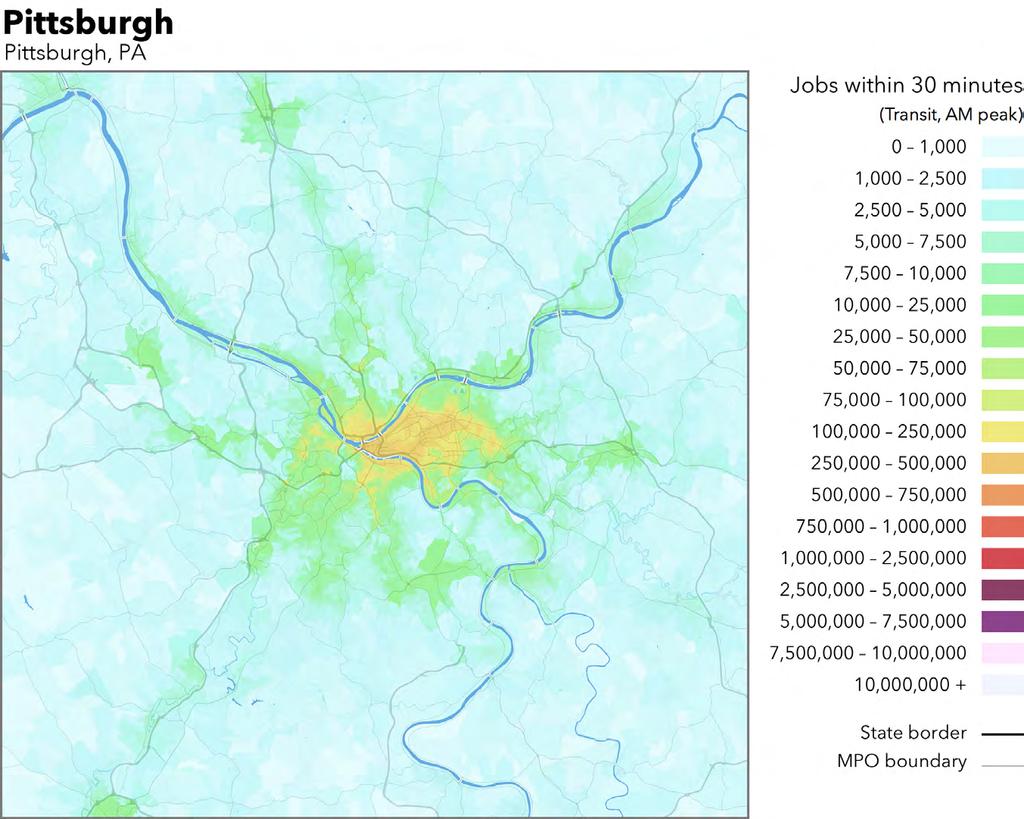
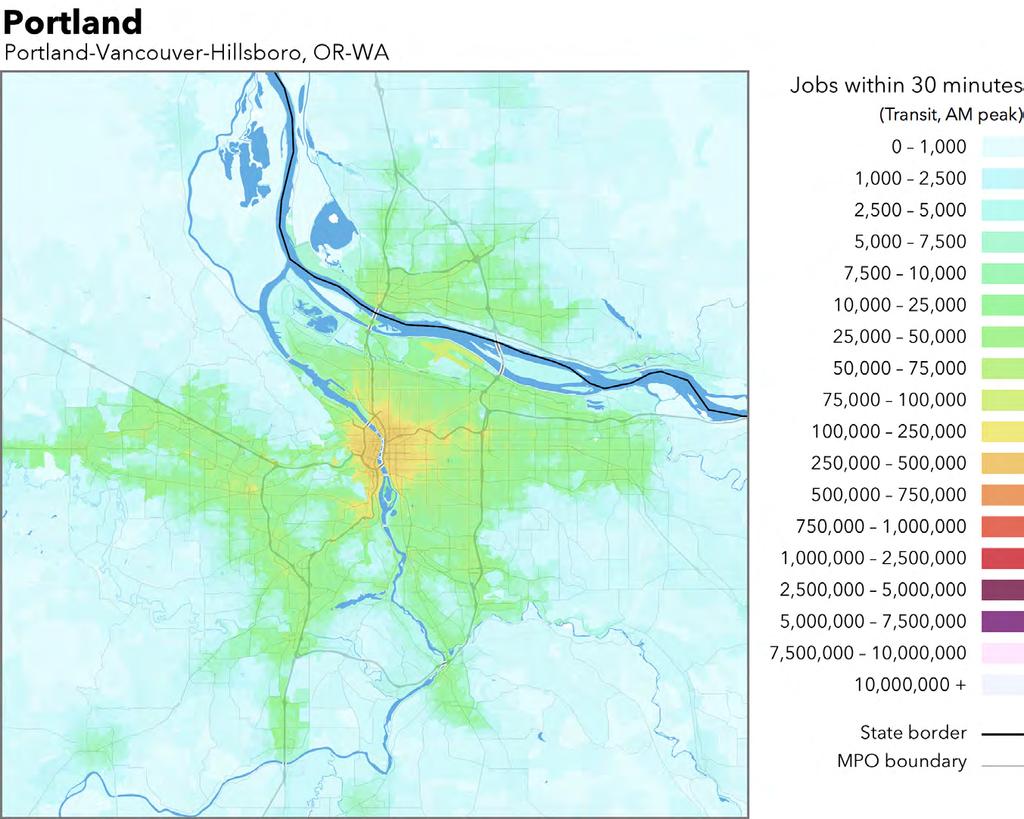
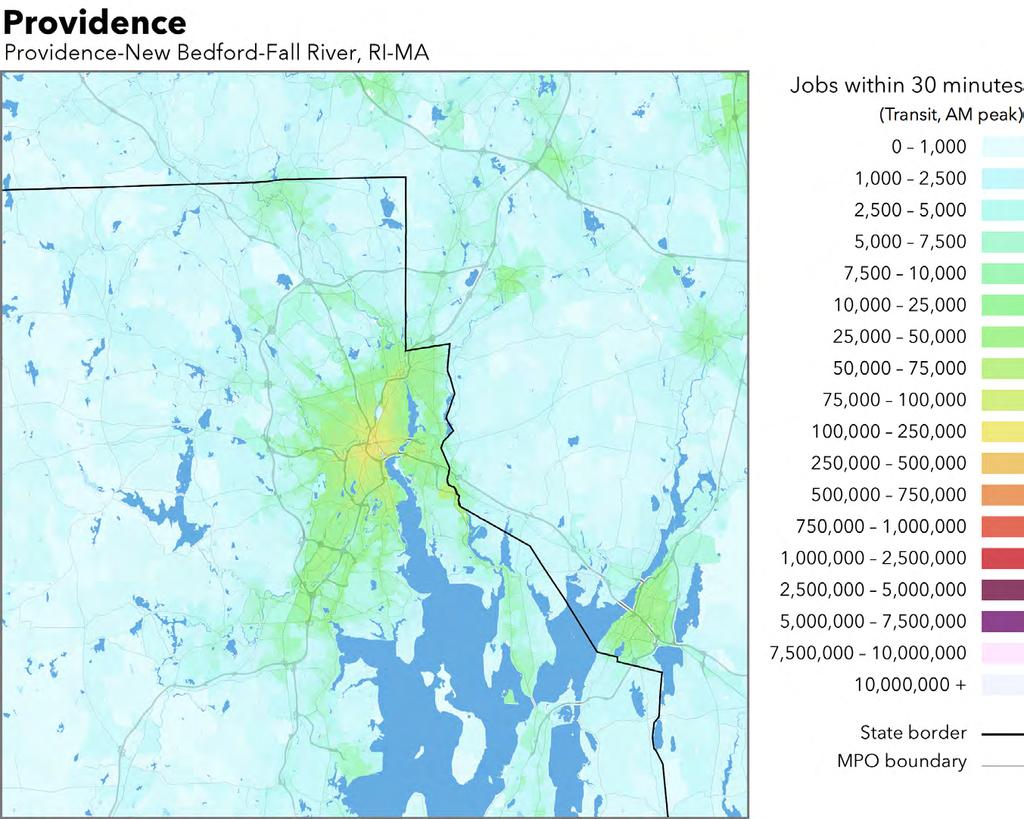
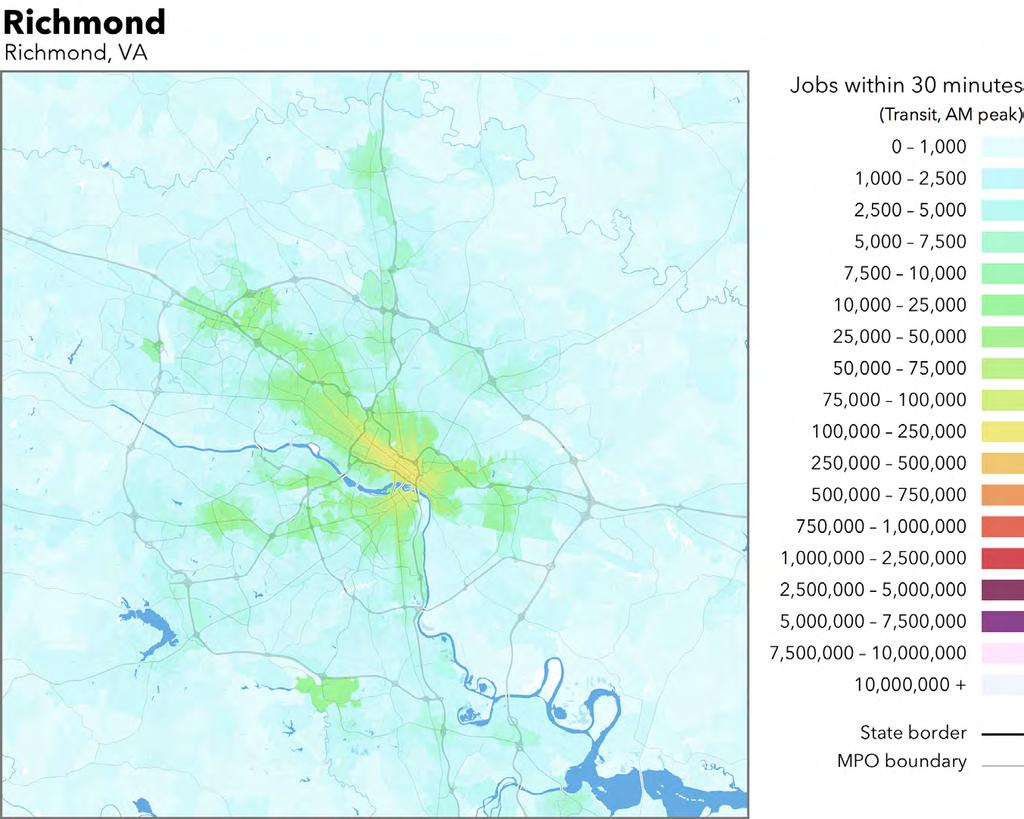
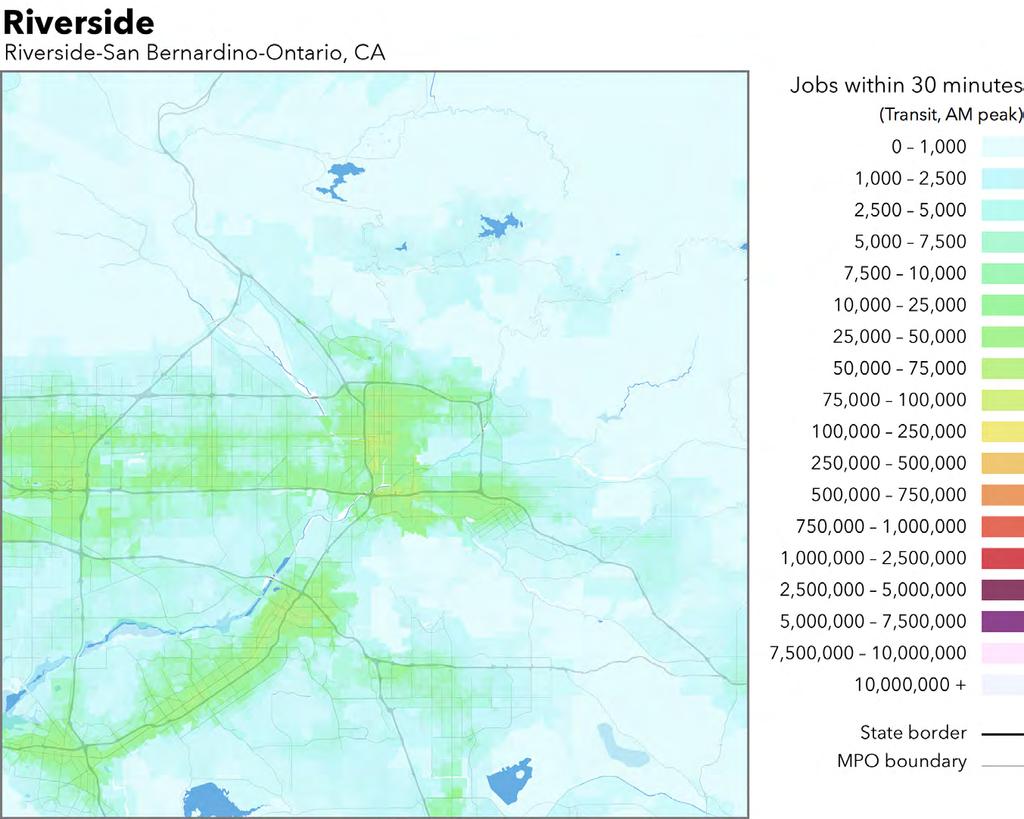
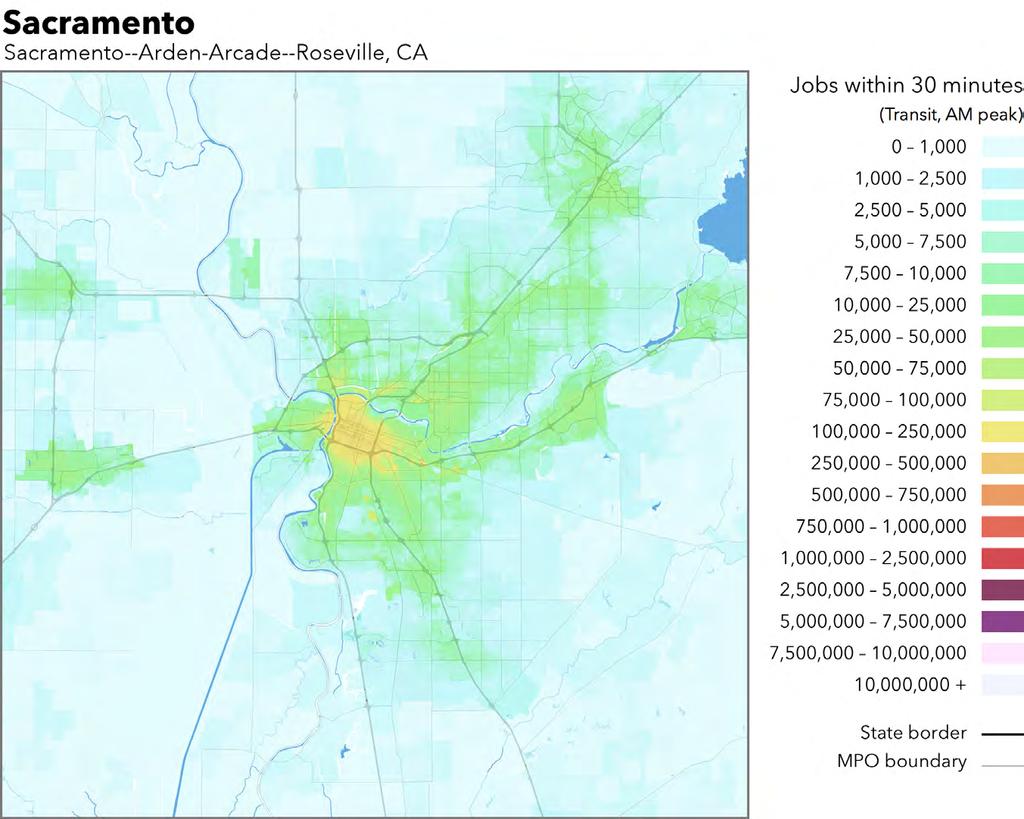
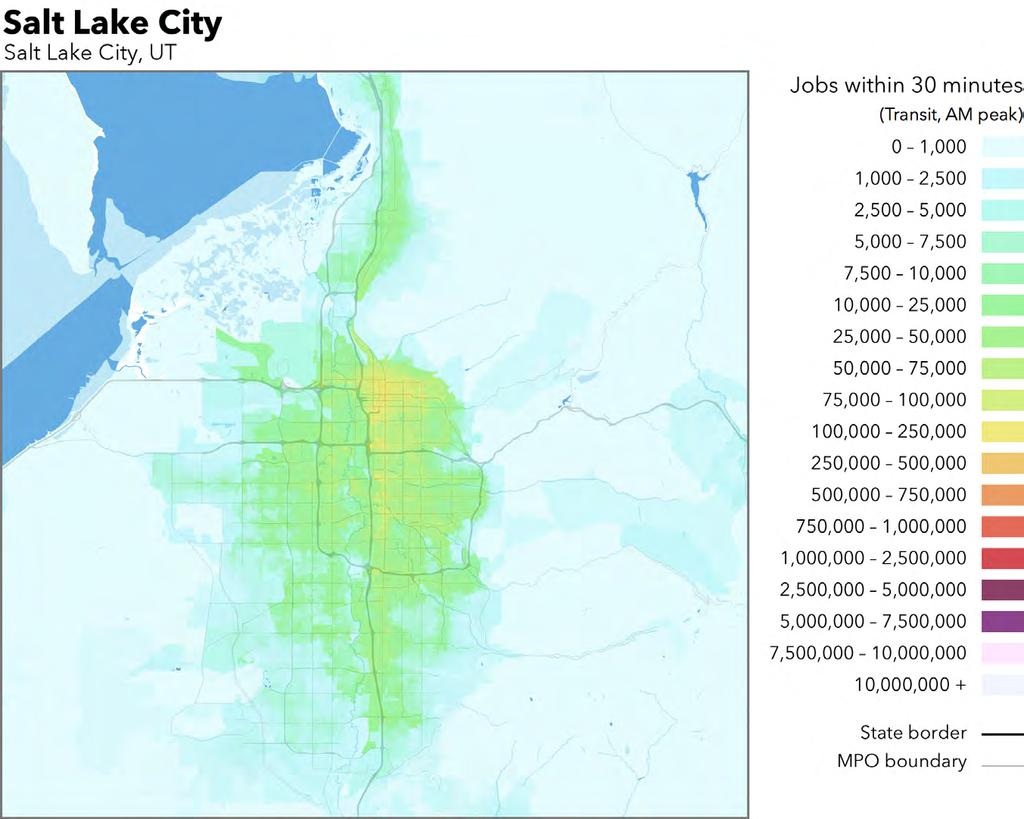
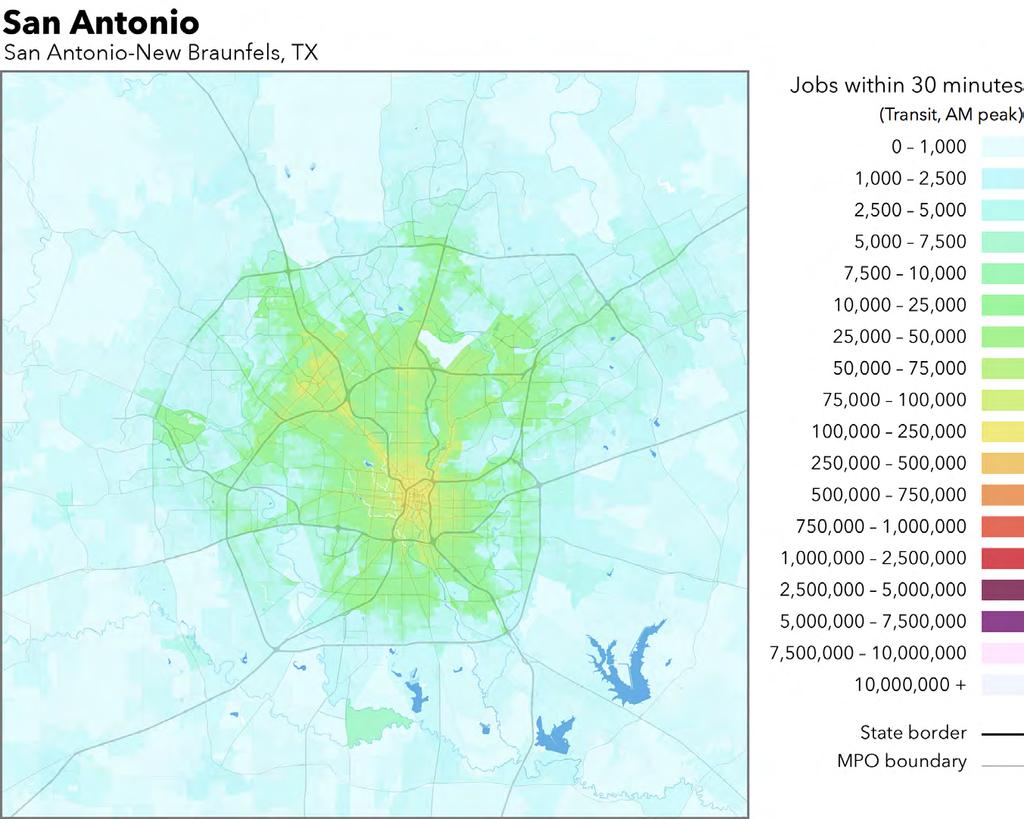
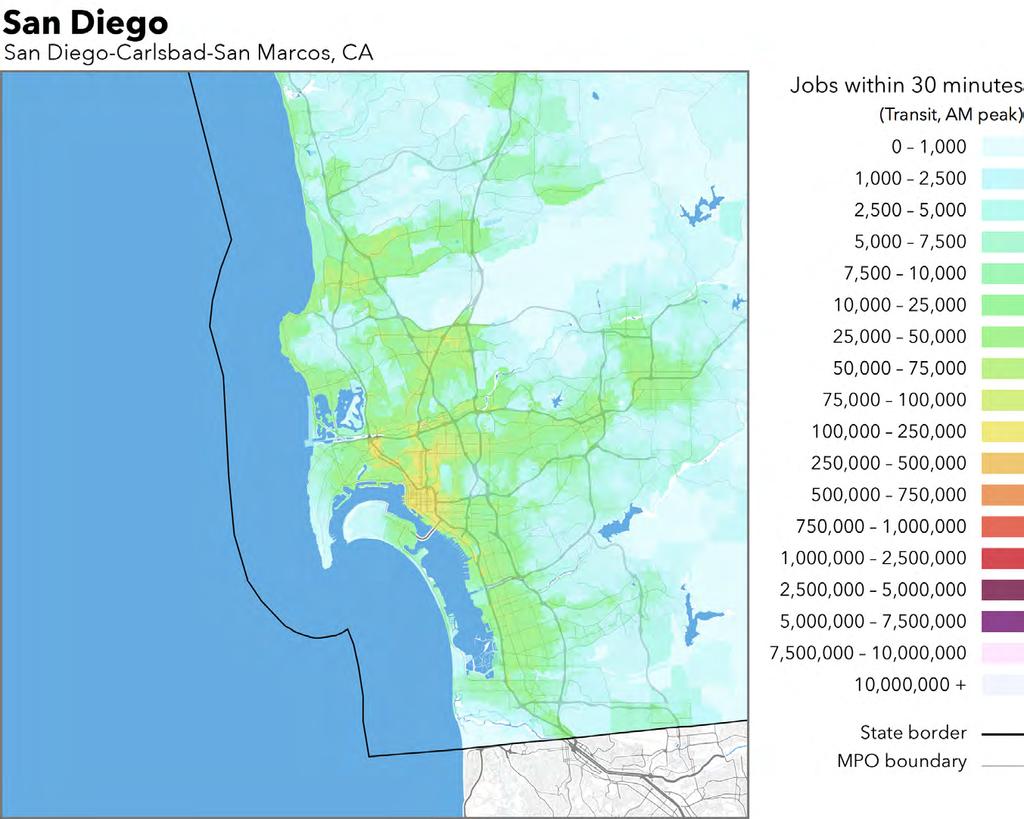
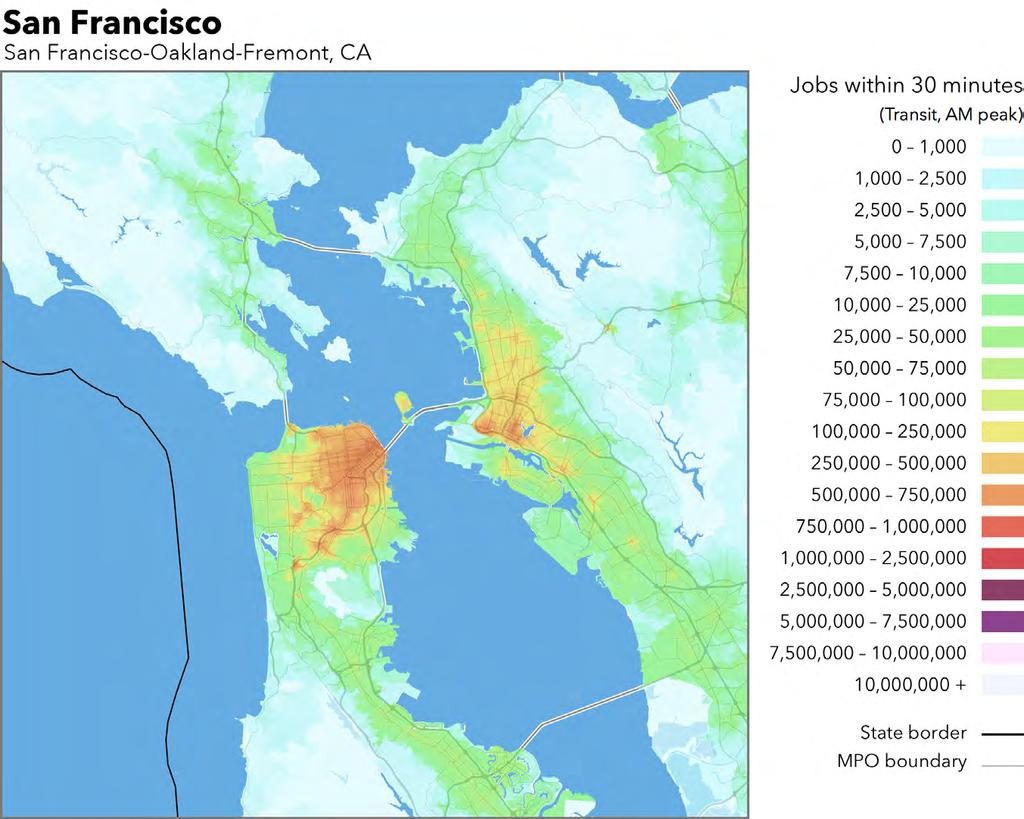
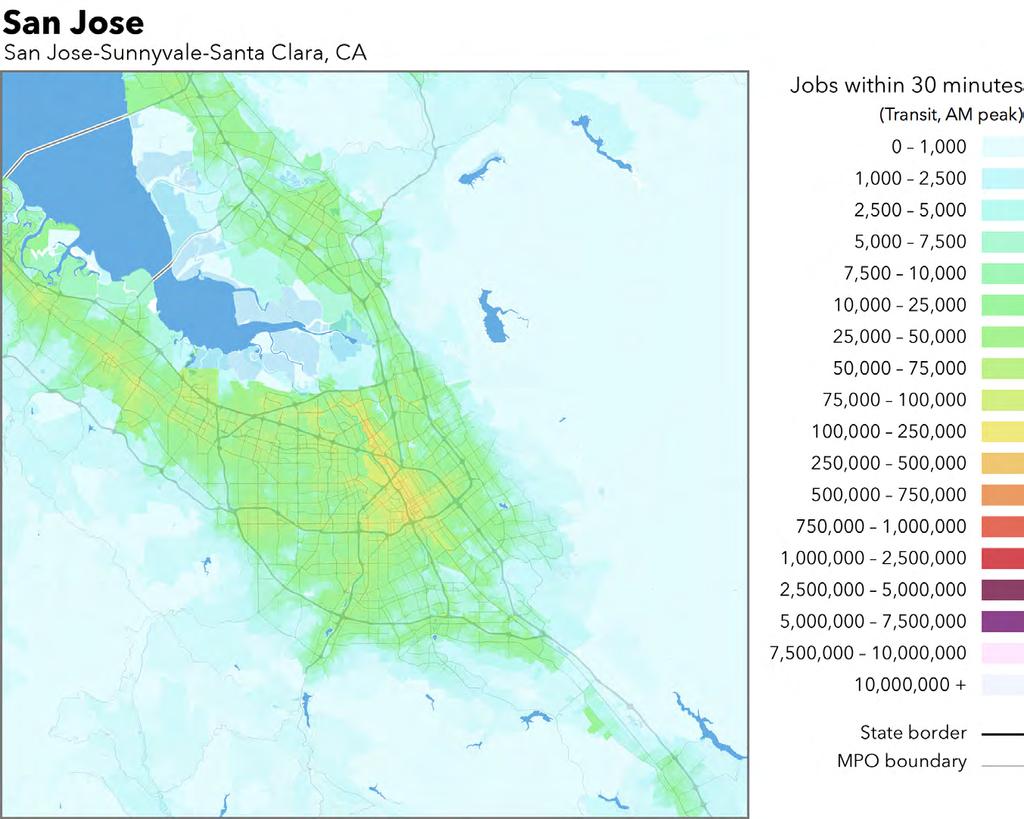
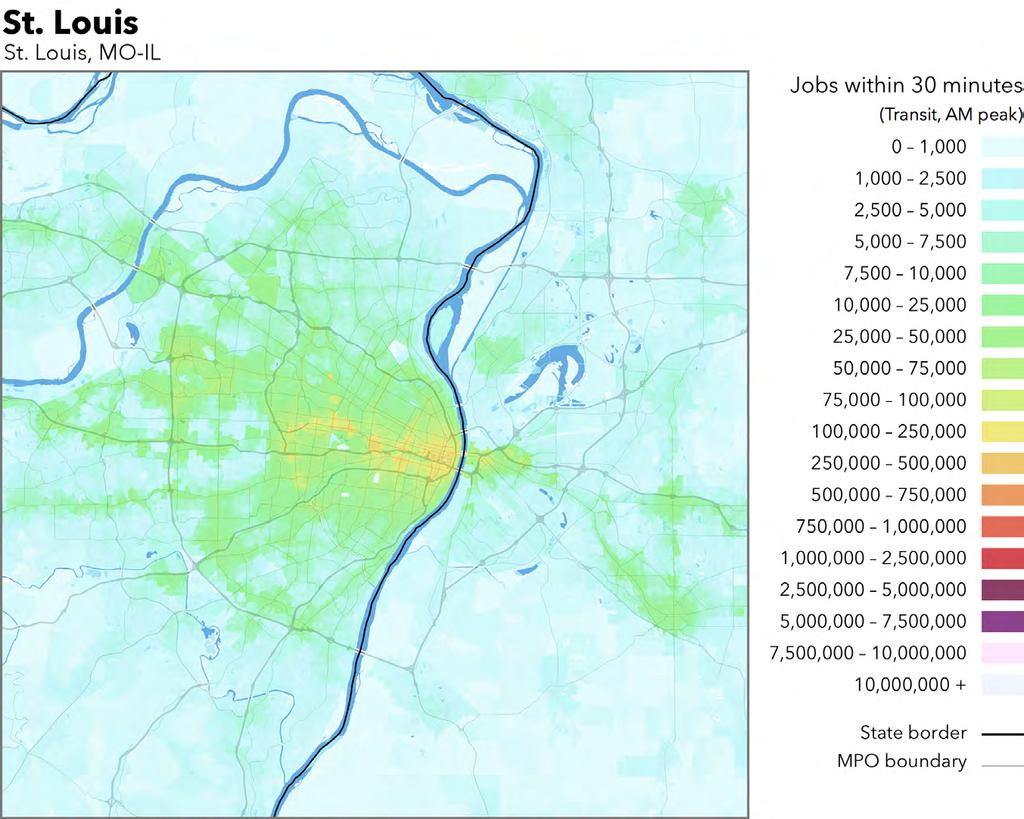
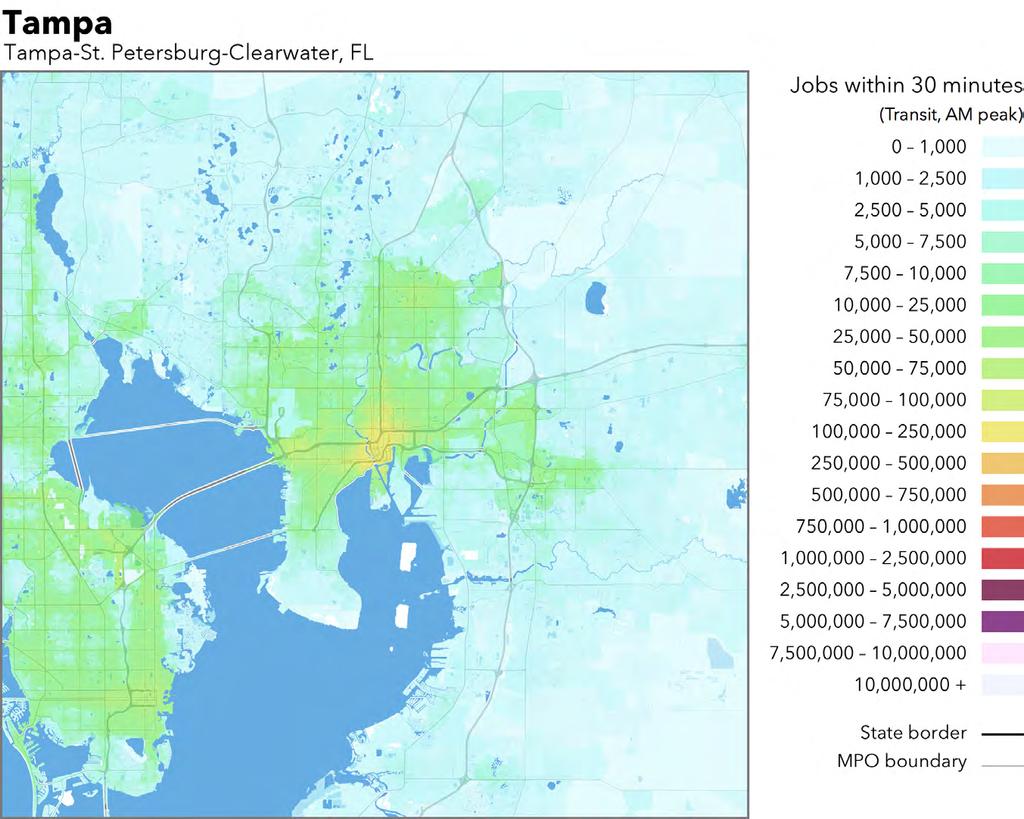
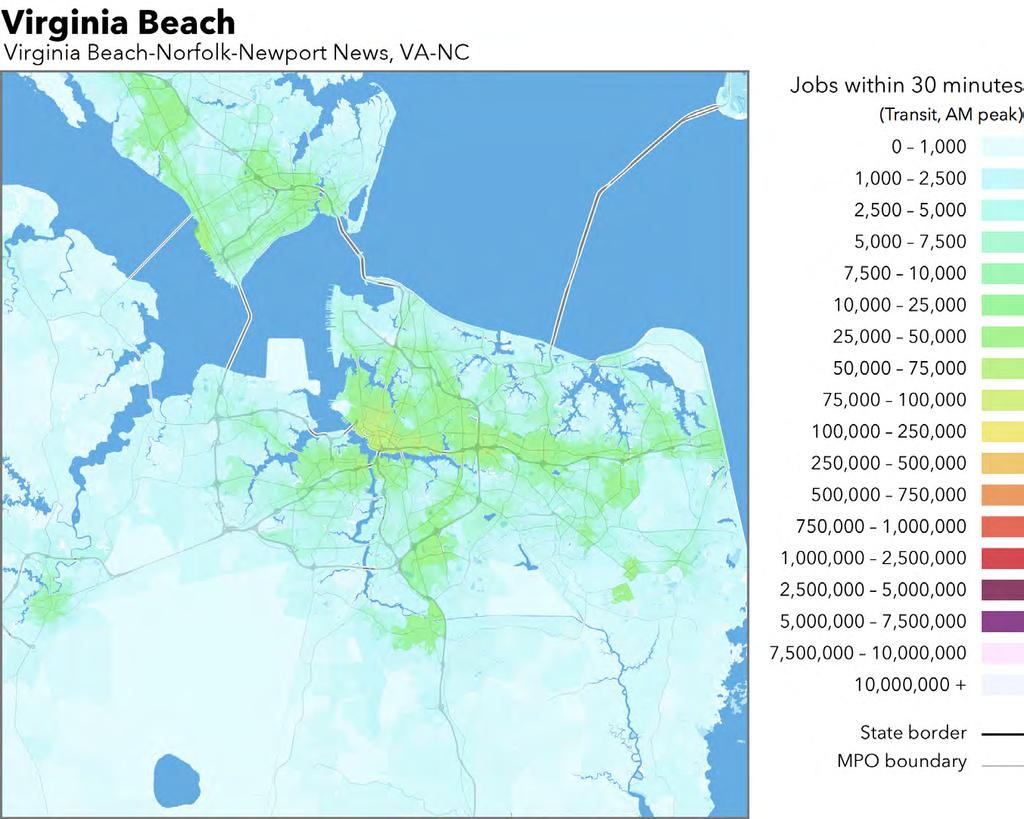
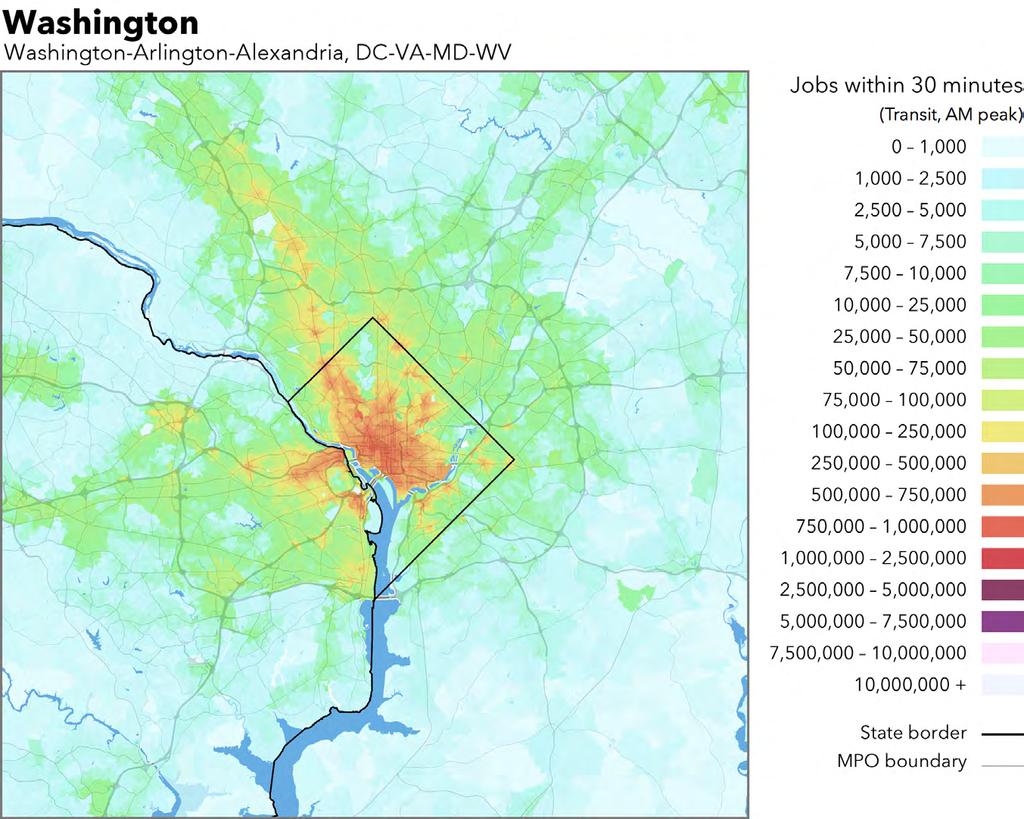
19 The following pages present summary accessibility data and maps for each of the 49 included metropolitan areas. Metropolitan areas are presented in alphabetical order. The maps show 30-minute accessibility values at the Census block level, averaged between 7:00 and 9:00 AM. On the data summary pages, three different chart scales are used to accommodate the wide range of accessibility values across metropolitan areas. All charts using the same scale are plotted in the same color. 12
20 400, , , , ,985 7,203 18,811 38,728 68,045 20,000 10, ,012 +4,089 13
21 14
22 15
23 400, , , , ,786 10,390 25,338 47,363 75,635 20,000 10,
24 17
25 18
26 400, , , , ,103 17,601 40,183 73, ,047 20,000 10, ,197 +2,077 19
27 20

28 21
29 400, , , , ,678 6,032 11,074 17,544 20,000 10,
30 23
31 24
32 400, , , , , ,000 1,509 12,176 43, ,492 20,000 10, ,814-1,
33 26
34 27
35 400, , , , ,302 11,026 25,402 46,308 71,149 20,000 10, ,073 +1,983 +3,311 28
36 29
37 30
38 400, , , , ,051 6,828 16,690 31,949 51,301 20,000 10, ,698 +3,201 +4,809 31
39 32
40 33
41 400, , , , , , ,000 1,642 14,713 51,781 20,000 10, ,188 +3,335 +5,832 +8,009 34
42 35
43 36
44 400, , , , ,999 6,503 15,288 29,026 46,669 20,000 10, ,767 +3,094 +4,096 37
45 38
46 39
47 400, , , , ,386 8,502 22,093 44,111 73,471 20,000 10, ,138 40
48 41
49 42
50 400, , , , ,866 9,876 22,935 42,626 68,638 20,000 10, ,299 +4,371 43
51 44
52 45
53 400, , , , ,936 10,088 25,639 53,541 95,790 20,000 10,
54 47
55 48
56 400, , , , , ,711 19,405 47,526 96,589 20,000 10,000 +5,261 +9, ,250 49
57 50
58 51
59 400, , , , ,799 6,139 15,754 33,797 62,368 20,000 10, ,728 +4,286 52
60 53
61 54
62 400, , , , ,169 10,551 22,593 39,717 61,570 20,000 10, ,353 +3,365 +6,208 55
63 56

64 57
65 400, , , , , ,467 13,053 32,242 63,907 20,000 10, ,589 +3,556 58
66 59
67 60
68 400, , , , ,050 6,894 16,466 31,437 51,381 20,000 10,
69 62
70 63
71 400, , , , ,272 4,068 10,079 20,249 34,755 20,000 10,
72 65
73 66
74 400, , , , ,735 5,600 13,414 25,610 42,066 20,000 10, ,247-2,203-2,
75 68
76 69
77 400, , , , ,977 7,808 22,575 52, ,121 20,000 10,000 +7, ,220 +3,368 70
78 71
79 72
80 400, , , , , ,000 1,232 10,493 40, ,061 20, ,163 10,000 +6, ,304 +3,277 73
81 74
82 75
83 400, , , , ,109 7,101 17,374 32,876 52,437 20,000 10, ,159 76
84 77
85 78
86 400, , , , , ,469 15,033 37,173 73,436 20,000 10, ,322 +2,360 +4,119 79
87 80
88 81
89 400, , , , ,827 18,167 45,468 85, ,466 20,000 10, ,158 +2,752 +4,714 +7,319 82
90 83
91 84
92 400, , , , , ,106 16,697 43,714 85,249 20,000 10,
93 86
94 87
95 400, , , , ,530 5,180 11,800 20,991 32,607 20,000 10, ,216 +1,887 88
96 89
97 90
98 400, , , , ,215 9,655 20,329 33,026 46,008 20,000 10, ,153 +1,783 +2,501 91
99 92
100 93
101 1,500,000 1,248,913 1,000, , ,000 6,025 61, , ,743 30, , ,969 20, ,473 10, ,120 +5,625 94
102 95

103 96
104 400, , , , ,537 4,754 11,112 20,917 33,887 20,000 10,
105 98
106 99
107 400, , , , ,572 5,102 12,506 25,791 46,697 20,000 10, ,113 +2,845 +6,
108 101
109 102
110 400, , , , , ,000 1,127 10,270 35,818 76,726 20,000 10, ,570 +3,015 +4,
111 104
112 105
113 400, , , , ,452 9,630 26,361 56, ,038 20,000 10,000 +7, ,980 +4,
114 107
115 108
116 400, , , , ,091 12,153 28,350 49,960 76,040 20,000 10, ,269-1,540-1,
117 110
118 111
119 400, , , , , ,359 19,332 47,850 91,961 20,000 10, ,241 +2,297 +4,
120 113
121 114
122 400, , , , ,149 9,634 20,302 34,817 52,895 20,000 10, ,020 +2,051 +3,264 +4,
123 116
124 117
125 400, , , , ,308 4,182 10,253 20,130 34,850 20,000 10, ,
126 119

127 120
128 400, , , , ,108 6,414 13,326 21,843 31,852 20,000 10,
129 122
130 123
131 400, , , , ,326 4,506 10,999 21,720 37,265 20,000 10, ,425 +2,
132 125
133 126
134 400, , , , ,029 9,519 22,160 43,298 72,592 20,000 10, ,
135 128
136 129
137 400, , , , , ,731 14,335 38,099 79,187 20,000 10, ,332 +3,013 +6,
138 131
139 132
140 400, , , , ,287 9,055 23,551 47,911 82,895 20,000 10, ,011-1,503-1,
141 134
142 135
143 400, , , , , ,667 11,763 29,497 60,689 20,000 10,
144 137
145 138
146 400, , , , , , ,000 73,572 2,491 23,234 20, , ,088 10,000 +6, ,116 +2,
147 140
148 141
149 400, , , , , ,832 17,941 48, ,782 20,000 10, ,202 +2,581 +4,289 +6,
150 143
151 144
152 400, , , , , ,000 1,411 9,190 28,988 68, ,463 20, ,875 10,000 +6, ,
153 146

154 147
155 400, , , , ,045 7,029 18,175 36,633 62,116 20,000 10, ,065-1,
156 149
157 150
158 400, , , , ,993 6,784 16,255 31,436 52,740 20,000 10,
159 152
160 153
161 400, , , , ,446 4,507 10,216 19,287 32,143 20,000 10,
162 155
163 156
164 400, , , , , , ,000 1,285 12,141 47,980 20,000 10,000 +7, , ,579 +3,
165 158
166 159
167 Geurs, K. and Van Eck, J. (2001). Accessibility measures: Review and applications. Technical Report , National Institute of Public Health and the Environment. Handy, S. L. and Niemeier, D. A. (1997). Measuring accessibility: An exploration of issues and alternatives. Environment and planning A, 29(7): Hansen, W. (1959). How accessibility shapes land use. Journal of the American Institute of Planners, 25(2): Levine, J., Grengs, J., Shen, Q., and Shen, Q. (2012). Does accessibility require density or speed? A comparison of fast versus close in getting where you want to go in U.S. metropolitan regions. Journal of the American Planning Association, 78(2): Levinson, D. M. (2013). Access across America. Technical Report CTS 13-20, University of Minnesota Center for Transportation Studies, ResearchReports/pdfdownload.pl?id=2334. McKenzie, B. (2014). Modes less traveled bicycling and walking to work in the United States: Technical Report ACS-25, U.S. Census Bureau. Ramsey, K. and Bell, A. (2014). The smart location database: A nationwide data resource characterizing the built environment and destination accessibility at the neighborhood scalement and destination accessibility at the neighborhood scale. Cityscape: A Journal of Policy Development and Research, 16(2). Tomer, A., Kneebone, E., Puentes, R., and Berube, A. (2011). Missed opportunity: Transit and jobs in metropolitan america. Technical report, Brookings Institution, 20transit/0512_jobs_transit.pdf. Walker, J. (2012). Human Transit. Island Press. 160
Access Across America: Transit 2017
 Access Across America: Transit 2017 Final Report Prepared by: Andrew Owen Brendan Murphy Accessibility Observatory Center for Transportation Studies University of Minnesota CTS 18-12 1. Report No. CTS
Access Across America: Transit 2015 Methodology
 Access Across America: Transit 2015 Methodology Final Report Prepared by: Andrew Owen Brendan Murphy David Levinson Accessibility Observatory Center for Transportation Studies Department of Civil, Environmental,
Mapping Accessibility Over Time
 Journal of Maps, 2006, 76-87 Mapping Accessibility Over Time AHMED EL-GENEIDY and DAVID LEVINSON University of Minnesota, 500 Pillsbury Drive S.E., Minneapolis, MN 55455, USA; geneidy@umn.edu (Received
BROOKINGS May
 Appendix 1. Technical Methodology This study combines detailed data on transit systems, demographics, and employment to determine the accessibility of jobs via transit within and across the country s 100
Intercity Bus Stop Analysis
 by Karalyn Clouser, Research Associate and David Kack, Director of the Small Urban and Rural Livability Center Western Transportation Institute College of Engineering Montana State University Report prepared
The Elusive Connection between Density and Transit Use
 The Elusive Connection between Density and Transit Use Abstract: The connection between density and transportation is heralded by planners, yet results are often elusive. This paper analyzes two regions,
Impact of Metropolitan-level Built Environment on Travel Behavior
 Impact of Metropolitan-level Built Environment on Travel Behavior Arefeh Nasri 1 and Lei Zhang 2,* 1. Graduate Research Assistant; 2. Assistant Professor (*Corresponding Author) Department of Civil and
Density and Walkable Communities
 Density and Walkable Communities Reid Ewing Professor & Chair City and Metropolitan Planning University of Utah ewing@arch.utah.edu Department of City & Metropolitan Planning, University of Utah MRC Research
Figure 8.2a Variation of suburban character, transit access and pedestrian accessibility by TAZ label in the study area
 Figure 8.2a Variation of suburban character, transit access and pedestrian accessibility by TAZ label in the study area Figure 8.2b Variation of suburban character, commercial residential balance and mix
Research Update: Race and Male Joblessness in Milwaukee: 2008
 Research Update: Race and Male Joblessness in Milwaukee: 2008 by: Marc V. Levine University of Wisconsin Milwaukee Center for Economic Development Briefing Paper September 2009 Overview Over the past decade,
Missed Opportunity: Transit and Jobs in Metropolitan America
 Robert Puentes Brookings Institution Washington, DC May 12, 2011 Missed Opportunity: Transit and Jobs in Metropolitan America We believe we may have a public transit moment before us in the U.S. today.
Transit Time Shed Analyzing Accessibility to Employment and Services
 Transit Time Shed Analyzing Accessibility to Employment and Services presented by Ammar Naji, Liz Thompson and Abdulnaser Arafat Shimberg Center for Housing Studies at the University of Florida www.shimberg.ufl.edu
Regional Snapshot Series: Transportation and Transit. Commuting and Places of Work in the Fraser Valley Regional District
 Regional Snapshot Series: Transportation and Transit Commuting and Places of Work in the Fraser Valley Regional District TABLE OF CONTENTS Complete Communities Daily Trips Live/Work Ratio Commuting Local
Can Public Transport Infrastructure Relieve Spatial Mismatch?
 Can Public Transport Infrastructure Relieve Spatial Mismatch? Evidence from Recent Light Rail Extensions Kilian Heilmann University of California San Diego April 20, 2015 Motivation Paradox: Even though
Metrolinx Transit Accessibility/Connectivity Toolkit
 Metrolinx Transit Accessibility/Connectivity Toolkit Christopher Livett, MSc Transportation Planning Analyst Research and Planning Analytics Tweet about this presentation #TransitGIS OUTLINE 1. Who is
Technical Memorandum #2 Future Conditions
 Technical Memorandum #2 Future Conditions To: Dan Farnsworth Transportation Planner Fargo-Moorhead Metro Council of Governments From: Rick Gunderson, PE Josh Hinds PE, PTOE Houston Engineering, Inc. Subject:
Assessing spatial distribution and variability of destinations in inner-city Sydney from travel diary and smartphone location data
 Assessing spatial distribution and variability of destinations in inner-city Sydney from travel diary and smartphone location data Richard B. Ellison 1, Adrian B. Ellison 1 and Stephen P. Greaves 1 1 Institute
California Urban Infill Trip Generation Study. Jim Daisa, P.E.
 California Urban Infill Trip Generation Study Jim Daisa, P.E. What We Did in the Study Develop trip generation rates for land uses in urban areas of California Establish a California urban land use trip
Forecasts for the Reston/Dulles Rail Corridor and Route 28 Corridor 2010 to 2050
 George Mason University Center for Regional Analysis Forecasts for the Reston/Dulles Rail Corridor and Route 28 Corridor 21 to 25 Prepared for the Fairfax County Department of Planning and Zoning Lisa
GIS Analysis of Crenshaw/LAX Line
 PDD 631 Geographic Information Systems for Public Policy, Planning & Development GIS Analysis of Crenshaw/LAX Line Biying Zhao 6679361256 Professor Barry Waite and Bonnie Shrewsbury May 12 th, 2015 Introduction
City of Hermosa Beach Beach Access and Parking Study. Submitted by. 600 Wilshire Blvd., Suite 1050 Los Angeles, CA
 City of Hermosa Beach Beach Access and Parking Study Submitted by 600 Wilshire Blvd., Suite 1050 Los Angeles, CA 90017 213.261.3050 January 2015 TABLE OF CONTENTS Introduction to the Beach Access and Parking
Regional Performance Measures
 G Performance Measures Regional Performance Measures Introduction This appendix highlights the performance of the MTP/SCS for 2035. The performance of the Revenue Constrained network also is compared to
The 3V Approach. Transforming the Urban Space through Transit Oriented Development. Gerald Ollivier Transport Cluster Leader World Bank Hub Singapore
 Transforming the Urban Space through Transit Oriented Development The 3V Approach Gerald Ollivier Transport Cluster Leader World Bank Hub Singapore MDTF on Sustainable Urbanization The China-World Bank
Regional Performance Measures
 G Performance Measures Regional Performance Measures Introduction This appendix highlights the performance of the MTP/SCS for 2035. The performance of the Revenue Constrained network also is compared to
Study Overview. the nassau hub study. The Nassau Hub
 Livable Communities through Sustainable Transportation the nassau hub study AlternativeS analysis / environmental impact statement The Nassau Hub Study Overview Nassau County has initiated the preparation
Changes in Transportation Infrastructure and Commuting Patterns in U.S. Metropolitan Areas,
 Changes in Transportation Infrastructure and Commuting Patterns in U.S. Metropolitan Areas, 1960-2000 Nathaniel Baum-Snow Department of Economics Box B Brown University Providence, RI 02912 Nathaniel_Baum-Snow@brown.edu
The Spatial Structure of Cities: International Examples of the Interaction of Government, Topography and Markets
 Module 2: Spatial Analysis and Urban Land Planning The Spatial Structure of Cities: International Examples of the Interaction of Government, Topography and Markets Alain Bertaud Urbanist Summary What are
Chao Liu, Ting Ma, and Sevgi Erdogan National Center for Smart Growth Research & Education (NCSG) University of Maryland, College Park
 University of Maryland, College Park") Chao Liu, Ting Ma, and Sevgi Erdogan National Center for Smart Growth Research & Education (NCSG) University of Maryland, College Park 2015 GIS in Transit, September 1-3, 2015 Shared-use Vehicle Services
Chao Liu, Ting Ma, and Sevgi Erdogan National Center for Smart Growth Research & Education (NCSG) University of Maryland, College Park 2015 GIS in Transit, September 1-3, 2015 Shared-use Vehicle Services
Environmental Analysis, Chapter 4 Consequences, and Mitigation
 Environmental Analysis, Chapter 4 4.17 Environmental Justice This section summarizes the potential impacts described in Chapter 3, Transportation Impacts and Mitigation, and other sections of Chapter 4,
Note on Transportation and Urban Spatial Structure
 Note on Transportation and Urban Spatial Structure 1 By Alain Bertaud, Washington, ABCDE conference, April 2002 Email: duatreb@msn.com Web site: http://alain-bertaud.com/ http://alainbertaud.com/ The physical
Economic and Social Urban Indicators: A Spatial Decision Support System for Chicago Area Transportation Planning
 Economic and Social Urban Indicators: A Spatial Decision Support System for Chicago Area Transportation Planning Piyushimita Thakuriah (Vonu), P.S. Sriraj, Paul Metaxatos, Inshu Minocha & Tanushri Swarup
Measuring connectivity in London
 Measuring connectivity in London OECD, Paris 30 th October 2017 Simon Cooper TfL City Planning 1 Overview TfL Connectivity measures in TfL PTALs Travel time mapping Catchment analysis WebCAT Current and
Neighborhood Locations and Amenities
 University of Maryland School of Architecture, Planning and Preservation Fall, 2014 Neighborhood Locations and Amenities Authors: Cole Greene Jacob Johnson Maha Tariq Under the Supervision of: Dr. Chao
The Role of Transitways in Our Region s Economic Competitiveness. The 23rd CTS Annual Research Conference St. Paul, MN May 23, 2012
 The Role of Transitways in Our Region s Economic Competitiveness The 23rd CTS Annual Research Conference St. Paul, MN May 23, 2012 1 2 Twin Cities Competitive Clusters 3 Competitive Clusters interconnected
Encapsulating Urban Traffic Rhythms into Road Networks
 Encapsulating Urban Traffic Rhythms into Road Networks Junjie Wang +, Dong Wei +, Kun He, Hang Gong, Pu Wang * School of Traffic and Transportation Engineering, Central South University, Changsha, Hunan,
Modeling the Commute Mode Share of Transit Using Continuous Accessibility to Jobs
 Modeling the Commute Mode Share of Transit Using Continuous Accessibility to Jobs Andrew Owen (corresponding author) University of Minnesota, Department of Civil Engineering 500 Pillsbury Drive SE Minneapolis,
Compact city policies: a comparative assessment
 Compact city policies: a comparative TADASHI MATSUMOTO Organisation for Economic Co-operation and Development (OECD) Presentation at the UNECE-OECD seminar September 26, 2012, Geneva Outline of the study
Speakers: Jeff Price, Federal Transit Administration Linda Young, Center for Neighborhood Technology Sofia Becker, Center for Neighborhood Technology
 Speakers: Jeff Price, Federal Transit Administration Linda Young, Center for Neighborhood Technology Sofia Becker, Center for Neighborhood Technology Peter Haas, Center for Neighborhood Technology Craig
Local Economic Activity Around Rapid Transit Stations
 Local Economic Activity Around Rapid Transit Stations The Case of Chicago s Orange Line Julie Cooper, MPP 2014 Harris School of Public Policy Transport Chicago June 6, 2014 Motivation Impacts of transit
Transport Planning in Large Scale Housing Developments. David Knight
 Transport Planning in Large Scale Housing Developments David Knight Large Scale Housing Developments No longer creating great urban spaces in the UK (Hall 2014) Transport Planning Transport planning processes
Managing Growth: Integrating Land Use & Transportation Planning
 Managing Growth: Integrating Land Use & Transportation Planning Metro Vancouver Sustainability Community Breakfast Andrew Curran Manager, Strategy June 12, 2013 2 Integrating Land Use & Transportation
Employment Decentralization and Commuting in U.S. Metropolitan Areas. Symposium on the Work of Leon Moses
 Employment Decentralization and Commuting in U.S. Metropolitan Areas Alex Anas Professor of Economics University at Buffalo Symposium on the Work of Leon Moses February 7, 2014 9:30-11:15am, and 2:30-4:30pm
True Smart and Green City? 8th Conference of the International Forum on Urbanism
 ,, doi:10.3390/ifou-. True Smart and Green City? 8th Conference of the International Forum on Urbanism Conference Proceedings Paper Comparable Measures of Accessibility to Public Transport by the General
HORIZON 2030: Land Use & Transportation November 2005
 PROJECTS Land Use An important component of the Horizon transportation planning process involved reviewing the area s comprehensive land use plans to ensure consistency between them and the longrange transportation
C) Discuss two factors that are contributing to the rapid geographical shifts in urbanization on a global scale.
 Discuss two factors that are contributing to the rapid geographical shifts in urbanization on a global scale.") AP Human Geography Unit VII. Cities and Urban Land Use Free Response Questions FRQ 1 Rapid urbanization in Least Developed Countries (LDCs) has many profound impacts for the world. Answer the following
AP Human Geography Unit VII. Cities and Urban Land Use Free Response Questions FRQ 1 Rapid urbanization in Least Developed Countries (LDCs) has many profound impacts for the world. Answer the following
Developing Built Environment Indicators for Urban Oregon. Dan Rubado, MPH EPHT Epidemiologist Oregon Public Health Division
 Developing Built Environment Indicators for Urban Oregon Dan Rubado, MPH EPHT Epidemiologist Oregon Public Health Division What is the built environment? The built environment encompasses spaces and places
Geospatial Analysis of Job-Housing Mismatch Using ArcGIS and Python
 Geospatial Analysis of Job-Housing Mismatch Using ArcGIS and Python 2016 ESRI User Conference June 29, 2016 San Diego, CA Jung Seo, Frank Wen, Simon Choi and Tom Vo, Research & Analysis Southern California
Accessibility and the evaluation of investments on the Beijing subway
 THE JOURNAL OF TRANSPORT AND LAND USE VOL. 10 NO. 1 [2016] pp. 395 408 http://jtlu.org Accessibility and the evaluation of investments on the Beijing subway Haibing Jiang University of Minnesota haibingjiang1@163.com
Missed Opportunity: Transit and Jobs in Metropolitan America
 METROPOLITAN INFRASTRUCTURE INITIATIVE SERIES AND METROPOLITAN OPPORTUNITY SERIES Missed Opportunity: Transit and Jobs in Metropolitan America Adie Tomer, Elizabeth Kneebone, Robert Puentes, and Alan Berube
ACCESSIBILITY OF INTERMODAL CENTERS STUDY
 ACCESSIBILITY OF INTERMODAL CENTERS STUDY Presentation for VDOT Forum - Coordinating Transportation Planning and Land Use Wednesday, April 2, 2014 Vlad Gavrilovic, AICP - Renaissance Planning Group Tasks
Travel behavior of low-income residents: Studying two contrasting locations in the city of Chennai, India
 Travel behavior of low-income residents: Studying two contrasting locations in the city of Chennai, India Sumeeta Srinivasan Peter Rogers TRB Annual Meet, Washington D.C. January 2003 Environmental Systems,
Spatiotemporal Analysis of Commuting Patterns in Southern California Using ACS PUMS, CTPP and LODES
 Spatiotemporal Analysis of Commuting Patterns in Southern California Using ACS PUMS, CTPP and LODES 2017 ACS Data Users Conference May 11-12, 2017 Alexandria, VA Jung Seo, Tom Vo, Frank Wen and Simon Choi
Prepared for: San Diego Association Of Governments 401 B Street, Suite 800 San Diego, California 92101
 Activity-Based Travel Model Validation for 2012 Using Series 13 Data: Coordinated Travel Regional Activity Based Modeling Platform (CT-RAMP) for San Diego County Prepared for: San Diego Association Of
Urban Planning Word Search Level 1
 Urban Planning Word Search Level 1 B C P U E C O S Y S T E M P A R E U O E U R B A N P L A N N E R T N S T D H E C O U N T Y G E R E R D W R E N I C I T Y C O U N C I L A A A S U G G C I L A G P R I R
Varying Influences of the Built Environment on Household Travel in Fifteen Diverse Regions of the United states
 Varying Influences of the Built Environment on Household Travel in Fifteen Diverse Regions of the United states Ewing, R., G. Tian, J.P. Goates, M. Zhang, M. Greenwald, Lane Council of Governments, A.
Urban Revival in America
 Urban Revival in America Victor Couture 1 Jessie Handbury 2 1 University of California, Berkeley 2 University of Pennsylvania and NBER May 2016 1 / 23 Objectives 1. Document the recent revival of America
Advancing Urban Models in the 21 st Century. Jeff Tayman Lecturer, Dept. of Economics University of California, San Diego
 Advancing Urban Models in the 21 st Century Jeff Tayman Lecturer, Dept. of Economics University of California, San Diego 1 Regional Decision System Better tools Better data Better access Better Decisions
PlaceTypes. How the built environment is measured. Variables Measures Levels. AREA TYPE + DEVELOPMENT TYPE = PlaceType
 PlaceTypes In order to better understand land use and transportation interactions and to make more informed policy decisions, neighborhood characteristics can be analyzed by the role that they play in
Subject: Note on spatial issues in Urban South Africa From: Alain Bertaud Date: Oct 7, A. Spatial issues
 Page 1 of 6 Subject: Note on spatial issues in Urban South Africa From: Alain Bertaud Date: Oct 7, 2009 A. Spatial issues 1. Spatial issues and the South African economy Spatial concentration of economic
East Bay BRT. Planning for Bus Rapid Transit
 East Bay BRT Planning for Bus Rapid Transit Regional Vision Draper Prison The Bottleneck is a State-Level issue, Salt Lake County 2050 Population: 1.5M Draper Prison hopefully with some State-Level funding!
StanCOG Transportation Model Program. General Summary
 StanCOG Transportation Model Program Adopted By the StanCOG Policy Board March 17, 2010 What are Transportation Models? General Summary Transportation Models are technical planning and decision support
MULTIPLE CHOICE. Choose the one alternative that best completes the statement or answers the question.
 AP Test 13 Review Name MULTIPLE CHOICE. Choose the one alternative that best completes the statement or answers the question. 1) Compared to the United States, poor families in European cities are more
Transferability of Household Travel Data Across Geographic Areas Using NHTS 2001
 Transferability of Household Travel Data Across Geographic Areas Using NHTS 2001 Jane Lin PhD Assistant Professor Department of Civil and Materials Engineering Institute for Environmental Science and Policy
Your web browser (Safari 7) is out of date. For more security, comfort and the best experience on this site: Update your browser Ignore
 is out of date. For more security, comfort and the best experience on this site: Update your browser Ignore") Your web browser (Safari 7) is out of date. For more security, comfort and the best experience on this site: Update your browser Ignore urban area For the complete encyclopedic entry with media resources,
Your web browser (Safari 7) is out of date. For more security, comfort and the best experience on this site: Update your browser Ignore urban area For the complete encyclopedic entry with media resources,
THE LEGACY OF DUBLIN S HOUSING BOOM AND THE IMPACT ON COMMUTING
 Proceedings ITRN2014 4-5th September, Caulfield and Ahern: The Legacy of Dublin s housing boom and the impact on commuting THE LEGACY OF DUBLIN S HOUSING BOOM AND THE IMPACT ON COMMUTING Brian Caulfield
Spatial and Socioeconomic Analysis of Commuting Patterns in Southern California Using LODES, CTPP, and ACS PUMS
 Spatial and Socioeconomic Analysis of Commuting Patterns in Southern California Using LODES, CTPP, and ACS PUMS Census for Transportation Planning Subcommittee meeting TRB 95th Annual Meeting January 11,
Measuring Performance:
 Accessibility Metrics in Metropolitan Regions around the World Geneviève Boisjoly and Ahmed El-Geneidy August 2017 Table of Contents Executive Summary...3 1 Introduction...4 2 Theoretical Background...4
Impact of Light Rail Implementation on Labor Market Accessibility: A Transportation Equity Perspective
 Impact of Light Rail Implementation on Labor Market Accessibility: A Transportation Equity Perspective Yingling Fan *, Andrew Guthrie, and David Levinson * Corresponding Author. Email: yingling@umn.edu;
New Partners for Smart Growth: Building Safe, Healthy, and Livable Communities Mayor Jay Williams, Youngstown OH
 New Partners for Smart Growth: Building Safe, Healthy, and Livable Communities Mayor Jay Williams, Youngstown OH The City of Youngstown Youngstown State University Urban Strategies Inc. Youngstown needed
Public Transit in America: Analysis of Access Using the 2001 National Household Travel Survey
 Public Transit in America: Analysis of Access Using the 2001 National Household Travel Survey Center for Urban Transportation Research University of South Florida, Tampa February 2007 BD 549-30 Public
Place Syntax Tool (PST)
") Place Syntax Tool (PST) Alexander Ståhle To cite this report: Alexander Ståhle (2012) Place Syntax Tool (PST), in Angela Hull, Cecília Silva and Luca Bertolini (Eds.) Accessibility Instruments for Planning
Place Syntax Tool (PST) Alexander Ståhle To cite this report: Alexander Ståhle (2012) Place Syntax Tool (PST), in Angela Hull, Cecília Silva and Luca Bertolini (Eds.) Accessibility Instruments for Planning
SYSTEMATIC EVALUATION OF RUN OFF ROAD CRASH LOCATIONS IN WISCONSIN FINAL REPORT
 SYSTEMATIC EVALUATION OF RUN OFF ROAD CRASH LOCATIONS IN WISCONSIN FINAL REPORT DECEMBER 2004 DISCLAIMER This research was funded by the Wisconsin Department of Transportation. The contents of this report
Internal Capture in Mixed-Use Developments (MXDs) and Vehicle Trip and Parking Reductions in Transit-Oriented Developments (TODs)
 and Vehicle Trip and Parking Reductions in Transit-Oriented Developments (TODs)") Internal Capture in Mixed-Use Developments (MXDs) and Vehicle Trip and Parking Reductions in Transit-Oriented Developments (TODs) Reid Ewing City and Metropolitan Planning University of Utah ewing@arch.utah.edu
Internal Capture in Mixed-Use Developments (MXDs) and Vehicle Trip and Parking Reductions in Transit-Oriented Developments (TODs) Reid Ewing City and Metropolitan Planning University of Utah ewing@arch.utah.edu
Data driven approaches to Urban Planning Experience from Derry/Londonderry
 Data driven approaches to Urban Planning Experience from Derry/Londonderry Anna Rose RTPI Belfast 11 th of September 1 June 26 07:47AM 2 The value of the City The space of the city is a theatre: playing
Crime Analysis. GIS Solutions for Intelligence-Led Policing
 Crime Analysis GIS Solutions for Intelligence-Led Policing Applying GIS Technology to Crime Analysis Know Your Community Analyze Your Crime Use Your Advantage GIS aids crime analysis by Identifying and
Developing Innovation Village, Baltimore
 Developing Innovation Village, Baltimore Rick Jenarine, Ridhima Mehrotra, Andrew Seguin, Claire Warner Under the supervision of Professor Chao Liu URSP688L: Planning Technologies The University of Maryland
Understanding Land Use and Walk Behavior in Utah
 Understanding Land Use and Walk Behavior in Utah 15 th TRB National Transportation Planning Applications Conference Callie New GIS Analyst + Planner STUDY AREA STUDY AREA 11 statistical areas (2010 census)
ROUNDTABLE ON SOCIAL IMPACTS OF TIME AND SPACE-BASED ROAD PRICING Luis Martinez (with Olga Petrik, Francisco Furtado and Jari Kaupilla)
") ROUNDTABLE ON SOCIAL IMPACTS OF TIME AND SPACE-BASED ROAD PRICING Luis Martinez (with Olga Petrik, Francisco Furtado and Jari Kaupilla) AUCKLAND, NOVEMBER, 2017 Objective and approach (I) Create a detailed
ROUNDTABLE ON SOCIAL IMPACTS OF TIME AND SPACE-BASED ROAD PRICING Luis Martinez (with Olga Petrik, Francisco Furtado and Jari Kaupilla) AUCKLAND, NOVEMBER, 2017 Objective and approach (I) Create a detailed
A TRANSIT ACCESS ANALYSIS OF TANF RECIPIENTS IN THE CITY OF PORTLAND, OREGON
 A TRANSIT ACCESS ANALYSIS OF TANF RECIPIENTS IN THE CITY OF PORTLAND, OREGON By Thomas W. Sanchez Center for Urban Studies Portland State University ABSTRACT Little evidence exists regarding the relationship
Committee Meeting November 6, 2018
 Committee Meeting November 6, 2018 Agenda Where we are in the process Land Use Plan Transportation Element Housing & Neighborhoods Elements Next Steps Schedule November 6: Plan Elements December: Plan
Impacts of Transit Rail Lines on Property Values
 Impacts of Transit Rail Lines on Property Values Rail~Volution 2007 Introduction The Question Research Tools Methodology Examples Results Question Won t transit in my backyard hurt my property value?
Taming the Modeling Monster
 Taming the Modeling Monster Starring: Ellen Greenberg Scott McCarey Jim Charlier Audience Poll, part 1 Elected Officials Board Members Public Staff Consultants Journalists Other Audience Poll, part 2 Modeling
Keywords: Air Quality, Environmental Justice, Vehicle Emissions, Public Health, Monitoring Network
 NOTICE: this is the author s version of a work that was accepted for publication in Transportation Research Part D: Transport and Environment. Changes resulting from the publishing process, such as peer
15.0 Operations and Maintenance Cost Calculations
 15.0 Operations and Maintenance Cost Calculations 15.1 Introduction Operations and Maintenance (O&M) costs were calculated for each of the four alternatives being considered in the analysis. No Build Alternative
Frequently Asked Questions
 What is the Regional Transit Engagement Series? As one of the fastest growing regions in the country, there is recognition that long-term transit planning efforts should be accelerated if we are to remain
A Simplified Travel Demand Modeling Framework: in the Context of a Developing Country City
 A Simplified Travel Demand Modeling Framework: in the Context of a Developing Country City Samiul Hasan Ph.D. student, Department of Civil and Environmental Engineering, Massachusetts Institute of Technology,
A Note on Commutes and the Spatial Mismatch Hypothesis
 Upjohn Institute Working Papers Upjohn Research home page 2000 A Note on Commutes and the Spatial Mismatch Hypothesis Kelly DeRango W.E. Upjohn Institute Upjohn Institute Working Paper No. 00-59 Citation
MAPPING THE RAINFALL EVENT FOR STORMWATER QUALITY CONTROL
 Report No. K-TRAN: KU-03-1 FINAL REPORT MAPPING THE RAINFALL EVENT FOR STORMWATER QUALITY CONTROL C. Bryan Young The University of Kansas Lawrence, Kansas JULY 2006 K-TRAN A COOPERATIVE TRANSPORTATION
Where Transit Use Is Growing: Surprising Results
 Where Transit Use Is Growing: Surprising Results Gregory L. Thompson, Jeffrey R. Brown, Rupa Sharma, and Samuel Scheib Florida State University Abstract This article investigates whether transit s fate
Varying Influences of the Built Environment on Household Travel in Fifteen Diverse Regions of the United states
 Varying Influences of the Built Environment on Household Travel in Fifteen Diverse Regions of the United states Ewing, R., G. Tian, J.P. Goates, M. Zhang, M. Greenwald, Lane Council of Governments, A.
Regional Growth Strategy Regional TOD Advisory Committee
 Regional Strategy Regional TOD Advisory Committee September 21, 2018 Overview Regional Geographies Transit-Oriented Development Goal Scenarios Next Steps 2 Schedule + Process September 6 Management Policy
Trip Generation Model Development for Albany
 Trip Generation Model Development for Albany Hui (Clare) Yu Department for Planning and Infrastructure Email: hui.yu@dpi.wa.gov.au and Peter Lawrence Department for Planning and Infrastructure Email: lawrence.peter@dpi.wa.gov.au
Accessibility and Transit Performance
 Accessibility and Transit Performance Alireza Ermagun David Levinson June 22, 2015 Abstract This study disentangles the impact of financial and physical dimensions of transit service operators on net transit
Advancing Transportation Performance Management and Metrics with Census Data
 Advancing Transportation Performance Management and Metrics with Census Data Authors: Ivana Tasic, University of Utah, Department of Civil and Environmental Engineering, 110 Central Campus Drive, Salt
Trends in Metropolitan Network Circuity
 Trends in Metropolitan Network Circuity David J. Giacomin Luke S. James David M. Levinson Abstract Because people seek to minimize their time and travel distance (or cost) when commuting, the circuity
LOCAL GOVERNMENT ADMINISTRATION SERIES
 Public Policy Research Center University of Missouri St. Louis LOCAL GOVERNMENT ADMINISTRATION SERIES ISSUE #3 MARCH 2017 THE GOVERNOR IN GOVERNANCE: KEEPING THE PACE by Mark Tranel, Director, Public Policy
Transit Service Gap Technical Documentation
 Transit Service Gap Technical Documentation Introduction This document is an accompaniment to the AllTransit TM transit gap methods document. It is a detailed explanation of the process used to develop
Changes in the Spatial Distribution of Mobile Source Emissions due to the Interactions between Land-use and Regional Transportation Systems
 Changes in the Spatial Distribution of Mobile Source Emissions due to the Interactions between Land-use and Regional Transportation Systems A Framework for Analysis Urban Transportation Center University
STILLORGAN QBC LEVEL OF SERVICE ANALYSIS
 4-5th September, STILLORGAN QBC LEVEL OF SERVICE ANALYSIS Mr David O Connor Lecturer Dublin Institute of Technology Mr Philip Kavanagh Graduate Planner Dublin Institute of Technology Abstract Previous
Typical information required from the data collection can be grouped into four categories, enumerated as below.
 Chapter 6 Data Collection 6.1 Overview The four-stage modeling, an important tool for forecasting future demand and performance of a transportation system, was developed for evaluating large-scale infrastructure