Mapping Travel-To-Work Flows. Oliver O Brien and James Cheshire Department of Geography, UCL
|
|
|
- Winifred Sullivan
- 6 years ago
- Views:
Transcription


, Harrogate, 23")
1 Mapping Travel-To-Work Flows Oliver O Brien and James Cheshire Department of Geography, UCL RSAI-BIS Annual Conference (UKDS-CS Sessions), Harrogate, 23 August 2017
2 Contents 1. The DataShine Project & Websites 2. O/D Flow Maps: Design Choices 3. DataShine Commute: Cartography, Data, Tech 4. Example Insights and Case Studies
3 1. The DataShine Project B.O.D.M.A.S. Main period of work and releases: websites 12 of these show aggregated Census 2011 statistics from ONS (via NOMIS), NRS and NISRA


4 Core DataShine Websites


5 DataShine Geodemographics Websites


6 DataShine Follow-on Websites

 R: Showing swing")
7 Additional DataShine Websites DataShine Election (GE 2010 and GE 2015) L: Showing political colour (Enhanced R-G-B) R: Showing swing party and winning party


8 Core DataShine Flow Websites

9 DataShine Flow Follow-On Websites Commuter Flow Map for USP.scot (Understanding Scotland s Places)


10 Additional Cycle Flow Websites

11 2. O/D Flow Maps: Design Choices To avoid overloading the visual impact (or the web browser) Restrict origin or destination Only show flows above threshold Minimise number of possible origins/destinations Restrict the geography Bend the lines Route the flow Don t use a geographical map Don t use lines


12 Origin Destination Flow Maps: Choices Restrict to selected origin or destination Removes at a glance visualisation


13 Origin Destination Flow Maps: Choices Only show flows above minimum Simple threshold, set number of lines or dynamic valuebased limit (e.g. >1% of origin population)

14 Origin Destination Flow Maps: Choices Minimise number of possible origins/destinations

15 Origin Destination Flow Maps: Choices Restrict the geography PCT.bike, Lovelace et al., 2017


16 Origin Destination Flow Maps: Choices Bend the lines L: Alastair Rae, 2001 Census, travel into London only R: Ed Manley, top destination from origin, Oyster cards


17 Origin Destination Flow Maps: Choices Route the flow L: PCT.bike, 2011 Census, York: Lovelace et al., 2017 R: OSM-routed flows for bikeshare in central London

18 Origin Destination Flow Maps: Choices Don t use a geographical map Robert Radburn / City: Car commute, London boroughs


19 Origin Destination Flow Maps: Choices Don t use lines

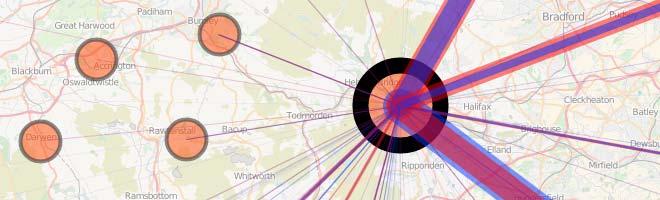
20 3. DataShine Commute: Carto, Data Blue = commute to here Red = commute from here

21 Carto: Line Translucency 21


22 Cartographic Techniques We constrain the data to weighted centroids or lines, rather than areas We can then use a regular background map, e.g. from OpenStreetMap.org, Microsoft, HERE Maps, ArcGIS REST API 22


23 The Data Tells a Story
 People reporting their head office address as their workplace address, but actually work at a branch office Filtering out")
24 Data Issues Some anomalous data (e.g. walking 200 miles) People reporting their head office address as their workplace address, but actually work at a branch office Filtering out journeys with <6 people to minimise this problem, reduce noise and mitigate any low-level statistical record swapping
25 Technical Summary Technical Summary MSOA population weighted centroids (ONS) Origin-Destination aggregate table for the 2011 census, split by mode of travel and by MSOA. LSOA now available OpenStreetMap (just as background map) OpenLayers 3+ PostgreSQL/PostGIS querying area squared cells for O/D datasets, so a database is certainly necessary
26 4. Insights and Case Studies Big City Commute Variations in Mode Real-World Vehicle Emissions Testing Where in London do a lot of people drive to work? Journeys by Bicycle Varying topology of the cycle commute by city Identification of routes for infrastructure improvement (pct.bike)


27 Mode of Travel to Work: City of London

28 Mode of Travel to Work: City of London

29 Mode of Travel to Work: Manchester Pic.


30 Finding Major Intralondon TTW by Car


31 DataShine: Great British Bike To Work 31


32 DataShine: Great British Bike To Work 32
33 Thanks! Websites featured: Research Blogs and Twitter / /
DataShine Automated Thematic Mapping of 2011 Census Quick Statistics
 DataShine Automated Thematic Mapping of 2011 Census Quick Statistics Oliver O Brien, James Cheshire Department of Geography University College London UKDS Census Applications Conference, July 2015 Contents
UCL CENTRE FOR ADVANCED SPATIAL ANALYSIS. Mapping London. Oliver O Brien and James Cheshire. Society of Cartographers 48 th Annual Conference (UCL)
") UCL CENTRE FOR ADVANCED SPATIAL ANALYSIS Mapping London Oliver O Brien and James Cheshire Society of Cartographers 48 th Annual Conference (UCL) 5 September 2012 The Mapping London Blog A blog highlighting
UCL CENTRE FOR ADVANCED SPATIAL ANALYSIS Mapping London Oliver O Brien and James Cheshire Society of Cartographers 48 th Annual Conference (UCL) 5 September 2012 The Mapping London Blog A blog highlighting
SPATIAL INEQUALITIES IN PUBLIC TRANSPORT AVAILABILITY: INVESTIGATION WITH SMALL-AREA METRICS
 SPATIAL INEQUALITIES IN PUBLIC TRANSPORT AVAILABILITY: INVESTIGATION WITH SMALL-AREA METRICS Research conducted by Yeran Sun and Piyushimita (Vonu) Thakuriah Presented by Obinna C.D. Anejionu INTRODUCTION
1. Richard Milton 2. Steven Gray 3. Oliver O Brien Centre for Advanced Spatial Analysis (UCL)
") UCL CENTRE FOR ADVANCED SPATIAL ANALYSIS Apps Delivering Information to Mass Audiences 1. Richard Milton 2. Steven Gray 3. Oliver O Brien Centre for Advanced Spatial Analysis (UCL) Scott Adams 1995 The
UCL CENTRE FOR ADVANCED SPATIAL ANALYSIS Apps Delivering Information to Mass Audiences 1. Richard Milton 2. Steven Gray 3. Oliver O Brien Centre for Advanced Spatial Analysis (UCL) Scott Adams 1995 The
Visualization of Commuter Flow Using CTPP Data and GIS
 Visualization of Commuter Flow Using CTPP Data and GIS Research & Analysis Department Southern California Association of Governments 2015 ESRI User Conference l July 23, 2015 l San Diego, CA Jung Seo,
Visualization of Origin- Destination Commuter Flow Using CTPP Data and ArcGIS
 Visualization of Origin- Destination Commuter Flow Using CTPP Data and ArcGIS Research & Analysis Department Southern California Association of Governments 2015 ESRI User Conference l July 23, 2015 l San
Encapsulating Urban Traffic Rhythms into Road Networks
 Encapsulating Urban Traffic Rhythms into Road Networks Junjie Wang +, Dong Wei +, Kun He, Hang Gong, Pu Wang * School of Traffic and Transportation Engineering, Central South University, Changsha, Hunan,
Canadian Historical GIS Partnership Development: Taking Steps for Historical Mapping in Canada
 Canadian Historical GIS Partnership Development: Taking Steps for Historical Mapping in Canada Byron Moldofsky Manager, GIS and Cartography Office Department of Geography and Planning University of Toronto
What are we like? Population characteristics from UK censuses. Justin Hayes & Richard Wiseman UK Data Service Census Support
 What are we like? Population characteristics from UK censuses Justin Hayes & Richard Wiseman UK Data Service Census Support Who are we? Richard Wiseman UK Data Service / Jisc Justin Hayes UK Data Service
Cartographic Skills. L.O. To be aware of the various cartographic skills and when to use them
 Cartographic Skills L.O. To be aware of the various cartographic skills and when to use them Cartographic Skills The term cartography is derived from two words: Carto = map graphy = write/draw Cartography
A Guide to Census Geography
 Research Briefing 2013-05 July 2013 A Guide to Census Geography Contents 1 About this Briefing... 3 2 Sub Ward Geography... 3 3 The Geographical Hierarchies... 3 4 The Statistical Hierarchy... 4 5 Nesting...
Hennig, B.D. and Dorling, D. (2014) Mapping Inequalities in London, Bulletin of the Society of Cartographers, 47, 1&2,
 Mapping Inequalities in London, Bulletin of the Society of Cartographers, 47, 1&2,") Hennig, B.D. and Dorling, D. (2014) Mapping Inequalities in London, Bulletin of the Society of Cartographers, 47, 1&2, 21-28. Pre- publication draft without figures Mapping London using cartograms The
Hennig, B.D. and Dorling, D. (2014) Mapping Inequalities in London, Bulletin of the Society of Cartographers, 47, 1&2, 21-28. Pre- publication draft without figures Mapping London using cartograms The
Census Transportation Planning Products (CTPP)
") Census Transportation Planning Products (CTPP) Penelope Weinberger CTPP Program Manager - AASHTO September 15, 2010 1 What is the CTPP Program Today? The CTPP is an umbrella program of data products, custom
Census Transportation Planning Products (CTPP) Penelope Weinberger CTPP Program Manager - AASHTO September 15, 2010 1 What is the CTPP Program Today? The CTPP is an umbrella program of data products, custom
FHWA Planning Data Resources: Census Data Planning Products (CTPP) HEPGIS Interactive Mapping Portal
 HEPGIS Interactive Mapping Portal") FHWA Planning Data Resources: Census Data Planning Products (CTPP) HEPGIS Interactive Mapping Portal Jeremy Raw, P.E. FHWA, Office of Planning, Systems Planning and Analysis August 2017 Outline Census
FHWA Planning Data Resources: Census Data Planning Products (CTPP) HEPGIS Interactive Mapping Portal Jeremy Raw, P.E. FHWA, Office of Planning, Systems Planning and Analysis August 2017 Outline Census
Understanding and accessing 2011 census aggregate data
 Understanding and accessing 2011 census aggregate data 4 July 11:00 to 16:00 BST Justin Hayes and Richard Wiseman UK Data Service Census Support UK censuses provide an unparalleled resource of high quality
Smart Cities & Big Data How We Can Make Cities More Resilient
 July 15 th 19 th 2012 University College Dublin Smart Cities & Big Data How We Can Make Cities More Resilient Michael Batty m.batty@ucl.ac.uk @jmichaelbatty http://www.spatialcomplexity.info/ http://www.casa.ucl.ac.uk/
Infrastructure to Explore Geographic Systems through Models and Maps
 Exemplar 1: GeoVUE Then GENeSIS (GENerative e SocIalScience) Infrastructure to Explore Geographic Systems through Models and Maps Michael Batty University College London m.batty@ucl.ac.uk http://www.casa.ucl.ac.uk/
Spatial and Socioeconomic Analysis of Commuting Patterns in Southern California Using LODES, CTPP, and ACS PUMS
 Spatial and Socioeconomic Analysis of Commuting Patterns in Southern California Using LODES, CTPP, and ACS PUMS Census for Transportation Planning Subcommittee meeting TRB 95th Annual Meeting January 11,
GLA small area population projection methodology
 Update 2017-04 GLA small area population projection methodology 2015-based projections February 2017 Introduction The GLA produces a range of annually updated demographic projections for London. Among
Geospatial Analysis of Job-Housing Mismatch Using ArcGIS and Python
 Geospatial Analysis of Job-Housing Mismatch Using ArcGIS and Python 2016 ESRI User Conference June 29, 2016 San Diego, CA Jung Seo, Frank Wen, Simon Choi and Tom Vo, Research & Analysis Southern California
Big Data Discovery and Visualisation Insights for ArcGIS
 Big Data Discovery and Visualisation Insights for ArcGIS Create Enrich - Collaborate Lee Kum Cheong GIS CONVERSATIONS At Esri, we believe people can do amazing things with applied geography. GIS CONVERSATIONS
An introduction to ArcGIS Maps for Office. Scott Ball & Mike Flanagan
 An introduction to ArcGIS Maps for Office Scott Ball & Mike Flanagan Main takeaways for today Adding the where to your analysis You can learn a lot when you unlock the power of geography in your analytics
Using Social Media for Geodemographic Applications
 Using Social Media for Geodemographic Applications Muhammad Adnan and Guy Lansley Department of Geography, University College London @gisandtech @GuyLansley Web: http://www.uncertaintyofidentity.com Outline
Metrolinx Transit Accessibility/Connectivity Toolkit
 Metrolinx Transit Accessibility/Connectivity Toolkit Christopher Livett, MSc Transportation Planning Analyst Research and Planning Analytics Tweet about this presentation #TransitGIS OUTLINE 1. Who is
Sensitivity of estimates of travel distance and travel time to street network data quality
 Sensitivity of estimates of travel distance and travel time to street network data quality Paul Zandbergen Department of Geography University of New Mexico Outline Street network quality Approaches to
Aileen Buckley, Ph.D. and Charlie Frye
 An Information Model for Maps: Towards Production from GIS Databases Aileen Buckley, Ph.D. and Charlie Frye Researchers, ESRI GIS vs. cart GIS Outline of the presentation Introduction Differences between
2016 New Ward Boundaries Guidance on calculating statistics for the new 2016 wards
 2016 New Ward Boundaries Page 1 Performance, Information and Intelligence 2016 New Ward Boundaries Guidance on calculating statistics for the new 2016 wards Briefing Note Version 2 - March 2016 2016 New
You are Building Your Organization s Geographic Knowledge
 You are Building Your Organization s Geographic Knowledge And Increasingly Making it Available Sharing Data Publishing Maps and Geo-Apps Developing Collaborative Approaches Citizens Knowledge Workers Analysts
Network Analysis Services in ArcGIS Enterprise. Deelesh Mandloi
 Network Analysis Services in ArcGIS Enterprise Deelesh Mandloi Slides from this demo theater http://esriurl.com/uc17nas Agenda Network Analyst concepts ArcGIS Enterprise publishing workflow - Geoprocessing
Your web browser (Safari 7) is out of date. For more security, comfort and. the best experience on this site: Update your browser Ignore
 is out of date. For more security, comfort and. the best experience on this site: Update your browser Ignore") Your web browser (Safari 7) is out of date. For more security, comfort and Activityengage the best experience on this site: Update your browser Ignore Introduction to GIS What is a geographic information
Your web browser (Safari 7) is out of date. For more security, comfort and Activityengage the best experience on this site: Update your browser Ignore Introduction to GIS What is a geographic information
GIS for ChEs Introduction to Geographic Information Systems
 GIS for ChEs Introduction to Geographic Information Systems AIChE Webinar John Cirucci 1 GIS for ChEs Introduction to Geographic Information Systems What is GIS? Tools and Methods Applications Examples
Regionalizing and Understanding Commuter Flows: An Open Source Geospatial Approach
 Regionalizing and Understanding Commuter Flows: An Open Source Geospatial Approach Lorraine Barry School of Natural and Built Environment, Queen's University Belfast l.barry@qub.ac.uk January 2017 Summary
Visualizing Geospatial Graphs
 Visualizing Geospatial Graphs An introduction to visualizing geospatial graph data with KeyLines Geospatial www.cambridge-intelligence.com USA: +1 (775) 842-6665 UK: +44 (0)1223 362 000 Cambridge Intelligence
Introducing the WISERD Geoportal. WISERD DATA TEAM Dr Robert Berry & Dr Richard Fry, University of Glamorgan Dr Scott Orford, Cardiff University
 Introducing the WISERD Geoportal WISERD DATA TEAM Dr Robert Berry & Dr Richard Fry, University of Glamorgan Dr Scott Orford, Cardiff University WISERD What is WISERD? Wales Institute of Social and Economic
? 4. Like number bonds, a formula is useful because it helps us know what operation to use depending on which pieces of information we have.
 UNIT SIX DECIMALS LESSON 168 PROBLEM-SOLVING You ve covered quite a distance in your journey through our number system, from whole numbers through fractions, to decimals. Today s math mysteries all have
Urban Form and Travel Behavior:
 Urban Form and Travel Behavior: Experience from a Nordic Context! Presentation at the World Symposium on Transport and Land Use Research (WSTLUR), July 28, 2011 in Whistler, Canada! Petter Næss! Professor
Assessing spatial distribution and variability of destinations in inner-city Sydney from travel diary and smartphone location data
 Assessing spatial distribution and variability of destinations in inner-city Sydney from travel diary and smartphone location data Richard B. Ellison 1, Adrian B. Ellison 1 and Stephen P. Greaves 1 1 Institute
Smart Cities, Data and Big Data
 Urban and Regional Planning for Urban Design October 2015 Smart Cities, Data and Big Data Michael Batty m.batty@ucl.ac.uk @jmichaelbatty http://www.complexcity.info/ http://www.spatialcomplexity.info/
The Geography of Travel to Work in England and Wales: Extracts from the 2011 Census
 Appl. Spatial Analysis (2017) 10:457 473 DOI 10.1007/s12061-016-9196-0 The Geography of Travel to Work in England and Wales: Extracts from the 2011 Census Alasdair Rae 1 Received: 5 July 2015 / Accepted:
ArcGIS Online Analytics. Mike Flanagan
 ArcGIS Online Analytics Mike Flanagan MFlanagan@esri.com Agenda Introduction to ArcGIS Online Spatial Analysis ArcGIS Online Spatial Analysis Workflow Demos and Examples Wrap-up Q&A ArcGIS A complete web
A route map to calibrate spatial interaction models from GPS movement data
 A route map to calibrate spatial interaction models from GPS movement data K. Sila-Nowicka 1, A.S. Fotheringham 2 1 Urban Big Data Centre School of Political and Social Sciences University of Glasgow Lilybank
Exploring Digital Welfare data using GeoTools and Grids
 Exploring Digital Welfare data using GeoTools and Grids Hodkinson, S.N., Turner, A.G.D. School of Geography, University of Leeds June 20, 2014 Summary As part of the Digital Welfare project [1] a Java
Introduction to ArcGIS Maps for Office. Greg Ponto Scott Ball
 Introduction to ArcGIS Maps for Office Greg Ponto Scott Ball Agenda What is Maps for Office? Platform overview What are Apps for the Office? ArcGIS Maps for Office features - Visualization - Geoenrichment
Geographic Data Science - Lecture II
 Geographic Data Science - Lecture II (New) Spatial Data Dani Arribas-Bel "Yesterday" Introduced the (geo-)data revolution What is it? Why now? The need of (geo-)data science to make sense of it all Today
WeatherCloud Hyper-Local Global Forecasting All rights reserved. Fathym, Inc.
 WeatherCloud Hyper-Local Global Forecasting based on current forecast techniques EVOLVING FORECASTING TECHNOLOGY 1) The WeatherCloud backend forecast system allows for routing around hazardous weather
2016 New Ward Boundaries Guidance on calculating statistics for the new 2016 wards
 2016 New Ward Boundaries Page 1 Performance, Information and Intelligence 2016 New Ward Boundaries Guidance on calculating statistics for the new 2016 wards Briefing Note February 2016 2016 New Ward Boundaries
Spatiotemporal Analysis of Commuting Patterns: Using ArcGIS and Big Data
 Spatiotemporal Analysis of Commuting Patterns: Using ArcGIS and Big Data 2017 ESRI User Conference July 13, 2017 San Diego, VA Jung Seo, Tom Vo, Frank Wen and Simon Choi Research & Analysis Southern California
URBAN TRANSPORTATION SYSTEM (ASSIGNMENT)
") BRANCH : CIVIL ENGINEERING SEMESTER : 6th Assignment-1 CHAPTER-1 URBANIZATION 1. What is Urbanization? Explain by drawing Urbanization cycle. 2. What is urban agglomeration? 3. Explain Urban Class Groups.
BRANCH : CIVIL ENGINEERING SEMESTER : 6th Assignment-1 CHAPTER-1 URBANIZATION 1. What is Urbanization? Explain by drawing Urbanization cycle. 2. What is urban agglomeration? 3. Explain Urban Class Groups.
Annual Conference. 22nd May, 2018 QEII Conference Centre, London
 2018 Annual Conference 22nd May, 2018 QEII Conference Centre, London Join us at the Esri UK Annual Conference 2018 The UK s premier GIS event brings together around 2500 GIS analysts and data scientists
Population 24/7 Download: User Guide. Purpose
 Population 24/7 Download: User Guide Purpose The Population 24/7 Download application is designed to enable a user to navigate around a map of England and Wales; select an area of interest represented
TOWARDS THE DEVELOPMENT OF A MONITORING SYSTEM FOR PLANNING POLICY Residential Land Uses Case study of Brisbane, Melbourne, Chicago and London
 TOWARDS THE DEVELOPMENT OF A MONITORING SYSTEM FOR PLANNING POLICY Residential Land Uses Case study of Brisbane, Melbourne, Chicago and London Presented to CUPUM 12 July 2017 by Claire Daniel Urban Planning/Data
Geographic Systems and Analysis
 Geographic Systems and Analysis New York University Robert F. Wagner Graduate School of Public Service Instructor Stephanie Rosoff Contact: stephanie.rosoff@nyu.edu Office hours: Mondays by appointment
Outdoor Recreation Valuation (ORVal) User Guide
 User Guide") Outdoor Recreation Valuation (ORVal) User Guide Version 1.0 June 2016 Land, Environment, Economics and Policy (LEEP) Institute College of Social Sciences and International Studies University of Exeter
Outdoor Recreation Valuation (ORVal) User Guide Version 1.0 June 2016 Land, Environment, Economics and Policy (LEEP) Institute College of Social Sciences and International Studies University of Exeter
Regional Snapshot Series: Transportation and Transit. Commuting and Places of Work in the Fraser Valley Regional District
 Regional Snapshot Series: Transportation and Transit Commuting and Places of Work in the Fraser Valley Regional District TABLE OF CONTENTS Complete Communities Daily Trips Live/Work Ratio Commuting Local
Mapping Accessibility Over Time
 Journal of Maps, 2006, 76-87 Mapping Accessibility Over Time AHMED EL-GENEIDY and DAVID LEVINSON University of Minnesota, 500 Pillsbury Drive S.E., Minneapolis, MN 55455, USA; geneidy@umn.edu (Received
Advances in Geographic Data Science and Urban Analytics
 Advances in Geographic Data Science and Urban Analytics Alex Singleton Professor of Geographic Information Science Department of Geography and Planning Consumer Data Research Centre www.cdrc.ac.uk www.geographicdatascience.com
A More Comprehensive Vulnerability Assessment: Flood Damage in Virginia Beach
 A More Comprehensive Vulnerability Assessment: Flood Damage in Virginia Beach By Raj Shah GIS in Water Resources Fall 2017 Introduction One of the most obvious effects of flooding events is death. Humans
A Land Use Transport Model for Greater London:
 Spatio-Temporal Analysis of Network Data and Road Developments Launch Event Workshop UCL Monday 18 May 2009 A Land Use Transport Model for Greater London: With Applications to an Integrated Assessment
CUNY Tax Lots, New York NY, Sept 2016
 Page 1 of 6 Metadata format: ISO 19139 CUNY Tax Lots, New York NY, Sept 2016 ISO 19139 metadata content Resource Identification Information Spatial Representation Information Reference System Information
Speakers: Jeff Price, Federal Transit Administration Linda Young, Center for Neighborhood Technology Sofia Becker, Center for Neighborhood Technology
 Speakers: Jeff Price, Federal Transit Administration Linda Young, Center for Neighborhood Technology Sofia Becker, Center for Neighborhood Technology Peter Haas, Center for Neighborhood Technology Craig
NATIONAL SCALE MODELLING TO TEST UK POPULATION GROWTH AND INFRASTRUCTURE SCENARIOS
 #103 NATIONAL SCALE MODELLING TO TEST UK POPULATION GROWTH AND INFRASTRUCTURE SCENARIOS ED PARHAM Space Syntax Limited, London, United Kingdom e.parham@spacesyntax.com STEPHEN LAW Space Syntax Limited,
Web GIS: Architectural Patterns and Practices. Shannon Kalisky Philip Heede
 Web GIS: Architectural Patterns and Practices Shannon Kalisky Philip Heede Web GIS Transformation of the ArcGIS Platform Desktop Apps Server GIS Web Maps Web Scenes Layers Web GIS Transformation of the
Dorling fbetw.tex V1-04/12/2012 6:10 P.M. Page xi
 Dorling fbetw.tex V1-04/12/2012 6:10 P.M. Page xi List of figures P.1 Born in England, Scotland or Wales Britain 1981 (four levels each), ward map (wards are used to define most other administrative areas
OFWIM 2017 Annual Conference What Does Web GIS Really Mean for Fish and Wildlife Agencies?
 Content Open Mapping OFWIM 2017 Annual Conference What Does Web GIS Really Mean for Fish and Wildlife Agencies? Imagery Spatial Analysis Mike Bialousz, Esri 3D Data Exploration Real-Time Apps Visualization
Spatiotemporal Analysis of Commuting Patterns in Southern California Using ACS PUMS, CTPP and LODES
 Spatiotemporal Analysis of Commuting Patterns in Southern California Using ACS PUMS, CTPP and LODES 2017 ACS Data Users Conference May 11-12, 2017 Alexandria, VA Jung Seo, Tom Vo, Frank Wen and Simon Choi
Smart Route Recommendations based on Historical GPS Trajectories and Weather Information
 Smart Route Recommendations based on Historical GPS Trajectories and Weather Information Xingzhe Xie1, Kevin Wong2, Hamid Aghajan2 and Wilfried Philips1 1 TELIN IPI iminds, Ghent University, Belgium 2
Integrated Modelling of the Spatial Impacts of Climate Change In Greater London
 Megacities, Vulnerability and Global Climate Change: FAPESP: City of São Paulo, July 20 th 22 nd 2009 Integrated Modelling of the Spatial Impacts of Climate Change In Greater London Michael Batty University
Measuring connectivity in London
 Measuring connectivity in London OECD, Paris 30 th October 2017 Simon Cooper TfL City Planning 1 Overview TfL Connectivity measures in TfL PTALs Travel time mapping Catchment analysis WebCAT Current and
GIS-BASED VISUALIZATION FOR ESTIMATING LEVEL OF SERVICE Gozde BAKIOGLU 1 and Asli DOGRU 2
 Presented at the FIG Congress 2018, May 6-11, 2018 in Istanbul, Turkey GIS-BASED VISUALIZATION FOR ESTIMATING LEVEL OF SERVICE Gozde BAKIOGLU 1 and Asli DOGRU 2 1 Department of Transportation Engineering,
Geography for the 2020 Round of Census
 Boundaries Key Census Data EA Id Population Male Female EA Id Area EA Id Num HH Avg HH size Geography for the 2020 Round of Census Linda Peters, Esri lpeters@esri.com Integration of Statistical and Geospatial
Utilizing Data from American FactFinder with TIGER/Line Shapefiles in ArcGIS
 Utilizing Data from American FactFinder with TIGER/Line Shapefiles in ArcGIS Web Adams, GISP Data Dissemination Specialist U.S. Census Bureau New York Regional Office 1 What We Do Decennial Census Every
Changes in the Spatial Distribution of Mobile Source Emissions due to the Interactions between Land-use and Regional Transportation Systems
 Changes in the Spatial Distribution of Mobile Source Emissions due to the Interactions between Land-use and Regional Transportation Systems A Framework for Analysis Urban Transportation Center University
Spatial Analysis with Web GIS. Rachel Weeden
 Spatial Analysis with Web GIS Rachel Weeden Agenda Subhead goes here Introducing ArcGIS Online Spatial Analysis Workflows Scenarios Other Options Resources ArcGIS is a Platform Making mapping and analytics
Point data in mashups: moving away from pushpins in maps
 Point data in mashups: moving away from pushpins in maps Aidan Slingsby, Jason Dykes, Jo Wood gicentre, City University London Department of Information Science, City University London, Northampton Square,
Understanding the 2011 Census Geographies December 2012
 Introduction Understanding the 2011 Census Geographies December 2012 10 21 Other useful documents: The release of the 2011 Census results has brought with it some changes to the geographies at which we
What is GIS? ESRI Canada. August 2011
 What is GIS? ESRI Canada August 2011 Geography Matters! Environmental Park Management Agriculture Public Utilities Health Care Emergency 911 Real Estate Marketing Environmental What are the effects of
GIS4Graph: a tool for analyzing (geo)graphs applied to study efficiency in a street network
graphs applied to study efficiency in a street network") GIS4Graph: a tool for analyzing (geo)graphs applied to study efficiency in a street network Aurelienne A. S. Jorge 1, Márcio Rossato 2, Roberta B. Bacelar 3, Leonardo B. L. Santos 4 1 Instituto Nacional
GIS4Graph: a tool for analyzing (geo)graphs applied to study efficiency in a street network Aurelienne A. S. Jorge 1, Márcio Rossato 2, Roberta B. Bacelar 3, Leonardo B. L. Santos 4 1 Instituto Nacional
The spatial network Streets and public spaces are the where people move, interact and transact
 The spatial network Streets and public spaces are the where people move, interact and transact The spatial network Cities are big spatial networks that create more of these opportunities Five key discoveries
ROUNDTABLE ON SOCIAL IMPACTS OF TIME AND SPACE-BASED ROAD PRICING Luis Martinez (with Olga Petrik, Francisco Furtado and Jari Kaupilla)
") ROUNDTABLE ON SOCIAL IMPACTS OF TIME AND SPACE-BASED ROAD PRICING Luis Martinez (with Olga Petrik, Francisco Furtado and Jari Kaupilla) AUCKLAND, NOVEMBER, 2017 Objective and approach (I) Create a detailed
ROUNDTABLE ON SOCIAL IMPACTS OF TIME AND SPACE-BASED ROAD PRICING Luis Martinez (with Olga Petrik, Francisco Furtado and Jari Kaupilla) AUCKLAND, NOVEMBER, 2017 Objective and approach (I) Create a detailed
Discovery and Access of Geospatial Resources using the Geoportal Extension. Marten Hogeweg Geoportal Extension Product Manager
 Discovery and Access of Geospatial Resources using the Geoportal Extension Marten Hogeweg Geoportal Extension Product Manager DISCOVERY AND ACCESS USING THE GEOPORTAL EXTENSION Geospatial Data Is Very
Maps as Tools for Visual Analysis of Geospatial Data. Dr. Claus Rinner Department of Geography and Environmental Studies Ryerson University
 Maps as Tools for Visual Analysis of Geospatial Data Dr. Claus Rinner Department of Geography and Environmental Studies Ryerson University 1 Geography and data analytics 80% of all datasets are said to
Instituto de Pesquisas Meteorológicas - IPMet Universidade Estadual Paulista - Unesp
 IPMET WEB GIS APPLICATION FOR SEVERE WEATHER ALERT AND DECISION SUPPORT Jaqueline Murakami Kokitsu Instituto de Pesquisas Meteorológicas - IPMet Universidade Estadual Paulista - Unesp IPMet/Unesp Meteorological
Evaluating Travel Impedance Agreement among Online Road Network Data Providers
 Evaluating Travel Impedance Agreement among Online Road Network Data Providers Derek Marsh Eric Delmelle Coline Dony Department of Geography and Earth Sciences University of North Carolina at Charlotte
Merging statistics and geospatial information
 Merging statistics and geospatial information Demography / Commuting / Spatial planning / Registers Mirosław Migacz Chief GIS Specialist Janusz Dygaszewicz Director Central Statistical Office of Poland
Developing Built Environment Indicators for Urban Oregon. Dan Rubado, MPH EPHT Epidemiologist Oregon Public Health Division
 Developing Built Environment Indicators for Urban Oregon Dan Rubado, MPH EPHT Epidemiologist Oregon Public Health Division What is the built environment? The built environment encompasses spaces and places
Analyzing the Market Share of Commuter Rail Stations using LEHD Data
 Analyzing the Market Share of Commuter Rail Stations using LEHD Data Using Census Data for Transportation Applications Conference, Irvine, CA October 26, 2011 1. What is the size of Metrolink s commute
Map reading made easy
 Map reading made easy 1 1. What is a map? A map is simply a drawing or picture (in 2-D) of a landscape or area of a country (in 3-D). It could be anything from a sketch map for a visitor to find your school
Spatial Analysis and Modeling (GIST 4302/5302) Guofeng Cao Department of Geosciences Texas Tech University
 Guofeng Cao Department of Geosciences Texas Tech University") Spatial Analysis and Modeling (GIST 4302/5302) Guofeng Cao Department of Geosciences Texas Tech University TTU Graduate Certificate Geographic Information Science and Technology (GIST) 3 Core Courses and
Spatial Analysis and Modeling (GIST 4302/5302) Guofeng Cao Department of Geosciences Texas Tech University TTU Graduate Certificate Geographic Information Science and Technology (GIST) 3 Core Courses and
Integrating GIS into Food Access Analysis
 GIS Day at Kansas University Integrating GIS into Food Access Analysis Daoqin Tong School of Geography and Development Outline Introduction Research questions Method Results Discussion Introduction Food
Geography of modal choice to access Politecnico di Milano university campuses
 to access Politecnico di Milano university campuses Alberto Bertolin 1, Samuel Tolentino 1, Paolo Beria 1, Eleonora Perotto 2 1 DAStU, Politecnico di Milano, Via Bonardi 3, 20133, Milano, Italy 2 Direzione
PLANNING FOR TOD IN SMART CITIES
 PLANNING FOR TOD IN SMART CITIES Making transit a preferred choice, not the only choice! Dr. Yamini J. Singh*, Dr. Johannes Flacke^ and Prof. M.F.A.M. van Maarseveen^ * Founder Director, Planit, The Netherlands
vizlib: Using The Seven Stages of Visualization to Explore Population Trends and Processes in Local Authority Research
 vizlib: Using The Seven Stages of Visualization to Explore Population Trends and Processes in Local Authority Research Robert Radburn, Jason Dykes, Jo Wood gicentre, School of Informatics, City University
Welcome! Power BI User Group (PUG) Copenhagen
 Copenhagen") Welcome! Power BI User Group (PUG) Copenhagen Making Maps in Power BI Andrea Martorana Tusa BI Specialist Welcome to Making maps in Power BI Who am I? First name: Andrea. Last name: Martorana Tusa. Italian,
Welcome! Power BI User Group (PUG) Copenhagen Making Maps in Power BI Andrea Martorana Tusa BI Specialist Welcome to Making maps in Power BI Who am I? First name: Andrea. Last name: Martorana Tusa. Italian,
Millennium Cohort Study:
 Millennium Cohort Study: Geographic Identifiers in MCS June 2009 Jon Johnson Centre for Longitudinal Studies Faculty of Policy and Society Institute of Education, University of London Page 1 Introduction
Profiling Burglary in London using Geodemographics. Chris Gale 1, Alex Singleton 2, Paul Longley 1
 Profiling Burglary in London using Geodemographics Chris Gale 1, Alex Singleton 2, Paul Longley 1 1 2 Geodemographic Classifications A Geodemographic Classification: Simplifies a large and complex body
LAND INFORMATION SYSTEM A TOOL TO KEEP THE REGISTRY OF PLANNING PERMISSION. CASE STUDY OF THE SZCZUTOWO COMMUNE
 INFRASTRUKTURA I EKOLOGIA TERENÓW WIEJSKICH INFRASTRUCTURE AND ECOLOGY OF RURAL AREAS Nr 2/IV/2013, POLSKA AKADEMIA NAUK, Oddział w Krakowie, s. 15 27 Komisja Technicznej Infrastruktury Wsi LAND INFORMATION
Publishing Value Added EO Products as Linked Data
 Publishing Value Added EO Products as Linked Data Massimo Zotti Head of Government & Security SBU, Planetek Italia Pkm002-02-8.2 Planetek Group Roma Bari Athens 2 Key Numbers year 1994 Planetek Group SME
V1.0. Session: Labelled Maps Verification, entering names into a GIS and Google Maps/Earth. Pier-Giorgio Zaccheddu
 Session: Labelled Maps Verification, entering names into a GIS and Google Maps/Earth V1.0 Pier-Giorgio Zaccheddu Federal Agency for Cartography and Geodesy (BKG) Richard-Strauss-Allee 11 60598 Frankfurt
Reference: 4880(DOP.ADA)1136 Subject: Survey on the integration of geographic information systems into postal address development
1136 Subject: Survey on the integration of geographic information systems into postal address development") International Bureau Weltpoststrasse 4 P.O. Box 312 3000 BERNE 15 SWITZERLAND To: Union member countries Regulators Designated operators T +41 31 350 31 11 F +41 31 350 31 10 www.upu.int For information
International Bureau Weltpoststrasse 4 P.O. Box 312 3000 BERNE 15 SWITZERLAND To: Union member countries Regulators Designated operators T +41 31 350 31 11 F +41 31 350 31 10 www.upu.int For information
Urban Planning Word Search Level 1
 Urban Planning Word Search Level 1 B C P U E C O S Y S T E M P A R E U O E U R B A N P L A N N E R T N S T D H E C O U N T Y G E R E R D W R E N I C I T Y C O U N C I L A A A S U G G C I L A G P R I R