AFCEE MAROS 3.0 New Release
|
|
|
- Bernadette Cannon
- 6 years ago
- Views:
Transcription


1 Monitoring and Remediation Optimization System Software 3.0 AFCEE MAROS 3.0 New Release Mindy Vanderford, Ph.D. GSI ENVIRONMENTAL INC Houston and Austin, TX (713) Overview: MAROS 3.0 New Release Goals and Objectives Software Structure and New Features Detailed Descriptions Wrap Up Questions? 2 1
2 MAROS the origin How can we get more meaning from the data we collect? 3 MAROS the origin What makes a good data collection network? 4 2

3 MAROS the origin Good Networks Meets goals Not too much, not too little Reveal what has happened Help prepare for what will happen 5 Method: Good Networks What are we looking for? Variability vs. Consistency Increasing / Decreasing vs. Stable Expected vs. Interesting Moving vs. Stationary Where is most of the mass? RATE SCALE VARIABILITY 6 3


4 Goals: MAROS Reduce monitoring effort Demonstrate Plume Stability Reduce Long-Term O&M Costs Reduce Number of Wells Reduce Sampling Frequency Make Recommendations for improving network for long-term O&M 7 MAROS 2.X Concentration Trends Total mass and distribution Spatial uncertainty Sampling frequency 8 4

5 Goals: MAROS Improve analysis of existing data Demonstrate Remedial Performance Best Choice wells and frequency Support Cessation of Active Remedies Support Exit Strategies Make Recommendations for improving network to attain closure 9 Pantex Monitoring Perched Optimization Groundwater Remedial MAROS 2.2 Action MAROS Objectives 3.0 Limited Individual Well Statistics Limited spatial analysis options Limited User choice and interactivity Usability issues Limited data export options Expanded Individual Well Statistics Improved spatial analysis More User choice and comparison options for spatial analysis Improve Usability More export opportunities and options 10 5
6 Overview: MAROS 3.0 New Release Goals and Objectives Software Structure and New Features Detailed Description Conclusions Questions 11 Data Input Individual Well Analysis Plume-Level Analysis Spatial and Temporal Optimization Data Export 12 6

7

8 Software: Data Input Site Details- Data checker NEW! MAROS 2.2 Monitoring Objectives- NEW! Primary Source, Tail, Delineation Secondary - Sources, Remedy, Delineation Priority COCs Cleanup Goals Priority by Well NEW!


9 17 Software: Data Input Moment Analysis Options Moved to Site Details Export MAROS 3.0 Archive File Data Consolidation First consolidation for Individual Well Analysis Second consolidation under Plume Analysis 18 9
10 19 Software: Individual Well Analysis Summary Statistics NEW! Detection Frequencies Kaplan-Meier Ave., Median, SD. Outliers by Dixon s Shapiro-Wilk Normality Statistical Trends Mann-Kendall Linear Regression 20 10

11 21 Software: Individual Well Analysis Data Sufficiency NEW Location! Attainment of Cleanup Goals Number of Samples to Attain Goals Well Scoring NEW! Individual Well Summary Well Score prioritization Priority COC Detection frequency Median above MCL MK Trend Recent Sample above MCL COV Distribution 22 11


12 Well Priority Decision Logic High scoremost important 23 Software: Individual Well Analysis Export NEW! Screen by Screen - spreadsheet Reports link on screen Graphs link on screen Access Database default export button Note: Export Results here- Data consolidation can change under spatial analysis section
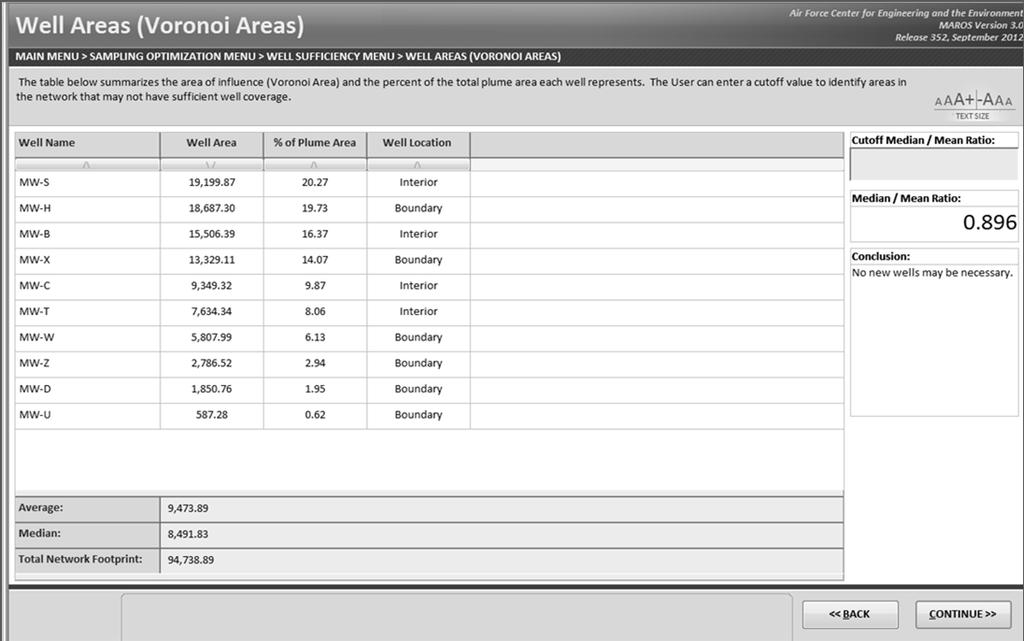
13 25 Spatial Geometry Engine Voronoi Areas/Delaunay Triangles: Estimate mass & distribution of mass Spatial Uncertainty 13
14 Software: Plume-Level Analysis Moment Analysis Expanded Data Input Choice- NEW!* Wells to include Missing Sample Events Data Consolidation Moments As in MAROS 2.2 * Requires new data consolidation 27 Software: Plume-Level Analysis Percent Mass by Well NEW! Voronoi Area Estimate mass in well area Percent mass and area each well monitors 28 14


15 29 Software: Plume-Level Analysis MAROS Analysis Aggregate Trends Source and Tail Two custom groups NEW! Aggregate MK Trend % Mass for the well group NEW! Monitoring System Category 30 15
16
17 Moment Analysis Choose Wells & Data range Calculate Voronoi Area Compare original network to new network Spatial Optimization Calculate SF, RE, COV Good Networks Wells evenly spaced Low uncertainty between wells Each well has purpose Rank Wells Recommend New Locations Recommend Wells to Eliminate Return to Moment Analysis to Test New Network 33 Software: Optimization Optimization Spatial Slope Factor/Delaunay Decision Logic NEW! Frequency Individual Well Network Level NEW! *Note: Data Consolidation from Plume-Level Analysis 34 17
18 Software: Spatial Optimization Spatial Optimization Slope Factor/Delaunay From MAROS 2.2 Decision Logic NEW! Voronoi Areas Slope Factor and Relative Error Concentration 35 Software: Spatial Optimization Spatial Optimization Decision Logic NEW! Interactive Multiple Well Configurations Well Sufficiency Well Redundancy 36 18

19 Software: Spatial Optimization Decision Logic NEW! Uncertainty High SF, RE, COV new well Low SF, RE, COV - redundant Voronoi Area Large new well Small redundant Interior vs. Hull wells Trends
20 Software: Spatial Optimization Spatial Optimization Well Redundancy Lowest 25% Rank User can choose to eliminate Return to Moment Analysis Re-run stats 39 Software: Optimization Optimization Frequency Individual Well Network Level NEW! 40 20
21 Software: Optimization Individual Well Sampling Frequency Summary info NEW! Reporting Frequency Travel Time Current Sampling Frequency Modified CES Method 41 Software: Optimization Network Sampling Frequency NEW! Based on Zeroth Moment Rate of change of mass Coefficient of variation Correlation (R2) Recommendation 42 21
22 43 Software: Export Options MAROS Output Screen by Screen spreadsheet cut and paste as you go Reports Print as you go Output view and print reports Graphs View and Print 44 22
23 Software: Export Options MAROS Output Excel Tables Multiple tables default Single Tables Access Database Multiple Tables default User choses Tables
24 QUESTIONS? 47 Overview: MAROS 3.0 New Release Goals and Objectives Software Structure and New Features Detailed Description Conclusions 48 24
25 Overview: MAROS 3.0 New Release Detailed Description- New Features Individual Well Statistics Plume-Level Analysis Optimization
26 Software: Individual Well Statistics Individual Well Concentrations Summary Statistics Statistical Trends Attainment of Goals Well Score How much? How often? When? Where? Lognormal? Normal? Outliers? Increasing or Decreasing? Variable? Clean? Important? 51 Software: Individual Well Analysis Summary Statistics NEW! Detection Frequencies Kaplan-Meier Ave., Median, SD. Outliers by Dixon s Shapiro-Wilk Normality 52 26


27


28 55 Summary Statistics Export Spreadsheet Export Database Export Reports Export Graphs 56 28
29 57 Software: Plume-Level Analysis Plume-Level Analysis Moment Analysis Well % Mass & Area Trend by Area Mass by Area How much mass? Where? How is it changing? Which wells monitor the most mass? Which wells monitor the most area? Increasing or Decreasing? Variable? 58 29


30 Software: Moment Analysis User Choice More User Choice Well Choice Time Frame/Sample Events Missing Sample Results 59 Software: Moment Analysis 60 30
![Software: Plume Mass by Well Voronoi Area Mass = Area * [C] * Thickness * Porosity](/docs-images/76/73037919/images/31-2.jpg "61 Software: Plume Mass by Well Choose Sample Event % Plume Mass % Plume Area 62")
31 Software: Plume Mass by Well Voronoi Area Mass = Area * [C] * Thickness * Porosity 61 Software: Plume Mass by Well Choose Sample Event % Plume Mass % Plume Area 62 31


32 Software: Plume Area Trends Plume Area Trends Source Wells Tail Wells 2 Custom Groups Choose Wells 63 Software: Plume Area Trends 64 32
33 65 Software: Spatial Optimization Spatial Optimization Decision Logic Theory Spatial Optimization is dependent on goals of the program It is hard to automate diverse goals. Give the User useful information to make their own decisions
34 Software: Spatial Optimization Spatial Optimization Slope Factor Delaunay Triangulation Voronoi Areas Relative Error and Variability Trends Concentration Uncertainty between wells? Size of monitoring area? Variability in uncertainty? Increasing or Decreasing? Variable? Magnitude of concentration? 67 Moment Analysis Choose Wells & Data range Calculate Voronoi Area Compare original network to new network Spatial Optimization Calculate SF, RE, COV Good Networks Wells evenly spaced Low uncertainty between wells Each well has purpose Rank Wells Recommend New Locations Recommend Wells to Eliminate Return to Moment Analysis to Test New Network 68 34
35 Software: Spatial Optimization Spatial Optimization Decision Logic NEW! Well Sufficiency Hull vs. Interior Well Downgradient Hull Baseline VA vs. Ave MK Trend COV SF 69 Software: Spatial Optimization Spatial Optimization Uncertainty Slope Factor Uncertainty between points normalized by maximum of estimated or known result Relative Error Uncertainty between points normalized by maximum of known result Coefficient of Variation Variability in uncertainty between points over time 70 35


36 Software: Spatial Optimization Slope Factor and Relative Error N 3 N 2 Delaunay triangle d 02 d 03 d 04 N 0 d 01 N 1 Estimated concentration of node: N 4 Voronoi diagram d 05 N 5 where, M = number of triangles surrounding the node SF 1, well is important; SF 0, well is not important 71 Software: Spatial Optimization Slope Factor and Relative Error N 3 N 2 Delaunay triangle d 02 d 03 d 04 N 0 d 01 N 1 N 4 d 05 Voronoi diagram N 5 Varies over orders of magnitude RE 10000, well is important; RE 0, well is not important COV standard deviation/mean for all sample events 72 36

37

38 Save Table for Later Comparison


39 77 Compare network stats before and after optimization 78 39
40 Software: Frequency Optimization Frequency Optimization Reporting frequency Current Frequency Transport-based Frequency Decision logic How often do I sample now? How fast is groundwater moving? How fast are concentrations changing? Variability? Increasing or Decreasing? Variable? 79 Software: Optimization Optimization Frequency Individual Well Network Level NEW! 80 40

41 Software: Optimization Individual Well Sampling Frequency Summary info NEW! Reporting Frequency Travel Time Current Sampling Frequency Modified CES Method 81 Current Sampling Frequency by well [samples/year] ½ * Distance to source /seepage velocity [years] Network Average 82 41
")
42 Software: Optimization Network Sampling Frequency NEW! Based on Zeroth Moment Rate of change of mass Coefficient of variation Correlation (R2) Recommendation 83 User supplies R 2 and COV cutoff 84 42
 < 0 (negative) < User cutoff >= User Cutoff 2 steps less frequent All >=User < User")

43 85 Slope COV R2 Result All < User cutoff < User Cutoff Keep current sample frequency (Average current) < 0 (negative) < User cutoff >= User Cutoff 2 steps less frequent All >=User < User Cutoff 1 step more frequent cutoff < 0 (negative) >=User cutoff >=User cutoff 1 step less frequent Mass = 0 Do not calculate Minimum of the reporting frequency or the transport-based frequency 86 43
44 Software: Export and Output Export and Output 87 Software: Export Options MAROS Output Screen by Screen spreadsheet cut and paste as you go Reports Print as you go Output view and print reports Graphs Databases 88 44


45 Datasheet View by Screen 89 Reports 90 45


46 Graphs 91 Databases 92 46

47 Pantex Monitoring Perched Optimization Groundwater Remedial MAROS 3.0 Action Objectives Expanded Individual Well Statistics Improved spatial analysis More User choice and comparison options for spatial analysis Improve Usability More export opportunities and options Goals and COC Choice NEW! Individual Statistics NEW! Plume mass by well NEW! Aggregate Trends NEW! Spatial Decision Logic NEW! Travel time data NEW! Frequency Network Level NEW! 93 QUESTIONS? 94 47
Quality Measures Green Light Report Online Management Tool. Self Guided Tutorial
 Quality Measures Green Light Report Online Management Tool Self Guided Tutorial 1 Tutorial Contents Overview Access the QM Green Light Report Review the QM Green Light Report Tips for Success Contact PointRight
Item Reliability Analysis
 Item Reliability Analysis Revised: 10/11/2017 Summary... 1 Data Input... 4 Analysis Options... 5 Tables and Graphs... 5 Analysis Summary... 6 Matrix Plot... 8 Alpha Plot... 10 Correlation Matrix... 11
OECD QSAR Toolbox v.4.1. Step-by-step example for building QSAR model
 OECD QSAR Toolbox v.4.1 Step-by-step example for building QSAR model Background Objectives The exercise Workflow of the exercise Outlook 2 Background This is a step-by-step presentation designed to take
Probability Plots. Summary. Sample StatFolio: probplots.sgp
 STATGRAPHICS Rev. 9/6/3 Probability Plots Summary... Data Input... 2 Analysis Summary... 2 Analysis Options... 3 Uniform Plot... 3 Normal Plot... 4 Lognormal Plot... 4 Weibull Plot... Extreme Value Plot...
CCR RULE GROUNDWATER STATISTICAL METHOD SELECTION CERTIFICATION
 This document summarizes the statistical methods which will be utilized for evaluating groundwater analytical results associated with the s (hereafter referred to as the Hatfield CCR unit ) CCR groundwater
Analysis of Covariance (ANCOVA) with Two Groups
 with Two Groups") Chapter 226 Analysis of Covariance (ANCOVA) with Two Groups Introduction This procedure performs analysis of covariance (ANCOVA) for a grouping variable with 2 groups and one covariate variable. This procedure
Chapter 226 Analysis of Covariance (ANCOVA) with Two Groups Introduction This procedure performs analysis of covariance (ANCOVA) for a grouping variable with 2 groups and one covariate variable. This procedure
OECD QSAR Toolbox v.3.3. Step-by-step example of how to build a userdefined
 OECD QSAR Toolbox v.3.3 Step-by-step example of how to build a userdefined QSAR Background Objectives The exercise Workflow of the exercise Outlook 2 Background This is a step-by-step presentation designed
Math/Stat Classification of Spatial Analysis and Spatial Statistics Operations
 Draft3, April 2012 Math/Stat Classification of Spatial Analysis and Spatial Statistics Operations for MapCalc software distributed by Berry & Associates // Spatial Information Systems Alternative frameworks
Seafloor Litter Analyst 1.0. User Manual
 Seafloor Litter Analyst 1.0 User Manual February 2018 Seafloor Litter Analyst 1.0 User Manual Authors: Eit C.J. van der Meulen (AMO) Ralf van Hal (Wageningen Marine Research) Willem M.G.M. van Loon (Rijkswaterstaat)
Dose-Response Analysis Report
 Contents Introduction... 1 Step 1 - Treatment Selection... 2 Step 2 - Data Column Selection... 2 Step 3 - Chemical Selection... 2 Step 4 - Rate Verification... 3 Step 5 - Sample Verification... 4 Step
Rigorous Evaluation R.I.T. Analysis and Reporting. Structure is from A Practical Guide to Usability Testing by J. Dumas, J. Redish
 Rigorous Evaluation Analysis and Reporting Structure is from A Practical Guide to Usability Testing by J. Dumas, J. Redish S. Ludi/R. Kuehl p. 1 Summarize and Analyze Test Data Qualitative data - comments,
Determination of Density 1
 Introduction Determination of Density 1 Authors: B. D. Lamp, D. L. McCurdy, V. M. Pultz and J. M. McCormick* Last Update: February 1, 2013 Not so long ago a statistical data analysis of any data set larger
Multiple Variable Analysis
 Multiple Variable Analysis Revised: 10/11/2017 Summary... 1 Data Input... 3 Analysis Summary... 3 Analysis Options... 4 Scatterplot Matrix... 4 Summary Statistics... 6 Confidence Intervals... 7 Correlations...
CCR RULE GROUNDWATER STATISTICAL METHOD SELECTION CERTIFICATION
 This document summarizes the statistical methods which will be utilized for evaluating groundwater analytical results associated with the s (hereafter referred to as the Harrison CCR unit ) CCR groundwater
Analysis of 2x2 Cross-Over Designs using T-Tests
 Chapter 234 Analysis of 2x2 Cross-Over Designs using T-Tests Introduction This procedure analyzes data from a two-treatment, two-period (2x2) cross-over design. The response is assumed to be a continuous
CCR RULE GROUNDWATER STATISTICAL METHOD SELECTION CERTIFICATION
 This document summarizes the statistical methods which will be utilized for evaluating groundwater analytical results associated with the s CCR groundwater monitoring program. There are two neighboring
Practical Statistics for the Analytical Scientist Table of Contents
 Practical Statistics for the Analytical Scientist Table of Contents Chapter 1 Introduction - Choosing the Correct Statistics 1.1 Introduction 1.2 Choosing the Right Statistical Procedures 1.2.1 Planning
Transition Passage to Descriptive Statistics 28
 viii Preface xiv chapter 1 Introduction 1 Disciplines That Use Quantitative Data 5 What Do You Mean, Statistics? 6 Statistics: A Dynamic Discipline 8 Some Terminology 9 Problems and Answers 12 Scales of
SADA General Information
 SADA General Information Windows--based freeware designed to integrate scientific models with decision and cost analysis frameworks in a seamless, easy to use environment. Visualization/GIS Custom Analysis
Orien Ori t en a t tion a Webi W nar: ebi CPD Maps 2
 Orientation Webinar: CPD Maps 2 Agenda 1. Background - econ Planning Suite 2. Expanded Planning Data 3. CPD Maps Overview 4. Demonstration Guide Me Wizard Map Selection Identify Tool Printing and Saving
Workshop: Build a Basic HEC-HMS Model from Scratch
 Workshop: Build a Basic HEC-HMS Model from Scratch This workshop is designed to help new users of HEC-HMS learn how to apply the software. Not all the capabilities in HEC-HMS are demonstrated in the workshop
FireFamilyPlus Version 5.0
 FireFamilyPlus Version 5.0 Working with the new 2016 NFDRS model Objectives During this presentation, we will discuss Changes to FireFamilyPlus Data requirements for NFDRS2016 Quality control for data
GIS-T 2010 Building a Successful Geospatial Data Sharing Framework: A Ohio DOT Success Story
 GIS-T 2010 Building a Successful Geospatial Data Sharing Framework: A Ohio DOT Success Story ODOT District 2 GIS John Puente District 1 GIS Coordinator\ Planning Administrator 2 Interoperability 3 District
CCR RULE GROUNDWATER STATISTICAL METHOD SELECTION CERTIFICATION
 This document summarizes the statistical methods which will be utilized for evaluating groundwater analytical results associated with the Pleasants Power Station Coal Combustion Byproduct Landfill and
Turning a research question into a statistical question.
 Turning a research question into a statistical question. IGINAL QUESTION: Concept Concept Concept ABOUT ONE CONCEPT ABOUT RELATIONSHIPS BETWEEN CONCEPTS TYPE OF QUESTION: DESCRIBE what s going on? DECIDE
OECD QSAR Toolbox v.4.0. Tutorial on how to predict Skin sensitization potential taking into account alert performance
 OECD QSAR Toolbox v.4.0 Tutorial on how to predict Skin sensitization potential taking into account alert performance Outlook Background Objectives Specific Aims Read across and analogue approach The exercise
Advanced Forecast. For MAX TM. Users Manual
 Advanced Forecast For MAX TM Users Manual www.maxtoolkit.com Revised: June 24, 2014 Contents Purpose:... 3 Installation... 3 Requirements:... 3 Installer:... 3 Setup: spreadsheet... 4 Setup: External Forecast
Introduction and Descriptive Statistics p. 1 Introduction to Statistics p. 3 Statistics, Science, and Observations p. 5 Populations and Samples p.
 Preface p. xi Introduction and Descriptive Statistics p. 1 Introduction to Statistics p. 3 Statistics, Science, and Observations p. 5 Populations and Samples p. 6 The Scientific Method and the Design of
The econ Planning Suite: CPD Maps and the Con Plan in IDIS for Consortia Grantees Session 1
 The econ Planning Suite: CPD Maps and the Con Plan in IDIS for Consortia Grantees Session 1 1 Training Objectives Use CPD Maps to analyze, assess, and compare levels of need in your community Use IDIS
ncounter PlexSet Data Analysis Guidelines
 ncounter PlexSet Data Analysis Guidelines NanoString Technologies, Inc. 530 airview Ave North Seattle, Washington 98109 USA Telephone: 206.378.6266 888.358.6266 E-mail: info@nanostring.com Molecules That
Creating Empirical Calibrations
 030.0023.01.0 Spreadsheet Manual Save Date: December 1, 2010 Table of Contents 1. Overview... 3 2. Enable S1 Calibration Macro... 4 3. Getting Ready... 4 4. Measuring the New Sample... 5 5. Adding New
GEOGRAPHY 350/550 Final Exam Fall 2005 NAME:
 1) A GIS data model using an array of cells to store spatial data is termed: a) Topology b) Vector c) Object d) Raster 2) Metadata a) Usually includes map projection, scale, data types and origin, resolution
GEOCODING SELF-REPORTED ADDRESSES: LESSONS LEARNED. Karyn Backus CT Department of Public Health
 GEOCODING SELF-REPORTED ADDRESSES: LESSONS LEARNED Karyn Backus CT Department of Public Health GEOCODING ADDRESSES The process of assigning a location to an address Collect the address information Use
M E R C E R W I N WA L K T H R O U G H
 H E A L T H W E A L T H C A R E E R WA L K T H R O U G H C L I E N T S O L U T I O N S T E A M T A B L E O F C O N T E N T 1. Login to the Tool 2 2. Published reports... 7 3. Select Results Criteria...
OECD QSAR Toolbox v.4.1. Tutorial on how to predict Skin sensitization potential taking into account alert performance
 OECD QSAR Toolbox v.4.1 Tutorial on how to predict Skin sensitization potential taking into account alert performance Outlook Background Objectives Specific Aims Read across and analogue approach The exercise
Planning Softproviding Meat User Documentation
 Great ideas are always simple Softproviding simply makes them happen. Planning Softproviding Meat User Documentation Version: 1.00 Date: 24 August 2017 Release: v5.50 Softproviding AG Riehenring 175 CH-4058
A First Course on Kinetics and Reaction Engineering Supplemental Unit S4. Numerically Fitting Models to Data
 Supplemental Unit S4. Numerically Fitting Models to Data Defining the Problem Many software routines for fitting a model to experimental data can only be used when the model is of a pre-defined mathematical
Two problems to be solved. Example Use of SITATION. Here is the main menu. First step. Now. To load the data.
 Two problems to be solved Example Use of SITATION Mark S. Daskin Department of IE/MS Northwestern U. Evanston, IL 1. Minimize the demand weighted total distance (or average distance) Using 10 facilities
Determining the Spread of a Distribution Variance & Standard Deviation
 Determining the Spread of a Distribution Variance & Standard Deviation 1.3 Cathy Poliak, Ph.D. cathy@math.uh.edu Department of Mathematics University of Houston Lecture 3 Lecture 3 1 / 32 Outline 1 Describing
Traffic Forecasting Tool
 Traffic Forecasting Tool Applications for Indiana, Kentucky and Tennessee Statewide Forecasting presented to Southeast Florida Model Users Group presented by Ken Kaltenbach, The Corradino Group November
Building Inflation Tables and CER Libraries
 Building Inflation Tables and CER Libraries January 2007 Presented by James K. Johnson Tecolote Research, Inc. Copyright Tecolote Research, Inc. September 2006 Abstract Building Inflation Tables and CER
Logistic Regression Models to Integrate Actuarial and Psychological Risk Factors For predicting 5- and 10-Year Sexual and Violent Recidivism Rates
 Logistic Regression Models to Integrate Actuarial and Psychological Risk Factors For predicting 5- and 10-Year Sexual and Violent Recidivism Rates WI-ATSA June 2-3, 2016 Overview Brief description of logistic
Section 26.1: Reporting Conventions. Section 26.2: Fluxes Through Boundaries. Section 26.3: Forces on Boundaries
 Chapter 26. Alphanumeric Reporting FLUENT provides tools for computing and reporting integral quantities at surfaces and boundaries. These tools enable you to find the mass flow rate and heat transfer
 NanoDrop One Viewer software NanoDrop One Website. NanoDrop One Website NanoDrop One Viewer software NanoDrop One Website Software System Update Update Update Software, Update Note OK Language Measure
OECD QSAR Toolbox v.3.2. Step-by-step example of how to build and evaluate a category based on mechanism of action with protein and DNA binding
 OECD QSAR Toolbox v.3.2 Step-by-step example of how to build and evaluate a category based on mechanism of action with protein and DNA binding Outlook Background Objectives Specific Aims The exercise Workflow
The Development of a Quality Control and Analysis Application for the ThermoFluor High Throughput Screening Assay
 The Development of a Quality Control and Analysis Application for the ThermoFluor High Throughput Screening Assay Robert B. Nachbar 1 Delphine Collin 2 Jonathan Robinson 1 Thomas J. Mildorf 3 Eugen Buehler
Strategies for dealing with Missing Data
 Institut für Soziologie Eberhard Karls Universität Tübingen http://www.maartenbuis.nl What do we want from an analysis strategy? Simple example We have a theory that working for cash is mainly men s work
TOP MARKET SURVEY INSTRUCTION SHEET. Requirements. Overview
 INSTRUCTION SHEET TOP SURVEY TOP SURVEY INSTRUCTION SHEET Overview For nearly 40 years, the ACA has surveyed member agencies and conducted the Top Collection Market Survey. This survey provides critical
OECD QSAR Toolbox v.3.3. Step-by-step example of how to build and evaluate a category based on mechanism of action with protein and DNA binding
 OECD QSAR Toolbox v.3.3 Step-by-step example of how to build and evaluate a category based on mechanism of action with protein and DNA binding Outlook Background Objectives Specific Aims The exercise Workflow
Spatial Organization of Data and Data Extraction from Maptitude
 Spatial Organization of Data and Data Extraction from Maptitude N. P. Taliceo Geospatial Information Sciences The University of Texas at Dallas UT Dallas GIS Workshop Richardson, TX March 30 31, 2018 1/
A SAS/AF Application For Sample Size And Power Determination
 A SAS/AF Application For Sample Size And Power Determination Fiona Portwood, Software Product Services Ltd. Abstract When planning a study, such as a clinical trial or toxicology experiment, the choice
VolksMeter with one as opposed to two pendulums
 VolksMeter with one as opposed to two pendulums Preface In all of the discussions that follow, remember that a pendulum, which is the seismic element used in the VolksMeter, responds only to horizontal
ProMass Deconvolution User Training. Novatia LLC January, 2013
 ProMass Deconvolution User Training Novatia LLC January, 2013 Overview General info about ProMass Features Basics of how ProMass Deconvolution works Example Spectra Manual Deconvolution with ProMass Deconvolution
TABLES AND FORMULAS FOR MOORE Basic Practice of Statistics
 TABLES AND FORMULAS FOR MOORE Basic Practice of Statistics Exploring Data: Distributions Look for overall pattern (shape, center, spread) and deviations (outliers). Mean (use a calculator): x = x 1 + x
OECD QSAR Toolbox v.4.1. Tutorial of how to use Automated workflow for ecotoxicological prediction
 OECD QSAR Toolbox v.4.1 Tutorial of how to use Automated workflow for ecotoxicological prediction Outlook Aim Automated workflow The exercise Report The OECD QSAR Toolbox for Grouping Chemicals into Categories
Nonparametric Statistics. Leah Wright, Tyler Ross, Taylor Brown
 Nonparametric Statistics Leah Wright, Tyler Ross, Taylor Brown Before we get to nonparametric statistics, what are parametric statistics? These statistics estimate and test population means, while holding
Passing-Bablok Regression for Method Comparison
 Chapter 313 Passing-Bablok Regression for Method Comparison Introduction Passing-Bablok regression for method comparison is a robust, nonparametric method for fitting a straight line to two-dimensional
WeatherHawk Weather Station Protocol
 WeatherHawk Weather Station Protocol Purpose To log atmosphere data using a WeatherHawk TM weather station Overview A weather station is setup to measure and record atmospheric measurements at 15 minute
Determining the Spread of a Distribution
 Determining the Spread of a Distribution 1.3-1.5 Cathy Poliak, Ph.D. cathy@math.uh.edu Department of Mathematics University of Houston Lecture 3-2311 Lecture 3-2311 1 / 58 Outline 1 Describing Quantitative
Hunting for Anomalies in PMU Data
 Hunting for Anomalies in PMU Data BRETT AMIDAN JAMES FOLLUM JEFFERY DAGLE Pacific Northwest National Laboratory NASPI Presentation (October 23, 2014) November 3, 2014 b.amidan@pnnl.gov 1 Big Picture Objective
California. Performance Indicator. Form B Teacher s Guide and Answer Key. Mathematics. Continental Press
 California Performance Indicator Mathematics Form B Teacher s Guide and Answer Key Continental Press Contents Introduction to California Mathematics Performance Indicators........ 3 Answer Key Section
Handout 1: Predicting GPA from SAT
 Handout 1: Predicting GPA from SAT appsrv01.srv.cquest.utoronto.ca> appsrv01.srv.cquest.utoronto.ca> ls Desktop grades.data grades.sas oldstuff sasuser.800 appsrv01.srv.cquest.utoronto.ca> cat grades.data
Determining the Spread of a Distribution
 Determining the Spread of a Distribution 1.3-1.5 Cathy Poliak, Ph.D. cathy@math.uh.edu Department of Mathematics University of Houston Lecture 3-2311 Lecture 3-2311 1 / 58 Outline 1 Describing Quantitative
protein interaction analysis bulletin 6300
 protein interaction analysis bulletin 6300 Guide to SPR Data Analysis on the ProteOn XPR36 System Ruben Luo, Bio-Rad Laboratories, Inc., 2000 Alfred Nobel Drive, Hercules, CA 94547 Kinetic Analysis To
Agilent MassHunter Quantitative Data Analysis
 Agilent MassHunter Quantitative Data Analysis Presenters: Howard Sanford Stephen Harnos MassHunter Quantitation: Batch and Method Setup Outliers, Data Review, Reporting 1 MassHunter Quantitative Analysis
Quality Measures (QM) Report. Self Guided Tutorial
 Report. Self Guided Tutorial") Quality Measures (QM) Report Self Guided Tutorial 1 Tutorial Contents Overview of the QM Online Report Facility Summary Report Resident Drill down Monthly Trend Report Resident Roster Report Printing Reports/Export
Quality Measures (QM) Report Self Guided Tutorial 1 Tutorial Contents Overview of the QM Online Report Facility Summary Report Resident Drill down Monthly Trend Report Resident Roster Report Printing Reports/Export
Bio 183 Statistics in Research. B. Cleaning up your data: getting rid of problems
 Bio 183 Statistics in Research A. Research designs B. Cleaning up your data: getting rid of problems C. Basic descriptive statistics D. What test should you use? What is science?: Science is a way of knowing.(anon.?)
Fog Monitor 100 (FM 100) Extinction Module. Operator Manual
 Extinction Module. Operator Manual") Particle Analysis and Display System (PADS): Fog Monitor 100 (FM 100) Extinction Module Operator Manual DOC-0217 Rev A-1 PADS 2.7.3, FM 100 Extinction Module 2.7.0 5710 Flatiron Parkway, Unit B Boulder,
Particle Analysis and Display System (PADS): Fog Monitor 100 (FM 100) Extinction Module Operator Manual DOC-0217 Rev A-1 PADS 2.7.3, FM 100 Extinction Module 2.7.0 5710 Flatiron Parkway, Unit B Boulder,
EXPLORING FARADAY S LAW
 EXPLORING FARADAY S LAW OBJECTIVE CONTENTS Experimental studies of the Faraday s law of induction. The Faraday s law of induction is examined by observations of the electromotive force (emf) induced in
Ø Set of mutually exclusive categories. Ø Classify or categorize subject. Ø No meaningful order to categorization.
 Statistical Tools in Evaluation HPS 41 Fall 213 Dr. Joe G. Schmalfeldt Types of Scores Continuous Scores scores with a potentially infinite number of values. Discrete Scores scores limited to a specific
Experiment: Oscillations of a Mass on a Spring
 Physics NYC F17 Objective: Theory: Experiment: Oscillations of a Mass on a Spring A: to verify Hooke s law for a spring and measure its elasticity constant. B: to check the relationship between the period
Appendix B Microsoft Office Specialist exam objectives maps
 B 1 Appendix B Microsoft Office Specialist exam objectives maps This appendix covers these additional topics: A Excel 2003 Specialist exam objectives with references to corresponding material in Course
Investigating Models with Two or Three Categories
 Ronald H. Heck and Lynn N. Tabata 1 Investigating Models with Two or Three Categories For the past few weeks we have been working with discriminant analysis. Let s now see what the same sort of model might
Watershed Modeling With DEMs
 Watershed Modeling With DEMs Lesson 6 6-1 Objectives Use DEMs for watershed delineation. Explain the relationship between DEMs and feature objects. Use WMS to compute geometric basin data from a delineated
Agilent MassHunter Quantitative Data Analysis
 Agilent MassHunter Quantitative Data Analysis Presenters: Howard Sanford Stephen Harnos MassHunter Quantitation: Batch Table, Compound Information Setup, Calibration Curve and Globals Settings 1 MassHunter
OECD QSAR Toolbox v.3.4. Step-by-step example of how to build and evaluate a category based on mechanism of action with protein and DNA binding
 OECD QSAR Toolbox v.3.4 Step-by-step example of how to build and evaluate a category based on mechanism of action with protein and DNA binding Outlook Background Objectives Specific Aims The exercise Workflow
Ø Set of mutually exclusive categories. Ø Classify or categorize subject. Ø No meaningful order to categorization.
 Statistical Tools in Evaluation HPS 41 Dr. Joe G. Schmalfeldt Types of Scores Continuous Scores scores with a potentially infinite number of values. Discrete Scores scores limited to a specific number
Linking local multimedia models in a spatially-distributed system
 Linking local multimedia models in a spatially-distributed system I. Miller, S. Knopf & R. Kossik The GoldSim Technology Group, USA Abstract The development of spatially-distributed multimedia models has
OECD QSAR Toolbox v.3.0
 OECD QSAR Toolbox v.3.0 Step-by-step example of how to categorize an inventory by mechanistic behaviour of the chemicals which it consists Background Objectives Specific Aims Trend analysis The exercise
The entire data set consists of n = 32 widgets, 8 of which were made from each of q = 4 different materials.
 One-Way ANOVA Summary The One-Way ANOVA procedure is designed to construct a statistical model describing the impact of a single categorical factor X on a dependent variable Y. Tests are run to determine
EARTHQUAKE ANALYSIS with SAP2000
 EARTHQUAKE ANALYSIS with SAP2000 Prepared by Bob Matthews 2004 Robert Matthews Page 1 EARTHQUAKE ANALYSIS EXAMPLE The earthquake analysis capabilities of SAP2000 are demonstrated using a railroad bridge
Data Reconciliation Techniques
 Data Reconciliation Techniques By using a NIR Analyzer with Chemometrics Software in Fuel Property Analysis. Santanu Talukdar Manager, Engineering Services Part 1 Data Reconciliation Techniques Part 1
What is Statistics? Statistics is the science of understanding data and of making decisions in the face of variability and uncertainty.
 What is Statistics? Statistics is the science of understanding data and of making decisions in the face of variability and uncertainty. Statistics is a field of study concerned with the data collection,
Orange Visualization Tool (OVT) Manual
 Manual") Orange Visualization Tool (OVT) Manual This manual describes the features of the tool and how to use it. 1. Contents of the OVT Once the OVT is open (the first time it may take some seconds), it should
Orange Visualization Tool (OVT) Manual This manual describes the features of the tool and how to use it. 1. Contents of the OVT Once the OVT is open (the first time it may take some seconds), it should
Data Analysis. with Excel. An introduction for Physical scientists. LesKirkup university of Technology, Sydney CAMBRIDGE UNIVERSITY PRESS
 Data Analysis with Excel An introduction for Physical scientists LesKirkup university of Technology, Sydney CAMBRIDGE UNIVERSITY PRESS Contents Preface xv 1 Introduction to scientific data analysis 1 1.1
HASSET A probability event tree tool to evaluate future eruptive scenarios using Bayesian Inference. Presented as a plugin for QGIS.
 HASSET A probability event tree tool to evaluate future eruptive scenarios using Bayesian Inference. Presented as a plugin for QGIS. USER MANUAL STEFANIA BARTOLINI 1, ROSA SOBRADELO 1,2, JOAN MARTÍ 1 1
The Model Building Process Part I: Checking Model Assumptions Best Practice (Version 1.1)
") The Model Building Process Part I: Checking Model Assumptions Best Practice (Version 1.1) Authored by: Sarah Burke, PhD Version 1: 31 July 2017 Version 1.1: 24 October 2017 The goal of the STAT T&E COE
The Model Building Process Part I: Checking Model Assumptions Best Practice (Version 1.1) Authored by: Sarah Burke, PhD Version 1: 31 July 2017 Version 1.1: 24 October 2017 The goal of the STAT T&E COE
Quantifying Weather Risk Analysis
 Quantifying Weather Risk Analysis Now that an index has been selected and calibrated, it can be used to conduct a more thorough risk analysis. The objective of such a risk analysis is to gain a better
1 Introduction to Minitab
 1 Introduction to Minitab Minitab is a statistical analysis software package. The software is freely available to all students and is downloadable through the Technology Tab at my.calpoly.edu. When you
The Model Building Process Part I: Checking Model Assumptions Best Practice
 The Model Building Process Part I: Checking Model Assumptions Best Practice Authored by: Sarah Burke, PhD 31 July 2017 The goal of the STAT T&E COE is to assist in developing rigorous, defensible test
ECLT 5810 Data Preprocessing. Prof. Wai Lam
 ECLT 5810 Data Preprocessing Prof. Wai Lam Why Data Preprocessing? Data in the real world is imperfect incomplete: lacking attribute values, lacking certain attributes of interest, or containing only aggregate
unadjusted model for baseline cholesterol 22:31 Monday, April 19,
 unadjusted model for baseline cholesterol 22:31 Monday, April 19, 2004 1 Class Level Information Class Levels Values TRETGRP 3 3 4 5 SEX 2 0 1 Number of observations 916 unadjusted model for baseline cholesterol
One-Way Analysis of Covariance (ANCOVA)
") Chapter 225 One-Way Analysis of Covariance (ANCOVA) Introduction This procedure performs analysis of covariance (ANCOVA) with one group variable and one covariate. This procedure uses multiple regression
Chapter 225 One-Way Analysis of Covariance (ANCOVA) Introduction This procedure performs analysis of covariance (ANCOVA) with one group variable and one covariate. This procedure uses multiple regression
GMS 8.0 Tutorial MT3DMS Advanced Transport MT3DMS dispersion, sorption, and dual domain options
 v. 8.0 GMS 8.0 Tutorial MT3DMS dispersion, sorption, and dual domain options Objectives Learn about the dispersion, sorption, and dual domain options in MT3DMS Prerequisite Tutorials None Required Components
Bridging Subsurface Geologic Databases with Cross-Sections in GIS
 Bridging Subsurface Geologic Databases with Cross-Sections in GIS Eva E. von Thury ESRI International User Conference Padre Associates, Inc. Project Geologist / GIS Analyst June 29, 2016 Outline Introduction
Importance of regional geological and petrophysical analysis: Bakken/Three Forks formations of the Williston basin North Dakota and Montana
 Importance of regional geological and petrophysical analysis: Bakken/Three Forks formations of the Williston basin North Dakota and Montana Presenter: Stefani Brakenhoff The Discovery Group Team: Bob Cluff,
Algebra Topic Alignment
 Preliminary Topics Absolute Value 9N2 Compare, order and determine equivalent forms for rational and irrational numbers. Factoring Numbers 9N4 Demonstrate fluency in computations using real numbers. Fractions
Measuring relationships among multiple responses
 Measuring relationships among multiple responses Linear association (correlation, relatedness, shared information) between pair-wise responses is an important property used in almost all multivariate analyses.
Variables, distributions, and samples (cont.) Phil 12: Logic and Decision Making Fall 2010 UC San Diego 10/18/2010
 Phil 12: Logic and Decision Making Fall 2010 UC San Diego 10/18/2010") Variables, distributions, and samples (cont.) Phil 12: Logic and Decision Making Fall 2010 UC San Diego 10/18/2010 Review Recording observations - Must extract that which is to be analyzed: coding systems,
Variables, distributions, and samples (cont.) Phil 12: Logic and Decision Making Fall 2010 UC San Diego 10/18/2010 Review Recording observations - Must extract that which is to be analyzed: coding systems,
Perinatal Mental Health Profile User Guide. 1. Using Fingertips Software
 Perinatal Mental Health Profile User Guide 1. Using Fingertips Software July 2017 Contents 1. Introduction... 3 2. Quick Guide to Fingertips Software Features... 3 2.1 Additional information... 3 2.2 Search