OECD QSAR Toolbox v.4.1. Step-by-step example for building QSAR model
|
|
|
- Augustine Ball
- 5 years ago
- Views:
Transcription

1 OECD QSAR Toolbox v.4.1 Step-by-step example for building QSAR model
2 Background Objectives The exercise Workflow of the exercise Outlook 2
3 Background This is a step-by-step presentation designed to take you through the workflow of the Toolbox for building a QSAR model for predicting aquatic toxicity. By now you have some experience in using the Toolbox so there will be multiple key strokes between screen shots. 3
4 Background Objectives The exercise Workflow of the exercise Outlook 4
5 Objectives This presentation demonstrates building a QSAR model for predicting acute toxicity of aldehydes to Tetrahymena pyriformis. The presentation addresses specifically: predicting acute toxicity for a target chemical; building а QSAR model based on the prediction; applying the model to other aldehydes; exporting the predictions to a file; 5
6 Background Objectives The exercise Workflow of the exercise Outlook 6
7 The Exercise This exercise includes the following steps: select a target chemical Furfural, CAS ; extract available experimental results; search for analogues; estimate the 48h-IGC50 for Tetrahymena pyriformis by using trend analysis; improve the data set by either: subcategorizing by Protein binding mechanisms, or assessing the difference between outliers and the target chemical evaluate and save the model; use the model to display its training set, visualize its applicability domain and perform predictions. 7
8 Outlook Background Objectives The exercise Workflow of the exercise 8
9 Workflow of the exercise Remember the Toolbox has 6 modules which are used in a sequential workflow: Input Profiling Data Category Definition Data Gap Filling Report 9
10 Outlook Background Objectives The exercise Workflow of the exercise Input 10

11 Input 1. Click on CAS# 2. Enter CAS# ; 3. Click Search; 11

; 2.")
12 Input Target chemical identity The Toolbox now searches the Toolbox databases and inventories for the presence of the chemical with structure related to the current CAS number. It is displayed as a 2D image. Note it is unselected by default. 1. Mark desired chemical (in case there is only one chemical it is marked by default); 2. Click OK to add chemical in data matrix; 12
13 Input Target chemical identity Target chemical is displayed on the data matrix. To see chemical identification click on the box next to Structure info (see next screen shot). 13


14 Chemical Input Target chemical identity 14
15 Outlook Background Objectives The exercise Workflow of the exercise Input Profiling 15
16 Profiling Profiling the target chemical Select the Profiling methods related to the target endpoint This selects (a green check mark appears) or deselects (green check disappears) profilers. To help the user to choose suitable profiling methods, a new feature has been developed see next slide 16

17 Profiling Profiling the target chemical 17

18 Profiling Profiling the target chemical For this example, select all profilers. 18
19 Profiling Profiling the target chemical The actual profiling will take several seconds depending on the number and type of selected profilers. The results of profiling automatically appeared as a dropdown box under the target chemical (see next screen shot). Green-white rectangles in some result boxes indicate there is more than one profiling result and the field needs to be expanded. 19

20 Profiling Profiles of Furfural 20

21 Profiling Profiles of Furfural 1. Structural boundary of the category; 2. Definition of the used common fragments; 3. Mechanistic justification of the category (Literature tab) 21
22 Outlook Background Objectives The exercise Workflow of the exercise Input Profiling Data 22
23 Data Extracting endpoint values A new functionality for specifying bases containing data with desired endpoint is available (similar to this one for suitable profiling methods). In our case we will use all databases. 1. Go to Data 2. Select all databases 3. Click Gather 23

 to collect All or Endpoint specific")
24 Data Process of collecting data Toxicity information on the target chemical will be electronically collected from the selected datasets. 1. Click OK to read all available data A window with Read data? appears. Now the user could choose (via radio button) to collect All or Endpoint specific data. In our case collect All. 24

25 Data Read data for analogues In this example, an insert window appears stating that there were found 570 data points available for the target chemical appears. Click OK. Data are displayed into the data matrix 25
26 Outlook Background Objectives The exercise Workflow of the exercise Chemical Input Profiling Data Category definition 26
27 Category definition Target endpoint In this exercise we will build a QSAR model to estimate the following endpoint: Ecotoxicological Information#Aquatic Toxicity#Growth#IGC50#48h#Protozoa#Ciliophora#Ciliat ea#tetrahymena pyriformis The initial search for analogues is based on structural similarity by US-EPA categorization 27

28 Category definition Navigate to the target endpoint 1. Use Filter (in green) to type Tetra in the empty field and click Enter; 2. This will open nodes of data matrix to the target endpoint; 3. Highlight the cell that will be filled in (in this case we will reproduce the observed data); 28
29 Category definition Defining US-EPA category The initial search for analogues is based on structural similarity, of US EPA categorization Select US-EPA New Chemical Category Click Define (see next screen shot) 29
; 4.")
30 Category definition Defining US-EPA category 1. Highlight US-EPA New Chemical Categories ; 2. Click Define; 3. Put a tick in the Strict box (see next screen shot); 4. Click OK to confirm the category Aldehydes (Acute toxicity); 30
31 Category definition Defining US-EPA category strict functionality The Strict functionality means that the software will group analogues having ONLY the categories of the target and will exclude the analogues having any other categories according to the profiler used in the grouping method. For example, if the profiling for the target results in Aldehydes (Acute toxicity) ONLY according to US-EPA category, the group of analogues will include Aldehydes (Acute toxicity) ONLY. (See next screen shot) 31
32 Strict Filter Input Category definition Defining US-EPA category strict functionality O O CH3 O CH 3 Cl O O Target CH 3 O CH 3 Phenol OH O Aldehyde O The target and analogues have Aldehydes ONLY according to US-EPA category O Defined Category CH 3 O CH 3 CH 3 O O O Target O O Analogue 1 Analogue 2 Analogue 3 O O Cl CH 3 Analogue 4 Analogue 5 O O CH 3 O CH 3 The OECD QSAR Toolbox for Grouping Chemicals into Categories 32 July 2017 CH3 O
33 Category definition Analogues The Toolbox now identifies all chemicals corresponding to Aldehydes (Acute toxicity) by US-EPA listed in the databases selected under Data. 665 analogues including the target chemical are identified; they form a mechanistic category Aldehydes (Acute toxicity), which will be used for gap filling. 33


34 Category definition Reading data for Analogues The Toolbox will now retrieve those chemicals that have the same structural alert as the target The Toolbox automatically request the user to select the endpoint that should be retrieved The user can either select the specific endpoint or by default choose to retrieve data on all endpoints (see bellow) 34

35 Category definition Summary information for Analogues After a message for number of data collected the experimental results for the target and analogues are inserted into the matrix. 35
36 Outlook Background Objectives The exercise Workflow of the exercise Chemical Input Profiling Data Category definition Data gap filling 36

37 Data Gap Filling (IGC 50 48h of T. pyriformis) Apply Trend analysis 1. Go to Data Gap Filling 2. Highlight the Data gap corresponding to IGC50, Tetrahymena pyriformis under the target chemical; 3. Select Trend analysis; 37
 Apply Trend analysis A message for possible data inconsistency appears It is recommended the")
38 Data Gap Filling (IGC 50 48h of T. pyriformis) Apply Trend analysis A message for possible data inconsistency appears It is recommended the log(1/mol/l) scale to be chosen The resulting plot can be seen on next screen shot 38
 39")
39 Data Gap Filling (IGC 50 48h of T. pyriformis) 39
40 Data Gap Filling (IGC 50 48h of T. pyriformis) Interpreting dots on the graph The resulting plot outlines the experimental results of all analogues (Y axis) according to a descriptor (X axis) with LogKow being the default descriptor (see previous screen shot). The RED dot represents the predicted value for target chemical. The BLUE dots represent the experimental results available for the analogues. The LIGHT BLUE dots (see the following screen shots) represent analogues belonging to different subcategories. 40
41 Data Gap Filling (IGC 50 48h of T. pyriformis) An accurate analysis of data set In this example, the mechanistic properties of the analogues are consistent. Subcategorization can be performed based on protein binding mechanisms. This is the second stage of analogue search - requiring the same interaction mechanism. Acute effects are associated with covalent interaction of chemicals within cell proteins, i.e. with protein binding. Chemicals with a different protein binding mechanism / reactions compared to the target chemical will be removed. 41
42 Data Gap Filling (IGC 50 48h of T. pyriformis) Subcategorisation After the available data has been retrieved, the user can then further subcategorize the results according to the following endpoint-specific subcategorizations: - Acute aquatic toxicity MOA by OASIS - Protein binding by OASIS - Aquatic toxicity classification by ECOSAR These steps are summarized in the next screen shots. The OECD QSAR Toolbox for Grouping Chemicals into Categories July
; 4.")
43 Data Gap Filling (IGC 50 48h of T. pyriformis) Subcategorization 1: Acute aquatic toxicity MOA by OASIS 1. Click Select / filter data; 2. Select Subcategorize; 3. Select Acute aquatic toxicity MOA by OASIS (note there is the same suggestion of appropriate for subcategorization profiles and metabolic simulators); 4. Click Remove selected to eliminate dissimilar to the target chemicals 43

44 Data Gap Filling (IGC 50 48h of T. pyriformis) Subcategorization 2:Protein binding by OASIS 1. Select Protein binding by OASIS ; 2. Click Remove selected to eliminate dissimilar to the target chemicals. 44

45 Data Gap Filling (IGC 50 48h of T. pyriformis) Subcategorization 3: Aquatic toxicity classification by ECOSAR 1. Select Aquatic toxicity classification by ECOSAR ; 2. Click Remove selected to eliminate dissimilar to the target chemicals; 45

46 Data Gap Filling (IGC 50 48h of T. pyriformis) Results after subcategorisation 1. Close Subcategorization window 2. Click Accept prediction ; 3. Click Yes ( No allows to continue with the subcategorization); 46
47 Data Gap Filling (IGC 50 48h of T. pyriformis) Evaluation of the model To assess the model accuracy use: Adequacy (predictions after leave-one-out) Statistics Cumulative frequency Residuals See next four screen shots 47
48 Data Gap Filling (IGC 50 48h of T. pyriformis) Evaluation of the model - Adequacy Position on the last level of document tree 2. Click Adequacy ; 48
 for 95% of analogues are comparable with the variation")
49 Data Gap Filling (IGC 50 48h of T. pyriformis) Evaluation of the model - Cumulative frequency 1. Click Cumulative frequency; The residuals abs (obs-predicted) for 95% of analogues are comparable with the variation of experimental data. 49
50 Data Gap Filling (IGC 50 48h of T. pyriformis) Evaluation of the model - Residuals 1. Click Residuals ; 50
 Evaluation of the model - Statistics 1.")
51 Data Gap Filling (IGC 50 48h of T. pyriformis) Evaluation of the model - Statistics 1. Click Statistics ; 51
 Results after")
52 Data Gap Filling (IGC 50 48h of T. pyriformis) Results after subcategorisation 52
53 Data Gap Filling (IGC 50 48h of T. pyriformis) Save the derived QSAR model To save the new regression model follow these steps: Go to the last row on the Document tree Click on Model/QSAR Select Save model Enter the model name and fill editable fields if necessary Click on OK 53
; 4. Click Save model ; 5.")
54 Data Gap Filling (IGC 50 48h of T. pyriformis) Save the derived QSAR model 1. Click Model/QSAR ; 2. Select Save model ; 3. Type Name of the model and fill fields in the Wizard if necessary (Use Next/Back buttons to navigate within it); 4. Click Save model ; 5. Click OK on the message; 54
55 Outlook Background Objectives The exercise Workflow of the exercise Input Profiling Data Category definition Data gap filling QSAR model 55
SAR ; 4.")
56 Data Gap Filling How to see the derived QSAR? 1. Select a non-gap filling list from the document tree; 2. Note the accepted prediction is inserted into data matrix 3. Click (Q)SAR ; 4. The derived QSAR is listed in the panel with Relevant (Q)SAR models. 56
57 Data Gap Filling How to see the derived QSAR? As seen in the next five screen shots the derived model can be used to: Visualize training set of the model: Visualize the domain of the model: Visualize whether a chemical is in the applicability domain of the model: Enter in Data Gap filling Perform predictions for: Selected chemical All chemicals (in the matrix) Chemicals in domain: 57

58 Data Gap Filling Visualisation of the training set 1. Right Click on the derived QSAR model; 2. Select Show training Set; 3. Note the experimental data is displayed under CAS# of each chemical; 4. The training set can be saved as *.smi file. 58


59 Data Gap Filling Visualisation of model domain 1. Right click on the derived QSAR model; 2. Select Display Domain ; 3. Note the boundaries of the domain are combined logically; 4. If the chemical answers the query of the domain then the current query is a labelled with GREEN tick; 5. Otherwise is labelled with RED cross. 59
SAR ; 3. Right click above the model; 3. Left click on Display domain (see next screen shot). 60")
60 Data Gap Filling Visualisation whether a chemical is in the domain of the model 1. Highlight the cell of one of the analogues (e.g., chemical # 94 in the data matrix; 2. Click on (Q)SAR ; 3. Right click above the model; 3. Left click on Display domain (see next screen shot). 60
61 Data Gap Filling Visualisation whether a chemical is in the domain of the model The chemical is an aldehyde as required by US-EPA categorization group (boundary 1 on next screen shot). The chemical is an aldehyde as required by Acute aquatic toxicity MOA by OASIS group (boundary 2). It can react with protein by Schiff-base formation and should not belong to any of the eliminated mechanistic domains according to Protein binding by OASIS (boundary 3): Michael addition (α,β-aldehydes, Conjugated systems with electron withdrawing groups) SNAr (Activated aryl and heteroaryl compounds) Schiff base formation (Bis aldehydes, Di-substituted α,β-unsaturated aldehydes and Aromatic carbonyl compounds) The chemical is an aldehyde as required by Aquatic toxicity classification by ECOSAR (boundary 4). Another requirement is Log Kow to be >=0.308 and <= 4.77 (boundary 5): 61

 which is red crossed in case of Out of domain (green checked in case of In")
62 Data Gap Filling Visualisation whether a chemical is in the domain of the model The target chemical is out of the model domain due to: Belonging to Reactive unspecified by Acute aquatic toxicity MOA by OASIS, which have been eliminated from the domain (1) Parameter log Kow different from the model boundaries (2) The definitive designation for belonging or not to the domain is the collectible boundary (3) which is red crossed in case of Out of domain (green checked in case of In domain ) 62

63 Data Gap Filling Enter Gap filling Go to target chemical and call (Q)SAR; 1. Mark the model; 2. Click Run; 3. Select Enter Gap filling; 4. Click OK; 5. You are in Gap filling and can operate; 63
 1. Mark the model; 2. Click Run; 3. Select Predict Chemicals in domain; 4.")
64 Data Gap Filling Perform prediction for chemicals in domain (for selected chemical and all chemicals - analogically) 1. Mark the model; 2. Click Run; 3. Select Predict Chemicals in domain; 4. Click OK; 64

65 Data Gap Filling Perform prediction for chemicals in domain The process of applying the model is indicated by status bar on the bottom of the window. The predictions are placed on the matrix. Note there are different signs for the origin of the data: M for experimental data, T for result of Trend analysis, Q for originated from QSAR data. 65
66 Outlook Background Objectives The exercise Workflow of the exercise Input Profiling Data Category definition Data gap filling QSAR model Export QSAR prediction 66
67 Export QSAR results The predictions for the chemicals in the matrix can be exported into a file. In the Endpoint tree right click on Tetrahymena pyriformis (for the endpoint IGC50 48h for Tetrahymena pyriformis) and select Export Data matrix from the context menu (see next three screen shots). 67
68 Export QSAR results 1. Right click on the row of endpoint tree associated with predictions from the QSAR model; 2. Select Export Data matrix (see next screen shot). 68


69 Export QSAR results 1. The nodes from the tree associated with QSAR predictions which will be exported are labelled with check marks; 2. Click Export; 3. Browse to save the folder on your PC; 4. Give a name of the file; 5. Click Save; 6. Click OK when the file is exported. 69

70 Export QSAR results The resulting file in *.csv format can be opened via Microsoft Excel and further analysed. 70
71 Outlook Background Objectives The exercise Workflow of the exercise Input Profiling Data Category definition Data gap filling QSAR model Export QSAR prediction Report 71

72 Report 1. Go to Report ; 2. Select QMRF; 3. Mark the user-defined QSAR model; 4. Click OK; 72


73 Report 1. Navigate through the Wizard to customize the report; 2. Select Create report; 3. Choose QMRF report to create a PDF format of the report; 4. Click Save as; 5. Choose Training set in order to create a MS Excel file (training set of the QSAR along with their data); 6. Click Save as; 73
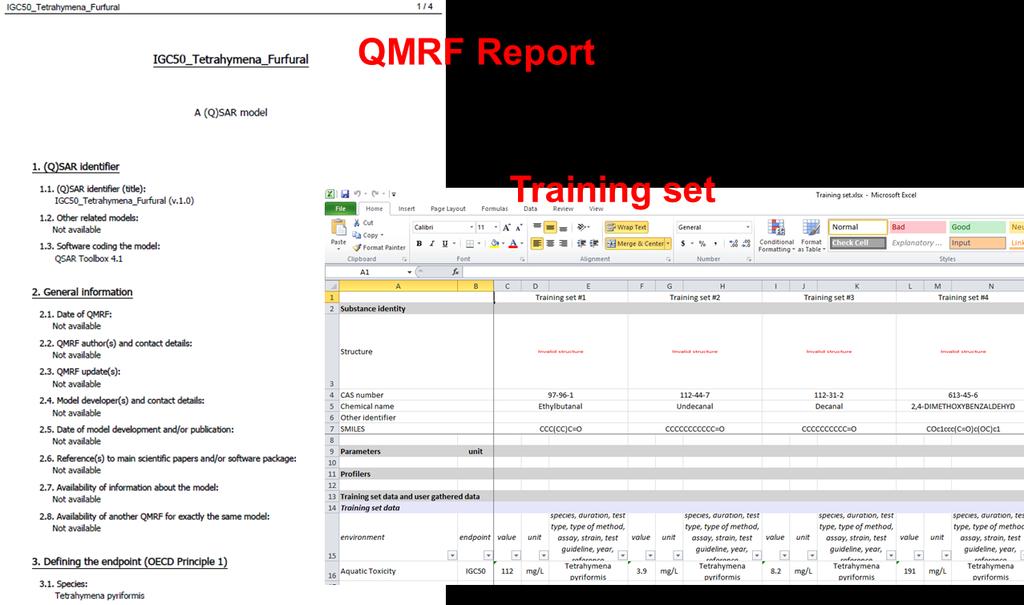

74 Report 74
75 Congratulations You have used the Toolbox to build a user-defined QSAR model. You now know another useful tool in the Toolbox. Continue to practice with this and other tools. Soon you will be comfortable dealing with many situations where the Toolbox is useful. 75
OECD QSAR Toolbox v.3.3. Step-by-step example of how to build a userdefined
 OECD QSAR Toolbox v.3.3 Step-by-step example of how to build a userdefined QSAR Background Objectives The exercise Workflow of the exercise Outlook 2 Background This is a step-by-step presentation designed
OECD QSAR Toolbox v.3.2. Step-by-step example of how to build and evaluate a category based on mechanism of action with protein and DNA binding
 OECD QSAR Toolbox v.3.2 Step-by-step example of how to build and evaluate a category based on mechanism of action with protein and DNA binding Outlook Background Objectives Specific Aims The exercise Workflow
OECD QSAR Toolbox v.3.3. Step-by-step example of how to build and evaluate a category based on mechanism of action with protein and DNA binding
 OECD QSAR Toolbox v.3.3 Step-by-step example of how to build and evaluate a category based on mechanism of action with protein and DNA binding Outlook Background Objectives Specific Aims The exercise Workflow
OECD QSAR Toolbox v.3.4. Step-by-step example of how to build and evaluate a category based on mechanism of action with protein and DNA binding
 OECD QSAR Toolbox v.3.4 Step-by-step example of how to build and evaluate a category based on mechanism of action with protein and DNA binding Outlook Background Objectives Specific Aims The exercise Workflow
OECD QSAR Toolbox v.4.1. Step-by-step example for predicting skin sensitization accounting for abiotic activation of chemicals
 OECD QSAR Toolbox v.4.1 Step-by-step example for predicting skin sensitization accounting for abiotic activation of chemicals Background Outlook Objectives The exercise Workflow 2 Background This is a
OECD QSAR Toolbox v.3.3
 OECD QSAR Toolbox v.3.3 Step-by-step example of how to predict aquatic toxicity to Tetrahymena pyriformis by trend analysis using category pruning capabilities Outlook Background Objectives Specific Aims
OECD QSAR Toolbox v.3.3. Predicting acute aquatic toxicity to fish of Dodecanenitrile (CAS ) taking into account tautomerism
 taking into account tautomerism") OECD QSAR Toolbox v.3.3 Predicting acute aquatic toxicity to fish of Dodecanenitrile (CAS 2437-25-4) taking into account tautomerism Outlook Background Objectives The exercise Workflow Save prediction
OECD QSAR Toolbox v.3.3 Predicting acute aquatic toxicity to fish of Dodecanenitrile (CAS 2437-25-4) taking into account tautomerism Outlook Background Objectives The exercise Workflow Save prediction
OECD QSAR Toolbox v.3.0
 OECD QSAR Toolbox v.3.0 Step-by-step example of how to categorize an inventory by mechanistic behaviour of the chemicals which it consists Background Objectives Specific Aims Trend analysis The exercise
OECD QSAR Toolbox v.3.3. Step-by-step example of how to categorize an inventory by mechanistic behaviour of the chemicals which it consists
 OECD QSAR Toolbox v.3.3 Step-by-step example of how to categorize an inventory by mechanistic behaviour of the chemicals which it consists Background Objectives Specific Aims Trend analysis The exercise
OECD QSAR Toolbox v.4.1. Tutorial of how to use Automated workflow for ecotoxicological prediction
 OECD QSAR Toolbox v.4.1 Tutorial of how to use Automated workflow for ecotoxicological prediction Outlook Aim Automated workflow The exercise Report The OECD QSAR Toolbox for Grouping Chemicals into Categories
OECD QSAR Toolbox v.4.1. Tutorial on how to predict Skin sensitization potential taking into account alert performance
 OECD QSAR Toolbox v.4.1 Tutorial on how to predict Skin sensitization potential taking into account alert performance Outlook Background Objectives Specific Aims Read across and analogue approach The exercise
OECD QSAR Toolbox v.4.1
 OECD QSAR Toolbox v.4.1 Step-by-step example on how to predict the skin sensitisation potential approach of a chemical by read-across based on an analogue approach Outlook Background Objectives Specific
OECD QSAR Toolbox v.3.4
 OECD QSAR Toolbox v.3.4 Step-by-step example on how to predict the skin sensitisation potential approach of a chemical by read-across based on an analogue approach Outlook Background Objectives Specific
OECD QSAR Toolbox v.4.0. Tutorial on how to predict Skin sensitization potential taking into account alert performance
 OECD QSAR Toolbox v.4.0 Tutorial on how to predict Skin sensitization potential taking into account alert performance Outlook Background Objectives Specific Aims Read across and analogue approach The exercise
OECD QSAR Toolbox v.3.3
 OECD QSAR Toolbox v.3.3 Step-by-step example on how to predict the skin sensitisation potential of a chemical by read-across based on an analogue approach Outlook Background Objectives Specific Aims Read
OECD QSAR Toolbox v.4.1. Tutorial illustrating new options for grouping with metabolism
 OECD QSAR Toolbox v.4.1 Tutorial illustrating new options for grouping with metabolism Outlook Background Objectives Specific Aims The exercise Workflow 2 Background Grouping with metabolism is a procedure
OECD QSAR Toolbox v.3.4
 OECD QSAR Toolbox v.3.4 Predicting developmental and reproductive toxicity of Diuron (CAS 330-54-1) based on DART categorization tool and DART SAR model Outlook Background Objectives The exercise Workflow
OECD QSAR Toolbox v.3.4. Example for predicting Repeated dose toxicity of 2,3-dimethylaniline
 OECD QSAR Toolbox v.3.4 Example for predicting Repeated dose toxicity of 2,3-dimethylaniline Outlook Background Objectives The exercise Workflow Save prediction 2 Background This is a step-by-step presentation
OECD QSAR Toolbox v.3.3. Predicting skin sensitisation potential of a chemical using skin sensitization data extracted from ECHA CHEM database
 OECD QSAR Toolbox v.3.3 Predicting skin sensitisation potential of a chemical using skin sensitization data extracted from ECHA CHEM database Outlook Background The exercise Workflow Save prediction 23.02.2015
OECD QSAR Toolbox v.4.1
 OECD QSAR Toolbox v.4. Tutorial illustrating quantitative metabolic information and related functionalities Outlook Aim Background Example for: Visualizing quantitative data within Toolbox user interface
OECD QSAR Toolbox v.4.1. Implementation AOP workflow in Toolbox: Skin Sensitization
 OECD QSAR Toolbox v.4.1 Implementation AOP workflow in Toolbox: Skin Sensitization Outlook Background Objectives Overview of AOP scheme as implemented in the Toolbox The exercise 2 Background AOP concept
OECD QSAR Toolbox v4.0 Simplifying the correct use of non-test methods
 OECD QSAR Toolbox v4.0 Simplifying the correct use of non-test methods Stakeholders Day IT tool training 4 April 2017 Tomasz Sobanski Andrea Gissi Marta Sannicola Computational assessment and dissemination
Case study: Category consistency assessment in Toolbox for a list of Cyclic unsaturated hydrocarbons with respect to repeated dose toxicity.
 Case study: Category consistency assessment in Toolbox for a list of Cyclic unsaturated hydrocarbons with respect to repeated dose toxicity. 1. Introduction The aim of this case study is to demonstrate
QSAR APPLICATION TOOLBOX ADVANCED TRAINING WORKSHOP. BARCELONA, SPAIN 3-4, June 2015 AGENDA
 QSAR APPLICATION TOOLBOX ADVANCED TRAINING WORKSHOP BARCELONA, SPAIN 3-4, June 2015 AGENDA Wednesday, 3 June 2015 (09:00 17:30) 09:00-09:15 Registration Welcome and Introductions/Announcements 09:15-10:00
M E R C E R W I N WA L K T H R O U G H
 H E A L T H W E A L T H C A R E E R WA L K T H R O U G H C L I E N T S O L U T I O N S T E A M T A B L E O F C O N T E N T 1. Login to the Tool 2 2. Published reports... 7 3. Select Results Criteria...
User manual Strategies for grouping chemicals to fill data gaps to assess acute aquatic toxicity endpoints
 User manual Strategies for grouping chemicals to fill data gaps to assess acute aquatic For the latest news and the most up-todate information, please consult the ECHA website. Document history Version
Read-Across or QSARs?
 Replacing Experimentation Read-Across or QSARs? Which one to apply and when? Presented by: Dr. Faizan SAHIGARA Chemical Watch Expo 2017 26th April, 2017 Berlin Germany KREATiS, 23 rue du creuzat, 38080
Regulatory use of (Q)SARs under REACH
SARs under REACH") Regulatory use of (Q)SARs under REACH Webinar on Information requirements 10 December 2009 http://echa.europa.eu 1 Using (Q)SAR models Application under REACH to fulfill information requirements Use of
Regulatory use of (Q)SARs under REACH Webinar on Information requirements 10 December 2009 http://echa.europa.eu 1 Using (Q)SAR models Application under REACH to fulfill information requirements Use of
OECD QSAR Toolbox v.4.1. Tutorial illustrating new options of the structure similarity
 OECD QSAR Toolbox v.4.1 Tutorial illustrating new options of the structure similarity Outlook Background Aims PubChem features The exercise Workflow 2 Background This presentation is designed to familiarize
Space Objects. Section. When you finish this section, you should understand the following:
 GOLDMC02_132283433X 8/24/06 2:21 PM Page 97 Section 2 Space Objects When you finish this section, you should understand the following: How to create a 2D Space Object and label it with a Space Tag. How
Application Note. U. Heat of Formation of Ethyl Alcohol and Dimethyl Ether. Introduction
 Application Note U. Introduction The molecular builder (Molecular Builder) is part of the MEDEA standard suite of building tools. This tutorial provides an overview of the Molecular Builder s basic functionality.
Watershed Modeling Orange County Hydrology Using GIS Data
 v. 10.0 WMS 10.0 Tutorial Watershed Modeling Orange County Hydrology Using GIS Data Learn how to delineate sub-basins and compute soil losses for Orange County (California) hydrologic modeling Objectives
An area chart emphasizes the trend of each value over time. An area chart also shows the relationship of parts to a whole.
 Excel 2003 Creating a Chart Introduction Page 1 By the end of this lesson, learners should be able to: Identify the parts of a chart Identify different types of charts Create an Embedded Chart Create a
Version 1.2 October 2017 CSD v5.39
 Mogul Geometry Check Table of Contents Introduction... 2 Example 1. Using Mogul to assess intramolecular geometry... 3 Example 2. Using Mogul to explain activity data... 5 Conclusions... 8 Further Exercises...
Introduction to ArcGIS 10.2
 Introduction to ArcGIS 10.2 Francisco Olivera, Ph.D., P.E. Srikanth Koka Lauren Walker Aishwarya Vijaykumar Keri Clary Department of Civil Engineering April 21, 2014 Contents Brief Overview of ArcGIS 10.2...
Geodatabases and ArcCatalog
 Geodatabases and ArcCatalog Prepared by Francisco Olivera, Ph.D. and Srikanth Koka Department of Civil Engineering Texas A&M University February 2004 Contents Brief Overview of Geodatabases Goals of the
Calculating Bond Enthalpies of the Hydrides
 Proposed Exercise for the General Chemistry Section of the Teaching with Cache Workbook: Calculating Bond Enthalpies of the Hydrides Contributed by James Foresman, Rachel Fogle, and Jeremy Beck, York College
University of Colorado Denver Anschutz Medical Campus Online Chemical Inventory System User s Manual
 University of Colorado Denver Anschutz Medical Campus Online Chemical Inventory System User s Manual Hazardous Materials Division 303-724-0345 chemical.inventory@ucdenver.edu May, 2017 Table of Contents
Introduction to Structure Preparation and Visualization
 Introduction to Structure Preparation and Visualization Created with: Release 2018-4 Prerequisites: Release 2018-2 or higher Access to the internet Categories: Molecular Visualization, Structure-Based
SuperCELL Data Programmer and ACTiSys IR Programmer User s Guide
 SuperCELL Data Programmer and ACTiSys IR Programmer User s Guide This page is intentionally left blank. SuperCELL Data Programmer and ACTiSys IR Programmer User s Guide The ACTiSys IR Programmer and SuperCELL
Data Mining with the PDF-4 Databases. FeO Non-stoichiometric Oxides
 Data Mining with the PDF-4 Databases FeO Non-stoichiometric Oxides This is one of three example-based tutorials for using the data mining capabilities of the PDF-4+ database and it covers the following
ATLAS of Biochemistry
 ATLAS of Biochemistry USER GUIDE http://lcsb-databases.epfl.ch/atlas/ CONTENT 1 2 3 GET STARTED Create your user account NAVIGATE Curated KEGG reactions ATLAS reactions Pathways Maps USE IT! Fill a gap
Contents. 13. Graphs of Trigonometric Functions 2 Example Example
 Contents 13. Graphs of Trigonometric Functions 2 Example 13.19............................... 2 Example 13.22............................... 5 1 Peterson, Technical Mathematics, 3rd edition 2 Example 13.19
Location Intelligence Infrastructure Asset Management. Confirm. Confirm Mapping Link to ArcMap Version v18.00b.am
 Location Intelligence Infrastructure Asset Management Confirm Confirm Mapping Link to ArcMap Version v18.00b.am Information in this document is subject to change without notice and does not represent a
Geodatabases and ArcCatalog
 Geodatabases and ArcCatalog Francisco Olivera, Ph.D., P.E. Srikanth Koka Lauren Walker Aishwarya Vijaykumar Keri Clary Department of Civil Engineering April 21, 2014 Contents Geodatabases and ArcCatalog...
Tutorial 2: Analysis of DIA data in Skyline
 Tutorial 2: Analysis of DIA data in Skyline In this tutorial we will learn how to use Skyline to perform targeted post-acquisition analysis for peptide and inferred protein detection and quantitation using
Tutorial. Getting started. Sample to Insight. March 31, 2016
 Getting started March 31, 2016 Sample to Insight CLC bio, a QIAGEN Company Silkeborgvej 2 Prismet 8000 Aarhus C Denmark Telephone: +45 70 22 32 44 www.clcbio.com support-clcbio@qiagen.com Getting started
Data Structures & Database Queries in GIS
 Data Structures & Database Queries in GIS Objective In this lab we will show you how to use ArcGIS for analysis of digital elevation models (DEM s), in relationship to Rocky Mountain bighorn sheep (Ovis
User Guide. Affirmatively Furthering Fair Housing Data and Mapping Tool. U.S. Department of Housing and Urban Development
 User Guide Affirmatively Furthering Fair Housing Data and Mapping Tool U.S. Department of Housing and Urban Development December, 2015 1 Table of Contents 1. Getting Started... 5 1.1 Software Version...
Virtual Beach Building a GBM Model
 Virtual Beach 3.0.6 Building a GBM Model Building, Evaluating and Validating Anytime Nowcast Models In this module you will learn how to: A. Build and evaluate an anytime GBM model B. Optimize a GBM model
MassHunter Software Overview
 MassHunter Software Overview 1 Qualitative Analysis Workflows Workflows in Qualitative Analysis allow the user to only see and work with the areas and dialog boxes they need for their specific tasks A
ncounter PlexSet Data Analysis Guidelines
 ncounter PlexSet Data Analysis Guidelines NanoString Technologies, Inc. 530 airview Ave North Seattle, Washington 98109 USA Telephone: 206.378.6266 888.358.6266 E-mail: info@nanostring.com Molecules That
LAB 3 INSTRUCTIONS SIMPLE LINEAR REGRESSION
 LAB 3 INSTRUCTIONS SIMPLE LINEAR REGRESSION In this lab you will first learn how to display the relationship between two quantitative variables with a scatterplot and also how to measure the strength of
Task 1: Open ArcMap and activate the Spatial Analyst extension.
 Exercise 10 Spatial Analyst The following steps describe the general process that you will follow to complete the exercise. Specific steps will be provided later in the step-by-step instructions component
RSC Publishing. Principles and Applications. In Silico Toxicology. Liverpool John Moores University, Liverpool, Edited by
 In Silico Toxicology Principles and Applications Edited by Mark T. D. Cronin and Judith C. Madden Liverpool John Moores University, Liverpool, UK RSC Publishing Contents Chapter 1 In Silico Toxicology
Spatial Data Analysis in Archaeology Anthropology 589b. Kriging Artifact Density Surfaces in ArcGIS
 Spatial Data Analysis in Archaeology Anthropology 589b Fraser D. Neiman University of Virginia 2.19.07 Spring 2007 Kriging Artifact Density Surfaces in ArcGIS 1. The ingredients. -A data file -- in.dbf
protein interaction analysis bulletin 6300
 protein interaction analysis bulletin 6300 Guide to SPR Data Analysis on the ProteOn XPR36 System Ruben Luo, Bio-Rad Laboratories, Inc., 2000 Alfred Nobel Drive, Hercules, CA 94547 Kinetic Analysis To
The Geodatabase Working with Spatial Analyst. Calculating Elevation and Slope Values for Forested Roads, Streams, and Stands.
 GIS LAB 7 The Geodatabase Working with Spatial Analyst. Calculating Elevation and Slope Values for Forested Roads, Streams, and Stands. This lab will ask you to work with the Spatial Analyst extension.
Using the Budget Features in Quicken 2008
 Using the Budget Features in Quicken 2008 Quicken budgets can be used to summarize expected income and expenses for planning purposes. The budget can later be used in comparisons to actual income and expenses
Agilent MassHunter Quantitative Data Analysis
 Agilent MassHunter Quantitative Data Analysis Presenters: Howard Sanford Stephen Harnos MassHunter Quantitation: Batch and Method Setup Outliers, Data Review, Reporting 1 MassHunter Quantitative Analysis
Building Inflation Tables and CER Libraries
 Building Inflation Tables and CER Libraries January 2007 Presented by James K. Johnson Tecolote Research, Inc. Copyright Tecolote Research, Inc. September 2006 Abstract Building Inflation Tables and CER
AFFH-T User Guide September 2017 AFFH-T User Guide U.S. Department of Housing and Urban Development
 AFFH-T User Guide Affirmatively Furthering Fair Housing Data and Mapping Tool v. 4.1 U.S. Department of Housing and Urban Development September 2017 Version 4.1 ❿ September 2017 Page 1 Document History
How to Make or Plot a Graph or Chart in Excel
 This is a complete video tutorial on How to Make or Plot a Graph or Chart in Excel. To make complex chart like Gantt Chart, you have know the basic principles of making a chart. Though I have used Excel
Applying MapCalc Map Analysis Software
 Applying MapCalc Map Analysis Software Generating Surface Maps from Point Data: A farmer wants to generate a set of maps from soil samples he has been collecting for several years. Previously, he would
Consents Resource Consents Map
 Consents Resource Consents Map Select the map from the Maps introduction page http://www.waikatoregion.govt.nz/maps/ If you have the map browser open the Resource Consents map will also display when selected
Comparing whole genomes
 BioNumerics Tutorial: Comparing whole genomes 1 Aim The Chromosome Comparison window in BioNumerics has been designed for large-scale comparison of sequences of unlimited length. In this tutorial you will
Exercises for Windows
 Exercises for Windows CAChe User Interface for Windows Select tool Application window Document window (workspace) Style bar Tool palette Select entire molecule Select Similar Group Select Atom tool Rotate
(THIS IS AN OPTIONAL BUT WORTHWHILE EXERCISE)
") PART 2: Analysis in ArcGIS (THIS IS AN OPTIONAL BUT WORTHWHILE EXERCISE) Step 1: Start ArcCatalog and open a geodatabase If you have a shortcut icon for ArcCatalog on your desktop, double-click it to start
PART 2: Analysis in ArcGIS (THIS IS AN OPTIONAL BUT WORTHWHILE EXERCISE) Step 1: Start ArcCatalog and open a geodatabase If you have a shortcut icon for ArcCatalog on your desktop, double-click it to start
Photometry of Supernovae with Makali i
 Photometry of Supernovae with Makali i How to perform photometry specifically on supernovae targets using the free image processing software, Makali i This worksheet describes how to use photometry to
SRM assay generation and data analysis in Skyline
 in Skyline Preparation 1. Download the example data from www.srmcourse.ch/eupa.html (3 raw files, 1 csv file, 1 sptxt file). 2. The number formats of your computer have to be set to English (United States).
PDF-4+ Tools and Searches
 PDF-4+ Tools and Searches PDF-4+ 2018 The PDF-4+ 2018 database is powered by our integrated search display software. PDF-4+ 2018 boasts 72 search selections coupled with 125 display fields resulting in
Urban Canopy Tool User Guide `bo`
 Urban Canopy Tool User Guide `bo` ADMS Urban Canopy Tool User Guide Version 2.0 June 2014 Cambridge Environmental Research Consultants Ltd. 3, King s Parade Cambridge CB2 1SJ UK Telephone: +44 (0)1223
Tutorial 8 Raster Data Analysis
 Objectives Tutorial 8 Raster Data Analysis This tutorial is designed to introduce you to a basic set of raster-based analyses including: 1. Displaying Digital Elevation Model (DEM) 2. Slope calculations
Module 2A Turning Multivariable Models into Interactive Animated Simulations
 Module 2A Turning Multivariable Models into Interactive Animated Simulations Using tools available in Excel, we will turn a multivariable model into an interactive animated simulation. Projectile motion,
Virtual Beach Making Nowcast Predictions
 Virtual Beach 3.0.6 Making Nowcast Predictions In this module you will learn how to: A. Create a real-time connection to Web data services through EnDDaT B. Download real-time data to make a Nowcast prediction
PDF-4+ Tools and Searches
 PDF-4+ Tools and Searches PDF-4+ 2019 The PDF-4+ 2019 database is powered by our integrated search display software. PDF-4+ 2019 boasts 74 search selections coupled with 126 display fields resulting in
Hot Spot / Point Density Analysis: Kernel Smoothing
 Hot Spot / Point Density Analysis: Kernel Smoothing Revised by Carolyn Talmadge on January 15, 2016 SETTING UP... 1 ENABLING THE SPATIAL ANALYST EXTENSION... 1 SET UP YOUR ANALYSIS OPTIONS IN ENVIRONMENTS...
FireFamilyPlus Version 5.0
 FireFamilyPlus Version 5.0 Working with the new 2016 NFDRS model Objectives During this presentation, we will discuss Changes to FireFamilyPlus Data requirements for NFDRS2016 Quality control for data
MAGNETITE OXIDATION EXAMPLE
 HSC Chemistry 7.0 1 MAGNETITE OXIDATION EXAMPLE Pelletized magnetite (Fe 3 O 4 ) ore may be oxidized to hematite (Fe 2 O 3 ) in shaft furnace. Typical magnetite content in ore is some 95%. Oxidation is
Preparations and Starting the program
 Preparations and Starting the program https://oldwww.abo.fi/fakultet/ookforskning 1) Create a working directory on your computer for your Chemkin work, and 2) download kinetic mechanism files AAUmech.inp
ICM-Chemist How-To Guide. Version 3.6-1g Last Updated 12/01/2009
 ICM-Chemist How-To Guide Version 3.6-1g Last Updated 12/01/2009 ICM-Chemist HOW TO IMPORT, SKETCH AND EDIT CHEMICALS How to access the ICM Molecular Editor. 1. Click here 2. Start sketching How to sketch
-ASTR 204 Application of Astroimaging Techniques
 Lab 5 - JPL Ephemeris, Binary Maker 3 In Lab 5 we ll look at another ephemeris generating tool; Horizons Web-Interface from JPL, and Binary Maker 3 program for generating radial velocity curves and 3-D
REPLACE DAMAGED OR MISSING TEXTBOOK BARCODE LABEL
 Destiny Textbook Manager allows users to create and print replacement barcode labels for textbooks. In this tutorial you will learn how to: Replace damaged textbook barcode label(s) Replace missing textbook
COMPOUND REGISTRATION
 CONTENTS: Register a New Compound Register a New Batch Search for a Compound Edit a Batch/Create a New Lot Create a New Salt and Isotope Upload an Analytical File Validation Errors Contact Us www.schrodinger.com
How to Create a Substance Answer Set
 How to Create a Substance Answer Set Select among five search techniques to find substances Since substances can be described by multiple names or other characteristics, SciFinder gives you the flexibility
Catchment Delineation Workflow
 Catchment Delineation Workflow Slide 1 Given is a GPS point (Lat./Long.) for an outlet location. The outlet could be a proposed Dam site, a storm water drainage culvert on a rural highway, or any other
User Manuel. EurotaxForecast. Version Latest changes ( )
") User Manuel EurotaxForecast Version 1.23.0771- Latest changes (19.07.2003) Contents Preface 5 Welcome to Eurotax Forecast...5 Using this manual 6 How to use this manual?...6 Program overview 7 General
User Manuel EurotaxForecast Version 1.23.0771- Latest changes (19.07.2003) Contents Preface 5 Welcome to Eurotax Forecast...5 Using this manual 6 How to use this manual?...6 Program overview 7 General
Geography 281 Map Making with GIS Project Four: Comparing Classification Methods
 Geography 281 Map Making with GIS Project Four: Comparing Classification Methods Thematic maps commonly deal with either of two kinds of data: Qualitative Data showing differences in kind or type (e.g.,
Preparing a PDB File
 Figure 1: Schematic view of the ligand-binding domain from the vitamin D receptor (PDB file 1IE9). The crystallographic waters are shown as small spheres and the bound ligand is shown as a CPK model. HO
Orange Visualization Tool (OVT) Manual
 Manual") Orange Visualization Tool (OVT) Manual This manual describes the features of the tool and how to use it. 1. Contents of the OVT Once the OVT is open (the first time it may take some seconds), it should
Orange Visualization Tool (OVT) Manual This manual describes the features of the tool and how to use it. 1. Contents of the OVT Once the OVT is open (the first time it may take some seconds), it should
Quality Measures Green Light Report Online Management Tool. Self Guided Tutorial
 Quality Measures Green Light Report Online Management Tool Self Guided Tutorial 1 Tutorial Contents Overview Access the QM Green Light Report Review the QM Green Light Report Tips for Success Contact PointRight
In this exercise we will learn how to use the analysis tools in ArcGIS with vector and raster data to further examine potential building sites.
 GIS Level 2 In the Introduction to GIS workshop we filtered data and visually examined it to determine where to potentially build a new mixed use facility. In order to get a low interest loan, the building
Outline. Introduction to SpaceStat and ESTDA. ESTDA & SpaceStat. Learning Objectives. Space-Time Intelligence System. Space-Time Intelligence System
 Outline I Data Preparation Introduction to SpaceStat and ESTDA II Introduction to ESTDA and SpaceStat III Introduction to time-dynamic regression ESTDA ESTDA & SpaceStat Learning Objectives Activities
Planning Softproviding Meat User Documentation
 Great ideas are always simple Softproviding simply makes them happen. Planning Softproviding Meat User Documentation Version: 1.00 Date: 24 August 2017 Release: v5.50 Softproviding AG Riehenring 175 CH-4058
ST-Links. SpatialKit. Version 3.0.x. For ArcMap. ArcMap Extension for Directly Connecting to Spatial Databases. ST-Links Corporation.
 ST-Links SpatialKit For ArcMap Version 3.0.x ArcMap Extension for Directly Connecting to Spatial Databases ST-Links Corporation www.st-links.com 2012 Contents Introduction... 3 Installation... 3 Database
Getting started with BatchReactor Example : Simulation of the Chlorotoluene chlorination
 Getting started with BatchReactor Example : Simulation of the Chlorotoluene chlorination 2011 ProSim S.A. All rights reserved. Introduction This document presents the different steps to follow in order
41. Sim Reactions Example
 HSC Chemistry 7.0 41-1(6) 41. Sim Reactions Example Figure 1: Sim Reactions Example, Run mode view after calculations. General This example contains instruction how to create a simple model. The example
ISIS/Draw "Quick Start"
 ISIS/Draw "Quick Start" Click to print, or click Drawing Molecules * Basic Strategy 5.1 * Drawing Structures with Template tools and template pages 5.2 * Drawing bonds and chains 5.3 * Drawing atoms 5.4
The OptiSage module. Use the OptiSage module for the assessment of Gibbs energy data. Table of contents
 The module Use the module for the assessment of Gibbs energy data. Various types of experimental data can be utilized in order to generate optimized parameters for the Gibbs energies of stoichiometric
Synteny Portal Documentation
 Synteny Portal Documentation Synteny Portal is a web application portal for visualizing, browsing, searching and building synteny blocks. Synteny Portal provides four main web applications: SynCircos,