Application of Global Positioning System (GPS) to Travel Time And Delay Measurements. Summer 2005
|
|
|
- Sybil Spencer
- 5 years ago
- Views:
Transcription
1 DCT 186 Application of Global Positioning System (GPS) to Travel Time And Delay Measurements Summer 2005 by ARDESHIR FAGHRI MICHAEL FRY JOOST VAN BOEKHOLD EVY VLAHOS AARON DENTEL-POST HARRY SHENTON Department of Civil and Environmental Engineering College of Engineering University of Delaware August 2005 Delaware Center for Transportation University of Delaware 355 DuPont Hall Newark, Delaware (302)
2 Application of Global Positioning System (GPS) to Travel Time And Delay Measurements Summer 2005 By Ardeshir Faghri Micahel Fry Joost Van Boekhold Evy Vlahos Aaron Dentel-Post Harry Shenton Department of Civil and Environmental Engineering College of Engineering University of Delaware DELAWARE CENTER FOR TRANSPORTATION University of Delaware Newark, Delaware This work was sponsored by the Delaware Center for Transportation and was prepared in cooperation with the Delaware Department of Transportation. The contents of this report reflect the views of the authors who are responsible for the facts and accuracy of the data presented herein. The contents do not necessarily reflect the official views of the Delaware Center for Transportation or the Delaware Department of Transportation at the time of publication. This report does not constitute a standard, specification, or regulation.
3 The Delaware Center for Transportation is a university-wide multi-disciplinary research unit reporting to the Chair of the Department of Civil and Environmental Engineering, and is co-sponsored by the University of Delaware and the Delaware Department of Transportation. DCT Staff Ardeshir Faghri Director Jerome Lewis Associate Director Wanda L. Taylor Lawrence H. Klepner Sandi Wolfe Assistant to the Director T 2 Program Coordinator Secretary DCT Policy Council Robert Taylor, Co-Chair Chief Engineer, Delaware Department of Transportation Eric Kaler, Co-Chair Dean, College of Engineering The Honorable Tony DeLuca Chair, Delaware Senate Transportation Committee The Honorable Richard Cathcart Chair, Delaware House of Representatives Transportation Committee Timothy K. Barnekov Dean, College of Human Resources, Education and Public Policy Michael J. Chajes Chair, Civil and Environmental Engineering Ralph A. Reeb Director of Planning, Delaware Department of Transportation Stephen Kingsberry Director, Delaware Transit Corporation Shannon Marchman Representative of the Director of the Delaware Development Office Roger Roy Representative, Transportation Management Association Jim Johnson Executive Director, Delaware River & Bay Authority Delaware Center for Transportation University of Delaware Newark, DE (302)
4 Application of Global Positioning System (GPS) to Travel Time And Delay Measurements Summer 2005 by: Ardeshir Faghri Michael Fry Joost van Boekhold Evy Vlahos Aaron Dentel-Post Harry Shenton Department of Civil & Environmental Engineering University of Delaware August 2005
5 Introduction Since 1996, the Global Positioning System (GPS), a worldwide radio-navigation system formed from a constellation of 24 satellites and their ground stations, has collected travel time and delay data on major roadways throughout Delaware. The GPS statistically matches manual data collection in accuracy and efficiency and therefore continues to effectively collect data within Delaware today. Every year, a report is compiled documenting and summarizing the collected data. The Application of Global Positioning System (GPS) to Travel Time and Delay Measurements 1997 Phase report describes the testing of the applicability and accuracy of the GPS system, while the 1998 Phase report provides step-by-step instructions for data collection. In past years, travel data was collected during peak-travel times between mid-september and Thanksgiving. In 2002, data collection expanded to include summer peak-travel times as well. In 2003, the summer mileage covered increased from 652 to 896 miles, and in 2004, this mileage increased again from 896 to 1006 miles. This report describes the methodology used to collect summer peak-travel time data and includes a summary and conclusion of the collected data. Methodology The continued success of the travel time and delay data collected over the past nine years in monitoring congestion trends along Delaware roadways in the fall months has led the Delaware Department of Transportation (DelDOT) to include the major travel routes to and from the shore points during the summer months in the annual data collection. This data has become critical to the analysis of travel patterns surrounding the Delaware beaches and to the monitoring of congestion along these major routes. 2
6 All major routes leading to and from the Delaware beaches were covered. Routes and numerous additional segments were added in 2003 and even more have been added in No new segments were added in All of the routes covered can generally be divided into two groups: North-South roads: SR 1, US 13, US 113, SR 896, SR 71, SR 9 (new), I-95, and I These routes are primarily used by travelers coming to and from the main northern points, including New Castle County, Pennsylvania, New Jersey, Cecil County (in Maryland), etc. East-West roads: SR 404, SR 14, SR 16, SR 20, SR 24, SR 26, SR 30, SR 36, SR 54, I-295. These roads are generally used by travelers from Maryland, Virginia, and Washington, D.C. entering the Delaware shore points. For each route that was covered, control points were selected between the segments of the roadway. The control points were positioned at major intersections or where road characteristics, such as the number of lanes, speed limit, or development type changed. Once the control points were selected, they were entered into data dictionary files using the Pathfinder editing system, which allows control points and specific attributes to be added, deleted, or edited. Data dictionary files allow control points and other roadway attributes, such as the speed limit and number of lanes, to be collected and stored with only a click of the mouse. A major feature that was added to data collection in 2004 was the addition of a background map with corresponding control points to the Aspen software used while driving. This background map would allow the data collector to view where the car was in relation to the next control point as well as the surrounding roads and intersections. The control points were represented by red crosses throughout the background map and were placed exactly where the 3
7 next segment began. Both the background map and control points were added by layering two shape files extracted from the Geographic Information Systems (GIS) network. By adding these features, the data collector no longer had to rely on the car odometer and predetermined distances to anticipate the next control point. As for data collection times, data was collected on summer weekends between June 19 th and August 19 th. Generally, the majority of beach-goers travel to and from the shore points on Friday afternoons, Sunday afternoons, and throughout the day on Saturday. Thus, data was collected heading toward the beach (southbound and eastbound) on Friday evenings from 3 to 7 PM and from 9 AM to noon on Saturday mornings. Data was also collected heading away from the beach (northbound and westbound) on Saturday evenings from 4 to 8 PM and on Sunday afternoons from 4 to 7 PM. These periods were chosen based on DelDOT s recommendations and on observations made during the summer 2003 data collection. In addition, contact was made with certain toll plazas, located along some of these beach routes, including those in Dover, Odessa, and on I-95. The information obtained highlighted specific times during the weekend when traffic volume was at its peak but only confirmed the time intervals mentioned above. Due to the number of routes to be covered and the need for at least 2 successful runs of each route, it was necessary to use two vehicles to complete the project on time. Two people rode in each car: a driver and a data collector. The latter operated the laptop computer and noted each attribute, while the former attempted to approximate the average driver. While one person might feasibly drive and collect data at the same time, this would present a serious safety hazard. Each route was driven at least twice in each direction to guarantee the accuracy of the data that was collected. In the event of problems, whether due to equipment failure, weekend- 4
8 long inclement weather, or large irregularities in the travel patterns, the roads were traveled again to ensure that peak beach-traffic patterns were captured. Also, in the event of heavy rain or very poor weather conditions, which happened twice, data was not collected at all, in order to avoid the collection of inaccurate data, which would not fully represent particular travel and delay times, as well as ensure the safety of data collectors. Where more than two runs were completed, only the results of the two or more that best captured the peak volume were used and averaged. Once all the data was collected, exported, and printed, it was analyzed and summarized on a segment-by-segment basis. Differences between Fall and Summer Projects The same basic methodology is used in both the fall and summer GPS Travel Time projects. In addition, many of the roads covered are the same. However, there are some key differences separating the projects: 1. Some of the roads covered were different than those covered in the fall. The fall project emphasizes commuter routes, particularly in New Castle County, while the summer project covers major beach routes throughout the state. 2. Instead of weekday morning and afternoon collection times as in the fall, the summer data was collected on weekends. 3. In the fall, data is collected separately for both morning (AM) and afternoon (PM), and at least two runs of each route are completed in each direction at each time of day. Results are then tabulated separately for AM and PM. In the summer, there is no AM/ PM division. Thus, roads are covered only twice in each direction. 5
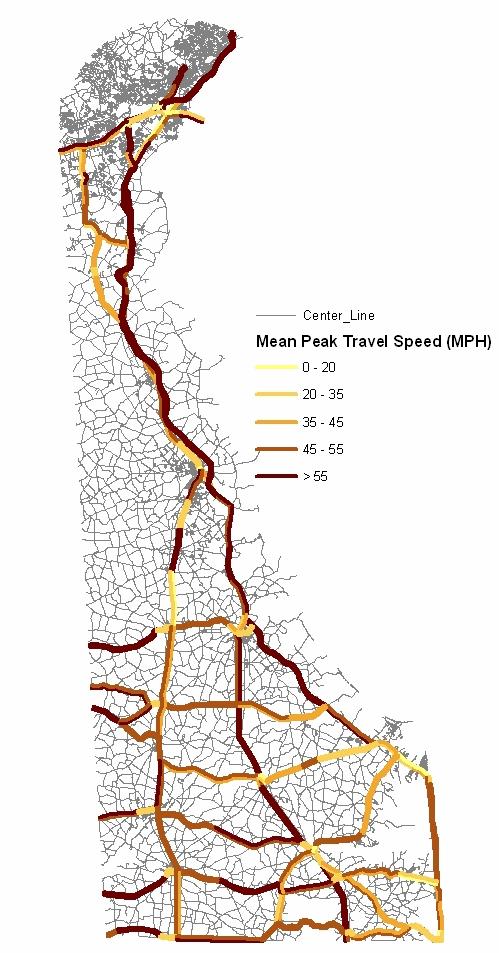
9 4. Because the summer project focuses primarily on statewide, long-distance beach traffic rather than short intra-county commuter trips, the roads are not separated by county as they are in the fall. Interpretation of 2005 Summer Data This report includes a data table with all of the collected information arranged by route name. The leftmost column contains the name of the route being covered. Each route is then divided into the different segments and data is provided in each direction. To the right of the segment names, the table contains the following information: Distance (Miles) This is the distance in miles for the given segment of roadway shown to the left. When the term Total is specified, the distance corresponds to the total length from the first control point to the last. Mean Peak Travel Time (Seconds) This is the average time in seconds that was required to travel the length of the segment. Mean Peak Travel Speed (mph) The average speed of the test vehicle from one point to the next is the Mean Peak Travel Speed. This value is given in miles per hour and is obtained by dividing the Distance of the segment by the Mean Peak Travel Time. 6
10 Total Peak Delay (Seconds) This is the time, in seconds, spent in delay on the given segment. By DelDOT s definition, delay is the time during which the vehicle speed drops below five miles per hour. Peak Delay Source This is the reason for the delay noted in the previous column. Reasons for delay include signals, construction, accidents, congestion, pedestrian crossings, train crossings, etc. Traffic signals are the primary cause of delay. Mean Peak Running Speed (mph) This is the average speed in miles per hour that a vehicle would travel through the section of roadway if delay were not experienced. The running speed, R, is obtained by the following equation: Distance R = Mean Peak Travel Time - Total Peak Delay Percent Time in Delay This is the percentage of time spent in delay for the route segment shown. The percentage is found by dividing the Total Peak Delay by the Mean Peak Travel Time, then multiplying the quantity by 100. Example: sec Percent Time in Delay = x 100 = 22.8% 360sec Number of Lanes This represents the number of lanes during the given segment. For those segments that have a varying number of lanes, two or more values will appear in this column. 7
11 Posted Speed (mph) This represents the posted speed limit for the given segment of the roadway shown. For segments with more than one posted speed, two or more values will appear in this column. Conclusion Beach traffic congestion during the summer of 2005 was again collected both precisely and effectively by the GPS Travel Time and Delay project teams. Although no new roads received attention, all roads covered in 2004 were again covered in This allowed for the continuing collection and analysis of travel time and delay time along the existing summer routes. Data collection using a GPS unit is an advancement to manual data collection. The system, however, is not perfect and some problems arose. A minor, but continuing problem, the notebook computers occasionally malfunctioned during data collection, which would shut off the GPS units. Also, one GPS unit stopped working for a brief period and had to be sent for maintenance. At times the satellite signal was lost, due to inclement weather or tree obstruction. Nonetheless, manual data collection was always feasible and was used in the few instances when necessary. Poor road markings and unforeseen road conditions made recollection of delay data on some roads necessary. On SR 24, a train crossing blocked the road when no train was coming causing traffic to stand still. Flooding also occurred during a brief rain storm on SR 24 between SR 1 and SR 23. The road signs to follow SR 20 south along US 13 are poorly marked, indicating turns incorrectly, or not at all. Trucks driving north on SR 26 block road signs which 8
12 are too close to the edge of the road. On Northbound US 13, part of the road was used for the use of the Delaware State Fair. Drivers to the beach appeared to be driving faster than in previous years, and drivers were aggressive on the longer north and south bound roads. Speeds exceeding 70 miles per hour on roads with 55 mph speed limits was not uncommon. In addition, drivers were observed along I- 95 and I-495 driving down the breakdown lane in order to avoid the congestion. Most of the time the drivers on the breakdown lane were trying to turn off onto an exit and in some cases caused fender benders from people turning off appropriately. In addition, the development of large shopping centers along SR 1 have caused excessive delays near the beach. Drivers appear to be using US 113 to circumvent the signalization along the last few segments of SR 1. Variability in the time of peak traffic volume also caused difficulties. There are numerous factors that cause variation in this peak time, some of which are current weather, predicted weather, and holidays. If weather is predicted to be poor, fewer vacationers go to the beaches, or if the weather is sunny and then turns rainy, people usually leave early. Consequently, while the data collection periods generally coincided with major peak periods, it was difficult to capture the best peak time, especially during the Saturday runs. On the other hand, traffic peak times on Friday evenings remained consistent, with travel and delay times appearing considerably high, especially on I-95 and I-495. However, when analyzing and observing this data, one must recognize the possibility of business travel mixing with beach travel during this period. Lastly, minimal human error might have occurred during driving, data collection, and computations, possibly affecting the outcome of certain data results. Ideally, in the future, a computerized process to extract the GPS results and travel data is expected to yield greater accuracy and efficiency. Additionally, observations noted that data 9
13 collection beyond US 13 on the East-West routes, not including SR 404, does not provide strong travel time and delay data and may be unnecessary in future projects. It was determined that hardly any congestion or even volume was observed past this point and up until the Maryland state line. Thus, the last control point on these roads could be placed at the intersections with US 13, as such a change would result in more resources being concentrated on more heavily traveled segments of other routes. The possible addition of SR 9, however, has continued to be an unsuccessful addition. After several runs of SR 9 both northbound and southbound, it was discovered that there is no sufficient necessity to include this route in the data collection. This was concluded from the result that no considerable delay was experienced, and, in fact, no congestion or even moderate volume was observed at all beyond Wilmington in New Castle County. For the most part, data is collected every day of the weekend with no specification given to which day, only which direction. Thus, data collected on Friday evenings is averaged with data collected on Saturday mornings, since both times represent southbound traffic to the shore points. So far, there has been no serious problems or inaccuracies with this method; however, it may be more beneficial to collect and analyze this data on more of a day-to-day basis, with possibly two runs being completed for each route in each direction as well as on each day, in order to allow for a more direct analysis of the data and a more specific account of when beach roads are most congested. Also, after careful observation along with direct contact with the toll plazas, as mentioned earlier, it was discovered that congestion northbound on Saturday mornings can be just as high as congestion southbound at this time. Methods of collection including Saturday morning north bound routes may be a possible addition to future projects, and it may contribute to the accuracy and development of a successful travel time and delay study during 10
14 the summer, when traffic peak times do vary considerably. In order to allow for these additions and the time constraints put on summer data collection, it may be necessary to include a third car, as well as a third set of data collectors, in accomplishing this summer project in the future. This summer project was very successful in capturing an accurate picture of travel time and delay all over Delaware and its shore points, and these changes would not only continue the success of the project but allow for a more detailed and comprehensive approach to GPS data collection and its application to such travel time and delay measurements. An unusually high improvement rate was observed along the ten most improved segments. Four segments improved from LOS F to LOS A, while another four segments improved from an LOS E to an LOS A. While, the numbers seem high, there is a rationale explanation. Segment SR 273 (exit 162) to Christiana Mall (exit 164) experienced construction during the summer of In the past year, EZ Pass express lanes were installed on segments Exit 1 (SR 896) to MD Line, MD Line to Exit 1 (SR 896) and Exit 98 to Scarborough Rd (104), improving a driver s ability to circumvent the toll booths. While analysis of 2004 data reveals no further explanation for the drastic improvement, two segments, US 9 (non truck route) to SR 404/18 and SR 20 West to SR 24 were classified as LOS B and A respectively in In 2004 these same two segments were classified as two of the most degraded segments between 2003 and
15 Appendix A Notable Segments: This is a listing of segments which appear to require special attention. Equations: % _ PS _ TS = MeanPeakTravelSpeed WeightedAverageSpeed WeightedAverageSpeed % _ D _ PS _ TS = % _ PS _ TS2005 % _ PS _ TS2004 A 1 : 10-Most Degraded Segments Segments are selected by taking the difference between the LOS of 2005 and the LOS of 2004 and taking the segments which indicated the most drastic decline. If two or more segments had the same level of degradation, the segment with the least %_D_PS_TS took priority. A 2 : 10-Most Improved Segments Segments are selected by taking the difference between the LOS of 2005 and the LOS of 2004 and taking the segments which indicated the most notable improvement. If two or more segments had the same level of improvement, the segment with the greatest %_D_PS_TS took priority. A 3 : 20-Worst Segments The 20 segments with the greatest LOS are selected and displayed in this table. 12
16 A 1 : 10-Most Degraded Segments: ROUTE_NAME DIR SEGMENT LOS_04 LOS_05 %_D_PS_TS DuPont Hwy NB SR 72 (152) to SR 1/US 13 Split A F % SR 26 WB SR 30 to SR 54 split A C % US 13 SB SR 9 West to SR 24 A D % DuPont Hwy NB SR 896 to C&D Canal A D % DuPont Hwy SB C&D Canal to SR 896 B E % DuPont Hwy SB SR 273 to US 40 C E % SR 896 SB I-95 to Old Baltimore Pike B D % Relief Route SB US 40 (exit 160) to US 13 North (exit 156) A E % US 113 SB US 13/113 Split to 1/113 Merge (SR 1 Exit 95) B D % Relief Route SB SR 24 to Rehoboth Avenue B E % A 2 : 10-Most Improved Segments: ROUTE_NAME DIR SEGMENT LOS_04 LOS_05 %_D_PS_TS Relief Route NB SR 273 (exit 162) to Christiana Mall (exit 164) F A % US 113 NB US 9 (non truck route) to SR 404/18 F A 55.90% I-95 SB Exit 1 (SR 896) to MD Line E A 55.61% I-95 NB MD Line to Exit 1 (SR 896) F A 54.71% I-495 SB Exit 1 (US 13) to I-95 F A 53.66% Relief Route NB Exit 98 to Scarborough Rd (104) E A 51.18% I-95 SB SR 141 to Merge with SR 1 E A 50.38% US 113 NB SR 20 East to SR 24 F B 45.14% US 113 SB SR 20 West to SR 24 F B 42.49% I-95 NB Merge with I-95 N to SR 141 E A 38.13% 13
17 A 3 : 20-Worst Segments: ROUTE_NAME DIR SEGMENT LOS LOS % Av. Speed (mph) DuPont Hwy SB I -495 to I-295 F 84.55% 7.7 SR 896 NB SR 1 to US 13 F 84.18% 7.9 I-95 NB Exit 3 (SR 273) to Exit 4 (SR 1) F 79.17% 11.5 SR 20 EB US 13 / SR 20 W to US 13 / SR 20 E F 79.03% 8.7 I-295 WB SR 9 to US 13 F 77.89% 11.1 I-295 WB US 13 to I-95 F 75.80% 12.1 US 13 SB SR 20 West to SR 20 East F 72.89% 13.4 I-95 SB I-495 JCT to Exit 5 (SR 141/I-295 JCT) F 72.21% 15.3 DuPont Hwy SB SR 8 to US 13/113 Split F 57.98% 19.5 Relief Route SB James St. to SR 54 F 57.85% 15.5 DuPont Hwy NB SR 72 (152) to SR 1/US 13 Split F 55.63% 25.0 Relief Route NB King Charles Ave (DE) to Rehoboth Avenue F 51.65% 16.7 I-95 SB I-295 to Exit 4 (SR 1/Churchmans) F 50.76% 26.7 Relief Route NB Rehoboth Avenue to SR 24 F 50.16% 19.1 DuPont Hwy SB SR 141 to SR 273 E 69.84% 15.1 SR 24 WB SR 30 to US 113 E 67.95% 10.7 DuPont Hwy SB SR 273 to US 40 E 67.55% 16.8 DuPont Hwy SB I-295 to SR 141 E 61.04% 19.5 Relief Route NB Christiana Mall (exit 164) to Merge with I-95 N E 46.49% 29.4 DuPont Hwy NB US 13/113 Merge to SR 8 E 46.41%
18 Appendix B: Summer Coverage: The following GIS drawing displays in red all the routes that are covered by the Summer 2005 GPS data collection. 15
19 16
20 Appendix C: Mean Peak Travel Speed: The following GIS drawing displays the mean peak travel time in miles per hour in both directions for every segment of the Summer 2005 GPS data collection. Methodology: The mean peak travel speed for every segment is calculated by averaging the total time required to travel the length of each segment of all runs (mean peak travel time), and dividing the segment length by that time. Equations: n TotalTravelTime _ Run( x) MeanPeakTravelTime = 1 n SegmentDis tan ce( Miles) 3600seconds MeanPeakTravelSpeed = * MeanPeakTravelTime( Seconds) 1hour 17
21 18
22 Appendix D: Mean Peak Delay: The following GIS drawing displays the average delay along each segment in both directions for every segment of the Summer 2005 GPS data collection. Methodology: Average delay is calculated by adding together the delay measured in each run and dividing the total by the number of runs. The result is displayed in seconds of delay. Equations: Delay(seconds) _ run( x) AverageDelay(seconds) = 1 n n 19
23 20
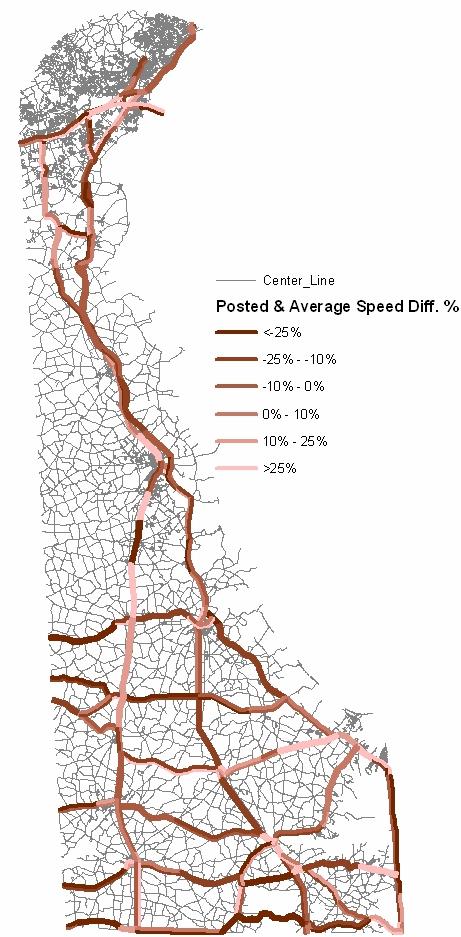
24 Appendix E: Posted Speed vs. Average Speed Difference: The following GIS drawing displays the percent difference between the posted speed and the average speed for every segment of the Summer 2005 GPS data collection. Methodology: The percent difference between the posted speed and the average speed is calculated be subtracting the average speed of all runs from the posted speed and dividing the difference by the posted speed. This is done for all segments. Equations: AverageSpe ed n AverageSpe ed _ run ( x) = 1 n ( PostedSpeed AverageSpeed) Posted & AverageSpeedDiff.% = *100% PostedSpeed 21
25 22
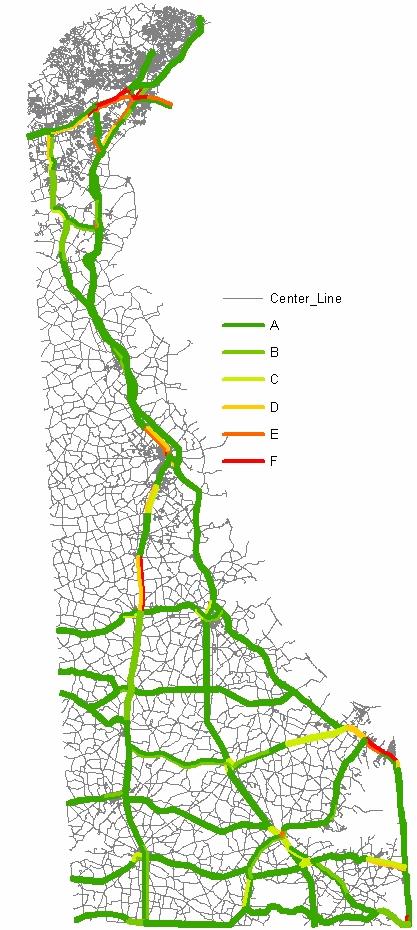
26 Appendix F: Level of Service 2004: The following GIS drawing displays the calculated level of service for each direction of all segments for every segment of the Summer 2004 GPS data collection. Methodology: Using the percent difference between the posted speed and average speed, the level of service is calculated. By first identifying segments that are interstates or interstate/freeways and roads that are arterials in 2004, the following tables are used to classify the appropriate level of service. Percentage of speed below the posted speed limit: For Interstate or Interstate/Freeways: Arterials: LOS A: 0-14% LOS A: 0-10% LOS B: 14-18% LOS B: 10-30% LOS C: 18-20% LOS C: 30-45% LOS D: 20-30% LOS D: 45-60% LOS E: 30-50% LOS E: 60-70% LOS F: 50% + LOS F: 70% + 23
27 24
28 Appendix G: Level of Service 2005: The following GIS drawing displays the calculated level of service for each direction of all segments for every segment of the Summer 2005 GPS data collection. Methodology: Using the percent difference between the posted speed and average speed, the level of service is calculated. By first identifying segments that are interstates or interstate/freeways and roads that are arterials in 2005, the following tables are used to classify the appropriate level of service. Percentage of speed below the posted speed limit: For Interstate or Interstate/Freeways: Arterials: LOS A: 0-14% LOS A: 0-10% LOS B: 14-18% LOS B: 10-30% LOS C: 18-20% LOS C: 30-45% LOS D: 20-30% LOS D: 45-60% LOS E: 30-50% LOS E: 60-70% LOS F: 50% + LOS F: 70% + 25
29 26
30 Appendix H: Peak Travel Time Data Summer 2005: The following table is the averaged data for all segments analyzed during the summer 2005 GPS data collection. The table includes the route number, route name, segment direction, segment distance, mean peak travel time, mean peak travel speed, total delay, peak delay source, mean peak running speed, percent time in delay, number of lanes and the posted speeds. 27
31 Delaware Center for Transportation University of Delaware Newark, Delaware AN EQUAL OPPORTUNITY/AFFIRMATIVE ACTION EMPLOYER The University of Delaware is committed to assuring equal opportunity to all persons and does not discriminate on the basis of race, creed, color, gender, age, religion, national origin, veteran or handicapped status, or sexual orientation in its educational programs, activities, admissions or employment practices as required by Title IX of the Educational Amendments of 1972, Section 504 of the Rehabilitation Act of 1973, Title VII of the Civil Rights Act of 1964, and other applicable statutes. Inquiries concerning Section 504 compliance and information regarding campus accessibility should be referred to the Americans with Disabilities Act (ADA) Coordinator, , located at 413 Academy Street. Inquiries concerning Title VII and Title IX should be referred to the Office of the Assistant Vice President for Affirmative Action, , located at 124 Hullihen Hall.
Application of Global Positioning System (GPS) to Travel Time and Delay Measurements
 to Travel Time and Delay Measurements") DCT 224 Application of Global Positioning System (GPS) to Travel Time and Delay Measurements By ARDESHIR FAGHRI MINGXIN LI Assisted by MORTEZA TABATABAIE SHOURIJEH SEAN HUMPHREY DREW PAVLICK REBECCA FREY
DCT 224 Application of Global Positioning System (GPS) to Travel Time and Delay Measurements By ARDESHIR FAGHRI MINGXIN LI Assisted by MORTEZA TABATABAIE SHOURIJEH SEAN HUMPHREY DREW PAVLICK REBECCA FREY
FY 2010 Continuing i Planning Program Product Report. Local Transportation and Traffic Data. Wood-Washington-Wirt Interstate Planning Commission
 FY 2010 Continuing i Planning Program Product Report Local Transportation and Traffic Data Travel Time and Delay Data for Belpre and Marietta, Ohio Wood-Washington-Wirt Interstate Planning Commission CONTINUING
VHD Daily Totals. Population 14.5% change. VMT Daily Totals Suffolk 24-hour VMT. 49.3% change. 14.4% change VMT
 6.9 Suffolk 6-54 VMT Population and Travel Characteristics Population 14.5% change 2014 1,529,202 VHD Daily Totals 2014 251,060 49.3% change 2040 1,788,175 2040 374,850 VMT Daily Totals 2014 39,731,990
CONTINUING PLANNING PROGRAM LOCAL TRANSPORTATION AND TRAFFIC DATA PRODUCT REPORT [OH Corridors]
![CONTINUING PLANNING PROGRAM LOCAL TRANSPORTATION AND TRAFFIC DATA PRODUCT REPORT [OH Corridors]](/thumbs/94/120123757.jpg "CONTINUING PLANNING PROGRAM LOCAL TRANSPORTATION AND TRAFFIC DATA PRODUCT REPORT [OH Corridors]") CONTINUING PLANNING PROGRAM LOCAL TRANSPORTATION AND TRAFFIC DATA PRODUCT REPORT [OH Corridors] Travel Time and Delay Analysis for Belpre (OH) and Marietta (OH) Fiscal Year 2009 Report WOOD WASHINGTON
CONTINUING PLANNING PROGRAM LOCAL TRANSPORTATION AND TRAFFIC DATA PRODUCT REPORT [OH Corridors] Travel Time and Delay Analysis for Belpre (OH) and Marietta (OH) Fiscal Year 2009 Report WOOD WASHINGTON
Appendixx C Travel Demand Model Development and Forecasting Lubbock Outer Route Study June 2014
 Appendix C Travel Demand Model Development and Forecasting Lubbock Outer Route Study June 2014 CONTENTS List of Figures-... 3 List of Tables... 4 Introduction... 1 Application of the Lubbock Travel Demand
NATHAN HALE HIGH SCHOOL PARKING AND TRAFFIC ANALYSIS. Table of Contents
 Parking and Traffic Analysis Seattle, WA Prepared for: URS Corporation 1501 4th Avenue, Suite 1400 Seattle, WA 98101-1616 Prepared by: Mirai Transportation Planning & Engineering 11410 NE 122nd Way, Suite
Traffic Impact Study
 Traffic Impact Study Statham DRI One University Parkway Prepared for: Barrow County Prepared by: October 2012 Table of Contents Executive Summary i Section 1. Introduction 1 Project Description 1 Methodology
Market Street PDP. Nassau County, Florida. Transportation Impact Analysis. VHB/Vanasse Hangen Brustlin, Inc. Nassau County Growth Management
 Transportation Impact Analysis Market Street PDP Nassau County, Florida Submitted to Nassau County Growth Management Prepared for TerraPointe Services, Inc. Prepared by VHB/Vanasse Hangen Brustlin, Inc.
A Study of Red Light Cameras in Kansas City, MO
 A Study of Red Light s in Kansas City, MO Prepared by the Special Operations Division Executive Summary This paper will analyze the crash data for the 29 red light cameras located in 17 intersections in
WEBER ROAD RESIDENTIAL DEVELOPMENT Single Family Residential Project
 WEBER ROAD RESIDENTIAL DEVELOPMENT Single Family Residential Project WEBER ROAD RESIDENTIAL DEVELOPMENT TRAFFIC IMPACT STUDY TABLE OF CONTENTS 1.0 Executive Summary Page 2.0 Introduction 2.1 DEVELOPMENT
JEP John E. Jack Pflum, P.E. Consulting Engineering 7541 Hosbrook Road, Cincinnati, OH Telephone:
 JEP John E. Jack Pflum, P.E. Consulting Engineering 7541 Hosbrook Road, Cincinnati, OH 45243 Email: jackpflum1@gmail.com Telephone: 513.919.7814 MEMORANDUM REPORT Traffic Impact Analysis Proposed Soccer
CVS Derwood. Local Area Transportation Review
 CVS Derwood Montgomery County, Maryland May 27, 2016 Local Area Transportation Review Prepared for: JC Bar Properties, Inc. Steve Fleming, PE 415 Fallowfield Road, Suite 301 Camp Hill, Pennsylvania 17011
South Western Region Travel Time Monitoring Program Congestion Management Process Spring 2008 Report
 South Western Region Travel Monitoring Program Congestion Management Process Spring 2008 Report Prepared by: South Western Regional Planning Agency 888 Washington Boulevard Stamford, CT 06901 Telephone:
Parking Regulations Dundas Street West, from Bathurst Street to Dovercourt Road
 STAFF REPORT ACTION REQUIRED Parking Regulations Dundas Street West, from Bathurst Street to Dovercourt Road Date: October 28, 2008 To: From: Toronto and East York Community Council Director, Transportation
Appendix BAL Baltimore, Maryland 2003 Annual Report on Freeway Mobility and Reliability
 (http://mobility.tamu.edu/mmp) Office of Operations, Federal Highway Administration Appendix BAL Baltimore, Maryland 2003 Annual Report on Freeway Mobility and Reliability This report is a supplement to:
TRAFFIC IMPACT STUDY. Platte Canyon Villas Arapahoe County, Colorado (Arapahoe County Case Number: Z16-001) For
 For") TRAFFIC IMPACT STUDY For Platte Canyon Villas Arapahoe County, Colorado (Arapahoe County Case Number: Z16-001) February 2015 Revised: August 2015 April 2016 July 2016 September 2016 Prepared for: KB Home
TRAFFIC IMPACT STUDY For Platte Canyon Villas Arapahoe County, Colorado (Arapahoe County Case Number: Z16-001) February 2015 Revised: August 2015 April 2016 July 2016 September 2016 Prepared for: KB Home
MEMORANDUM. The study area of the analysis was discussed with City staff and includes the following intersections:
 MEMORANDUM DATE: JULY 6, 2012 TO: FROM: RE: CC: MELANIE KNIGHT BRAD BYVELDS/ JENNIFER LUONG 1050 SOMERSET STREET PRELIMINARY TRAFFIC ANALYSIS OUR FILE NO. 111152 NEIL MALHOTRA The purpose of this memo
In the Matter of the Study of State Police Stop Activity at the Southern end of the New Jersey Turnpike
 In the Matter of the Study of State Police Stop Activity at the Southern end of the New Jersey Turnpike We were retained by the ACLU of New Jersey to determine whether the New Jersey State Police (NJSP)
MADISON, WI STONE HOUSE DEVELOPMENT 1000 E. WASHINGTON AVENUE REDEVELOPMENT TRANSPORTATION STUDY DECEMBER 14, 2015
 MADISON, WI STONE HOUSE DEVELOPMENT 1000 E. WASHINGTON AVENUE REDEVELOPMENT TRANSPORTATION STUDY DECEMBER 14, 2015 TABLE OF CONTENTS... 3 Proposed Development... 3 Methodology... 3 Phase 1 Development...
MnDOT Method for Calculating Measures of Effectiveness (MOE) From CORSIM Model Output
 From CORSIM Model Output") MnDOT Method for Calculating Measures of Effectiveness (MOE) From CORSIM Model Output Rev. April 29, 2005 MnDOT Method for Calculating Measures of Effectiveness (MOE) From CORSIM Model Output Table of
MnDOT Method for Calculating Measures of Effectiveness (MOE) From CORSIM Model Output Rev. April 29, 2005 MnDOT Method for Calculating Measures of Effectiveness (MOE) From CORSIM Model Output Table of
City of Hermosa Beach Beach Access and Parking Study. Submitted by. 600 Wilshire Blvd., Suite 1050 Los Angeles, CA
 City of Hermosa Beach Beach Access and Parking Study Submitted by 600 Wilshire Blvd., Suite 1050 Los Angeles, CA 90017 213.261.3050 January 2015 TABLE OF CONTENTS Introduction to the Beach Access and Parking
TRAFFIC ALERT FOR WEEK OF February 4 8, 2008
 TRAFFIC ALERT FOR WEEK OF February 4 8, 2008 Highway work zones in the Staunton District The following is a list of highway work that might affect traffic in the Staunton transportation district during
City of Laramie, Wyoming SNOW AND ICE POLICY
 City of Laramie, Wyoming SNOW AND ICE POLICY 11/02/89; rev 10/15/2007 I. INTRODUCTION The intention of this Policy is to set reasonable goals and general practices as a guide for the conduct of snow and
CITY OF NEW LONDON WINTER ROAD & SIDEWALK MAINTENANCE POLICY
 CITY OF NEW LONDON WINTER ROAD & SIDEWALK MAINTENANCE POLICY GENERAL The purpose of this policy is to set up acceptable procedures and policies for the winter maintenance of public areas in the City of
The Sunland Park flyover ramp is set to close the week of March 19 until early summer
 March 2, 2018 The Sunland Park flyover ramp is set to close the week of March 19 until early summer GO 10 is targeting the week of March 19 to close the Sunland Park Drive flyover entrance ramp to I 10
FINAL Traffic Report for the Proposed Golden Valley Road and Newhall Ranch Road Projects in the City of Santa Clarita, California May 5, 2005
 FINAL Traffic Report for the Proposed Golden Valley Road and Newhall Ranch Road Projects in the City of Santa Clarita, California May 5, 2005 Prepared For: EDAW, Inc. 1420 Kettner Boulevard, Suite 620
U.S. - Canadian Border Traffic Prediction
 Western Washington University Western CEDAR WWU Honors Program Senior Projects WWU Graduate and Undergraduate Scholarship 12-14-2017 U.S. - Canadian Border Traffic Prediction Colin Middleton Western Washington
APPENDIX IV MODELLING
 APPENDIX IV MODELLING Kingston Transportation Master Plan Final Report, July 2004 Appendix IV: Modelling i TABLE OF CONTENTS Page 1.0 INTRODUCTION... 1 2.0 OBJECTIVE... 1 3.0 URBAN TRANSPORTATION MODELLING
Appendix C Traffic Study
 Final Environmental Impact Statement Appendix C Traffic Study Schofield Generating Station Project, Hawaii October 2015 C-1 Final Environmental Impact Statement This page intentionally left blank. Schofield
ADAPTIVE SIGNAL CONTROL IV
 ADAPTIVE SIGNAL CONTROL IV Evaluation of the Adaptive Traffic Control System in Park City, Utah Dr. Peter T. Martin Associate Professor Aleksandar Stevanovic Research Associate Ivana Vladisavljevic Research
The Highline Development Traffic Impact Study
 The Highline Development Traffic Impact Study Columbia Falls, Montana Prepared For: TD&H Engineering 450 Corporate Drive, Suite 101 Kalispell, MT 59901 June, 2018 130 South Howie Street Helena, Montana
FINAL REPORT. City of Toronto. Contract Project No: B
 City of Toronto SAFETY IMPACTS AND REGULATIONS OF ELECTRONIC STATIC ROADSIDE ADVERTISING SIGNS TECHNICAL MEMORANDUM #2B BEFORE/AFTER COLLISION ANALYSIS AT MID-BLOCK LOCATIONS FINAL REPORT 3027 Harvester
John Laznik 273 Delaplane Ave Newark, DE (302)
") Office Address: John Laznik 273 Delaplane Ave Newark, DE 19711 (302) 831-0479 Center for Applied Demography and Survey Research College of Human Services, Education and Public Policy University of Delaware
Office Address: John Laznik 273 Delaplane Ave Newark, DE 19711 (302) 831-0479 Center for Applied Demography and Survey Research College of Human Services, Education and Public Policy University of Delaware
UMBC Inclement Weather/Emergency Closing Policy UMBC#VI
 UMBC Inclement Weather/Emergency Closing Policy UMBC#VI-13.00.03 For the most reliable closing, updates and reopening information, members of the UMBC community and visitors should rely on the only three
Montmorency County Traffic Crash Data & Year Trends. Reporting Criteria
 June 2017 Revised 10/3/17 2016 Reporting Criteria Please pay particular attention to the wording when interpreting the three levels of data gathered for this report. Crash The Crash Level analyzes data
Monroe County: Key West and Lower Keys
 FDOT PROJECT UPDATES June 15-21, 2015 Monroe County: Key West and Lower Keys Monroe County projects website: www.fdotmonroe.com Opt Out: If you no longer wish to receive these weekly notifications, please
Focused Traffic Analysis for the One Lincoln Park Project
 September 15, 2015 Mr. Bill Johnson Coldwell Banker 511 Sir Francis Drake Boulevard Greenbrae, CA 94904 Focused Traffic Analysis for the One Lincoln Park Project Dear Mr. Johnson; As requested, W-Trans
Time Space Diagrams for Thirteen Shock Waves
 Time Space Diagrams for Thirteen Shock Waves Benjamin Coifman Institute of Transportation Studies 19 McLaughlin Hall University of California Berkeley, CA 9472 zephyr@eecs.berkeley.edu http://www.cs.berkeley.edu/~zephyr
I-10 East at Redd closes for 24 hours this Sunday, Feb 11. Then, I-10 West at Resler closes for 27 hours on Feb 25
 NEWS RELEASE a TxDOT Project For immediate release EL PASO DISTRICT Jennifer Wright (915) 790-4340 Jennifer.Wright3@txdot.gov February 9, 2018 I-10 East at Redd closes for 24 hours this Sunday, Feb 11
2011 South Western Region Travel Time Monitoring Program Congestion Management Process. Executive Summary
 2011 South Western Region Travel Monitoring Program Executive Summary Prepared by: South Western Regional Planning Agency 888 Washington Blvd, 3rd Floor Stamford, CT 06901 Telephone: 203.6.5190 Facsimile:
New Jersey Department of Transportation Extreme Weather Asset Management Pilot Study
 New Jersey Department of Transportation Extreme Weather Asset Management Pilot Study Overview Prepared for: June 26, 2018 Introduction Overview of Pilot Study New Jersey s Climate New Jersey s Transportation
Effectiveness of Experimental Transverse- Bar Pavement Marking as Speed-Reduction Treatment on Freeway Curves
 Effectiveness of Experimental Transverse- Bar Pavement Marking as Speed-Reduction Treatment on Freeway Curves Timothy J. Gates, Xiao Qin, and David A. Noyce Researchers performed a before-and-after analysis
April 10, Mr. Curt Van De Walle, City Manager City of Castle Hills 209 Lemonwood Drive Castle Hills, Texas 78213
 Mr. Curt Van De Walle, City Manager City of Castle Hills 209 Lemonwood Drive Castle Hills, Texas 78213 Subject: Revised Castle Hills BASIS Charter School Traffic Impact Analysis Review City of Castle Hills,
EXAMINATION OF THE SAFETY IMPACTS OF VARYING FOG DENSITIES: A CASE STUDY OF I-77 IN VIRGINIA
 0 0 0 EXAMINATION OF THE SAFETY IMPACTS OF VARYING FOG DENSITIES: A CASE STUDY OF I- IN VIRGINIA Katie McCann Graduate Research Assistant University of Virginia 0 Edgemont Road Charlottesville, VA 0 --
Organized Chain-Up and VSL
 Organized Chain-Up and VSL Jim Mahugh, PE WSDOT SC Region Traffic Engineer North/West Passage VSL Peer Exchange January 28, 2015 Snoqualmie Pass 2 Limits of VSL EB: MP 48.12 to 66.56 WB: MP 46.69 to 66.90
Approved by: A. Cherrie Epps, Ph.D., President and Chief Executive Officer
 Page 1 of 5 Retired: Revised: Approved by: A. Cherrie Epps, Ph.D., President and Chief Executive Officer Subject: Office of General Counsel/Compliance - Inclement Weather and Emergency Closing Policy PURPOSE:
Keywords: Travel Behavior; Transportation Finance; Global Positioning Systems (GPS)
") 0 0 0 How Local is Travel? Michael Scharenbroich Humphrey Institute of Public Affairs University of Minnesota 0 th Ave. S Minneapolis, MN scha0@umn.edu Michael Iacono* Department of Civil Engineering University
0 0 0 How Local is Travel? Michael Scharenbroich Humphrey Institute of Public Affairs University of Minnesota 0 th Ave. S Minneapolis, MN scha0@umn.edu Michael Iacono* Department of Civil Engineering University
Evaluation of Epoke Bulk Spreader for Winter Maintenance
 Evaluation of Epoke Bulk Spreader for Winter Maintenance State Job Number: 134651 William H. Schneider, IV Christopher M. Miller William A. Holik Mallory Crow Research Objectives 1. Evaluate existing data
City of Brainerd, Minnesota Snowplowing Policy
 City of Brainerd, Minnesota Snowplowing Policy 1. Introduction The city of Brainerd, Minnesota, finds that it is in the best interest of the residents of the city to assume basic responsibility for control
City of Camrose Winter Road Maintenance Policy
 City of Camrose Winter Road Maintenance Policy The purpose of this policy is to outline the level of service that the City of Camrose delivers regarding the maintenance of roads in winter conditions. 1.
Montmorency County Traffic Crash Data & Year Trends. Reporting Criteria
 June 2018 Revised 8/3/2018 2017 Reporting Criteria Please pay particular attention to the wording when interpreting the three levels of data gathered for this report. Crash The Crash Level analyzes data
MEMORANDUM. Trip Generation Analysis
 MEMORANDUM To: RMC Architects From: Matthew Palmer, PE Subject: Trip Generation, Parking Analysis & Level of Service Project: Port of Everett, GTC #13-053 Date: August 25, 2014 The trip generation and
WOODRUFF ROAD CORRIDOR ORIGIN-DESTINATION ANALYSIS
 2018 WOODRUFF ROAD CORRIDOR ORIGIN-DESTINATION ANALYSIS Introduction Woodruff Road is the main road to and through the commercial area in Greenville, South Carolina. Businesses along the corridor have
Table of Contents Introduction... 4 Study Area... 5
 Table of Contents Introduction... 4 Study Area... 5 Streets and s... 5 Traffic Volumes... 8 Recent and Anticipated Development... 10 Crash Analysis... 10 Projected Traffic Volumes... 11 Trip Generation...
PENNSTATE COMMONWEALTH OF PENNSYLVANIA DEPARTMENT OF TRANSPORTATION
 COMMONWEALTH OF PENNSYLVANIA DEPARTMENT OF TRANSPORTATION PENNDOT RESEARCH EFFECTIVENESS OF SPEED MINDERS IN REDUCING DRIVING SPEEDS ON RURAL HIGHWAYS IN PENNSYLVANIA PennDOT/MAUTC Partnership Research
Transportation and Road Weather
 Portland State University PDXScholar TREC Friday Seminar Series Transportation Research and Education Center (TREC) 4-18-2014 Transportation and Road Weather Rhonda Young University of Wyoming Let us know
City of Saginaw Right of Way Division Snow and Ice Removal Policy January 18, 2016
 Snow and Ice Removal Policy January 18, 2016 It is the policy of the to provide snowplowing and ice removal services in order to: Provide safe traveling conditions for motorists and pedestrians Assist
West Tennessee Construction June 14-21, 2017
 FOR IMMEDIATE RELEASE Wednesday, June 14, 2017 CONTACT: Nichole Lawrence CELL: 731-225-6041 West Tennessee Construction June 14-21, 2017 BENTON COUNTY, I-40 Truck Climbing Lane Wednesday, June 7 through
Expanding the GSATS Model Area into
 Appendix A Expanding the GSATS Model Area into North Carolina Jluy, 2011 Table of Contents LONG-RANGE TRANSPORTATION PLAN UPDATE 1. Introduction... 1 1.1 Background... 1 1.2 Existing Northern Extent of
COUNCIL POLICY MANUAL
 COUNCIL POLICY MANUAL SECTION: PUBLIC WORKS SUBJECT: SNOW & ICE CONTROL POLICY 2012/2013 GOAL: Pages: 1 of 10 Approval Date: Dec. 3, 2012 Res. # 1001/2012 To annually identify the winter maintenance costs
SNOW REMOVAL GUIDE. City Of Orange Township. Public Works Snow Removal Hotline: (973) My Orange Hotline: (973)
 My Orange Hotline: (973)") Mayor Dwayne D. Warren, Esq. And The Orange Municipal Council MOVING ORANGE FORWARD City Of Orange Township SNOW REMOVAL GUIDE Public Works Snow Removal Hotline: (973) 266-4030 My Orange Hotline: (973)
Mayor Dwayne D. Warren, Esq. And The Orange Municipal Council MOVING ORANGE FORWARD City Of Orange Township SNOW REMOVAL GUIDE Public Works Snow Removal Hotline: (973) 266-4030 My Orange Hotline: (973)
PW 001 SNOW REMOVAL AND SANDING FOR ROADWAYS AND SIDEWALKS October 6, 2014 (#223-14) Original October 19, 2015; October 15, 2018 Public Works
 Original October 19, 2015; October 15, 2018 Public Works") Policy Statement: The Village of Kitscoty will provide snow and ice control on municipal streets and sidewalks according to determined priorities. Purpose: To provide direction and information to employees
Policy Statement: The Village of Kitscoty will provide snow and ice control on municipal streets and sidewalks according to determined priorities. Purpose: To provide direction and information to employees
Weather Information for Surface Transportation (WIST): Update on Weather Impacts and WIST Progress
: Update on Weather Impacts and WIST Progress") Weather Information for Surface Transportation (WIST): Update on Weather Impacts and WIST Progress Samuel P. Williamson Office of the Federal Coordinator for Meteorological Services and Supporting Research
Weather Information for Surface Transportation (WIST): Update on Weather Impacts and WIST Progress Samuel P. Williamson Office of the Federal Coordinator for Meteorological Services and Supporting Research
2014 Data Collection Project ITE Western District
 2014 Data Collection Project ITE Western District Project Completed By: Oregon State University OSU ITE Student Chapter 101 Kearney Hall Corvallis, OR 97331 Student Coordinator: Sarah McCrea (OSU ITE Student
Xiaoguang Wang, Assistant Professor, Department of Geography, Central Michigan University Chao Liu,
 Xiaoguang Wang, Email: wang9x@cmich.edu Assistant Professor, Department of Geography, Central Michigan University Chao Liu, Email: cliu8@umd.edu Research Associate, National Center for Smart Growth, Research
15.0 Operations and Maintenance Cost Calculations
 15.0 Operations and Maintenance Cost Calculations 15.1 Introduction Operations and Maintenance (O&M) costs were calculated for each of the four alternatives being considered in the analysis. No Build Alternative
AASHTO Committee on Maintenance 2018 Annual Meeting July 25, Hurricane Irma- Preparation and Response
 AASHTO Committee on Maintenance 2018 Annual Meeting July 25, 2018 Hurricane Irma- Preparation and Response Rudy Powell Director, Office of Maintenance Satellite Aerial Image (September 10, 2017) Hurricane
2012 South Western Region Travel Time Monitoring Program
 2012 South Western Region Travel Time Monitoring Program Congestion Management Process Prepared by: South Western Regional Planning Agency 888 Washington Blvd, 3rd Floor Stamford, CT 06901 Telephone: 203.316.5190
2004 Report on Roadside Vegetation Management Equipment & Technology. Project 2156: Section 9
 2004 Report on Roadside Vegetation Management Equipment & Technology Project 2156: Section 9 By Craig Evans Extension Associate Doug Montgomery Extension Associate and Dr. Dennis Martin Extension Turfgrass
1.0 INTRODUCTION AND SUMMARY...
 TABLE OF CONTENTS 1.0 INTRODUCTION AND SUMMARY... 1 1.1 Purpose and Study Objective... 1 1.2 Executive Summary... 1 2.0 ROADWAY CONDITIONS... 5 2.1 Granville Parkway (South Intersection)... 8 2.2 Tuscany
BRUNSWICK COUNTY. North Carolina State Highway Patrol Coastal Evacuation Plan 1
 North Carolina State Highway Patrol Coastal Evacuation Plan 1 Contact Information for Emergency Management Director and EOC Contact Address Telephone Number Brian Watts Building C 3325 Old Ocean Hwy. Bolivia,
CATEX Hurricane Zachary
 CATEX Hurricane Zachary EXERCISE, EXERCISE,EXERCISE East Coast CATEX Power Restoration Functional Exercise 2013 This document was prepared under a grant from FEMA's Grants Programs Directorate, U.S. Department
Temporary College Closure Due to Inclement Weather or Other Adverse Conditions.
 OTHER TOPICS Index No. X-1 PROCEDURES MEMORANDUM TO: FROM: SUBJECT: MCC Students and Staff Office of the President Temporary College Closure Due to Inclement Weather or Other Adverse Conditions. DATE:
Greater Toronto Area Cordon Count Summary Analysis of Traffic Trends 1985 to 2011
 Greater Toronto Area Cordon Count Summary Analysis of Traffic Trends 1985 to 2011 Prepared by: Data Management Group Department of Civil Engineering University of Toronto Telephone: (416) 978-3916 Table
OREGON DEPARTMENT OF TRANSPORTATION STATEWIDE ROAD, WEATHER AND INCIDENT CONDITIONS 4/22/2019 4:20:05 AM
 OREGON DEPARTMENT OF TRANSPORTATION STATEWIDE ROAD, WEATHER AND INCIDENT CONDITIONS Incidents/: 4/22/2019 4:20:05 AM HWY372 22 22 Mount Bachelor Ski Area I-5 10 13 5 Mi S of Ashland Informational only
MUNICIPALITY OF ANCHORAGE PUBLIC TRANSPORTATION DEPARTMENT AnchorRIDES TRANSPORTATION SYSTEM
 Purpose: The Public Transportation Department and contracted provider will provide safe transportation for AnchorRIDES customers and employees during severe weather or emergency conditions. AnchorRIDES
Accessing and Using Indiana Traffic Data
 Accessing and Using Indiana Traffic Data Purdue Road School March 6, 2013 Presented by: Gregory Katter, PE Asset Planning Indiana Traffic Data 1. Overview of Traffic Data Collection Program 2. Accessing
An Integrated Approach to Statewide Travel Modeling Applications in Delaware
 TRB 88 th Annual Meeting Washington, D.C. January 14 th, 29 An Integrated Approach to Statewide Travel Modeling Applications in Delaware The Context: Challenges for Today s Modelers: Personnel: Vacant
Director, Operations Services, Met-Ed
 Director, Operations Services, Met-Ed Pennsylvania House Republican Policy Committee Hearing on Storm Response Tobyhanna Township Municipal Building Pocono Pines, Pa. August 9, 2018 Planning and Forecast
KAISER SOUTH NORTHERN VIRGINIA HUB TRAFFIC IMPACT STUDY PRINCE WILLIAM COUNTY, VIRGINIA TABLE OF CONTENTS. Section 2 BACKGROUND INFORMATION 12
 KAISER SOUTH NORTHERN VIRGINIA HUB TRAFFIC IMPACT STUDY PRINCE WILLIAM COUNTY, VIRGINIA TABLE OF CONTENTS Page EXECUTIVE SUMMARY 1 Purpose of Report and Study Objectives... 1 Site Location and Study Area...
PLAZA MEXICO RESIDENCES
 PLAZA MEXICO RESIDENCES TRAFFIC STUDY PREPARED FOR: 3000 E. IMPERIAL, LLC. 6940 Beach Boulevard, D-501 Buena Park, California 90621 PREPARED BY: OCTOBER 5, 2017 translutions the transportatio n solutions
TRAFFIC IMPACT STUDY MANUFACTURING COMPANY
 TRAFFIC IMPACT STUDY For MANUFACTURING COMPANY Prepared For: Airway Heights, WA Prepared By: SUNBURST ENGINEERING, P. S. 4310 S. Ball Dr. Veradale, WA 99037 April, 2013 TRAFFIC IMP ACT STUDY Manufacturing
APPENDIX G Halton Region Transportation Model
 APPENDIX G Halton Region Transportation Model Halton Region Transportation Master Plan Working Paper No. 1 - Legislative Context Working Paper No. 2 - Active Transportation Halton Transportation Model
SNOW AND ICE REMOVAL. Policy i
 Table of Contents SNOW AND ICE REMOVAL Policy 828.1 PURPOSE... 1.2 APPLICABILITY... 1.4 GENERAL POLICIES... 1 4.1 WEATHER MONITORING... 1 4.2 EQUIPMENT PREPARATION... 2 4.3 EMPLOYEE NOTIFICATION AND SHIFTS...
Appendix B.1 EMME Model Calibration Memo
 Appendix B.1 EMME Model Calibration Memo itrans 144 Front Street West, Suite 655 Toronto, ON M5J 2L7 Tel: (416) 847-0005 Fax: (905) 882-1557 www.hdrinc.com www.itransconsulting.com File: 2.0 Memorandum
West Virginia University Department of Civil and Environmental Engineering Course Syllabus
 West Virginia University Department of Civil and Environmental Engineering Course Syllabus Course: CE 305 - Introduction to Geomatics Semester: Summer 2012 (6 weeks) May 21 June 29 Course Format And Credit
Winter Storm Response - January 2016 Due to the uncertainty of the event, we must be prepared
 Winter Storm Response - January 2016 Due to the uncertainty of the event, we must be prepared 1 Highway Patrol Winter Storm Operations 48 Hours Pre-Storm Met with State Emergency Management Team to discuss
GIS ANALYSIS METHODOLOGY
 GIS ANALYSIS METHODOLOGY No longer the exclusive domain of cartographers, computer-assisted drawing technicians, mainframes, and workstations, geographic information system (GIS) mapping has migrated to
FARM 1065 PORTION 1, ATLANTIS TRAFFIC IMPACT ASSESSMENT
 FARM 1065 PORTION 1, ATLANTIS TRAFFIC IMPACT ASSESSMENT February 2018 FIRST ISSUE Prepared by: JG AFRIKA (PTY) LTD Branch: Cape Town PO Box 38561 Postal code: 7430 Telephone: 021 530 1800 Email: wink@
Neighborhood Locations and Amenities
 University of Maryland School of Architecture, Planning and Preservation Fall, 2014 Neighborhood Locations and Amenities Authors: Cole Greene Jacob Johnson Maha Tariq Under the Supervision of: Dr. Chao
SHORT NIGHTTIME WATER SHUTDOWN TO OCCUR IN EARLY HOURS OF MAY 29
 Thank you for your interest in the Center City Connector Streetcar. In this weekly update, you ll find information about ongoing construction for the 1st phase of utility work in Pioneer Square. UPDATES
Appendix B. Traffic Analysis Report
 Appendix B Traffic Analysis Report Report No. 14369/TR/WN02 August 2007 SALLINS BYPASS BYPASS OPTIONEERING ANALYSIS - TRAFFIC REPORT Kildare County Council Áras Chill Dara, Devoy Park, Naas, Co Kildare
Appendix I: Traffic Study
 City of Fontana Sierra Lakes Commerce Center Draft EIR Appendix I: Traffic Study FirstCarbon Solutions H:\Client (PN JN)\0144\01440050\EIR\1 ADEIR\01440050 Sec99 99 Appendix Dividers.doc THIS PAGE INTENTIONALLY
I. M. Schoeman North West University, South Africa. Abstract
 Urban Transport XX 607 Land use and transportation integration within the greater area of the North West University (Potchefstroom Campus), South Africa: problems, prospects and solutions I. M. Schoeman
Effect of Environmental Factors on Free-Flow Speed
 Effect of Environmental Factors on Free-Flow Speed MICHAEL KYTE ZAHER KHATIB University of Idaho, USA PATRICK SHANNON Boise State University, USA FRED KITCHENER Meyer Mohaddes Associates, USA ABSTRACT
Hurricane Florence: Rain this heavy comes along once every 1,000 years
 Hurricane Florence: Rain this heavy comes along once every 1,000 years By Associated Press, adapted by Newsela staff on 09.17.18 Word Count 786 Level 810L Image 1. This satellite image provided by the
BxM9. Throgs Neck, Bronx, and Midtown, Manhattan. Between. Express Service. Bus Timetable. Effective Winter MTA Bus Company
 Bus Timetable Effective Winter 2019 MTA Bus Company BxM9 Express Service Between Throgs Neck, Bronx, and Midtown, Manhattan If you think your bus operator deserves an Apple Award our special recognition
Brandywine Road Speed Study FINAL REPORT
 Brandywine Road Speed Study FINAL REPORT City of Albuquerque Brandywine Road Speed Study Final Report Albuquerque, New Mexico City of Albuquerque May, 2016 Brandywine Road Speed Study Final Report City
Cover photo courtesy of Missouri Department of Transportation.
 The East-West Gateway Council of Governments (EWG) hereby gives public notice that it is the policy of the agency to assure full compliance with Title VI of the Civil Rights Act of 1964, the Civil Rights
OREGON DEPARTMENT OF TRANSPORTATION STATEWIDE ROAD, WEATHER AND INCIDENT CONDITIONS 4/24/2019 5:16:03 PM
 OREGON DEPARTMENT OF TRANSPORTATION STATEWIDE ROAD, WEATHER AND INCIDENT CONDITIONS Incidents/: 4/24/2019 5:16:03 PM HWY372 22 22 Mount Bachelor Ski Area I-5 10 13 5 Mi S of Ashland Informational only