PLAZA MEXICO RESIDENCES
|
|
|
- Madeline Oliver
- 5 years ago
- Views:
Transcription

1 PLAZA MEXICO RESIDENCES TRAFFIC STUDY PREPARED FOR: 3000 E. IMPERIAL, LLC Beach Boulevard, D-501 Buena Park, California PREPARED BY: OCTOBER 5, 2017 translutions the transportatio n solutions company... translutions, inc Irvine Boulevard, Suite 200 Tustin, California (949)
2 Plaza Mexico Residences Traffic Study October 2017 TABLE OF CONTENTS 1.0 INTRODUCTION Purpose of the Traffic Study and Study Objectives Project Location & Study Area PROJECT DESCRIPTION Project Trip Generation Project Trip Distribution & Assignment LOS DEFINITIONS, PROCEDURES, AND THRESHOLDS Intersection Levels of Service Levels of Service Thresholds VOLUME DEVELOPMENT METHODOLOGY Existing Traffic Volumes Opening Year (2019) Traffic Volumes Cumulative (2019) Traffic Volumes Existing, Opening Year (2019), and Cumulative (2019) With Project Traffic Volumes EXISTING CONDITIONS Existing Roadway Conditions Existing Transit Service Existing Pedestrian & Bicycle Facilities Existing Intersections Levels of Service Existing Plus Project Intersections Levels of Service OPENING YEAR (2019) CONDITIONS Opening Year (2019) Roadway Conditions Opening Year (2019) Transit Service Opening Year (2019) Pedestrian & Bicycle Facilities Opening Year (2019) Intersections Levels of Service Opening Year (2019) With Project Intersections Levels of Service Cumulative (2019) Intersections Levels of Service Cumulative (2019) With Project Intersections Levels of Service CIRCULATION IMPROVEMENTS Existing, Opening Year, and Cumulative With Project Circulation Improvements QUEUING ANALYSIS STATE STREET VOLUME ANALYSIS VEHICLE MILES TRAVELED Proposed CEQA Metrics Existing VMT i the transportation solutions company...
3 Plaza Mexico Residences Traffic Study October Existing Plus Project VMT IMPACT ANALYSIS FOR CEQA DETERMINATION SUMMARY & CONCLUSIONS FIGURES APPENDICES Appendix A: Traffic Counts Appendix B: Detailed Volume Development Worksheets Appendix C: Level of Service Worksheets Appendix D: Queuing Analysis Worksheets Appendix E: CSTDM outputs and VMT calculations. FIGURES AND TABLES Figure 1: Regional Project Location... 2 Figure 2: Site Plan... 3 Figure 3: Study Area Intersections... 5 Figure 4: Project Trip Distribution (Apartments)... 8 Figure 5: Project Trip Distribution (Retail)... 9 Figure 6: Project Trip Assignment (Apartments) Figure 7: Project Trip Assignment (Retail) Figure 8: Total Project Trip Assignment Figure 9: Existing Intersection Geometrics and Stop Control Figure 10: Existing Peak Hour Traffic Volumes Figure 11: Existing Plus Project Peak Hour Traffic Volumes Figure 12: Opening Year (2019) Peak Hour Traffic Volumes Figure 13: Opening Year (2019) With Project Peak Hour Traffic Volumes Figure 14: Cumulative (2019) Peak Hour Traffic Volumes Figure 15: Cumulative (2019) With Project Peak Hour Traffic Volumes Figure 16: With Project With Improvements Intersection Geometrics and Stop Control TABLES Table A: Project Trip Generation... 6 Table B: Levels of Service Criteria Table C: Cumulative Projects Trip Generation Table D: Existing Intersection Levels of Service Table E: Opening Year (2019) Intersection Levels of Service Table F: Cumulative (2019) Intersection Levels of Service Table G: With Project With Improvements Intersection Levels of Service Table H: Queuing Analysis Table I: Project VMT Analysis ii the transportation solutions company...
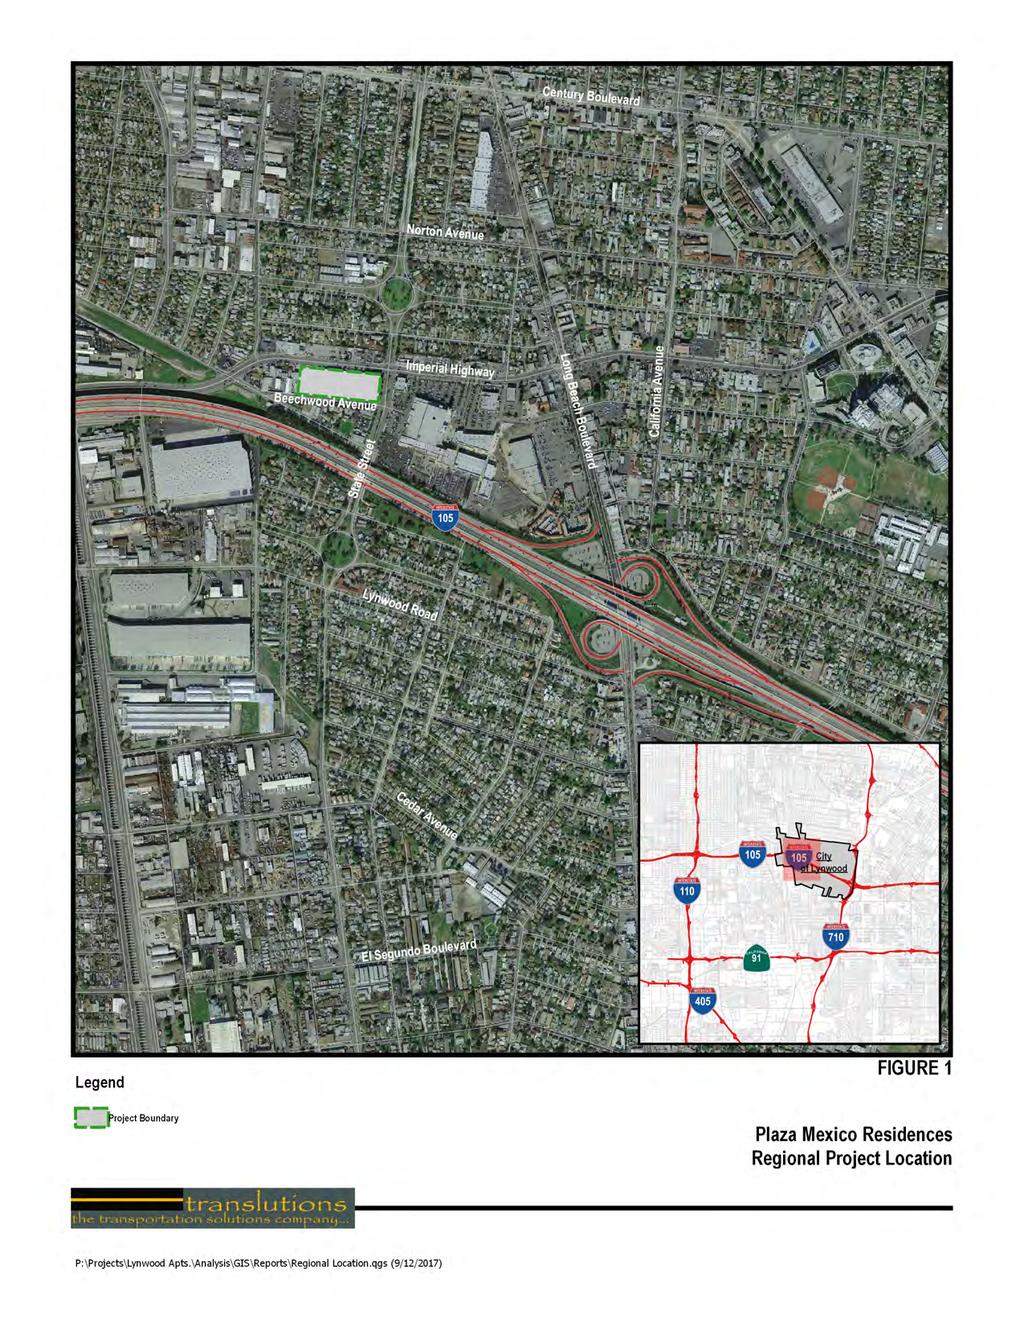
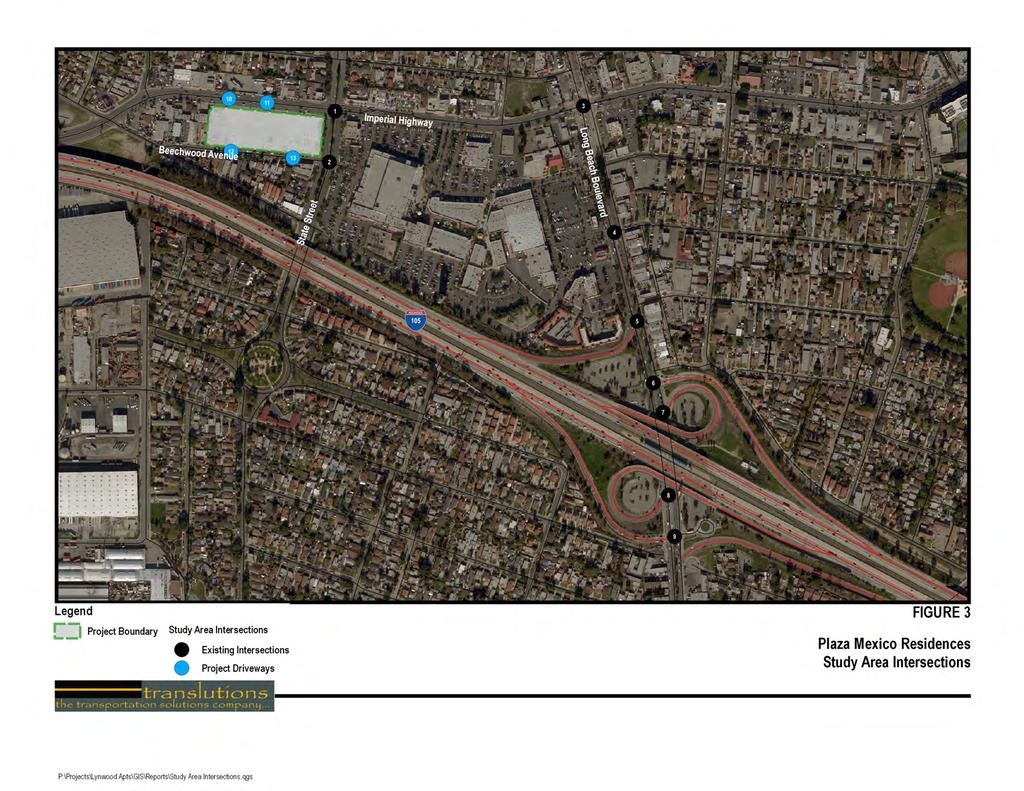
4 Plaza Mexico Residences Traffic Study October INTRODUCTION This report presents the methodology, findings and conclusions of the traffic study prepared for the proposed Plaza Mexico Residences project (the project). The proposed project will be located on the southwest corner of State Street and Imperial Highway in the City of Lynwood in Los Angeles County. The proposed project consists of 348 apartment dwelling units and approximately 26,150 square feet of retail/restaurant uses and is part of the Lynwood Transit Area Specific Plan. 1.1 Purpose of the Traffic Study and Study Objectives This report is intended to satisfy the requirements for a traffic study established by the 2010 Los Angeles County Congestion Management Program (CMP), the Los Angeles County TIA Report Guidelines, as well as the requirements for the disclosure of potential impacts and mitigation measures per the California Environmental Quality Act (CEQA). The CMP is implemented by the Los Angeles County Metropolitan Transportation Authority. The CMP requires analysis of off-site intersections potentially affected by the project, which the CMP defines as intersections at which the project is forecast to add 50 or more peak hour trips. This report evaluates 13 intersections under six analysis scenarios, and proposes circulation improvements for intersections that operate or are forecast to operate at unsatisfactory levels of service. As requested by Caltrans, this report also includes a queuing analysis at Caltrans facilities on Long Beach Boulevard to determine the sufficiency of turn pocket storage lengths are adequate to meet projected demand. 1.2 Project Location & Study Area As stated earlier, the project is located on the southwest corner of State Street/Imperial Highway in the City of Lynwood and is part of the Lynwood Transit Area Specific Plan. Bordered by the cities of South Gate to the north and Compton to the south, Lynwood is an incorporated municipality that is bisected in two by the Century Freeway (I-105) connecting the Los Angeles International Airport to the City of Norwalk. The Los Angeles County Metropolitan Transportation Authority s (LA Metro) Green Line runs along the center median of the Century Freeway and includes a rail station at the interchange with Long Beach Boulevard and is a key transit feature within Lynwood. Figure 1 shows the regional location of the project. The proposed project consists of 348 apartment dwelling units and approximately 26,150 square feet of retail/restaurant uses and is planned to open in Figure 2 illustrates the site plan of the proposed project. Based on the trip generation and trip distribution of the proposed project, and based on discussion with City staff, this report analyzes the following 13 intersections for traffic operations: 1. State Street/Imperial Highway; 2. State Street/Beechwood Avenue; 3. Long Beach Boulevard/Imperial Highway; 4. Long Beach Boulevard/Sanborn Avenue; 5. Long Beach Boulevard/I-105 Westbound Slip On-Ramp; 6. Long Beach Boulevard/I-105 Westbound Off-Ramp; 7. Long Beach Boulevard/I-105 Westbound Loop On-Ramp; 8. Long Beach Boulevard/I-105 Eastbound Loop On-Ramp; 9. Long Beach Boulevard/I-105 Eastbound Off-Ramp; 10. Driveway 1/Imperial Highway; 11. Driveway 2/Imperial Highway; 1 the transportation solutions company...
5
 FIGURE 2 Plaza Mexico Residences Site Plan the transportation solutions company.")
6 Source: Nadal Residential & Commercial Inc. (9/18/17) FIGURE 2 Plaza Mexico Residences Site Plan the transportation solutions company... D:\Projects\Plaza Mexico Apartments\Z30 Site Plan (10/3/2017)
7 Plaza Mexico Residences Traffic Study October Driveway 3/Imperial Highway; and 2. Driveway 4/Imperial Highway. Figure 3 illustrates intersections included in the traffic study. 1.3 Analysis Scenarios Based on the CMP and discussion with City staff, this report analyzes traffic conditions for the following six scenarios: 1. Existing Conditions; 2. Existing Plus Project Conditions; 3. Opening Year (2019) Conditions; 4. Opening Year (2019) With Project Conditions; 5. Cumulative (2019) Conditions; and 6. Cumulative (2019) With Project Conditions. Consistent with the CMP, this report analyzes weekday a.m. and p.m. peak hour conditions. The a.m. peak hour is defined as the one hour of highest traffic volumes occurring between 7:00 a.m. and 9:00 a.m. The p.m. peak hour is defined as the one hour of highest traffic volumes occurring between 4:00 and 6:00 p.m. 2.0 PROJECT DESCRIPTION The project site is currently vacant and consists of approximately 3.5 acres. Access to the project site will be provided via two driveways on Imperial Highway and two driveways on Beechwood Avenue. The westerly driveway on Imperial Highway will inlcude right-in/right-out/left-in access only and the easterly driveway on Imperial Highway will include right-in/right-out access only. The two driveways on Beechwood Avenue will be full access driveways. 2.1 Project Trip Generation The trip generation for the proposed project is based on the trip generation rates for Land Use 220 Apartments, Land Use 820 Shopping Center, and Land Use 932 High-Turnover (Sit-Down) Restaurant included in the Institute of Transportation Engineers (ITE) Trip Generation, 9 th Edition. Shopping Center/Restaurant uses will typically draw some of its trips from the adjacent street traffic, so that some of the project trips are not actually new trips to the adjacent circulation system. These trips are referred to as pass-by trips. Pass-by trips are trips that are on the roadway immediately adjacent to the retail center which make intermediate stops on the way from an origin to a primary trip destination without route diversion. Pass-by trips were calculated using rates from ITE Trip Generation Handbook (3rd Edition). A portion of trips generated by two distinct land uses at a mixed-use site are referred to as internal trips. These trips do not use the off-site road system and can be made by personal passenger vehicle, walking, bicycling, or transit. Internal trips were calculated using rates from ITE Trip Generation Handbook (3rd Edition). The LA Metro Green Line runs along the center median of the Century Freeway and includes a rail station at the interchange with Long Beach Boulevard. Due to the proximity of the rail station to the project site (approximately 0.5 miles), a transit reduction of 3.5% was estimated and applied to the trip generation. Table A shows the calculation of the project trip generation for the a.m. peak hour, p.m. peak hour, and weekday. As shown in Table A, after applying 4 the transportation solutions company...
8
9 the transportation solutions company... Table A - Project Trip Generation A.M. Peak Hour P.M. Peak Hour Land Use Units In Out Total In Out Total Daily Apartments Trip Generation Rates Trip Generation 348 DU ,314 Internal Trips 2 (5) (4) (9) (5) (6) (11) (154) Transit Reduction 3 3.5% (1) (5) (6) (5) (2) (7) (76) Net Trip Generation ,084 Retail Trip Generation Rates Trip Generation TSF Pass-By Trips 5 0/34%/24% (9) (8) (17) (134) Internal Trips 2 (2) (3) (8) (3) (3) (9) (77) Transit Reduction 3 3.5% (0) (0) (0) (0) (1) (1) (12) Net Trip Generation Restaurant Trip Generation Rates Trip Generation TSF ,662 Pass-By Trips 7 0/43%/33% (28) (27) (55) (548) Internal Trips 2 (2) (3) (8) (3) (3) (9) (77) Transit Reduction 3 3.5% (3) (2) (5) (2) (1) (2) (36) Net Trip Generation ,001 Total Trip Generation ,534 Pass-By Trips (37) (35) (72) (682) Internal Trips (9) (9) (25) (11) (11) (29) (308) Transit Reduction 7 3.5% (4) (7) (11) (7) (4) (10) (124) Net New Trip Generation ,420 1 Trip generation based on rates for Land Use "Apartment" from Institute of Transportation Engineers' (ITE) Trip Generation (9th Edition). Internal Trips based on ITE Trip Generation Handbook (3rd Edition). The transit reduction percentage of 3.5% is was estimated and derived from Appendix D Guidelines for CMP Transportation Impact Analysis, Los Angeles County CMP. Trip generation based on rates for Land Use "Shopping Center" from Institute of Transportation Engineers' (ITE) Trip Generation (9th Edition). Pass-By rates based on Land Use "Shopping Center" from ITE Trip Generation Handbook (3rd Edition). Pass-By rates for the p.m. peak hour, and daily traffic. Daily pass-by rates have been assumed to be 10% less than the p.m. peak hour pass-by rate. Trip generation based on rates for Land Use "High-Turnover (Sit-Down) Restaurant from Institute of Transportation Engineers' (ITE) Trip Generation (9th Edition). Pass-By rates based on Land Use "High-Turnover (Sit-Down) Restaurant" from ITE Trip Generation Handbook (3rd Edition). Pass-By rates for the p.m. peak hour, and daily traffic. Daily pass-by rates have been assumed to be 10% less than the p.m. peak hour pass-by rate D:\Projects\Plaza Mexico Apartments\Project Trips
10 Plaza Mexico Residences Traffic Study October 2017 credits for pass-by trips, internal trips, and transit reduction, the proposed project is forecast to generate 295 net new trips in the a.m. peak hour, 283 net new trips in the p.m. peak hour, and 3,420 net new daily trips. 2.2 Project Trip Distribution & Assignment Trip distribution patterns for the proposed project were developed based on location of local and regional destinations and in consultation with City staff. Figure 4 shows the apartment trip distribution for project trips. Figure 5 shows the retail trip distribution for project trips. The project trip generation was applied to each trip distribution pattern to develop trip assignments for apartment and retail trips. Figure 6 shows the project trip assignment for apartments trips and Figure 7 shows the project trip assignment for retail trips at the study area intersections. Figure 8 illustrates the total project trip assignment at the study area intersections. 3.0 LOS DEFINITIONS, PROCEDURES, AND THRESHOLDS Level of service (LOS) is a measure of the quality of operational conditions within a traffic stream, and is generally expressed in terms of such measures as speed and travel time, freedom to maneuver, traffic interruptions, and comfort and convenience. Levels range from A to F, with LOS A representing excellent (free flow) conditions and LOS F representing extreme congestion. Consistent to the CMP, the Intersection Capacity Utilization (ICU) procedures have been used to evaluate levels of service for the signalized study area intersections in the City of Lynwood. The Highway Capacity Manual (HCM) 6 th Edition procedures have been used to analyze all un-signalized intersections and Caltrans facilities on Long Beach Boulevard. This section discusses the LOS definitions, procedures, and thresholds used in this report. 3.1 Intersection Levels of Service The analysis of traffic operations at signalized intersections in Lynwood was conducted according to the ICU methodologies. The ICU values represent volume/capacity (v/c) ratios for the peak hours, providing a measure of system performance. The analysis of traffic operations at all un-signalized intersections and Caltrans facilities was conducted according to the Highway Capacity Manual 6 th Edition (HCM) delay methodologies, which is described in the Highway Capacity Manual (Transportation Research Board, Washington, D.C., December 2016). Under the HCM methodology, LOS for signalized intersections is based on the average delay experienced by vehicles traveling through an intersection, whereas for un-signalized intersections, the LOS is based on the worst approach where the minor leg has a shared lane and on the worst movement where the minor leg has dedicated turn lanes. Table B presents a brief description of each level of service letter grade, as well as the ICU and HCM range of delays associated with each grade. 3.2 Levels of Service Thresholds All study intersections are under the jurisdiction of the City of Lynwood and Caltrans. The City of Lynwood uses LOS D as its minimum level of service standard. The City uses the Los Angeles County significant impact thresholds to determine project impacts, which considers an impact significant if the project related increase in volume to capacity ratio exceeds the following: LOS C project v/c increase > 0.04; LOS D project v/c increase > 0.02; and LOS E/F project v/c increase > Caltrans considers LOS D as the minimum level of service standard for all intersections under its jurisdiction. Therefore, study intersections operating at LOS E or F are required to be mitigated to LOS D or better. 7 the transportation solutions company...
 25% 45% 25% (5%) 25% (25%) 6 Long Beach Blvd/I-105 WB Off Ramp 7 Long Beach Blvd/I-105 WB Loop On Ra 8 Long Beach Blvd/I-105")
 Inbound%(Outbound%) Distribution Plaza Mexico Residences Project Trip Distribution (Apartments) the transportation solutions")
11 40% 35% 10% (5%) (40%) (5%) (40%) (5%) (10%) (50%) 5% 5% (5%) (35%) 40% 5% 5% 50% (50%) 50% (25%) (25%) 50% 1 State St/Imperial Highway 2 State St/Beechwood Ave 3 Long Beach Blvd/Imperial Highway 4 Long Beach Blvd/Sanborn Ave 5 Long Beach Blvd/I-105 WB Slip On Ram (25%) 25% 45% 25% (5%) 25% (25%) 6 Long Beach Blvd/I-105 WB Off Ramp 7 Long Beach Blvd/I-105 WB Loop On Ra 8 Long Beach Blvd/I-105 EB Loop On Ra 9 Long Beach Blvd/I-105 EB Off Ramp 10 Driveway 1/Imperial Highway (7%) (25%) (3%) (20%) 25% 20% 45% (3%) 25% (40%) 7% 3% 3% (25%) 25% (25%) 25% (40%) 11 Driveway 2/Imperial Highway 12 Driveway 3/Beechwood Ave 13 Driveway 4/Beechwood Ave FIGURE 4 XX%(YY%) Inbound%(Outbound%) Distribution Plaza Mexico Residences Project Trip Distribution (Apartments) the transportation solutions company... D:\Projects\Plaza Mexico Apartments\Z30 Project Dist Apt (10/3/2017)
12 49% 5% 26% 2% (20%) (13%) (8%) (5%) (2%) (26%) (49%) (10%) (6%) 5% 3% 6%(5%) (3%) (5%) 8% (6%) 2% 6% 8% 10% 1 State St/Imperial Highway 2 State St/Beechwood Ave 3 Long Beach Blvd/Imperial Highway 4 Long Beach Blvd/Sanborn Ave 5 Long Beach Blvd/I-105 WB Slip On Ram (6%) (2%) 6% (6%) 6% (6%) (6%) (6%) (6%) 25% 6% 6% 6% 6% (25%) 60% 6 Long Beach Blvd/I-105 WB Off Ramp 7 Long Beach Blvd/I-105 WB Loop On Ra 8 Long Beach Blvd/I-105 EB Loop On Ra 9 Long Beach Blvd/I-105 EB Off Ramp 10 Driveway 1/Imperial Highway (5%) (15%) 60%(25%) (5%) 10% 85% 5% 5% (80%) 11 Driveway 2/Imperial Highway 12 Driveway 3/Beechwood Ave 13 Driveway 4/Beechwood Ave FIGURE 5 XX%(YY%) Inbound%(Outbound%) Distribution Plaza Mexico Residences Project Trip Distribution (Retail) the transportation solutions company... D:\Projects\Plaza Mexico Apartments\Z30 Project Dist Retail (10/3/2017)
13 12/52 10/46 3/13 7/3 53/27 7/3 53/27 7/3 13/7 67/34 1/7 1/7 7/3 47/24 12/52 1/7 1/7 14/65 67/34 14/65 33/17 33/17 14/65 1 State St/Imperial Highway 2 State St/Beechwood Ave 3 Long Beach Blvd/Imperial Highway 4 Long Beach Blvd/Sanborn Ave 5 Long Beach Blvd/I-105 WB Slip On Ram 33/17 7/33 13/59 7/33 7/3 7/33 33/17 6 Long Beach Blvd/I-105 WB Off Ramp 7 Long Beach Blvd/I-105 WB Loop On Ra 8 Long Beach Blvd/I-105 EB Loop On Ra 9 Long Beach Blvd/I-105 EB Off Ramp 10 Driveway 1/Imperial Highway 9/5 33/17 7/33 4/2 27/14 7/33 6/26 13/59 4/2 7/33 53/27 2/9 1/4 1/4 33/17 33/17 7/33 53/27 11 Driveway 2/Imperial Highway 12 Driveway 3/Beechwood Ave 13 Driveway 4/Beechwood Ave FIGURE 6 XX/YY AM/PM Peak Hour Trips Plaza Mexico Residences Project Trip Assignment (Apartments) the transportation solutions company... D:\Projects\Plaza Mexico Apartments\Z30 Trips Apt (10/3/2017)
14 39/27 4/3 21/14 2/1 12/7 8/5 5/3 3/2 1/1 16/9 30/18 6/4 4/2 4/3 2/2 8/5 2/1 3/2 6/4 4/2 2/1 5/3 6/4 8/6 1 State St/Imperial Highway 2 State St/Beechwood Ave 3 Long Beach Blvd/Imperial Highway 4 Long Beach Blvd/Sanborn Ave 5 Long Beach Blvd/I-105 WB Slip On Ram 4/2 1/1 5/3 4/2 5/3 4/2 4/2 4/2 4/2 20/14 5/3 5/3 5/3 5/3 15/9 47/33 6 Long Beach Blvd/I-105 WB Off Ramp 7 Long Beach Blvd/I-105 WB Loop On Ra 8 Long Beach Blvd/I-105 EB Loop On Ra 9 Long Beach Blvd/I-105 EB Off Ramp 10 Driveway 1/Imperial Highway 3/2 9/5 62/42 3/2 8/6 67/47 4/3 4/3 49/29 11 Driveway 2/Imperial Highway 12 Driveway 3/Beechwood Ave 13 Driveway 4/Beechwood Ave FIGURE 7 XX/YY AM/PM Peak Hour Trips Plaza Mexico Residences Project Trip Assignment (Retail) the transportation solutions company... D:\Projects\Plaza Mexico Apartments\Z30 Trips Retail (10/3/2017)
15 5/10 3/9 51/79 14/49 24/27 2/1 12/7 61/32 12/6 10/5 8/4 29/16 83/45 73/38 4/2 8/5 9/4 50/26 18/56 4/2 3/8 5/3 7/11 22/71 1 State St/Imperial Highway 2 State St/Beechwood Ave 3 Long Beach Blvd/Imperial Highway 4 Long Beach Blvd/Sanborn Ave 5 Long Beach Blvd/I-105 WB Slip On Ram 71/36 1/1 19/68 33/17 37/19 19/68 15/9 13/59 7/33 47/33 7/33 20/14 37/19 37/19 33/17 4/2 12/36 12/36 12/36 5/3 53/27 4/2 6 Long Beach Blvd/I-105 WB Off Ramp 7 Long Beach Blvd/I-105 WB Loop On Ra 8 Long Beach Blvd/I-105 EB Loop On Ra 9 Long Beach Blvd/I-105 EB Off Ramp 10 Driveway 1/Imperial Highway 9/5 33/17 7/4 36/19 7/33 14/32 75/101 7/4 7/33 53/27 2/9 5/7 67/47 5/7 33/17 56/32 11 Driveway 2/Imperial Highway 12 Driveway 3/Beechwood Ave 13 Driveway 4/Beechwood Ave FIGURE 8 XX/YY AM/PM Peak Hour Trips Plaza Mexico Residences Total Project Trip Assignment the transportation solutions company... D:\Projects\Plaza Mexico Apartments\Z30 Trips Total Net (10/3/2017)
16 Plaza Mexico Residences Traffic Study October 2017 Table B: Levels of Service Criteria LOS A B C D E F Description of Drivers Perception and Traffic Operation This level is typically assigned when the volume-tocapacity ratio is low and either progression is exceptionally favorable or the cycle length is very short. If it is due to favorable progression, most vehicles arrive during the green indication and travel through the intersection without stopping. This level is assigned when the volume-to-capacity ratio is low and either progression is highly favorable or the cycle length is short. More vehicles stop than with LOS A. This level is typically assigned when progression is favorable or the cycle length is moderate. Individual cycle failures (i.e., one or more queued vehicles are not able to depart as a result of insufficient capacity during the cycle) may begin to appear at this level. The number of vehicles stopping is significant, although many vehicles still pass through the intersection without stopping. This level is typically assigned when the volume-tocapacity ratio is high and either progression is ineffective or the cycle length is long. Many vehicles stop and individual cycle failures are noticeable. This level is typically assigned when the volume-tocapacity ratio is high, progression is unfavorable, and the cycle length is long. Individual cycle failures are frequent. This level is typically assigned when the volume-tocapacity ratio is very high, progression is very poor, and the cycle length is long. Most cycles fail to clear the queue. HCM (Delay in Seconds) ICU Unsignalized Signalized < 10 < > 10 and < 15 > 10 and < > 15 and < 25 > 20 and < > 25 and < 35 > 35 and < > 35 and < 50 > 55 and < > 50 > 80 >1.0 Source: Highway Capacity Manual, 2016/2010 LA County CMP 13 the transportation solutions company...
17 Plaza Mexico Residences Traffic Study October VOLUME DEVELOPMENT METHODOLOGY Forecast traffic volumes at study intersections were developed based on discussion with City staff and consistent with CMP guidelines. 4.1 Existing Traffic Volumes Existing traffic volumes are based on peak hour intersection turn movement counts collected by National Data and Surveying Services in September 2017 and April For counts collected in 2015, an annual growth rate was applied for two years (2015 to 2017). The growth rate is based on forecast growth factors from the CMP. Count sheets are contained in Appendix A. Detailed volume development worksheets are included in Appendix B. 4.2 Opening Year (2019) Traffic Volumes Opening year (2019) peak hour traffic volumes were developed by applying an annual growth rate per year (2017 to 2019) to the existing volumes at each study intersection. The growth rate is based on forecast growth factors from the CMP. Detailed volume development worksheets are included in Appendix B. 4.3 Cumulative (2019) Traffic Volumes Based on discussion with City staff, cumulative (2019) peak hour traffic volumes were developed by adding cumulative project trips to the opening year (2019) peak hour traffic volumes at each study intersection. Information for cumulative projects in the vicinity of the project was obtained from the City of Lynwood. Table C lists the cumulative projects included in the analysis. As shown in Table C, the cumulative projects are anticipated to generate 370 a.m. peak hour net new trips, 488 p.m. peak hour net trips, and 6,753 daily net new trips. Detailed volume development worksheets are included in Appendix B. 4.4 Existing, Opening Year (2019), and Cumulative (2019) With Project Traffic Volumes Traffic volumes for existing, opening year (2019), and cumulative (2019) with project conditions were developed by adding the trip assignment to the corresponding (i.e. existing and cumulative) without project peak hour traffic volumes. 5.0 EXISTING CONDITIONS This section discusses the existing transportation conditions in the study area. 5.1 Existing Roadway Conditions Regional access to the project site is provided by Interstate 105 to the south. Major roadways within the project area are discussed below: Interstate 105 is an east-west Freeway south of the project site. This east-west roadway has three general purpose lanes and one high-occupancy vehicle lane in each direction. There is an interchange with Interstate 710 to the east. Long Beach Boulevard is a north-south four and six lane arterial street with parking permitted on the northbound side of Interstate 105 interchange. The speed limit is 35 miles per hour. State Street is a north-south four-lane arterial street with a raised median and parking permissible on both side of the street within the project area. The speed limit is 35 miles per hour. Imperial Highway is an east-west four-lane arterial street within the project area and four to six lanes within the city limits. The speed limit is 35 miles per hour. 14 the transportation solutions company...
18 the transportation solutions company... Table C - Cumulative Projects Trip Generation A.M. Peak Hour P.M. Peak Hour Land Use Location Units In Out Total In Out Total Daily 1. Warehouse 1 Southeast corner of Alameda St./Philadelphia Way Trip Generation Autos TSF Trip Generation Truck PCEs Total PCEs Northgate Market 2 Northeast corner of Long Beach Blvd./Lousie St. Net New Project Trips , Apartments 3 Southside of Fernwood Ave. between Alameda Ave. and Imperial Hwy. Trip Generation Rates 169 DU Trip Generation ,124 Total Net Trip Generation , Rates based on Land Use 150 "Warehousing" from Institute of Transportation Engineers (ITE) Trip Generation (9th Edition). Recommended Truck Mix Percentages Per City of Fontana Truck Trip Generation Study for Heavy Warehouses, August 2. Trip generation based on Northgate Market Traffic Impact Analysis by Linscott, Law, & Greenspan Engineers (September 2017). 3 Trip generation based on rates for Land Use "Apartment" from Institute of Transportation Engineers' (ITE) Trip Generation (9th Edition). P:\Plaza Mexico Apartments\Cumulative Project Trips
19 Plaza Mexico Residences Traffic Study October 2017 Beechwood Avenue is an east-west two-lane roadway within the project area. The speed limit is 25 miles per hour. 5.2 Existing Transit Service Public transportation services near the proposed project include Metro bus transit service and the Metro Rail system. These services are further described below. Fixed Route Bus Service: Public transportation is provided by Metro, which provides the City of Lynwood with links to the region. These systems include Metro routes 60, 120, 251, 260, and 612. Within the project area, routes 120 and 612 run on Imperial Highway. The Lynwood Trolley/Breeze also provides service through the City with the Purple, Red, Green, and Blue Lines. The Blue Line runs on Imperial Highway and the Red Line runs on State Street and Imperial Highway within the project area. Rail Service: The Metro Rail system runs through Lynwood, which is part of Metro s overall transportation strategy to improve mobility in Los Angeles County and throughout the surrounding southern California area. The Long Beach Boulevard Metro Green Line Station is located 0.5 miles from the project site. The Green Line connects to Redondo Beach to the west, and Norwalk to the east. Metro Rail cars are equipped with designated space for bicycles. The Green Line also connects to the Metro Blue Line via the Willowbrook/Rosa Parks station, which is the next stop on the Green Line to the west. 5.3 Existing Pedestrian & Bicycle Facilities Pedestrian circulation in the project area is primarily provided via sidewalks. Most roadways within the City have sidewalks on either side. Within the project area, there are existing sidewalks on Imperial Highway, State Street, Long Beach Boulevard, and Beechwood Avenue. Very little formal bicycle striping or signage exists in the City. On many roadways, right-of-way is not available for striped bicycle lanes without removing on-street parking or widening the roadway. 5.4 Existing Intersections Levels of Service An intersection level of service analysis was conducted for existing conditions to determine current circulation system performance. Figure 9 shows the lane geometrics and stop controls at the study intersections. The existing traffic volumes at study intersections are illustrated in Figure 10. Detailed volume development worksheets are included in Appendix B. The existing levels of service for the study area intersections are summarized in Table D. Level of service calculation worksheets are contained in Appendix C. As shown in Table D, all study area intersections are currently operating at satisfactory levels of service with the exception of State Street/Beechwood Avenue in the p.m. peak hour. 5.5 Existing Plus Project Intersections Levels of Service An intersection level of service analysis was conducted for existing plus project conditions to determine circulation system performance. Existing plus project traffic volumes at study intersections are shown in Figure 11. The existing plus project levels of service for the study area intersections are summarized in Table D. Level of service calculation worksheets are contained in Appendix C. As shown in Table D, all study area intersections are forecast to operate at satisfactory levels of service with the exception of State Street/Beechwood Avenue in the p.m. peak hour. The project does not create the deficiency at this intersection, since it also operates at unsatisfactory LOS under existing conditions. The project has a direct impact at the intersections of State Street/Imperial Highway and Long Beach Boulevard/Imperial Highway. 16 the transportation solutions company...
20 1 State St/Imperial Highway 2 State St/Beechwood Ave 3 Long Beach Blvd/Imperial Highway 4 Long Beach Blvd/Sanborn Ave 5 Long Beach Blvd/I-105 WB Slip On-Ramp 6 Long Beach Blvd/I-105 WB Off-Ramp 7 Long Beach Blvd/I-105 WB Loop On-Ramp 8 Long Beach Blvd/I-105 EB Loop On-Ramp 9 Long Beach Blvd/I-105 EB Off-Ramp 10 Driveway 1/Imperial Highway 11 Driveway 2/Imperial Highway 12 Driveway 3/Beechwood Ave 13 Driveway 4/Beechwood Ave Legend FIGURE 9 Signal Plaza Mexico Residences Stop Sign Existing Intersection Geometrics and Stop Control the transportation solutions company... D:\Projects\Plaza Mexico Apartments\Z30 Geo 10/5/2017
21 47/ /718 5/41 28/70 10/13 134/124 4/7 1088/667 53/96 1/0 3/18 274/ / /330 10/13 73/129 24/75 969/1004 5/19 687/835 30/141 24/56 3/7 171/184 38/70 223/ / /46 4/3 25/43 309/ /99 10/4 551/437 19/90 2/8 1/4 1/6 473/586 5/40 44/75 673/685 73/115 7/6 7/9 177/ /1117 2/24 1/6 1 State St/Imperial Highway 2 State St/Beechwood Ave 3 Long Beach Blvd/Imperial Highway 4 Long Beach Blvd/Sanborn Ave 5 Long Beach Blvd/I-105 WB Slip On Ram 674/ /292 12/24 6/10 61/ / /86 588/ / / / / / /11 16/30 203/371 1/0 0/1 611/ /1390 6/23 0/3 9/13 386/262 35/37 12/ / / / / / / Long Beach Blvd/I-105 WB Off Ramp 7 Long Beach Blvd/I-105 WB Loop On Ra 8 Long Beach Blvd/I-105 EB Loop On Ra 9 Long Beach Blvd/I-105 EB Off Ramp 10 Driveway 1/Imperial Highway 1603/ /979 30/33 19/23 1/0 938/ / / /873 15/17 15/ / /39 18/39 11 Driveway 2/Imperial Highway 12 Driveway 3/Beechwood Ave 13 Driveway 4/Beechwood Ave FIGURE 10 XXXX/YYYY AM/PM Peak Hour Traffic Volumes Plaza Mexico Residences Existing Peak Hour Traffic Volumes the transportation solutions company... P:\Plaza Mexico Apartments\Z30 Vol Exist (10/4/2017)
22 the transportation solutions company... Table D: Existing Intersection Levels of Service Without Project With Project Direct LOS AM Peak Hour PM Peak Hour AM Peak Hour PM Peak Hour Project Intersection Standard Control Delay/ICU LOS Delay/ICU LOS Delay/ICU LOS Delay/ICU LOS Impact 1. State St/Imperial Highway D Signal 0.77 C 0.78 C 0.81 D 0.83 D YES 2. State St/Beechwood Ave D TWSC C E * D F * NO 3. Long Beach Blvd/Imperial Highway D Signal 0.81 D 0.84 D 0.85 D 0.90 D YES 4. Long Beach Blvd/Sanborn Ave D Signal 0.66 B 0.70 B 0.67 B 0.71 C NO 5. Long Beach Blvd/I-105 WB Slip On-Ramp D Free A A A A NO 6. Long Beach Blvd/I-105 WB Off-Ramp D Signal B C B C NO 7. Long Beach Blvd/I-105 WB Loop On-Ramp D Free A A A A NO 8. Long Beach Blvd/I-105 EB Loop On-Ramp D Free A A A A NO 9. Long Beach Blvd/I-105 EB Off-Ramp D Signal B B B B NO 10. Driveway 1/Imperial Highway D TWSC Project Driveway B C NO 11. Driveway 2/Imperial Highway D TWSC Project Driveway C C NO 12. Driveway 3/Beechwood Ave D TWSC Project Driveway 8.90 A 9.00 A NO 13. Driveway 4/Beechwood Ave D TWSC Project Driveway 9.10 A 9.30 A NO Notes: * Exceeds LOS Standard TWSC = Two-Way Stop Control; For TWSC intersections, reported delay is for worst-case approach/movement. LOS = Level of Service D:\Projects\Plaza Mexico Apartments\LOS\EXIST 10/5/2017
23 47/ /797 5/41 28/70 12/14 148/173 4/7 1112/694 53/96 1/0 3/18 274/ /202 12/21 71/45 85/135 24/75 172/335 5/19 716/851 30/ / /11 244/222 38/70 28/58 228/ / /46 4/3 28/60 555/439 5/40 1 State St/Imperial Highway 2 State St/Beechwood Ave 3 Long Beach Blvd/Imperial Highway 4 Long Beach Blvd/Sanborn Ave 5 Long Beach Blvd/I-105 WB Slip On Ram 34/ / /48 318/ / /1676 1/4 4/14 478/ / /882 20/11 16/30 13/59 203/371 1/0 47/47 0/1 618/ /1404 6/23 0/3 9/13 386/262 35/37 12/ / /90 2/8 1221/ /349 51/86 673/685 73/115 7/6 1035/ / Long Beach Blvd/I-105 WB Off Ramp 7 Long Beach Blvd/I-105 WB Loop On Ra 8 Long Beach Blvd/I-105 EB Loop On Ra 9 Long Beach Blvd/I-105 EB Off Ramp 10 Driveway 1/Imperial Highway 7/9 199/ / / /292 12/ /1153 3/25 1/6 605/981 30/33 19/23 6/10 61/152 1/0 943/ / /11 87/86 621/ / / /2246 9/5 33/17 7/33 14/ /988 22/21 22/ /1394 2/9 5/7 67/84 23/46 51/56 56/67 7/4 36/19 11 Driveway 2/Imperial Highway 12 Driveway 3/Beechwood Ave 13 Driveway 4/Beechwood Ave FIGURE 11 XXXX/YYYY AM/PM Peak Hour Traffic Volumes Plaza Mexico Residences Existing Plus Project Peak Hour Traffic Volumes the transportation solutions company... P:\Plaza Mexico Apartments\Z30 Vol Exist P (10/4/2017)
24 Plaza Mexico Residences Traffic Study October OPENING YEAR (2019) CONDITIONS This section discusses opening year (2019) transportation conditions in the study area. It is anticipated that the project will open in Opening Year (2019) Roadway Conditions Opening Year (2019) roadway conditions are assumed to be the same as those under existing conditions. 6.2 Opening Year (2019) Transit Service Transit service under opening year (2019) conditions are anticipated to remain the same as under existing conditions. 6.3 Opening Year (2019) Pedestrian & Bicycle Facilities Pedestrian and bicycle facilities under opening year (2019) conditions are anticipated to remain the same as under existing conditions. 6.4 Opening Year (2019) Intersections Levels of Service An intersection level of service analysis was conducted for opening year (2019) conditions to determine circulation system performance. Opening year (2019) traffic volumes at study intersections are shown in Figure 12. Opening year (2019) levels of service for the study area intersections are summarized in Table E. Detailed volume development worksheets are included in Appendix B. Level of service calculation worksheets are contained in Appendix C. As shown in Table E, all study area intersections are forecast to operate at satisfactory levels of service with the exception of State Street/Beechwood Avenue in the p.m. peak hour. 6.5 Opening Year (2019) With Project Intersections Levels of Service An intersection level of service analysis was conducted for opening year (2019) with project conditions to determine circulation system performance. Opening year (2019) with project traffic volumes at study intersections are shown in Figure 13. The opening year (2019) with project levels of service for the study area intersections are summarized in Table E. Level of service calculation worksheets are contained in Appendix C. As shown in Table E, all study area intersections are forecast to operate at satisfactory levels of service with the exception of State Street/Beechwood Avenue in the p.m. peak hour and Long Beach Boulevard/Imperial Highway in the p.m. peak hour. The project has a direct impact at the intersections of State Street/Imperial Highway and Long Beach Boulevard/Imperial Highway. 6.6 Cumulative (2019) Intersections Levels of Service An intersection level of service analysis was conducted for cumulative (2019) conditions to determine circulation system performance. Cumulative (2019) traffic volumes at study intersections are shown in Figure 14. Cumulative (2019) levels of service for the study area intersections are summarized in Table F. Detailed volume development worksheets are included in Appendix B. Level of service calculation worksheets are contained in Appendix C. As shown in Table F, all study area intersections are forecast to operate at satisfactory levels of service with the exception of State Street/Beechwood Avenue in the p.m. peak hour. 6.7 Cumulative (2019) With Project Intersections Levels of Service An intersection level of service analysis was conducted for cumulative (2019) with project conditions to determine circulation system performance. Cumulative (2019) with project traffic volumes at study intersections are shown in Figure 15. The cumulative (2018) with project levels of service for the study area intersections are summarized in Table F. Level of service calculation worksheets are contained in Appendix C. As shown in Table F, all study area 21 the transportation solutions company...
25 47/ /724 5/41 28/71 10/13 135/125 4/7 1097/673 53/97 1/0 3/18 276/ / /333 10/13 74/130 24/76 977/1013 5/19 693/842 30/142 24/56 3/7 172/186 38/71 225/ / /46 4/3 25/43 312/ /100 10/4 556/441 19/91 2/8 1/4 1/6 477/591 5/40 44/76 679/691 74/116 7/6 7/9 179/141 1 State St/Imperial Highway 2 State St/Beechwood Ave 3 Long Beach Blvd/Imperial Highway 4 Long Beach Blvd/Sanborn Ave 5 Long Beach Blvd/I-105 WB Slip On Ram 680/ /295 12/ /1127 2/24 1/6 6/10 62/ / /87 593/ / / / / / / /11 16/30 205/374 1/0 0/1 616/ /1402 6/23 0/3 9/13 389/264 35/37 12/ / / / / / Long Beach Blvd/I-105 WB Off Ramp 7 Long Beach Blvd/I-105 WB Loop On Ra 8 Long Beach Blvd/I-105 EB Loop On Ra 9 Long Beach Blvd/I-105 EB Off Ramp 10 Driveway 1/Imperial Highway 1617/ /988 30/33 19/23 1/0 946/ / / /881 15/17 15/ / /39 18/39 11 Driveway 2/Imperial Highway 12 Driveway 3/Beechwood Ave 13 Driveway 4/Beechwood Ave FIGURE 12 XXXX/YYYY AM/PM Peak Hour Traffic Volumes Plaza Mexico Residences Opening Year (2019) Peak Hour Traffic Volumes the transportation solutions company... P:\Plaza Mexico Apartments\Z30 Vol OY (10/4/2017)
26 the transportation solutions company... Table E: Opening Year (2019) Intersection Levels of Service Without Project With Project Direct LOS AM Peak Hour PM Peak Hour AM Peak Hour PM Peak Hour Project Intersection Standard Control Delay/ICU LOS Delay/ICU LOS Delay/ICU LOS Delay/ICU LOS Impact 1. State St/Imperial Highway D Signal 0.78 C 0.78 C 0.83 D 0.84 D YES 2. State St/Beechwood Ave D TWSC C E * D F * NO 3. Long Beach Blvd/Imperial Highway D Signal 0.81 D 0.85 D 0.85 D 0.91 E * YES 4. Long Beach Blvd/Sanborn Ave D Signal 0.66 B 0.70 B 0.68 B 0.71 C NO 5. Long Beach Blvd/I-105 WB Slip On-Ramp D Free A A A A NO 6. Long Beach Blvd/I-105 WB Off-Ramp D Signal B C B B NO 7. Long Beach Blvd/I-105 WB Loop On-Ramp D Free A A A A NO 8. Long Beach Blvd/I-105 EB Loop On-Ramp D Free A A A A NO 9. Long Beach Blvd/I-105 EB Off-Ramp D Signal B B B B NO 10. Driveway 1/Imperial Highway D TWSC Project Driveway B C NO 11. Driveway 2/Imperial Highway D TWSC Project Driveway C C NO 12. Driveway 3/Beechwood Ave D TWSC Project Driveway 8.90 A 9.00 A NO 13. Driveway 4/Beechwood Ave D TWSC Project Driveway 9.10 A 9.30 A NO Notes: * Exceeds LOS Standard TWSC = Two-Way Stop Control; For TWSC intersections, reported delay is for worst-case approach/movement. LOS = Level of Service D:\Projects\Plaza Mexico Apartments\LOS\OY 10/5/2017
27 47/ /803 5/41 28/71 12/14 149/174 4/7 1121/700 53/97 1/0 3/18 276/ /204 12/21 71/45 86/136 24/76 173/338 5/19 722/858 30/ / /11 245/224 38/71 28/58 230/ / /46 4/3 33/48 321/ /126 28/60 560/443 19/91 2/8 1/4 4/14 482/594 5/40 51/87 679/691 74/116 7/6 7/9 201/ /1163 3/25 1/6 1 State St/Imperial Highway 2 State St/Beechwood Ave 3 Long Beach Blvd/Imperial Highway 4 Long Beach Blvd/Sanborn Ave 5 Long Beach Blvd/I-105 WB Slip On Ram 680/ /295 12/24 6/10 62/ / /87 626/ / / / / / /890 20/11 16/30 13/59 205/374 1/0 47/47 0/1 623/ /1416 6/23 0/3 9/13 389/264 35/37 12/ / / / / / / Long Beach Blvd/I-105 WB Off Ramp 7 Long Beach Blvd/I-105 WB Loop On Ra 8 Long Beach Blvd/I-105 EB Loop On Ra 9 Long Beach Blvd/I-105 EB Off Ramp 10 Driveway 1/Imperial Highway 1629/ /990 30/33 19/23 1/0 951/ /11 53/27 9/5 33/17 7/4 36/19 7/33 14/ /996 22/21 22/ /1406 2/9 5/7 67/84 23/46 51/56 56/67 11 Driveway 2/Imperial Highway 12 Driveway 3/Beechwood Ave 13 Driveway 4/Beechwood Ave FIGURE 13 XXXX/YYYY AM/PM Peak Hour Traffic Volumes Plaza Mexico Residences Opening Year (2019) With Project Peak Hour Traffic Volumes the transportation solutions company... P:\Plaza Mexico Apartments\Z30 Vol OY P (10/4/2017)
28 49/ /770 5/41 28/71 10/13 135/125 4/7 1097/673 53/97 1/0 3/18 282/ / /335 10/13 74/130 24/ /1064 5/19 693/842 30/142 24/56 4/8 178/194 38/71 226/ / /49 4/3 25/43 312/ /100 10/4 556/441 19/91 2/8 1/4 1/7 477/591 5/40 44/76 691/706 74/116 7/6 7/9 183/148 1 State St/Imperial Highway 2 State St/Beechwood Ave 3 Long Beach Blvd/Imperial Highway 4 Long Beach Blvd/Sanborn Ave 5 Long Beach Blvd/I-105 WB Slip On Ram 688/ /302 12/ /1157 2/24 1/6 6/10 62/ / /87 593/ / / / / / / /11 16/30 217/389 1/0 0/1 616/ /1454 6/23 0/3 9/13 401/279 35/37 12/ / / / / / Long Beach Blvd/I-105 WB Off Ramp 7 Long Beach Blvd/I-105 WB Loop On Ra 8 Long Beach Blvd/I-105 EB Loop On Ra 9 Long Beach Blvd/I-105 EB Off Ramp 10 Driveway 1/Imperial Highway 1642/ / /33 19/23 1/0 971/ / / /929 15/17 15/ / /39 18/39 11 Driveway 2/Imperial Highway 12 Driveway 3/Beechwood Ave 13 Driveway 4/Beechwood Ave FIGURE 14 XXXX/YYYY AM/PM Peak Hour Traffic Volumes Plaza Mexico Residences Cumulative (2019) Peak Hour Traffic Volumes the transportation solutions company... P:\Plaza Mexico Apartments\Z30 Vol Cumul (10/4/2017)
29 the transportation solutions company... Table F: Cumulative (2019) Intersection Levels of Service Without Project With Project Direct LOS AM Peak Hour PM Peak Hour AM Peak Hour PM Peak Hour Project Intersection Standard Control Delay/ICU LOS Delay/ICU LOS Delay/ICU LOS Delay/ICU LOS Impact 1. State St/Imperial Highway D Signal 0.79 C 0.80 C 0.84 D 0.85 D NO 2. State St/Beechwood Ave D TWSC C E * D F * NO 3. Long Beach Blvd/Imperial Highway D Signal 0.82 D 0.86 D 0.86 D 0.92 E * YES 4. Long Beach Blvd/Sanborn Ave D Signal 0.67 B 0.71 C 0.68 B 0.71 C NO 5. Long Beach Blvd/I-105 WB Slip On-Ramp D Free A A A A NO 6. Long Beach Blvd/I-105 WB Off-Ramp D Signal B C B C NO 7. Long Beach Blvd/I-105 WB Loop On-Ramp D Free A A A A NO 8. Long Beach Blvd/I-105 EB Loop On-Ramp D Free A A A A NO 9. Long Beach Blvd/I-105 EB Off-Ramp D Signal B B B B NO 10. Driveway 1/Imperial Highway D TWSC Project Driveway C C NO 11. Driveway 2/Imperial Highway D TWSC Project Driveway C C NO 12. Driveway 3/Beechwood Ave D TWSC Project Driveway 8.90 A 9.00 A NO 13. Driveway 4/Beechwood Ave D TWSC Project Driveway 9.10 A 9.30 A NO Notes: * Exceeds LOS Standard TWSC = Two-Way Stop Control; For TWSC intersections, reported delay is for worst-case approach/movement. LOS = Level of Service D:\Projects\Plaza Mexico Apartments\LOS\Cumul 10/5/2017

30 49/ /849 5/41 28/71 12/14 149/174 4/7 1121/700 53/97 1/0 3/18 282/ /204 12/21 71/45 86/136 24/76 176/340 5/19 722/858 30/ / /12 251/232 38/71 28/58 231/ / /49 4/3 33/48 321/ /126 28/60 560/443 19/91 2/8 1/4 4/15 482/594 5/40 51/87 691/706 74/116 7/6 7/9 205/ /1193 3/25 1/6 1 State St/Imperial Highway 2 State St/Beechwood Ave 3 Long Beach Blvd/Imperial Highway 4 Long Beach Blvd/Sanborn Ave 5 Long Beach Blvd/I-105 WB Slip On Ram 688/ /302 12/24 6/10 62/ / /87 626/ / / / / / /938 20/11 16/30 13/59 217/389 1/0 47/47 0/1 623/ /1468 6/23 0/3 9/13 401/279 35/37 12/ / / / / / / Long Beach Blvd/I-105 WB Off Ramp 7 Long Beach Blvd/I-105 WB Loop On Ra 8 Long Beach Blvd/I-105 EB Loop On Ra 9 Long Beach Blvd/I-105 EB Off Ramp 10 Driveway 1/Imperial Highway 1654/ / /33 19/23 1/0 976/ /11 53/27 9/5 33/17 7/4 36/19 7/33 14/ / /21 22/ /1458 2/9 5/7 67/84 23/46 51/56 56/67 11 Driveway 2/Imperial Highway 12 Driveway 3/Beechwood Ave 13 Driveway 4/Beechwood Ave FIGURE 15 XXXX/YYYY AM/PM Peak Hour Traffic Volumes Plaza Mexico Residences Cumulative (2019) With Project Peak Hour Traffic Volumes the transportation solutions company... P:\Plaza Mexico Apartments\Z30 Vol Cumul P (10/4/2017)
31 Plaza Mexico Residences Traffic Study October 2017 intersections are forecast to operate at satisfactory levels of service with the exception of State Street/Beechwood Avenue in the p.m. peak hour and Long Beach Boulevard/Imperial Highway in the p.m. peak hour. The project has a direct impact at the intersections of State Street/Imperial Highway and Long Beach Boulevard/Imperial Highway. 7.0 CIRCULATION IMPROVEMENTS The CMP requires that circulation improvements be recommended at any intersection operates at unsatisfactory level of service. For intersections that meet a jurisdiction s minimum level of service standard under existing conditions, circulation improvements must maintain conformance with that standard. For intersections that fail to meet a jurisdiction s minimum level of service standard under existing conditions, circulation improvements must maintain the existing level of service. These include conversion of stop control, signalization, changes to signal phasing, and/or addition of lanes as appropriate. 7.1 Existing, Opening Year, and Cumulative With Project Circulation Improvements Under existing, opening year (2019), and cumulative (2019) with project conditions, one intersection will not meet the relevant jurisdiction s minimum level of service standard. Modification to intersection configurations are recommended as mitigation measures in accord with CMP requirements as follows: 1. State Street/Imperial Highway Re-stripe to add westbound right turn lane. 2. State Street/Beechwood Avenue Convert from two-way stop control to all-way stop control. 3. Long Beach Boulevard/Imperial Highway Re-stripe to add eastbound right turn lane. Construction of these improvements will restore satisfactory operations. Table G shows the resulting levels of service and Figure 16 illustrates the recommended improvements under existing, opening year (2019), and cumulative (2019) with project conditions. 8.0 QUEUING ANALYSIS A queuing analysis at Caltrans intersections on Long Beach Boulevard has been included in this report to determine the sufficiency of turn pocket storage lengths are adequate to meet projected demand. Table H lists the queueing analysis during the a.m. and p.m. peak hours for all analysis scenarios. Queuing worksheets are included in Appendix D. 9.0 STATE STREET VOLUME ANALYSIS At the request of the City planning department, a qualitative analysis of traffic volumes travelling on State Street north of Imperial Highway has been included in this report. The traffic volumes travelling on State Street between Imperial Highway and Beechwood Avenue are 13,867 daily traffic volumes. Based on the City of Lynwood s roadway capacities for 4-lane divided roads (LOS A 24,000 ADT), the roadway operates at LOS A. Furthermore, the intersection LOS at State Street/Imperial Highway is LOS D under cumulative with project conditions. With the project including 348 apartment units and 26,150 square feet of retail/restaurant uses, the project will add a total of 19 a.m. and 9 p.m. trips onto State Street north of Imperial Highway, which consists of residential neighborhoods. There will be some interactions between residential uses in the area with the proposed retail uses, however, cut-through traffic is anticipated to be minimal VEHICLE MILES TRAVELED The Governor s Office of Policy and Research (OPR) has proposed new guidelines to evaluate potential transportation impacts under CEQA. OPR s proposed policy is the result of Senate Bill 743 (SB-743). 28 the transportation solutions company...
32 the transportation solutions company... Table G: With Project With Improvements Intersection Levels of Service Existing With Project Opening Year (2019) With Project Cumulative With Project LOS AM Peak Hour PM Peak Hour AM Peak Hour PM Peak Hour AM Peak Hour PM Peak Hour Intersection Standard Control Delay/ICU LOS Delay/ICU LOS Delay/ICU LOS Delay/ICU LOS Delay/ICU LOS Delay/ICU LOS 1. State St/Imperial Highway D Signal 0.80 C 0.80 C 0.81 D 0.81 D 0.82 D 0.83 D 2. State St/Beechwood Ave D AWSC B C B C B C 3. Long Beach Blvd/Imperial Highw D Signal 0.79 C 0.83 D 0.79 C 0.84 D 0.79 C 0.85 D Notes: LOS = Level of Service AWSC = All-Way Stop Control D:\Projects\Plaza Mexico Apartments\LOS\MIT 10/5/2017
33 1 State St/Imperial Highway 2 State St/Beechwood Ave 3 Long Beach Blvd/Imperial Highway 4 Long Beach Blvd/Sanborn Ave 5 Long Beach Blvd/I-105 WB Slip On-Ramp 6 Long Beach Blvd/I-105 WB Off-Ramp 7 Long Beach Blvd/I-105 WB Loop On-Ramp 8 Long Beach Blvd/I-105 EB Loop On-Ramp 9 Long Beach Blvd/I-105 EB Off-Ramp 10 Driveway 1/Imperial Highway 11 Driveway 2/Imperial Highway 12 Driveway 3/Beechwood Ave 13 Driveway 4/Beechwood Ave Legend FIGURE 16 Signal Plaza Mexico Residences Stop Sign With Project With Improvements Intersection Geometrics and Stop Control the transportation solutions company... D:\Projects\Plaza Mexico Apartments\Z30 Geo MIT 10/5/2017
34 the transportation solutions company... Table H: Queuing Analysis Existing Existing With Project Opening Year (2019) Opening Year (2019) With Project Cumulative (2019) Cumulative (2019) With Project Storage Length AM Peak Hour PM Peak Hour AM Peak Hour PM Peak Hour AM Peak Hour PM Peak Hour AM Peak Hour PM Peak Hour AM Peak Hour PM Peak Hour AM Peak Hour PM Peak Hour Intersection Movement (In Feet) Queue Length 1 Queue Length 1 Queue Length 1 Queue Length 1 Queue Length 1 Queue Length 1 Queue Length 1 Queue Length 1 Queue Length 1 Queue Length 1 Queue Length 1 Queue Length 1 6. Long Beach Blvd/I-105 WB Off-Ramp 7. Long Beach Blvd/I-105 WB Loop On-Ramp 8. Long Beach Blvd/I-105 EB Loop On-Ramp 9. Long Beach Blvd/I-105 EB Off-Ramp Notes: Bold = Exceeds storage length 1 Queues reported are 95th Percentile queue lengths per movement in feet. NBL EBLR WBL WBT WBR NBR SBR SBL EBL EBT EBR D:\Projects\Plaza Mexico Apartments\Queues\EXIST
35 Plaza Mexico Residences Traffic Study October 2017 The intent the proposed guidelines is to replace the existing metrics for evaluating CEQA transportation impacts based on level of service, with Vehicle Miles Traveled (VMT). VMT as defined as the amount and distance of automobile travel attributable to a project. A development project that results in vehicle miles traveled exceeding an applicable threshold of significance may indicate a significant impact. The proposed guidelines have not yet been approved by the Natural Resources Agency (NRA), and does not currently specify thresholds of significance. The OPR, under its most recent (January 20, 2016) guidance sets a threshold of 15% less than existing VMT as the threshold of significance. However, Lead Agencies can adopt their own thresholds as under CEQA, the onus of guidance is passed to lead agencies who determine reasonable thresholds based on other public agencies or experts supported by substantial evidence Proposed CEQA Metrics The presumption included in the approach recommended by OPR is that projects within the TASP will meet the sustainable goals of: 15 % reduction in VMT for residential projects 15 % reduction in VMT for office projects Maintain existing VMT for retail projects The analysis will focus on VMT, pedestrian safety, bicycle safety, and transit usage, but since levels of significance are not yet certified by the NRA, LOS for roadways are also disclosed, but mitigation measures (if necessary) will be related to VMT. The OPR has release the following thresholds for determination of significant impacts: 1. Recommended threshold for residential projects: A project exceeding both Existing city household VMT per capita (minus 15 percent) and Existing regional household VMT per capita (minus 15 percent) may indicate a significant transportation impact 2. Recommended threshold for office projects: A project exceeding a level of 15 percent below existing regional VMT per employee may indicate a significant transportation impact. 3. Recommended threshold for retail projects: A net increase in the total existing VMT may indicate a significant transportation impact 10.2 Existing VMT An estimate of base VMT for the City of Lynwood was made using data from the CSTDM. Based on the CSTDM, the Year 2010 Per Capita VMT for residential uses is miles per day, and for non-residential uses is miles per day. The project is part of TAZ The existing per capita VMT for the project TAZ is miles per day for residential uses and miles per day for non-residential uses. Based on the OPR s threshold, based on the existing VMT, the project will have an impact if the per capita residential VMT is greater than miles per day or if the non-residential VMT is greater than miles per day. Appendix E includes the outputs from the CSTDM and other VMT calculations Existing Plus Project VMT The project will increase density consistent with the Specific Plan. Further, the project site has excellent transit opportunities, and the project design enhances the pedestrian experience along its frontage. The project is also 32 the transportation solutions company...
36 Plaza Mexico Residences Traffic Study October 2017 mixed-use in nature. These project parameters were modeled into the California Emissions Estimator Model (CalEEMod) to identify the efficacy of each project parameter. As discussed earlier, the required reduction in VMT from existing VMT for the TAZ was calculated at 15.65% for residential uses and 13.17% for non-residential uses. The project achieves a reduction of 21.61% for each land use component of the project. After application of the land use mix, density, and transit proximity, the per capita project VMT for residential uses is forecast to be miles per day for residential uses and miles per day for retail uses. Therefore, the project will have a less than significant impact under the proposed metrics to evaluate transportation impacts under SB-743. Table I shows the project VMT analysis IMPACT ANALYSIS FOR CEQA DETERMINATION This section evaluates the CEQA checklist for impact evaluation. A. Will the project conflict with an applicable plan, ordinance or policy establishing measures of effectiveness for the performance of the circulation system? Based on the results of this analysis, the project does not degrade traffic operations below those acceptable in the City s General Plan after implementation of circulation improvements. The project is consistent with the City s adopted plans and policies. Therefore, the project impact is considered less than significant. B. Conflict with an applicable congestion management program, including, but not limited to level of service standards, significant thresholds, or other standards established by the county congestion management agency for designated roads or highways? The project does not conflict with the County s CMP and does not propose changes to the City s LOS standards. After implementation of improvements, all study intersections will operate at satisfactory conditions. Therefore, the project impact is considered less than significant after mitigation. C. Result in a change in air traffic patterns, including either an increase in traffic levels or a change in location that results in substantial safety risks? The nearest airport to the project location is Los Angeles International Airport, approximately 11 miles to the west. The project would not encroach into air traffic space nor have any effects on demand for local air service or volumes of air traffic. The project will not alter air traffic patterns. Therefore, the project impact will be less than-significant. D. Substantially increase hazards due to a design feature (e.g., sharp curves or dangerous intersections) or incompatible uses (e.g., farm equipment)? Design of driveways will be based on City Code, which sets the standard for such design. Project driveways would intersect perpendicularly with Imperial Highway and Beechwood Avenue and would not create conflicts for motorists, pedestrians, or bicyclists. Also, northbound left-turn movements out of the project 33 the transportation solutions company...
37 the transportation solutions company... Table I: Project VMT Analysis Residential Uses Impact Significant Reduction Project City Threshold** Impact Needed Residential VMT 106,742 1,112,076 Per Capita VMT (Unmitigated) Yes 15.65% Per Capita VMT (Mitigated) No Non-Residential Uses Non-Residential VMT 89, ,631 Per Capita VMT (Unmitigated) Yes 13.17% Per Capita VMT (Mitigated) No * California Statewide Travel Demand Model ** Threshold - 15% less than City/Regional VMT VMT Reductions from CalEEMod: Unmitigated Annual VMT: 9,852,578, Mitigated Annual VMT: 7,723,816. Therefore, a reduction of 21.61% has been used. Further, improvements planned as part of the SP have not been included. Project Name: Plaza Mexico Apartments Location: City of Lynwood Project TAZs (CSTDM): 4281 City TAZs (CSTDM): 4281, 4262, 4286, 4278, 4293, 4296, 4287, 4294, 4295 D:\Projects\Plaza Mexico Apartments\VMT\VMT Analysis\Project Summary
38 Plaza Mexico Residences Traffic Study October 2017 driveways on Imperial Highway will be restricted to reduce vehicle conflicts. No existing traffic hazards are known to exist in the immediate vicinity of the project. Impacts from the project will be less than significant to any potentially existing or future traffic hazard. E. Result in inadequate emergency access? The project will be accessible via four 25-foot wide driveways on Imperial Highway and Beechwood Avenue. Interior drive aisles within the parking area will have a minimum width of 25 feet to provide adequate emergency access. The proposed driveways will be designed in accordance with all applicable design and safety standards required by adopted fire codes, safety codes, and building codes established by the City s Engineering and Fire Departments. The parking layout will be designed to meet City requirements to allow emergency vehicles adequate access. The project will not result in inadequate emergency access. Therefore, the project impact is considered less than significant. F. Conflict with adopted policies, plans, or programs regarding public transit, bicycle, or pedestrian facilities, or otherwise decrease the performance or safety of such facilities? The project would not conflict with adopted policies or plans supporting alternative transportation modes such as bus transit, bicycles, or walking paths. The project will not change roadway designations from those in the City s General Plan. The project will also not result in removal of any of the facilities listed above. Therefore, the project impact is considered less than significant SUMMARY & CONCLUSIONS The proposed project is forecast to generate 295 net new trips in the a.m. peak hour, 283 net new trips in the p.m. peak hour, and 3,420 net new daily trips. Based on this analysis, the intersection of State Street/Beechwood Avenue is projected to operate at unsatisfactory LOS in the existing, opening year (2019), and cumulative (2019) without and with project scenarios. A direct project impact occurs at the intersections of State Street/Imperial Highway and Long Beach Boulevard/Imperial Highway under existing, opening year (2019), and cumulative (2019) with project conditions. With the construction of the circulation improvements, the intersection of State Street/Beechwood Avenue will operate at satisfactory LOS. 35 the transportation solutions company...
39 Plaza Mexico Residences Traffic Study October 2017 APPENDIX A: TRAFFIC COUNTS Appendix A the transportation solutions company...
40 ID: City: Lynwood Prepared by National Data & Surveying Services State St & Imperial Hwy Peak Hour Turning Movement Count State St SOUTHBOUND Day: Thursday Date: 09/07/2017 PEAK HOURS 07:15 AM - 08:15 AM NONE 04:30 PM - 05:30 PM AM AM NOON NOON PM PM 07:00 AM - 09:00 AM NONE 04:00 PM - 06:00 PM COUNT PERIODS Imperial Hwy EASTBOUND AM NOON PM PM NOON AM CONTROL Signalized TEV AM NOON PM PHF AM NOON PM PM NOON AM Imperial Hwy WESTBOUND Total Vehicles (AM) Total Vehicles (NOON) PM PM NOON NOON AM AM NORTHBOUND State St Total Vehicles (AM) Total Vehicles (NOON) Pedestrians (Crosswalks) Total Vehicles (PM) PM NOON AM AM NOON PM PM NOON AM AM NOON PM Total Vehicles (PM) PM NOON AM AM NOON PM PM NOON AM AM NOON PM `
41 ID: City: Lynwood Prepared by National Data & Surveying Services State St & Beechwood Ave Peak Hour Turning Movement Count State St SOUTHBOUND Day: Thursday Date: 09/07/2017 PEAK HOURS 07:15 AM - 08:15 AM NONE 05:00 PM - 06:00 PM AM AM NOON NOON PM PM 07:00 AM - 09:00 AM NONE 04:00 PM - 06:00 PM COUNT PERIODS AM NOON PM PM NOON AM Beechwood Ave EASTBOUND CONTROL Way Stop (EB/WB) TEV AM NOON PM PHF WESTBOUND Beechwood Ave AM NOON PM PM NOON AM Total Vehicles (AM) Total Vehicles (NOON) PM PM NOON NOON AM AM NORTHBOUND State St Total Vehicles (AM) Total Vehicles (NOON) Pedestrians (Crosswalks) Total Vehicles (PM) PM NOON AM AM NOON PM PM NOON AM AM NOON PM Total Vehicles (PM) PM NOON AM AM NOON PM PM NOON AM AM NOON PM `
42 Prepared by National Data & Surveying Services Long Beach Blvd & Imperial Hwy Peak Hour Turning Movement Count ID: City: Lynwood Long Beach Blvd SOUTHBOUND Day: Thursday Date: 09/21/2017 PEAK HOURS 07:30 AM - 08:30 AM NONE 04:45 PM - 05:45 PM AM AM NOON NOON PM PM 07:00 AM - 09:00 AM NONE 04:00 PM - 06:00 PM COUNT PERIODS Imperial Hwy EASTBOUND AM NOON PM PM NOON AM CONTROL Signalized TEV AM NOON PM PHF AM NOON PM PM NOON AM Imperial Hwy WESTBOUND Total Vehicles (AM) Total Vehicles (NOON) PM PM NOON NOON AM AM NORTHBOUND Long Beach Blvd Total Vehicles (AM) Total Vehicles (NOON) Pedestrians (Crosswalks) Total Vehicles (PM) PM NOON AM AM NOON PM PM NOON AM AM NOON PM Total Vehicles (PM) PM NOON AM AM NOON PM PM NOON AM AM NOON PM `

43 ID: City: Lynwood Prepared by National Data & Surveying Services Long Beach Blvd & Sanborn Ave Peak Hour Turning Movement Count Long Beach Blvd SOUTHBOUND Day: Thursday Date: 09/21/2017 PEAK HOURS 07:15 AM - 08:15 AM NONE 04:45 PM - 05:45 PM AM AM NOON NOON PM PM 07:00 AM - 09:00 AM NONE 04:00 PM - 06:00 PM COUNT PERIODS AM NOON PM PM NOON AM Sanborn Ave EASTBOUND CONTROL Signalized TEV AM NOON PM PHF WESTBOUND Sanborn Ave AM NOON PM PM NOON AM Total Vehicles (AM) Total Vehicles (NOON) PM PM NOON NOON AM AM NORTHBOUND Long Beach Blvd Total Vehicles (AM) Total Vehicles (NOON) Pedestrians (Crosswalks) Total Vehicles (PM) PM NOON AM AM NOON PM PM NOON AM AM NOON PM Total Vehicles (PM) PM NOON AM AM NOON PM PM NOON AM AM NOON PM `
Market Street PDP. Nassau County, Florida. Transportation Impact Analysis. VHB/Vanasse Hangen Brustlin, Inc. Nassau County Growth Management
 Transportation Impact Analysis Market Street PDP Nassau County, Florida Submitted to Nassau County Growth Management Prepared for TerraPointe Services, Inc. Prepared by VHB/Vanasse Hangen Brustlin, Inc.
ALTA VISTA COMMERCIAL/ RESIDENTIAL PROJECT
 ALTA VISTA COMMERCIAL/ RESIDENTIAL PROJECT TRAFFIC IMPACT ANALYSIS Prepared For: Paul Conzelman SC Development 2151 Michelson Drive, Suite 140 Irvine, CA 92612 Prepared By: 2030 Main Street, Suite 1200
FINAL Traffic Report for the Proposed Golden Valley Road and Newhall Ranch Road Projects in the City of Santa Clarita, California May 5, 2005
 FINAL Traffic Report for the Proposed Golden Valley Road and Newhall Ranch Road Projects in the City of Santa Clarita, California May 5, 2005 Prepared For: EDAW, Inc. 1420 Kettner Boulevard, Suite 620
Traffic Impact Study
 Traffic Impact Study Statham DRI One University Parkway Prepared for: Barrow County Prepared by: October 2012 Table of Contents Executive Summary i Section 1. Introduction 1 Project Description 1 Methodology
Appendix I: Traffic Study
 City of Fontana Sierra Lakes Commerce Center Draft EIR Appendix I: Traffic Study FirstCarbon Solutions H:\Client (PN JN)\0144\01440050\EIR\1 ADEIR\01440050 Sec99 99 Appendix Dividers.doc THIS PAGE INTENTIONALLY
CVS Derwood. Local Area Transportation Review
 CVS Derwood Montgomery County, Maryland May 27, 2016 Local Area Transportation Review Prepared for: JC Bar Properties, Inc. Steve Fleming, PE 415 Fallowfield Road, Suite 301 Camp Hill, Pennsylvania 17011
TRAFFIC IMPACT STUDY. Platte Canyon Villas Arapahoe County, Colorado (Arapahoe County Case Number: Z16-001) For
 For") TRAFFIC IMPACT STUDY For Platte Canyon Villas Arapahoe County, Colorado (Arapahoe County Case Number: Z16-001) February 2015 Revised: August 2015 April 2016 July 2016 September 2016 Prepared for: KB Home
TRAFFIC IMPACT STUDY For Platte Canyon Villas Arapahoe County, Colorado (Arapahoe County Case Number: Z16-001) February 2015 Revised: August 2015 April 2016 July 2016 September 2016 Prepared for: KB Home
NATHAN HALE HIGH SCHOOL PARKING AND TRAFFIC ANALYSIS. Table of Contents
 Parking and Traffic Analysis Seattle, WA Prepared for: URS Corporation 1501 4th Avenue, Suite 1400 Seattle, WA 98101-1616 Prepared by: Mirai Transportation Planning & Engineering 11410 NE 122nd Way, Suite
Metro Emergency Security Operations Center (ESOC) 410 Center Street City of Los Angeles
 410 Center Street City of Los Angeles") Metro Emergency Security Operations Center (ESOC) 410 Center Street City of Los Angeles Traffic Study August 31, 2015 AECOM 515 South Flower Street, 4 th Floor Los Angeles, CA 90071 Job Number: 60323255
Metro Emergency Security Operations Center (ESOC) 410 Center Street City of Los Angeles Traffic Study August 31, 2015 AECOM 515 South Flower Street, 4 th Floor Los Angeles, CA 90071 Job Number: 60323255
MEMORANDUM. The study area of the analysis was discussed with City staff and includes the following intersections:
 MEMORANDUM DATE: JULY 6, 2012 TO: FROM: RE: CC: MELANIE KNIGHT BRAD BYVELDS/ JENNIFER LUONG 1050 SOMERSET STREET PRELIMINARY TRAFFIC ANALYSIS OUR FILE NO. 111152 NEIL MALHOTRA The purpose of this memo
SUBJECT: SUMMARY OF FINDINGS. October 29, Mr. Carter Redish Carter Group Architects, Inc S. El Camino Real, Suite F San Clemente, CA 92672
 October 29, 2018 Mr. Carter Redish Carter Group Architects, Inc. 1810 S. El Camino Real, Suite F San Clemente, CA 92672 SUBJECT: CANYON STEEL FOCUSED TRAFFIC IMPACT ANALYSIS Dear Mr. Carter Redish: Urban
WEBER ROAD RESIDENTIAL DEVELOPMENT Single Family Residential Project
 WEBER ROAD RESIDENTIAL DEVELOPMENT Single Family Residential Project WEBER ROAD RESIDENTIAL DEVELOPMENT TRAFFIC IMPACT STUDY TABLE OF CONTENTS 1.0 Executive Summary Page 2.0 Introduction 2.1 DEVELOPMENT
TRAFFIC IMPACT STUDY MANUFACTURING COMPANY
 TRAFFIC IMPACT STUDY For MANUFACTURING COMPANY Prepared For: Airway Heights, WA Prepared By: SUNBURST ENGINEERING, P. S. 4310 S. Ball Dr. Veradale, WA 99037 April, 2013 TRAFFIC IMP ACT STUDY Manufacturing
Appendixx C Travel Demand Model Development and Forecasting Lubbock Outer Route Study June 2014
 Appendix C Travel Demand Model Development and Forecasting Lubbock Outer Route Study June 2014 CONTENTS List of Figures-... 3 List of Tables... 4 Introduction... 1 Application of the Lubbock Travel Demand
Traffic Impact Analysis. for the STARBUCKS STORE. Located at 9900 BALBOA BOULEVARD. Submitted to CITY OF LOS ANGELES. January 2017.
 Traffic Impact Analysis for the STARBUCKS STORE Located at 9900 BALBOA BOULEVARD Submitted to CITY OF LOS ANGELES January 2017 Submitted By January 5, 2017 Ken A. Aitchison, P.E. Transportation Engineering
JEP John E. Jack Pflum, P.E. Consulting Engineering 7541 Hosbrook Road, Cincinnati, OH Telephone:
 JEP John E. Jack Pflum, P.E. Consulting Engineering 7541 Hosbrook Road, Cincinnati, OH 45243 Email: jackpflum1@gmail.com Telephone: 513.919.7814 MEMORANDUM REPORT Traffic Impact Analysis Proposed Soccer
DOLLAR GENERAL PROJECT FOCUSED TRAFFIC ANALYSIS (REVISED) May 20, 2015
 May 20, 2015") DOLLAR GENERAL PROJECT FOCUSED TRAFFIC ANALYSIS (REVISED) May 20, 2015 May 20, 2015 Mr. Dan Biswas, VP of Development CJS DEVELOPMENT II, LLC 5111 North Scottsdale Road, Suite 200 Scottsdale, CA 85250
DOLLAR GENERAL PROJECT FOCUSED TRAFFIC ANALYSIS (REVISED) May 20, 2015 May 20, 2015 Mr. Dan Biswas, VP of Development CJS DEVELOPMENT II, LLC 5111 North Scottsdale Road, Suite 200 Scottsdale, CA 85250
MEMORANDUM. Trip Generation Analysis
 MEMORANDUM To: RMC Architects From: Matthew Palmer, PE Subject: Trip Generation, Parking Analysis & Level of Service Project: Port of Everett, GTC #13-053 Date: August 25, 2014 The trip generation and
April 10, Mr. Curt Van De Walle, City Manager City of Castle Hills 209 Lemonwood Drive Castle Hills, Texas 78213
 Mr. Curt Van De Walle, City Manager City of Castle Hills 209 Lemonwood Drive Castle Hills, Texas 78213 Subject: Revised Castle Hills BASIS Charter School Traffic Impact Analysis Review City of Castle Hills,
Appendix C Traffic Study
 Final Environmental Impact Statement Appendix C Traffic Study Schofield Generating Station Project, Hawaii October 2015 C-1 Final Environmental Impact Statement This page intentionally left blank. Schofield
Travel Demand Management Plan
 Travel Demand Management Plan Tryg s & Apartment Building 8 West Lake Street Minneapolis, MN AUTHORIZED PROPERTY REPRESENTATIVE: By Dated: Mr. Johnny Carlson Trammell Crow Chicago Development, Inc. 5 South
VHD Daily Totals. Population 14.5% change. VMT Daily Totals Suffolk 24-hour VMT. 49.3% change. 14.4% change VMT
 6.9 Suffolk 6-54 VMT Population and Travel Characteristics Population 14.5% change 2014 1,529,202 VHD Daily Totals 2014 251,060 49.3% change 2040 1,788,175 2040 374,850 VMT Daily Totals 2014 39,731,990
MADISON, WI STONE HOUSE DEVELOPMENT 1000 E. WASHINGTON AVENUE REDEVELOPMENT TRANSPORTATION STUDY DECEMBER 14, 2015
 MADISON, WI STONE HOUSE DEVELOPMENT 1000 E. WASHINGTON AVENUE REDEVELOPMENT TRANSPORTATION STUDY DECEMBER 14, 2015 TABLE OF CONTENTS... 3 Proposed Development... 3 Methodology... 3 Phase 1 Development...
Focused Traffic Analysis for the One Lincoln Park Project
 September 15, 2015 Mr. Bill Johnson Coldwell Banker 511 Sir Francis Drake Boulevard Greenbrae, CA 94904 Focused Traffic Analysis for the One Lincoln Park Project Dear Mr. Johnson; As requested, W-Trans
6711 LEE HIGHWAY TRAFFIC IMPACT STUDY ARLINGTON, VIRGINIA
 6711 TRAFFIC IMPACT STUDY ARLINGTON, VIRGINIA Prepared for: NVR, Inc. Prepared by: Wells + Associates, Inc. Michael J. Workosky, PTP, TOPS, TSOS John J. Andrus William L. Zeid, PE 703.917.6620 May 4, 2017
Table of Contents Introduction... 4 Study Area... 5
 Table of Contents Introduction... 4 Study Area... 5 Streets and s... 5 Traffic Volumes... 8 Recent and Anticipated Development... 10 Crash Analysis... 10 Projected Traffic Volumes... 11 Trip Generation...
TRAFFIC STUDY FOR THE GAFFEY POOL PROJECT LOS ANGELES, CALIFORNIA CITY OF LOS ANGELES, BUREAU OF ENGINEERING OCTOBER 2013 PREPARED FOR PREPARED BY
 TRAFFIC STUDY FOR THE GAFFEY POOL PROJECT LOS ANGELES, CALIFORNIA OCTOBER 2013 PREPARED FOR CITY OF LOS ANGELES, BUREAU OF ENGINEERING PREPARED BY DRAFT TRAFFIC STUDY FOR THE GAFFEY POOL PROJECT October
3.0 ANALYSIS OF FUTURE TRANSPORTATION NEEDS
 3.0 ANALYSIS OF FUTURE TRANSPORTATION NEEDS In order to better determine future roadway expansion and connectivity needs, future population growth and land development patterns were analyzed as part of
The Highline Development Traffic Impact Study
 The Highline Development Traffic Impact Study Columbia Falls, Montana Prepared For: TD&H Engineering 450 Corporate Drive, Suite 101 Kalispell, MT 59901 June, 2018 130 South Howie Street Helena, Montana
WOODRUFF ROAD CORRIDOR ORIGIN-DESTINATION ANALYSIS
 2018 WOODRUFF ROAD CORRIDOR ORIGIN-DESTINATION ANALYSIS Introduction Woodruff Road is the main road to and through the commercial area in Greenville, South Carolina. Businesses along the corridor have
California Urban Infill Trip Generation Study. Jim Daisa, P.E.
 California Urban Infill Trip Generation Study Jim Daisa, P.E. What We Did in the Study Develop trip generation rates for land uses in urban areas of California Establish a California urban land use trip
TRANSPORTATION AND TRAFFIC ANALYSIS REPORT
 Square One Drive Extension Municipal Class Environmental Assessment Environmental Study Report Appendix B Transportation and Traffic Analysis Report TRANSPORTATION AND TRAFFIC ANALYSIS REPORT FINAL DRAFT
Appendix J: Transportation and Circulation
 Appendix J: Transportation and Circulation J 1: Transportation Analysis Report J 2: Los Angeles Department of Transportation (LADOT) Approval Letter J 3: Construction Traffic Analysis J 1: Transportation
APPENDIX IV MODELLING
 APPENDIX IV MODELLING Kingston Transportation Master Plan Final Report, July 2004 Appendix IV: Modelling i TABLE OF CONTENTS Page 1.0 INTRODUCTION... 1 2.0 OBJECTIVE... 1 3.0 URBAN TRANSPORTATION MODELLING
City of Hermosa Beach Beach Access and Parking Study. Submitted by. 600 Wilshire Blvd., Suite 1050 Los Angeles, CA
 City of Hermosa Beach Beach Access and Parking Study Submitted by 600 Wilshire Blvd., Suite 1050 Los Angeles, CA 90017 213.261.3050 January 2015 TABLE OF CONTENTS Introduction to the Beach Access and Parking
SHADE/SHADOW REPORT. For the Proposed 8777 Washington Project. Culver City, CA. Prepared for:
 SHADE/SHADOW REPORT For the Proposed 8777 Washington Project Culver City, CA Prepared for: VITRUVIAN CULVER CITY LLC (THE APPLICANT) 5822 WEST WASHINGTON BOULEVARD CULVER CITY, CALIFORNIA 90232 Prepared
Final City of Colusa STREETS & ROADWAYS MASTER PLAN. October J Street Suite 390 Sacramento, CA 95814
 Final City of Colusa STREETS & ROADWAYS MASTER PLAN October 2009 660 J Street Suite 390 Sacramento, CA 95814 TABLE OF CONTENTS I. INTRODUCTION... 1 Report Organization...1 II. ANALYSIS METHODOLOGY... 2
III. FORECASTED GROWTH
 III. FORECASTED GROWTH In order to properly identify potential improvement projects that will be required for the transportation system in Milliken, it is important to first understand the nature and volume
PRADO BASIN SEDIMENT REMOVAL PROJECT FOCUSED TRAFFIC ANALYSIS. May 31, 2016
 PRADO BASIN SEDIMENT REMOVAL PROJECT FOCUSED TRAFFIC ANALYSIS May 31, 2016 Kunzman Associates, Inc. PRADO BASIN SEDIMENT REMOVAL PROJECT FOCUSED TRAFFIC ANALYSIS May 31, 2016 Prepared by: Perrie Ilercil,
FY 2010 Continuing i Planning Program Product Report. Local Transportation and Traffic Data. Wood-Washington-Wirt Interstate Planning Commission
 FY 2010 Continuing i Planning Program Product Report Local Transportation and Traffic Data Travel Time and Delay Data for Belpre and Marietta, Ohio Wood-Washington-Wirt Interstate Planning Commission CONTINUING
I. M. Schoeman North West University, South Africa. Abstract
 Urban Transport XX 607 Land use and transportation integration within the greater area of the North West University (Potchefstroom Campus), South Africa: problems, prospects and solutions I. M. Schoeman
MnDOT Method for Calculating Measures of Effectiveness (MOE) From CORSIM Model Output
 From CORSIM Model Output") MnDOT Method for Calculating Measures of Effectiveness (MOE) From CORSIM Model Output Rev. April 29, 2005 MnDOT Method for Calculating Measures of Effectiveness (MOE) From CORSIM Model Output Table of
MnDOT Method for Calculating Measures of Effectiveness (MOE) From CORSIM Model Output Rev. April 29, 2005 MnDOT Method for Calculating Measures of Effectiveness (MOE) From CORSIM Model Output Table of
6 th Line Municipal Class Environmental Assessment
 6 th Line Municipal Class Environmental Assessment County Road 27 to St John s Road Town of Innisfil, ON September 6, 2016 APPENDIX L: TRAVEL DEMAND FORECASTING MEMORANDUM Accessible formats are available
TRANSPORTATION IMPACT STUDY WHEELER STREET CLOSURE
 TRANSPORTATION IMPACT STUDY WHEELER STREET CLOSURE Village of Greene, Chenango County, New York Prepared for: VILLAGE OF GREENE 49 Genesee Street Greene, NY 13778 Prepared by: LARSON DESIGN GROUP 1000
Trip Generation Study: A 7-Eleven Gas Station with a Convenience Store Land Use Code: 945
 Trip Generation Study: A 7-Eleven Gas Station with a Convenience Store Land Use Code: 945 Introduction The Brigham Young University Institute of Transportation Engineers student chapter (BYU ITE) completed
Prepared for: San Diego Association Of Governments 401 B Street, Suite 800 San Diego, California 92101
 Activity-Based Travel Model Validation for 2012 Using Series 13 Data: Coordinated Travel Regional Activity Based Modeling Platform (CT-RAMP) for San Diego County Prepared for: San Diego Association Of
HALFF 16196? TRAFFIC MANAGEMENT PLAN. Richardson ISD Aikin Elementary School Dallas, Texas North Bowser Road Richardson, Texas 75081
 30280 16196? TRAFFIC MANAGEMENT PLAN Exhibit 572B Aikin Elementary School Planned Development District No. 572 Approved City Plan Commission October20, 2016 July 12, 2016 Prepared for HALFF AVO 31586 PHO1
KAISER SOUTH NORTHERN VIRGINIA HUB TRAFFIC IMPACT STUDY PRINCE WILLIAM COUNTY, VIRGINIA TABLE OF CONTENTS. Section 2 BACKGROUND INFORMATION 12
 KAISER SOUTH NORTHERN VIRGINIA HUB TRAFFIC IMPACT STUDY PRINCE WILLIAM COUNTY, VIRGINIA TABLE OF CONTENTS Page EXECUTIVE SUMMARY 1 Purpose of Report and Study Objectives... 1 Site Location and Study Area...
TREASURE COAST REGIONAL PLANNING COUNCIL M E M O R A N D U M. To: Council Members AGENDA ITEM 4B10
 TREASURE COAST REGIONAL PLANNING COUNCIL M E M O R A N D U M To: Council Members AGENDA ITEM 4B10 From: Date: Subject: Staff December 14, 2018 Council Meeting Local Government Comprehensive Plan Review
Honorable Mayor and Members of the City Council
 TO: ATTENTION: FROM: SUBJECT: Honorable Mayor and Members of the City Council Jeffrey L. Stewart, City Manager Len Gorecki, Director of Public Works Jerry Stock, City Engineer Public Hearing to Consider
The Sunland Park flyover ramp is set to close the week of March 19 until early summer
 March 2, 2018 The Sunland Park flyover ramp is set to close the week of March 19 until early summer GO 10 is targeting the week of March 19 to close the Sunland Park Drive flyover entrance ramp to I 10
Expanding the GSATS Model Area into
 Appendix A Expanding the GSATS Model Area into North Carolina Jluy, 2011 Table of Contents LONG-RANGE TRANSPORTATION PLAN UPDATE 1. Introduction... 1 1.1 Background... 1 1.2 Existing Northern Extent of
FARM 1065 PORTION 1, ATLANTIS TRAFFIC IMPACT ASSESSMENT
 FARM 1065 PORTION 1, ATLANTIS TRAFFIC IMPACT ASSESSMENT February 2018 FIRST ISSUE Prepared by: JG AFRIKA (PTY) LTD Branch: Cape Town PO Box 38561 Postal code: 7430 Telephone: 021 530 1800 Email: wink@
January 12, Mr. Ryan Granger TMGB Wilson, LLC 2221 Health Drive SW, Suite 2200 Wyoming, Michigan 49519
 January 12, 2018 Mr. Ryan Granger TMGB Wilson, LLC 2221 Health Drive SW, Suite 2200 Wyoming, Michigan 49519 Re: Proposed Reserve at Rivertown Mixed-Use Development Updated Trip Generation and Site Driveway
CONTINUING PLANNING PROGRAM LOCAL TRANSPORTATION AND TRAFFIC DATA PRODUCT REPORT [OH Corridors]
![CONTINUING PLANNING PROGRAM LOCAL TRANSPORTATION AND TRAFFIC DATA PRODUCT REPORT [OH Corridors]](/thumbs/94/120123757.jpg "CONTINUING PLANNING PROGRAM LOCAL TRANSPORTATION AND TRAFFIC DATA PRODUCT REPORT [OH Corridors]") CONTINUING PLANNING PROGRAM LOCAL TRANSPORTATION AND TRAFFIC DATA PRODUCT REPORT [OH Corridors] Travel Time and Delay Analysis for Belpre (OH) and Marietta (OH) Fiscal Year 2009 Report WOOD WASHINGTON
CONTINUING PLANNING PROGRAM LOCAL TRANSPORTATION AND TRAFFIC DATA PRODUCT REPORT [OH Corridors] Travel Time and Delay Analysis for Belpre (OH) and Marietta (OH) Fiscal Year 2009 Report WOOD WASHINGTON
PROPOSED PROJECT. Section PROJECT DESCRIPTION
 1 2 3 4 5 6 7 8 9 10 11 12 13 14 15 16 17 18 19 20 21 22 23 24 25 26 27 28 29 30 31 32 33 34 35 36 37 38 39 40 41 42 43 1.1 PROJECT DESCRIPTION This Environmental Assessment describes the proposed improvements
CHAPTER 2. CAPACITY OF TWO-WAY STOP-CONTROLLED INTERSECTIONS
 CHAPTER 2. CAPACITY OF TWO-WAY STOP-CONTROLLED INTERSECTIONS 1. Overview In this chapter we will explore the models on which the HCM capacity analysis method for two-way stop-controlled (TWSC) intersections
Date: April 3, 2018 Revised May 15, Project #: Re: Burlington Mall Retail Collection Transportation Evaluation
 To: Chuck Schneider Burlington S&S, LLC 225 West Washington Street Indianapolis, IN 46204 From: Patrick Dunford, P.E. Senior Project Manager Date: April 3, 2018 Revised May 15, 2018 Project #: 13482.01
Parking Regulations Dundas Street West, from Bathurst Street to Dovercourt Road
 STAFF REPORT ACTION REQUIRED Parking Regulations Dundas Street West, from Bathurst Street to Dovercourt Road Date: October 28, 2008 To: From: Toronto and East York Community Council Director, Transportation
MEMORANDUM (DRAFT) DRAFT
 DRAFT") 117 Commercial St. NE, Suite 310 Salem, OR 97301 503.391.8773 www.dksassociates.com MEMORANDUM (DRAFT) DATE: February 15, 2017 TO: FROM: SUBJECT: Alex Dupey, MIG Scott Mansur, PE, PTOE; Garth Appanaitis,
117 Commercial St. NE, Suite 310 Salem, OR 97301 503.391.8773 www.dksassociates.com MEMORANDUM (DRAFT) DATE: February 15, 2017 TO: FROM: SUBJECT: Alex Dupey, MIG Scott Mansur, PE, PTOE; Garth Appanaitis,
Subject: Desert Palisades Specific Plan - Tram Way Access Sight Distance
 Endo Engineering Traffic Engineering Air Quality Studies Noise Assessments July 13, 2015 Mr. Ed Freeman Pinnacle View, LLC P.O. Box 1754 Lake Oswego, OR 97035-0579 Subject: Desert Palisades Specific Plan
2129 NORTH MAIN STREET HOTE PROJECT ULI SHARED PARKING STUDY City of Santa Ana, California
 2129 NORTH MAIN STREET HOTE PROJECT ULI SHARED PARKING STUDY City of Santa Ana, California Prepared for: NET DEVELOPMENT COMPANY 3130 Airway Avenue Costa Mesa, CA 92626 Prepared by: RK ENGINEERING GROUP,
Prepared for. 3D/International, Inc West Loop South, Suite 400 Houston, Texas November 2006
 DRAFT TRAFFIC IMPACT STUDY FOR PHASED DEVELOPMENT OF TAMU CC Prepared for 3D/International, Inc. 1900 West Loop South, Suite 400 Houston, Texas 77027 November 2006 Interim Review Only Document Incomplete:
Brandywine Road Speed Study FINAL REPORT
 Brandywine Road Speed Study FINAL REPORT City of Albuquerque Brandywine Road Speed Study Final Report Albuquerque, New Mexico City of Albuquerque May, 2016 Brandywine Road Speed Study Final Report City
US 169/I-70 North Loop Planning & Environmental Linkages Study
 US 169/I-70 North Loop Planning & Environmental Linkages Study VISSIM Calibration Document Draft April 13, 2018 Page i Table of Contents 1. Overview... 1 2. Data Types... 2 3. Model Parameter Adjustments...
Greater Toronto Area Cordon Count Summary Analysis of Traffic Trends 1985 to 2011
 Greater Toronto Area Cordon Count Summary Analysis of Traffic Trends 1985 to 2011 Prepared by: Data Management Group Department of Civil Engineering University of Toronto Telephone: (416) 978-3916 Table
GIS Analysis of Crenshaw/LAX Line
 PDD 631 Geographic Information Systems for Public Policy, Planning & Development GIS Analysis of Crenshaw/LAX Line Biying Zhao 6679361256 Professor Barry Waite and Bonnie Shrewsbury May 12 th, 2015 Introduction
North Carolina s First Quadrant Left: History and Lessons Learned
 0 0 0 North Carolina s First Quadrant Left: History and Lessons Learned Michael P. Reese, P.E. (Corresponding Author) Congestion Management Section Project Engineer North Carolina Department of Transportation
2015 Grand Forks East Grand Forks TDM
 GRAND FORKS EAST GRAND FORKS 2015 TRAVEL DEMAND MODEL UPDATE DRAFT REPORT To the Grand Forks East Grand Forks MPO October 2017 Diomo Motuba, PhD & Muhammad Asif Khan (PhD Candidate) Advanced Traffic Analysis
North Carolina s First Quadrant Left: History and Lessons Learned
 North Carolina s First Quadrant Left: History and Lessons Learned Michael P. Reese, P.E. (Corresponding Author) Congestion Management Section Project Engineer North Carolina Department of Transportation
CHAPTER 3 TRANSPORTATION
 CHAPTER 3 TRANSPORTATION This chapter presents information on transportation impacts of Section 2 of the Project that have changed from those identified in the published Westside Subway Extension Final
930 Old Northern Rd & 4 Post Office Rd, Glenorie
 Proposed Mixed Use Development 930 Old Northern & 4, Glenorie TRAFFIC AND PARKING ASSESSMENT REPORT 13 December 2016 Ref 16264 Suite 6, 20 Young Street, Neutral Bay NSW 2089 - PO Box 1868, Neutral Bay
Per your request and authorization, we have prepared this traffic evaluation for the above referenced project.
 Memorandum To: From: Re: Marc Stout, P.E. City Engineer, City of Roseville Chris Gregerson, P.E., T.E. Matt Weir, P.E., T.E., PTOE Douglas Boulevard Coffee Kiosk Traffic Evaluation Roseville, California
FHWA Peer Exchange Meeting on Transportation Systems Management during Inclement Weather
 Travel Demand Modeling & Simulation at GBNRTC Matt Grabau Kimberly Smith Mike Davis Why Model? Travel modeling is a tool for transportation planners and policy makers, to observe impacts of a transportation
CHAPTER 3. CAPACITY OF SIGNALIZED INTERSECTIONS
 CHAPTER 3. CAPACITY OF SIGNALIZED INTERSECTIONS 1. Overview In this chapter we explore the models on which the HCM capacity analysis method for signalized intersections are based. While the method has
Signalized Intersections
 Signalized Intersections Kelly Pitera October 23, 2009 Topics to be Covered Introduction/Definitions D/D/1 Queueing Phasing and Timing Plan Level of Service (LOS) Signal Optimization Conflicting Operational
IV. ENVIRONMENTAL IMPACT ANALYSIS B. AESTHETICS SHADE/SHADOW
 IV. ENVIRONMENTAL IMPACT ANALYSIS B. AESTHETICS SHADE/SHADOW 1. INTRODUCTION Potential effects of the Proposed Project related to visual character, views and light/glare are addressed in Section IV.A,
Technical Memorandum #2 Future Conditions
 Technical Memorandum #2 Future Conditions To: Dan Farnsworth Transportation Planner Fargo-Moorhead Metro Council of Governments From: Rick Gunderson, PE Josh Hinds PE, PTOE Houston Engineering, Inc. Subject:
Roundabout Level of Service
 Roundabout Level of Service Rahmi Akçelik Director Akcelik & Associates Pty Ltd email: rahmi.akcelik@sidrasolutions.com web: www.sidrasolutions.com 8 January 2009 Contents 1. Introduction... 1 2. Fundamental
South Western Region Travel Time Monitoring Program Congestion Management Process Spring 2008 Report
 South Western Region Travel Monitoring Program Congestion Management Process Spring 2008 Report Prepared by: South Western Regional Planning Agency 888 Washington Boulevard Stamford, CT 06901 Telephone:
2011 South Western Region Travel Time Monitoring Program Congestion Management Process. Executive Summary
 2011 South Western Region Travel Monitoring Program Executive Summary Prepared by: South Western Regional Planning Agency 888 Washington Blvd, 3rd Floor Stamford, CT 06901 Telephone: 203.6.5190 Facsimile:
Taming the Modeling Monster
 Taming the Modeling Monster Starring: Ellen Greenberg Scott McCarey Jim Charlier Audience Poll, part 1 Elected Officials Board Members Public Staff Consultants Journalists Other Audience Poll, part 2 Modeling
Tier 2 Final Environmental Assessment I-66 Transportation Technical Report. Appendix E. Travel Demand Forecasting Model Validation Memorandum
 Tier 2 Final Environmental Assessment I-66 Transportation Technical Report Appendix E Travel Demand Forecasting Model Validation Memorandum FINAL AUGUST 216 MEMORANDUM To: Robert Josef, VDOT Northern Virginia
PRELIMINARY WORKING DRAFT Work in Progress
 IV. ENVIRONMENTAL IMPACT ANALYSIS H. MINERAL RESOURCES 1.0 INTRODUCTION This section addresses the potential impacts of the Proposed Project on mineral resources (i.e., sand, gravel and petroleum). The
2014 Data Collection Project ITE Western District
 2014 Data Collection Project ITE Western District Project Completed By: Oregon State University OSU ITE Student Chapter 101 Kearney Hall Corvallis, OR 97331 Student Coordinator: Sarah McCrea (OSU ITE Student
TRAFFIC IMPACT STUDY
 TRAFFIC IMPACT STUDY TERRE HAUTE CONVENTION CENTER WABASH AVENUE & 9 TH STREET TERRE HAUTE, INDIANA PREPARED FOR 8365 Keystone Crossing, Suite 201 Indianapolis, IN 46240 Phone: (317) 202-0864 Fax: (317)
APPENDIX G Halton Region Transportation Model
 APPENDIX G Halton Region Transportation Model Halton Region Transportation Master Plan Working Paper No. 1 - Legislative Context Working Paper No. 2 - Active Transportation Halton Transportation Model
DOWNTOWN SUB-AREA. Final Parking Study. Prepared for: City of Bellingham. March Prepared by:
 Final Parking Study DOWNTOWN SUB-AREA Prepared for: City of Bellingham March 2013 Prepared by: 11730 118 th Avenue NE, Suite 600 Kirkland, WA 98034-7120 Phone: 425-821-3665 Fax: 425-825-8434 www.transpogroup.com
COUNCIL POLICY MANUAL
 COUNCIL POLICY MANUAL SECTION: PUBLIC WORKS SUBJECT: SNOW & ICE CONTROL POLICY 2012/2013 GOAL: Pages: 1 of 10 Approval Date: Dec. 3, 2012 Res. # 1001/2012 To annually identify the winter maintenance costs
I-10 East at Redd closes for 24 hours this Sunday, Feb 11. Then, I-10 West at Resler closes for 27 hours on Feb 25
 NEWS RELEASE a TxDOT Project For immediate release EL PASO DISTRICT Jennifer Wright (915) 790-4340 Jennifer.Wright3@txdot.gov February 9, 2018 I-10 East at Redd closes for 24 hours this Sunday, Feb 11
Appendix BAL Baltimore, Maryland 2003 Annual Report on Freeway Mobility and Reliability
 (http://mobility.tamu.edu/mmp) Office of Operations, Federal Highway Administration Appendix BAL Baltimore, Maryland 2003 Annual Report on Freeway Mobility and Reliability This report is a supplement to:
Alternatives Analysis Report
 1.0 PURPOSE AND NEED The Southern California Association of Governments (SCAG), in coordination with the Los Angeles County Metropolitan Transportation Authority (Metro) and the Orange County Transportation
GIS-BASED VISUALIZATION FOR ESTIMATING LEVEL OF SERVICE Gozde BAKIOGLU 1 and Asli DOGRU 2
 Presented at the FIG Congress 2018, May 6-11, 2018 in Istanbul, Turkey GIS-BASED VISUALIZATION FOR ESTIMATING LEVEL OF SERVICE Gozde BAKIOGLU 1 and Asli DOGRU 2 1 Department of Transportation Engineering,
City of Saginaw Right of Way Division Snow and Ice Removal Policy January 18, 2016
 Snow and Ice Removal Policy January 18, 2016 It is the policy of the to provide snowplowing and ice removal services in order to: Provide safe traveling conditions for motorists and pedestrians Assist
Updating the Urban Boundary and Functional Classification of New Jersey Roadways using 2010 Census data
 Updating the Urban Boundary and Functional Classification of New Jersey Roadways using 2010 Census data By: Glenn Locke, GISP, PMP 1 GIS-T May, 2013 Presentation Overview Purpose of Project Methodology
TRAFFIC IMPACT STUDY FOR SOUTH BAY SALT POND RESTORATION PROJECT PHASE 2
 APPENDIX G TRAFFIC IMPACT STUDY FOR SOUTH BAY SALT POND RESTORATION PROJECT PHASE 2 South Bay Salt Pond Restoration Project Phase II May 2015 Draft Environmental Impact Statement/Report Traffic Impact
City of Camrose Winter Road Maintenance Policy
 City of Camrose Winter Road Maintenance Policy The purpose of this policy is to outline the level of service that the City of Camrose delivers regarding the maintenance of roads in winter conditions. 1.
March Grade Crossing Analysis
 March 2014 Grade Crossing Analysis T E C H N I C A L M E M O R A N D U M South Florida Freight and Passenger Rail Enhancement Study Phase 1A - Rehabilitate Existing Northwood Connection; FPID: 434948-1
CITY OF NEW LONDON WINTER ROAD & SIDEWALK MAINTENANCE POLICY
 CITY OF NEW LONDON WINTER ROAD & SIDEWALK MAINTENANCE POLICY GENERAL The purpose of this policy is to set up acceptable procedures and policies for the winter maintenance of public areas in the City of
SUBJECT: CONGESTION MANAGEMENT PROGRAM 2013 LOCAL DEVELOPMENT REPORT, RESOLUTION NO
 City of Westlake Village July 24, 2013 Agenda Item: Public Hearing No. 3 TO: FROM: Mayor and City Council Raymond B. Taylor, City Manager SUBJECT: CONGESTION MANAGEMENT PROGRAM 2013 LOCAL DEVELOPMENT REPORT,