Power System Operation Corporation Ltd.
|
|
|
- Erik Potter
- 5 years ago
- Views:
Transcription


1 WEATHER INFORMATION PORTAL FOR INDIAN POWER SYSTEM Reference Document Power System Operation Corporation Ltd. (A Government of India Enterprise)
2

3
4
5

6
7 INDEX S. No Description Page No. 1.0 EXECUTIVE SUMMARY INTRODUCTION IMPORTANT TERMINOLOGY INFORMATION AVAILABLE ON THE WEATHER PORTAL ALL INDIA WEATHER INFERENCE ALL INDIA WEATHER FORECAST ALL INDIA WEATHER WARNING NOWCAST WARNING SATELLITE SATELLITE METROLOGY VISIBLE IMAGERY INFRARED SATELLITE IMAGE SWIR (SHORTWAVE INFRA-RED IMAGE) COLOUR COMPOSITE IMAGERY RAPID REGION SPECIFIC PRODUCTS 45
8 6.1 REGIONAL WEATHER SUMMARY STATION/CITY WISE LOCAL WEATHER REPORT AND FORECAST DOPPLER WEATHER RADAR (DWR) METEOGRAM GFS MODEL FOR RAINFALL FORECAST METAR REGION SPECIFIC FORECAST LAUNCH OF WEATHER PORTAL WORKSHOPS AND OTHER INITIATIVES EXPERIENCE SO FAR ROAD AHEAD REGIONAL CONTACT DETAILS OF IMD 88 ANNEXURE-I 89 ANNEXURE-II 90 ANNEXURE-III 102 ACRONYMS 129 DISCLAIMER 131
9 1. Executive Summary The Indian grid has total installed capacity of around 330 GW. The installed capacity comprises of GW of Thermal, GW of Hydro, GW of Renewable and 6.78 GW of Nuclear Generation. The Government of India has revised its target of Renewable energy capacity to 1,75,000 MW till 2022, comprising of 100,000 MW Solar, 60,000 MW Wind, 10,000 MW Biomass and 5000 MW Small Hydro. Hence, we can expect a markedly high growth in commissioning of Wind and Solar plants in the country which are highly dependent on weather. Extreme Weather conditions can affect both power system elements and its operation to a large extent. The Indian weather is driven by the Asiatic Monsoon system. In addition, the Himalayas and the Thar Desert play a vital role to influence it. There is a diversity of weather conditions ranging from tropical wet to tropical dry and subtropical humid to dry with a huge variation. During summer period, massive convective thunderstorms dominate Northern India's weather. The temperatures in the North India rise accompanied with strong, gusty, hot and dry winds. In summer months, with increase in temperature, power demand increases sharply. These weather conditions coupled with frequent thunderstorms lead to sudden load crash in pockets due to sudden drop in temperatures and tripping/opening of distribution feeders leading to high voltages in the Northern Grid. The load returns within few hours after short and temporary effects of thunderstorm. In winter season the cold weather conditions lead to decrease in temperature. Western disturbances in winter season bring moderate to heavy rain in low lying areas and snow fall in mountainous areas of the Northern Region. Cyclones affect thousands of Indians living in coastal regions. This is particularly common in the northern reaches of the Indian Ocean in and around the Bay of Bengal. Cyclones include heavy rains, large storm surges, and strong winds that often cut power supply to the affected areas. Accurate anticipation of extreme weather conditions i.e. snowstorms, dust storms, High winds, and thunderstorms, heavy rain, cyclones etc. facilitate advance operation planning, secure system operation and early restoration of the affected areas. Timely and effective forecasting of Weather is one of the key issues in enabling integration/higher penetration of renewable generation in the Indian 1
10 Power system in the times to come. In future meteorologists may be called upon to integrate solar irradiance/wind forecast into load for economic optimisation of generation. Meteorologists can use their statistical background and forecast expertise to better bracket the intra- day and day ahead renewable energy forecast and load forecast. They are uniquely equipped to integrate the science of meteorology into informed operational decisions in power system The Weather Portal provides both near real time weather information and forecast of different weather parameters across the country. Accurate anticipation of the weather variations would pave the way for efficient, secure and reliable operation of the Indian power grid. 2
11 2. Introduction Earth System Science Organization, India Meteorological Department (ESSO-IMD), Under the Ministry of Earth Sciences and Power System Operation Corporation Ltd. (POSOCO), signed a Memorandum of Understanding for optimum use of weather information / forecast in the power sector. Salient features of the MoU signed in the presence of senior officers from the Ministry of Power and the Ministry of Earth Sciences include: All weather information provided by ESSO-IMD shall be used by the Power System Operators across India for better management of Indian Power System and for the purpose of analysis. ESSO-IMD shall make available current weather information for the identified stations; and forecasts at different time scales (Nowcast to medium range scales) of temperature, humidity, wind speed, wind direction, rainfall and other meteorological parameters of the identified stations/sectors. ESSO-IMD shall provide weather warnings about likely occurrences of thunderstorm, heat wave, cold wave, rainfall, fog etc. over various states up to next 72 hours. ESSO-IMD shall provide state / region wise Monthly /Seasonal outlooks of weather conditions. Both the parties agreed to provide expert opinion and knowledge support in areas of Weather information and its effect on power distribution system. Data & Inputs shall be exchanged to encourage further study and research work. POSOCO shall endeavour for economic assessment of impact of weather & climate information. Regular feed mechanism shall be put in place for continued up-gradation of the services. The MoU essentially brings out the fact that energy sector is one of the most pivotal spheres of human activity which are highly dependent on weather conditions. To increase the efficiency of power sector 3
 Weather information on different time scales is essential both in day-to-day energy management and for the")
12 and to make it weather proof, it is not sufficient to act after they have taken place. Proactive steps are required to minimise the possible adverse impacts. (Signing of MOU between POSOCO and IMD on 18 th May 2015 at Shram Shakti Bhawan, New Delhi) Weather information on different time scales is essential both in day-to-day energy management and for the generation and distribution infrastructures. Day to day weather variations have an impact on load demand and power production, transmission and distribution management. Extreme events such as heat waves or cold waves, wind storms or floods can of course have dramatic consequences on the electrical grid of a country including physical damage to the infrastructure. In addition to short & medium-term management processes the long-term production and supply planning require climate data and future climate scenarios. In order to manage the risks associated with weather and climate conditions on all time scales from a few minutes to days, reliable weather forecasts and climate information past, present and future are therefore crucial to reduce the uncertainty in supply and demand forecasts, as well as market dynamics. In pursuance to this MOU, dedicated weather portal for the power sector has been developed jointly by POSOCO and IMD. The weather portal contains information related to weather forecast, real time weather scenario and past data of various locations across the country. 4
13 3. Important Terminology 1. Meteorological seasons over India : Winter Season : January February Pre Monsoon Season : March May Southwest Monsoon Season : June - September Post Monsoon Season : October December 2. Weak Monsoon: Rainfall is less than half the normal (over the land area) Wind speed is upto 12 knots (over the Sea). 3. Normal Monsoon: Rainfall is half to less than 1½ times the normal (over the land area). Wind speed is between13 and 22 knots (over the Sea). 4. Active Monsoon: Rainfall is 1 ½ to 4 times the normal. The rainfall in at least two stations should be 5 cm, if that sub-division is along the west coast and 3 cm, if it is elsewhere. Rainfall in that sub-division should be fairly widespread to widespread. (over the land area) Wind speed is between 23 and 32 knots (over the Sea). 5. Vigorous Monsoon: Rainfall is more than 4 times the normal. The rainfall in at least two stations should be 8 cm, if the sub-division is along the west coast and 5 cm, if it is elsewhere. Rainfall in that sub-division should be fairly widespread or widespread. Wind speed is 33 knots and above (over the Sea). 5
14 6. Southwest Monsoon: The South westerly wind flow occurring over most parts of India and Indian Seas gives rise to southwest monsoon over India from June to September. The Southwest monsoon normally sets in over Kerala around 1st June. It advances northwards, usually in surges, and covers the entire country around 15th July. 7. Northeast Monsoon (post monsoon season) : The large indentation made by the Bay of Bengal into India's eastern coast means that the flows are humidified before reaching Kanya Kumari and rest of Tamil Nadu. Therefore, Tamil Nadu and some parts of Kerala experience significant precipitation in the post-monsoon and winter periods. However, parts of West Bengal, Orissa, Andhra Pradesh, Karnataka and North-East India also receive minor precipitation from the northeast monsoon. 8. Cloud coverage: Measurement of cloud coverage Clear sky : 0 octa Mainly clear : 1-2 octa of sky covered Partly cloudy : 3-4 octa of sky covered Generally cloudy : 5-7 octa of sky covered Cloudy : > 7 octa of sky covered Overcast sky : Sky completely covered by cloud 9. Classification of rainfall intensity based on total rainfall in 24 hours: Very light rain : < 2.4 mm Light rain : mm Moderate rain : mm Heavy rain : mm Very heavy rain : mm Exceptionally heavy rain : > mm 6
15 10. Classification of rainfall intensity based on hourly rainfall data: Rainfall Category Percentile Rainfall in cm/hour Light spell Upto 50 th percentile Rainfall up to 1 cm/hour Moderate spell Up to 80 th percentile Rainfall up to 1-2 cm/hour Intense spell 90 th percentile Rainfall 2-3 cm/hour Very Intense spell 99.9th percentile Rainfall 3-5 cm/hour Extremely intense spell >99.99 percentile Rainfall 5-10 cm/hour Cloud burst Rainfall >10 cm/hour 11. Classification of snowfall intensity based on total snowfall in 24 hours: Terminology Percentile Snowfall depth in cm Light snowfall Less than 50 th percentile 10.4 cm or less Moderate snowfall cm Heavy snowfall cm Very heavy snowfall cm Extremely heavy snowfall > cm or more 7
16 12. Rainfall category and their description: Rainfall Category Description Details WS Wide spread/at most places (76-100)% of stations get rainfall FWS Fairly wide spread/at many places (51-75)% of stations get rainfall SCT Scattered /At few places (26-50)% of stations get rainfall ISOL Isolated /At one or two places <=25% stations get rainfall Dry No rain No station report rainfall 13. Probability forecasts of rainfall or weather: Term Probability Unlikely Probability of occurrence less than 25% Likely Probability of occurrence between 25 & 50% Very likely Probability of occurrence between 51% & 75 % Most likely Probability of occurrence above 75% 14. Classification of Tropical disturbances : Classification of Tropical disturbance Low Depression Deep Depression Cyclone Severe Cyclone Very Severe Cyclone Super Cyclone Wind Speed Less than 31 km/hr km/hr km/hr km/hr km/hr km/hr 222 km/hr and above 8
17 15. Forecast: Long range forecast : 10 day a season or a year Extended range : days Medium range forecast : 3 days-9 days Short range forecast : 3 hours 3 days Nowcast : 1-3 hours These days a five- day weather forecast is generally as reliable as a three-day forecast of two decades ago. Seasonal climate predictions can be forecasted up to a month, three months or six months ahead although these climate predictions are probabilistic in nature. 16. UTC Time: The world's weather communities use a twenty four hour clock, similar to "military" time based on the 0 longitude meridian, also known as the Greenwich meridian. Prior to 1972, this time was called Greenwich Mean Time (GMT). Now it is referred as Universal Time Coordinated (UTC). It is also known as "Z time" or "Zulu time". To obtain local time (IST) in INDIA, 5 hours and 30 minutes shall be added to UTC time. 17. Thunderstorm: A thunderstorm is defined as a meteorological phenomenon in which one or more sudden electrical discharges are manifested by a flash of light (Lightning) and a sharp rumbling sound (thunder) occurs from a cloud of vertical development. 18. Dust Storm: Dust storm is an ensemble of particles of dust or sand energetically lifted to great heights by a strong and turbulent wind. Often the surface visibility is reduced to low limits; the qualification for a synoptic report is visibility below 1000m. 19. Cyclonic Circulation : Atmospheric wind flow in upper levels associated with any low pressure system. The wind flow is counter clockwise in the Northern Hemisphere and clockwise in the Southern Hemisphere. 20. Anticyclonic Circulation : Atmospheric wind flow in upper levels associated with any high pressure system. The wind flow is clockwise in the Northern Hemisphere and counter clockwise in the Southern Hemisphere. 9
18 21. Western Disturbance : Weather disturbances noticed as cyclonic circulation/trough in the mid and lower tropospheric levels or as a low pressure area on the surface, occurs in middle latitude westerlies and originate over the Mediterranean Sea, Caspian Sea and Black Sea and move eastwards across north India. From January to February Western disturbances bring heavy burst of rain and snow. 22. Western Depression: Weather system which originates over the Mediterranean Sea, Caspian Sea and Black Sea and approaches northwest India, is defined by two or more closed isobars on the surface. (The greater the pressure contrast over an area, the shorter the distance between isobars on a weather map depicting the area. Wind blows from areas of high to low pressure. The greater the contrast in pressure difference between two areas, the faster the wind will blow, hence closer the isobars on a weather map predict higher velocity winds) 23. One or Two spells of rain/showers: During 24 hrs period, rain occurring with a frequency of 1-2 spells. 24. A Few Spells of rain/showers: During 24 hrs period, rain occurring with a frequency of more than 2 spells coupled with well-defined dry spells in between. 25. Intermittent rain: During 24 hrs period, rain occurring with a frequency of more than that defined in A Few Spells but is discontinuous and without presenting the character of a shower. 26. Continuous rain/shower: Rain occurring almost throughout the 24-hour period. 27. Drizzle: Liquid precipitation in the form of water drops of very small size (by convention, with radius of water drops between about 100 and 500 µm). 28. Shower: Solid or liquid precipitation from a vertically developed cloud is designated a shower and is distinguished from the precipitation, intermittent or continuous, from layer clouds. Showers are often characterized by short duration and rapid fluctuations of intensity (by convention, with radius of water drops more than2500 µm). 29. Mist Dew: Mist is a phenomenon in which small droplets suspended in air Condensate to water vapour on a surface, whose temperature is reduced by radiational cooling to below the DEW- POINT of the air in contact with it. 10
19 30. Frost: Frost occurs when the temperature of the air in contact with the ground, or at thermometer-screen level, is below the freezing-point of water ( ground frost or air frost, respectively). The term is also used for the icy deposits which may form on the ground and on objects in such temperature conditions (glaze, hoar-frost). 31. Haze: Haze is traditionally an atmospheric phenomenon where dust, smoke and other dry particles obscure the clarity of the sky. 32. Weekly/Seasonal rainfall distribution on Regional scale : Excess: Percentage departure of realised rainfall from normal rainfall is + 20% or more. Normal: Percentage departure of realised rainfall from normal rainfall is between - 19 % and + 19 %. Deficient: Percentage departure of realised rainfall from normal rainfall is between 20 % and - 59 %. Scanty: Percentage departure of realised rainfall from normal rainfall is between 60 % to - 99 %. No rain: Percentage departure of realised rainfall from normal rainfall is 100 %. 33. Rainfall distribution on all India scale : Normal: Percentage departure of realised rainfall is within ±10 % of the long period average. Below Normal: Percentage departure of realised rainfall is < 10% of the long period average. Above Normal: Percentage departure of realised rainfall is > 10% of the long period average. 11
20 34. Terms used for description of temperatures : a) Temperature departures: Markedly below normal Appreciably below normal : -5 C or less : -3 C to -5 C Below normal : -1.6 C to 3 C Normal : -1.5 C to 1.5 C Above normal : 1.6 C to 3 C Appreciably above normal : 3.1 C to 5 C Markedly above normal : 5 C or more b) 24 hrs temperature changes: Marked fall Appreciably fall No large change : -4.1 C or less : C to -4.0 C : -2 C to +2 C Appreciably rise : 2.1 C to 4 C Marked rise : 4.1 C or more 35. Hail: It is solid precipitation in the form of balls or pieces of ice (hailstones) with diameters ranging from 5 to 50 mm or more. Hail can be extremely dangerous and can cause extensive damage in only a few minutes. 36. Heat Wave: A continuous spell of abnormally hot weather. Heat wave is considered if the maximum temperature of a station reaches at least 40 C or more for Plains and at least 30 C or more for Hilly regions. a) Based on departure from Normal Temperature Heat wave Severe heat wave : Departure from normal is 4.5 C to 6.4 C : Departure from normal is > 6.4 C 12
21 b) Based on actual Maximum Temperature Heat wave : When actual maximum temperature 45 C Severe heat wave : When actual maximum temperature 47 C c) Warm Night: It should be considered only when maximum temperature remains 40 C or more. It may be defined based on departure or actual minimum temperature as follow: Warm night Very warm night : Minimum temperature departure is 4.5 C to 6.4 C : Minimum temperature departure is > 6.4 C. d) Criteria for describing Heat Wave for coastal stations When maximum temperature is 4.5 C or more from normal, Heat Wave may be described provided actual maximum temperature is 37 C or more. 37. Cold Wave: A rapid fall in temperature within 24 hours to a level requiring substantially increased protection to agriculture, industry, commerce and social activities. a) When normal minimum temperature is equal to 10 C or less for plains and 0 C or less for hilly regions. Based on Departure: Cold wave Severe cold wave : Negative departure from normal is 4.5 C to 6.4 C : Negative departure from normal is > 6.4 C Based on actual Minimum Temperature(for plain station Only): Cold wave : When actual minimum temperature 04 C Severe cold wave : When actual minimum temperature 02 C b) Cold day: It should be considered when minimum temperature is equal to 10 C or less for plains and 0 C or less for hilly regions. Warm night Very warm night : Maximum temperature departure is -4.5 C to -6.4 C : Maximum temperature departure is <- 6.4 C. 13
22 c) Cold Wave for coastal stations: When minimum temperature departure is -4.5 C or less over a station, Cold Wave may be described if the minimum temperature is 15 C or less. cold day/ cold wave or heat wave /warm night should be described, if conditions are satisfied simultaneously. 38. Fog: Fog is a phenomenon of small droplets suspended in air and the horizontal visibility is one kilometre or less. 39. Gales: A gale is a very strong wind (34 to 47 knots). 40. Squall: A squall is a strong, sudden wind which generally lasts a few minutes then quickly decreases in speed. 41. Gust: A rapid increase in the strength of the wind relative to the mean strength at the time. 14
23 4. Information Available on the Weather Portal Weather Portal for Power System has been developed using readily available products of IMD. Weather information provided on the Portal is being used by the Power System Operators across India for better management of Indian Power System. Regional Weather portals for all the five regions were made operational as per the details given below: Northern Region : with effect from North Eastern Region : with effect from Southern Region : with effect from Eastern Region : with effect from Western Region : with effect from The Home Page of the Portal ( contains following Report/Product under different tabs: All India Weather Inference All India Weather Forecast All India Weather Warning Nowcast warning Satellite Regions The details of above Report/Product are given below: 15

24 4.1 All India Weather Inference Weather Inference is issued based on meteorological analysis of weather data. It contains information about weather systems and it is updated 4 times in a day. Morning : 08:00 hrs - 08:30 hrs Mid-day : 11:00 hrs - 11:30 hrs Evening : 16:00 hrs - 16:30 hrs Night : 20:00 hrs - 20:30 hrs Sample of all India Weather Inference 16
25 4.2 All India Weather Forecast All India weather forecast provides information about the following: Significant weather features Weather observations Meteorological analysis Weather forecast for next 5 days and subsequent 2 days Weather warning for 5 days Met Sub division wise rainfall forecast Maximum &Minimum temperature during last 24 hours Departure of maximum and minimum temperature from normal temperature Above reports are updated 4 times in a day: Morning : 08:00 hrs - 08:30 hrs Mid-day : 13:00 hrs - 13:30 hrs Evening : 16:00 hrs - 16:30 hrs Night : 20:00 hrs - 20:30 hrs 17
26 Details of reports available under all India Weather Forecast Significant weather features: This report provides the present outlook of all India weather condition i.e. Fog, rainfall etc. Tuesday 16 January 2018 EVENING Time of Issue: 1630 hours IST ALL INDIA WEATHER SUMMARY AND FORECAST BULLETIN Significant weather features: Dense to very dense fog observed at many places over Bihar; at a few places over East Uttar Pradesh and Tripura; at isolated places over Punjab, Coastal Andhra Pradesh and moderate to dense fog at isolated places over Marathawada, Gangetic West Bengal, Assam & Meghalaya. The lowest visibility (in meters) observed at Amritsar, Bahraich, Gorakhpur, Bhagalpur & Kailashahar-25 each; Patna, Purnea, Agartala & Bapatla-50 each; Varanasi, Dibrugarh & Tezpur-200 each and Sultanpur, Malda, Kolkata (Alipur) & Aurangabad-500 each from 0230 hours IST to 0830 hours IST of today. The western disturbance currently located over northeast Afghanistan is likely to approach northwest India during next 24 hours. Associated changes in wind pattern might cause a rise in the night minimum temperatures by 2-3 C over the plains of northwest India tomorrow. However, this could be short lived and the likely setting in of northwesterly winds may lead to further fall in minimum temperatures from 18th night. Dense fog, cold wave and ground frost are likely over parts of northwest India during next 3 days. Yesterday, Severe cold day conditions was observed at many places over Bihar; at a few places over East Uttar Pradesh and at isolated places over Tripura; cold day conditions at isolated places over West Bengal & Sikkim. Severe cold wave conditions observed at isolated places over Gangetic West Bengal and Cold wave conditions at isolated places over East Uttar Pradesh, Bihar, Jharkhand and Odisha. 18
27 Weather observations: This report provides the details of Rainfall recorded in last 24 hours and Maximum & Minimum Temperature Departures from Normal Temperature. Main weather observations Rainfall recorded (from 0830 hours IST of yesterday to 0830 hours IST of today): At a few places over Andaman & Nicobar Islands and at isolated places over Assam and Arunachal Pradesh. Amount of rainfall (1cm or more) are; Long-Islands-2 and Mayabander-1. Maximum temperature departures as on : Maximum temperatures were markedly above normal (5.1 C or more) at many places over Jammu & Kashmir; appreciably above normal (3.1 c to 5.0 c) at most places over West Rajasthan & Rayalaseema; at a few places over Coastal Andhra Pradesh & Telangana; above normal (1.6 C to 3.0 C) at most places over Punjab, Haryana, Chandigarh & Delhi, Saurashtra & Kutch, Vidarbha and Marathwada; at many places over Himachal Pradesh, East Rajasthan, Konkan & Goa and Jharkhand; at a few places over Madhya Pradesh, Gujarat Region, Madhya Maharashtra, Tamilnadu & Puducherry and Interior Karnataka; at isolated places over Assam & Meghalaya and Odisha. They were markedly below normal (-5.1 C or less) at most places over East Uttar Pradesh and Bihar; at a few places over West Uttar Pradesh; appreciably below normal (-3.1 c to -5.0 c) at many places over West Bengal & Sikkim; at isolated places over Nagaland, Manipur, Mizoram & Tripura. Yesterday, the lowest maximum temperature of 11.7 C was recorded at Gorakhpur (East Uttar Pradesh) in the plains of the country. Minimum temperature departures as on : Minimum temperatures are appreciably below normal (-3.1 C to -5.0 C) at most places over Jharkhand; at many paces over Gangetic West Bengal and Odisha; below normal (-1.6 C to -3.0 C) at many places over Punjab and East Madhya Pradesh; at a few places over Haryana, Chandigarh & Delhi and at isolated places over Rajasthan, Uttar Pradesh and Chhattisgarh. They are markedly above normal (5.1 C or more) at many places over Gujarat; at a few places over Madhya Maharashtra; appreciably above normal (3.1 C to 5.0 C) at many places over Konkan & Goa; above normal (1.6 C to 3.0 C) at most places over Jammu & Kashmir; at many places over Arunachal Pradesh, Assam & Meghalaya, Nagaland, Manipur, Mizoram & Tripura and Coastal Andhra Pradesh and at isolated places over Himachal Pradesh and near normal over rest parts of the country. The lowest minimum temperature of 0.0 C recorded at Sikar (East Rajasthan) in the plains of the country. 19


28 Meteorological analysis: This report is generated based on current set of observations taken from different weather stations. It provides the outlook of disturbances observed in weather condition. It is issued 4 times in a day. Weather forecast for next 5 days and subsequent 2 days: This report provides the weather forecast for Next 5 days and subsequent 2 days which include rainfall, significant changes in maximum & minimum temperature from normal temperature, fog and thunderstorm etc. 20
29 Weather warning for 5 days: This section of the report provides weather warning for heat wave, cold wave, fog, snowfall, rainfall etc. for next 5 days. Weather warning during next 5 days 16 January (Day 1): Dense to very dense fog at many places very likely over Bihar and Sub-Himalayan West Bengal; at a few places over Punjab, Haryana, Chandigarh & Uttar Pradesh and at isolated places over Uttarakhand, Coastal Andhra Pradesh, Nagaland, Manipur, Mizoram & Tripura; Dense fog at isolated places over Himachal Pradesh and Assam & Meghalaya, Cold Day to severe cold day conditions at many places very likely over Bihar; at isolated places over East Uttar Pradesh and West Bengal Cold wave conditions at isolated places very likely over Punjab, Himachal Pradesh, Uttarakhand, north Rajasthan, East Uttar Pradesh, Jharkhand, Bihar, interior Odisha. Ground frost conditions very likely at a few places over Jammu & Kashmir, Himachal Pradesh and Uttarakhand and at isolated places over East Uttar Pradesh and north Rajasthan. 17 January (Day 2): Dense to very dense fog at many places very likely over Bihar and Sub-Himalayan West Bengal; at a few places over Punjab, Haryana, Chandigarh & Uttar Pradesh and at isolated places over Uttarakhand,Nagaland, Manipur, Mizoram & Tripura; Dense fog at isolated places over Himachal Pradesh and Assam & Meghalaya and Coastal Andhra Pradesh Cold Day to severe cold day conditions at many places very likely over Bihar; at isolated places over East Uttar Pradesh, Sub-Himalayan West Bengal Cold wave conditions at isolated places very likely over Himachal Pradesh, Uttarakhand, Punjab, north Rajasthan East Uttar Pradesh, Jharkhand, Bihar, interior Odisha Ground frost conditions very likely at a few places over Jammu & Kashmir, Himachal Pradesh and Uttarakhand and at isolated places over East Uttar Pradesh and north Rajasthan. 18 January (Day 3): Dense to very dense fog at a few places very likely over East Uttar Pradesh, Bihar and Sub- Himalayan West Bengal; at isolated places over Uttrakhand and dense fog at isolated places over Assam & Meghalaya and Nagaland, Manipur, Mizoram & Tripura, West Uttar Pradesh, Himachal Pradesh and Punjab Cold Day to severe cold day conditions at a few places very likely over Bihar and at isolated places over East Uttar Pradesh Cold wave to severe cold wave conditions at a few places very likely over Punjab and north Rajasthan and at isolated places over Himachal Pradesh, Uttarakhand; Cold wave conditions very likely at isolated places over Jammu & Kashmir, Haryana, Chandigarh, Uttar Pradesh, Jharkhand, Bihar and interior Odisha Ground frost conditions very likely at a few places over Jammu & Kashmir, Himachal Pradesh and Uttarakhand and at isolated places over East Uttar Pradesh Punjab, Haryana and north Rajasthan. 19 January (Day 4): Dense to very dense fog at a few places very likely over Bihar and Sub-Himalayan West Bengal; at isolated places over East Uttar Pradesh Uttrakhand and dense fog at isolated places over Assam & Meghalaya and Nagaland, Manipur, Mizoram & Tripura, Cold Day to severe cold day conditions at a few places very likely over Bihar and at isolated places over East Uttar Pradesh Cold wave to severe cold wave conditions at a few places very likely over Punjab and north Rajasthan and at isolated places over Himachal Pradesh, Uttarakhand; Cold wave conditions very likely at isolated places over Jammu & Kashmir, Haryana, Chandigarh, Uttar Pradesh, Jharkhand, Bihar and interior Odisha Ground frost conditions very likely at a few places over Jammu & Kashmir, Himachal Pradesh and Uttarakhand and at isolated places over East Uttar Pradesh Punjab, Haryana and north Rajasthan. 20 January (Day 5): Dense to very dense fog at a few places very likely over Bihar and Sub-Himalayan West Bengal; at isolated places over East Uttar Pradesh Uttrakhand and dense fog at isolated places over Assam & Meghalaya and Nagaland, Manipur, Mizoram & Tripura. 21
 wise rainfall forecast for the next 5")
30 Met Sub division wise rainfall forecast: This section of the report provides Met Subdivision (State) wise rainfall forecast for the next 5 days. 22

31 Maximum and Minimum Temperature in last 24 hours: In this section of report maximum and minimum temperature in last 24 hours across the country are depicted. The colour code is used to distinguish the temperature from above the normal temperature or below the normal temperature. Above picture shows the Maximum Temp. in last 24 hours 23

32 Above picture shows the Minimum Temp. in last 24 hours 24
33 Departure of Maximum and Minimum Temperature from Normal Temperature: In this section of report departure of maximum and minimum temperature from normal temperature in last 24 hours across the country are depicted. The colour code is used to distinguish the departure from normal temperature. Above picture shows the departure from Maximum Temp. in last 24 hours. 25
34 Above picture shows the departure from Minimum Temp. in last 24 hours 26


35 4.3 All India Weather Warning It provides weather warning for the next 6 days with colour code.the different colour coding, symbol representation and sample warming are shown below: The symbol shown in above picure have following representation. The colours shown in above Image have following representation. This report is also updated 4 times in a day. Morning : 0800 hrs - 08:30 hrs Mid-day : 13:00 hrs - 13:30 hrs Evening : 16:00 hrs - 16:30 hrs Night : 20:00 hrs - 20:30 hrs 27
 and")
36 4.4 Nowcast Warning The current weather and forecasts upto a few hours ahead are given under Nowcast warning. The Nowcast warning is issued mainly for severe weather conditions such as squall, hailstorm and flash heavy rainfall for the next 2 to 3 hours based on WDSS II(Warning Decision Support System) and various DWR (Doppler weather Radar) product. This helps in estimating reduction in electricity demand in the concerned region. Warning Colours:- No Thunderstorm Moderate Thunderstorm Severe Thunderstorm Thunderstorm with Squall Thunderstorm with Hail 28
37 5. Satellite Background: Space technology can be utilised for many applications in Power Sector such as sedimentation study, siltation analysis, real time water level observation of rivers, mapping of transmission assets on GPS platform, pollution mapping, time synchronisation of information, real time weather observations, forecasting & disaster management. In real time grid management, system operators are utilising the Satellite images for monitoring of fog, thunderstorm, cyclone movement and its intensity. 5.1 Satellite Meteorology: Satellite meteorology refers to the study of earth's atmosphere and oceans using data obtained from Remote sensing devices flown on-board satellites orbiting the earth. Satellite makes measurements indirectly by sensing electromagnetic radiations coming from the earth surface. Types of Satellite: Two type of satellites are used for weather information: Geostationary Satellite: Satellites in this orbit are called geostationary because they are stationary with respect to the earth and appear to be fixed in the sky. It revolves around the earth at about km above the equator. Polar Orbiting Satellite: These satellites revolve around earth from pole to pole or in inclined plane to cover the area of interest or more area of the globe. It revolves around the earth at about 879 km above the earth. Satellite is the one of the most important tool to monitor the development, intensification and movement of Tropical Cyclone when it is in the deep sea. IMD monitors Tropical Cyclone through INSAT 3D, INSAT 3DR and Kalpana-1. The image is updated every 30 minutes. The upwelling radiation sensed by a satellite sensor is governed by emission from the earth's surface transmitted through the atmosphere and emission from the atmospheric layers transmitted through the outer layers of the atmosphere. INSAT-3D Imager: INSAT-3D carries a multi-spectral Imager (optical radiometer) capable of generating the images of the earth in six wavelength bands significant for meteorological observations, namely, visible, shortwave infrared, middle infrared, water vapour and two bands in thermal infrared regions, offering an improved 1 km resolution in the visible band for the monitoring 29
38 of mesoscale phenomena and severe local storms. The two new SWIR and MWIR bands with a resolution of 1 km and 4 km, respectively, enables better land-cloud discrimination and detection of surface features like snow image etc. Various bands and their specifications are enumerated below: Spectral Band Wave length Ground Resolution VIS (Visual) km SWIR (Shortwave Infrared) km MIR (Mid Infrared) km WVP (Water Vapour) km TIR 1 (Thermal Infrared 1) km TIR 2 ( Thermal Infrared 2) km The Imager generates images of the Earth disk from geostationary altitude of 36,000 km every 26 minutes and provides different types of Geophysical parameter products such as atmospheric motion vector winds, outgoing long wave radiation (OLR), upper troposphere humidity (UTH), sea surface temperature (SST), quantitative precipitation estimates (QPE), fire, smoke, fog, snow cover and aerosols. INSAT-3D carries a newly developed 19 channel sounder, which is a first such payload to be flown on an ISRO satellite mission. The Sounder has eighteen narrow spectral channels in shortwave infrared, middle infrared and long wave infrared regions and one channel in the visible region. The ground resolution at nadir is nominally 10 x 10 km for all nineteen channels. The specification of Sounder is as follows. Spectral Band Spectral Range Microns Ground Resolution VISIBLE km x 10 km SWIR km x 10 km MIR km x 10 km LWIR km x 10 km 30
39 Geophysical parameters available from Sounder are temperature, humidity profile and ozone, layer perceptible water, total perceptible water, lifted index, wind index etc. These profiles are available for a selected region over Indian landmass on an hourly basis and for the entire Indian Ocean Region on a six hourly basis. 5.2 Visible Imagery: The visible channel of the satellite measures light using the same wavelengths as visible to the human eye. In other words, looking at a visible satellite picture is the same as if an astronaut took a photo of the clouds. Objects with higher albedo (ability to reflect sunlight) appear brighter on the satellite image. Objects with lower albedo appear dark on the satellite image. Cloud free land and water will typically be dark while clouds and snow appear bright. Thicker clouds have a higher reflectivity and appear brighter than thinner clouds. However, it is difficult to distinguish among low and high level clouds in a visible satellite image. Visible satellite image is available only during the day time. Visible Satellite images can be utilized for snow cover, fog, thunderstorms etc. 5.3 Infrared Satellite Image: Infrared satellite measures radiation output from the earth into space. In other words, it measures temperature and one can infer clouds based on the different temperatures being measured. The colder an item is, such as a high cloud or a cold air mass, the brighter it is. The warmer an item is, such as a warm lake or clouds near the ground, the darker it is. It can be used for Night time satellite pictures, cyclone development, fog etc. Most of the derived products are obtained from IR image. 31


40 Typical sattelite Imageries in different stages of cyclone Phalin 32
.")
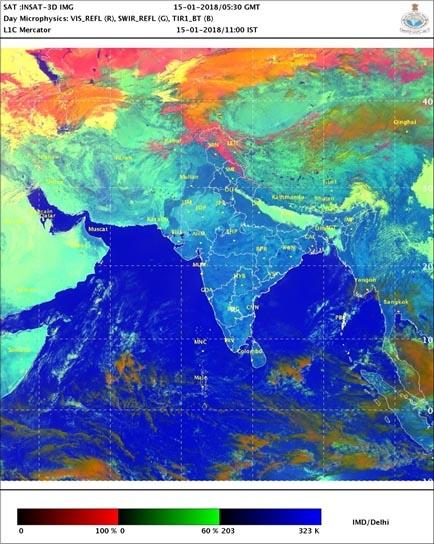
41 5.4 SWIR (Shortwave Infra-Red images): Sensing in the shortwave infrared (SWIR) range (wavelengths from 0.9 to 1.7 microns) provides good picture of low clouds and fog. It is available during day time only. FOG 5.5 Colour Composite Imagery: RGB composite images are produced by composing satellite images coloured in Red, Green and Blue (RGB). Two application specific RGB products Day Microphysics RGB, Night Microphysics RGB are generated by IMD by using data from INSAT-3D Imager. a) Day Microphysics RGB Imagery Channel combination recipe of the Day Microphysics RGB RED beam - The visible reflectance at 0.64 µm approximates the cloud optical depth (thickness) and amount of cloud water and ice. Typically, water cloud is more reflective than ice cloud and thus will have a stronger red beam component. This channel also gives information about the surface of the earth. GREEN beam The 1.67 μm SWIR (shortwave infrared) solar reflectance gives a qualitative measure of cloud particle size and phase. Typically smaller water droplets or small ice particles have a higher reflectivity, resulting in a stronger green beam component. A sandy earth surface also has a strong reflectance in this channel. 33
42 BLUE beam - The 10.8 μm TIR1 brightness temperature is a function of surface and cloud top brightness temperature (BT). The scaling for this beam results in a strong blue beam component for warm surfaces, whereas cold cloud tops will not have any contribution in this beam. This colour scheme is useful for cloud analysis, convection, fog, snow and fire. Day time microphysics RGB scheme: Beam Channel Range Red VIS (0.55to 0.75) 0 to +100% Green SWIR (1.67 um) 0 to +60% Blue IR (10.8 um) +203 to 323degree Kelvin This product is used during the daytime because a solar reflectance component is adopted. Day time fog can be viewed and analysed by visible imagery, SWIR imagery, Day-time Microphysics RGB Imagery. Fog will have a sharp boundary, while low clouds will have disperse boundary. In animation fog will remain stationary while low clouds will show some movement. In day time micro physics RGB imagery low clouds, medium clouds, snow and dust would look as follows: FOG LOW CLOUDS (Nearest to Satellite) MID LEVEL ORGAPHIC CLOUD CB CELL (Developed cloud) SNOW SAND /DUST 34
43 Sample day time microphysics RGB image : b) Night-time Microphysics RGB Imagery : The Night Microphysics RGB product is designed and tuned for monitoring the evolution of night time fog and stratus clouds. Other secondary applications include detecting fires, classification of clouds in general, snow and low-level moisture boundaries. The distinction between low clouds and fog is often a challenge. While the difference in the TIR1 10.8µm and MIR 3.9µm channels is applied to meet this challenge, the Night time Microphysics RGB adds TIR2 12.0µm channel difference to indicate cloud thickness and enhance areas of warm clouds where fog is more likely. 35
44 Channel combination recipe of the Night Microphysics RGB RED beam: This channel gives an indication of optical depth. It uses TIR2 TIR1. There is a strong signal in this beam for thick clouds. For thin meteorological cloud there is greater absorption by the "dirty window" 12 µm channel. In addition the 12 µm radiations are absorbed more strongly in ice phase cloud compared to water phase clouds. GREEN beam: This channel is used in fog/low clouds detection method. It uses TIR1 MIR. The 3.9 µm radiation has lower emissivity compared to the 10.8 µm radiation for small water droplet clouds. Therefore there is a large contribution to the green beam in this RGB product for water clouds with small droplets. There is also a significant contribution from desert surfaces. BLUE beam: The 10.8 µm infrared brightness temperature is a function of surface and cloud top temperatures. The scaling for this beam results in a strong blue beam component for warm surfaces. Night-time microphysics RGB scheme Beam Channel Range Red IR12.0 µm - IR10.8 µm(tir2) K Green Green IR10.8 µm - IR3.9 µm (TIR1-MIR) K Blue IR10.8 µm (TIR1) K Fog can also be detected through Night-time Microphysics RGB Imagery. Fog and low clouds in warm climates tend to have aqua or light blue areas in the RGB. This appears very light green in colder climates because the 10.8 µm thermal channel used for the blue band contributes less. The 3.9 µm channel is subject to noise at very cold temperatures. Fog at high latitudes in winter may have noise in the pixels representing fog. Similarly, the depiction of very high, cold clouds (i.e. cumulonimbus tops) will have yellow pixels mixed in areas of dark red for this RGB due to the 3.9 µm channel noise at such temperatures. 36
 MID LEVEL ORGAPHIC CLOUD CB CELL (Developed cloud) SNOW SAND /DUST Sample night time microphysics RGB image: Fog")
45 In night time microphysics RGB imagery, Low clouds, medium clouds, Snow and dust would look as follows : FOG LOW CLOUDS (Nearest to Satellite) MID LEVEL ORGAPHIC CLOUD CB CELL (Developed cloud) SNOW SAND /DUST Sample night time microphysics RGB image: Fog 37
, ISRO in consultation with India Meteorological Department (IMD), New Delhi to enhance the visualization and analysis")
46 5.6 RAPID Real time Analysis of Products and Information Dissemination is a web based quick visualization and analysis tool for satellite data on a real time basis. This tool was conceptualized and developed by Satellite Application Centre (SAC), ISRO in consultation with India Meteorological Department (IMD), New Delhi to enhance the visualization and analysis of INSAT Meteorological Satellite data on real time basis by the forecasting community. Using RAPID one can interact like actual satellite workstation and may zoom to any actual resolution. Data Selection Pane: This is the area where the user can select the data that is to be visualized. This has 4 main options viz. satellite data, ground data, base layers and vector. Using data selection pane and data viewer pane different Geo-Physical Parameters (GPR) derived from INSAT-3D Imager, INSTAT -3D Sounder. KALPANA-1 VHRR and INSAT -3D, IMD Nowcast can be selected and analysed such as Day Microphysics, Night Microphysics, Outgoing Long Wave Radiation, Upper Troposphere Humidity, Sea Surface Temperature, Land Surface Temperature(LST- satellite derived).imsra (INSAT Multi-Spectral Rainfall Algorithm ), Global Precipitation Index (GPI), Aerosol Optical Depth(AOD), Snow, Lifted Index etc. Full Disk: Shows the full disk scan image of the sensor of the satellite. Sector: Shows India and adjacent portion. 38


47 RGB Composite: This product would be useful for the system operator to see the past satellite images to estimate the movement of clouds, fog formation etc. To analyse RGB composite following selection is to be made: IN SAT Option In Products In layer drop box Time zone : INSAT 3D Imager : RGB Composite : Select either Day Microphysics or Night Microphysics : Asia/Calcutta In animation control select number of frames and then run the program. The RAPID software will play the selected number of frames. The operator can visualise the movement of clouds, cyclone, fog formation etc. using this feature. 39
48 (i) If Day-time Microphysics RGB is viewed and analysed through RAPID, the fog pixels value lies in the following range: VIS albedo 25 to 50 % SWIR albedo 35 to 60% TIR degree Kelvin to 290 degree Kelvin (ii) If Day-time Microphysics RGB is viewed and analysed through RAPID, the low clouds pixels value lies in the following range : VIS albedo 30% to 45% SWIR albedo 40% to 60% TIR degree Kelvin to 270 degree Kelvin (iii) If Day-time Microphysics RGB is viewed and analysed through RAPID, the mid level orgaphic cloud pixels value lies in the following range : VIS albedo 30% to 50% SWIR albedo 40% to 60% TIR degree Kelvin to 260 degree Kelvin (iv) If Day-time Microphysics RGB is viewed and analysed through RAPID, the developed cloud (which can bear rain) pixels values lies in the following range: VIS albedo >50 % SWIR albedo <25% TIR 1 < 245 degree Kelvin 40
49 (v) If Day-time Microphysics RGB is viewed and analysed through RAPID, the snow pixels value lies in the following range : VIS albedo >35% SWIR albedo <20% TIR degree Kelvin to 280 degree Kelvin (vi) If Day-time Microphysics: RGB is viewed and analysed through RAPID, the sand/dust pixels values lies in the following range: Sand Dust VIS albedo 20% to 30% 20 to 30% SWIR albedo 40 % to 70% 30% to 40% TIR degree Kelvin 290 degree Kelvin to to 295 degree 320 degree Kelvin Kelvin 41


50 Visualisation of fog, snow, low cloud, medium cloud and devloped cloud on day time Microphysics RGB image using probe in RAPID : FOG 42
51 (i) If Night-time Microphysics RGB is viewed and analysed through RAPID, the fog pixels value lies in the following range: TR2BT-TR1BT Negative TR!BT-MIRBT >2.5 degree Kelvin 270 degree Kelvin to 290 TR1BT degree Kelvin (ii) If Night-time Microphysics RGB is viewed and analysed through RAPID, the low clouds pixels value lies in the following range: TR2BT-TR1BT TR!BT-MIRBT TR1BT Positive Positive 250 degree Kelvin to 265 degree Kelvin (iii) If Night-time Microphysics RGB is viewed and analysed through RAPID, the mid level clouds pixels value lies in the following range: TR2BT-TR1BT TR!BT-MIRBT TR1BT Positive Positive 245 degree Kelvin to 260 degree Kelvin (iv) If Night-time Microphysics RGB is viewed and analysed through RAPID, the developed Cloud pixels value lies in the following range: TR2BT-TR1BT TR!BT-MIRBT TR1BT Positive Negative <245 degree Kelvin 43
52 (v) If Night-time Microphysics RGB is viewed and analysed through RAPID, the snow pixels value lies in the following range: TR2BT-TR1BT TR!BT-MIRBT TR1BT Negative Negative 260 degree Kelvin to 290 degree Kelvin (vi) If Night-time Microphysics RGB is viewed and analysed through RAPID, the sand/dust pixels value lies in the following range: Sand Dust TR2BT-TR1BT Negative Negative TR!BT-MIRBT Negative Negative TR1BT 280 degree to 290 degree Kelvin 275 degree to 285 degree Kelvin 44
: This forecast is being issued based on different types of chart analysis (surface chart, upper air chart and change chart), monitoring of")
53 6. Region Specific Products 6.1 Regional Weather Summary (Outlook for the next few days): This forecast is being issued based on different types of chart analysis (surface chart, upper air chart and change chart), monitoring of satellite picture and with running of Numerical Weather Prediction (NWP) model. This section contains regional weather inference, expected change in temperature for the next 48 hours, Met Subdivision wise (State) rainfall forecast for the next 5 days and weather warning for heavy rainfall, fog, thunderstorm etc. It is updated 4 times in a day. The sample image of the regional weather summary is shown below: 45
 and forecast for next 7 days.")
54 6.2 Station/City wise local Weather Report and Forecast Local weather report and forecast are available for important cities The city weather report consists of last 24 hours weather data (maximum/minimum temperature, departure from normal, rainfall, humidity, sunrise/moonrise and sunset/moonset time ) and forecast for next 7 days. It is valid for a radius of 50 KM and is updated 4 times in a day. City wise local report and forecast have been mapped to the nearest electrical stations/power stations in each States. 46
55 7. Doppler Weather Radar (DWR) DWR is the best tool for Now casting. DWR is used to track Tropical Cyclone when it comes under DWR ranges. Thunderstorms/squalls are also tracked/forecasted by DWR. Radar transmitter transmits electromagnetic waves through a directional antenna in any given direction. Part of energy is absorbed by the atmosphere and fraction of it is scattered back by the targets and is received by the receiver. The received power depends upon the transmitted power, wavelength, vertical and horizontal beam width, scattering cross section of targets (rain drops, snow, hail etc.). Reflectivity is a measure of water content in the cloud. Return power provides information about weather intensity and azimuth and elevation of antenna gives location and height of cloud, time taken by electromagnetic waves in to and fro Journey gives range of the target. Doppler Weather Radar employs doppler principle to provide speed and direction of the targets. (When the source for signals and observers are in relative motion then there is change in frequency observed by the observer In case the source and the observer are moving closer, frequency increases and Vice Versa) Reflectivity: Reflectivity" is the amount of transmitted power returned to the radar receiver. The colours on the legend are the different echo intensities (reflectivity) measured in dbz, typically, light rain is occurring when the dbz value reaches in between dbz, dbz moderate rain, dbz moderate to heavy rain, dbz heavy rain.hail is a good reflector of energy and will return very high dbz values i.e more than 55 dbz. The Doppler Weather Radar generates Six (6) different displays and derived products of practical utility based on standard algorithms. Presently IMD radar at Mausam Bhawan has following elevation for scanning -0.5 degree, 1.0 degree, 2.0 degree, 3.0 degree, 6.0 degree, 9.0 degree, 12.0 degree, 16.0 degree & 21.0 degree. Radar completes the process of scanning with all these elevation and sends the data within 10 minutes. These displays are updated at every 10 minutes. The location and range of Radars are given below: 47
56 Region No. of Radars Location Range (KM) 250 km Northern Delhi, Lucknow, Patiala, except 5 Region Srinagar and Jaipur Srinagar (100 km ) Eastern Region 4 Kolkata,Patna &Paradip,Gopalpur 250 km Western Region 5 Mumbai, Goa,Nagpur,Bhopal, Bhuj 250 km Chennai,Hyderabad,Kochi,Karaikal, Southern 7 Machilipatnam,Vishakhapatnam, Region Thiruvananthapuram 250 km North Eastern Region 2 Agartala & Mohanbari 250 km The Different Products of DWR are detailed below: (a) Plan Position Indicator (PPI) : A constant elevation surface data is presented as a cloud image around the Radar station. The data depicted is on the slant range depending on the elevation angle (generally 0.5 degree). 48
 Plan Position Indicator (Max-Z) : This product is used to see both")
57 The interpretation of colour in the image can be derived from reflectivity scale shown in the image. Light rain : 20-35dBZ Moderate rain : 35-40dBZ Moderate to heavy rain : 40-50dBZ Heavy rain : 50-55dBZ Hail : more than 55 dbz (b) Plan Position Indicator (Max-Z) : This product is used to see both the intensity of cloud as well as height of the cloud. According to colour of cloud in radar Image the reflectivity value can be estimated from the reflectivity scale. Its maximum range is 250 km. A display of cloud is generated for the range on the X-axis and height of the cloud surface on Y-axis. 49
 Plan Position Indicator (Mean Velocity m/s) : Indicate the mean")
58 The interpretation of colour in the image can be derived from reflectivity scale shown in the image. Light rain : 20-35dBZ Moderate rain : 35-40dBZ Moderate to heavy rain : 40-50dBZ Heavy rain : 50-55dBZ Hail : more than 55 dbz (c) Plan Position Indicator (Mean Velocity m/s) : Indicate the mean velocity of cloud and its direction. Cloud moving towards Radar (-ve Mean Velocity), moving away from Radar (+ve Mean Velocity). The mean velocity of cloud can be estimated from the corresponding colour code shown in the scale. 50


59 Cloud moving away from Radar +ve Mean Velocity Cloud moving towards Radar -ve Mean Velocity (d) Surface Rainfall Intensity (mm/hr) : The SRI gives an image of the rainfall intensity at surface layer with constant height above the ground. It is calculated based on Marshall-Palmer equation Z=ARb where R is the rainfall intensity and A and b are constants. The value of A & b varies from season to season and from place to place. The rainfall intensity can be estimated from the corresponding colour code shown in the scale. 51
 for the defined time period.")
60 (e) Precipitation Accumulation (mm): The PAC product is a second level product. It takes SRI products of the same type as input. The display shows the colour coded rainfall amount in (mm) for the defined time period. Precipitation accumulation estimation by the Radar can be useful to work out water inflow in catchment area of Rivers, flood forecasting in the absence of conventional rain gauge network. Presently it takes SRI products and accumulates the rainfall at a time period of 24 hours. 52

61 (f) Volume Velocity Processing: This displays the wind velocity and wind direction in a vertical column above the Radar site. Wind speed and direction are calculated at different vertical layers and are displayed in the form wind barbs. Reading Wind barbs: The tail of the barb indicates direction Wind Direction and Speed of the Wind N 10 Knot Barb 5 Knot Barb W E S Indicates Direction 50 knot Symbol Conversion formula for Knot to Meter per second= Knot x0.51= m/s 53
62 Use of RADAR Products for System Operation : (a) Identifying distance and height of clouds (km) (b) Movement of clouds /thunderstorm/rains (c) Location of rainfall and its intensity in mm/this would help in assessing the impact and advance control measures required to maintain the Grid security. (d) Total rainfall in mm in the last 24 hours (mm) Assessment of demand in next 24 hours To estimate precipitation in the catchment area of rivers (e) Wind speed and direction at the location of Radar (Knots) Load reduction due to factors, like, switching off of distribution lines to prevent collateral damage/distribution network outage. Limitation in Measurement of Rainfall by Radar: The Radar beam width and thus the sampling volume increases with range, Therefore Radar resolution at long distances are poorer. Sea-Clutter: Sea Clutter are disturbing Radar-echoes of sea wave crests Attenuation of Radar beam: The attenuation of Radar beam by rain at close distances may obscure precipitating echo at long ranges. The stronger echo at long distance may appear weak. Also, the precipitation area observed by the radar may be less than actual. Obstruction of Radar beam: If the beam is obstructed by manmade and natural objects (buildings, tress, hills etc,), the radar will not be able to probe beyond the range of obstruction. If the beam is partially blocked, observations will not be true representative of the area. The abbreviation of city codes (city Name) on Radar image is enclosed as Annexure-II 54
63 8. Meteogram The Meteogram available at Weather Portal provide plots of Meteorological variables such as rainfall, cloud cover, temperature, humidity, wind speed, sea level pressure, indices for thunderstorm etc. for 10 days with a resolution time of three hours. Each Meteogram provides the information for the area of 10 km radius. It updates at 00:00 hrs UTC (05:30 AM, IST) and 12:00 hrs UTC (05:30 PM, IST). Region wise list of available Meteogram locations are given below: Region Total no. of locations Northern Region 117 North Eastern Region 33 State wise locations UP-39,Uttarakhand-14, Punjab & HP -10, Chandigarh- 1,Rajasthan-29,Delhi-2, Haryana-5, Jammu and Kashmir-7 Assam-10,Arunachal Pradesh-4, Nagaland & Meghalaya-1, Tripura-2, Manipur & Mizoram-1 Western Region 115 Maharastra-40, MP-35, Gujrat-35, Chattisgarh-8, Goa-3 Southern Region 101 Eastern Region 69 Tamilnadu-32, Andhra Pradesh -24, Karnataka-32, Telangana-10,Kerala-9, Lakshdweep-4 West Bengal-24, Oddisa-20,Bihar-15, Jharkhand-9, Sikkim-1 List of various parameters available in a Meteogram is given below: A. Conditions for the lower troposphere (up to 500 millibars) B mb Thickness C. Sea Level Pressure D. Stability Indices E. Wind at 10 meter Height F. 2-meter Temperatures G. Relative Humidity 2-Meter Height H. Cloud Cover I. Precipitation 55

64 The Sample Meteogram picture and details of various parameters are given below: A B/C D E F G H I 56
 The unit is m/s. The speed can be calculated by counting the barbs.")
65 A. Conditions for the lower troposphere (up to 500 millibars) (Wind,Temperatures and Relative humidity) are shown in the profile: Wind (i) The barbs indicate the direction and speed of the wind, rounded to the nearest 5. (ii) The unit is m/s. The speed can be calculated by counting the barbs. (Full barb =10 Knots, Short barb=5 Knots, Pennant=50 Knots) Temperature (i) The coloured contours indicate the profile of temperature. (ii) The unit is C. (iii) The freezing level (32 F or 0 C) is indicated by the double black line labelled FR. Relative Humidity (i) The graduated green shading indicates relative humidity. (ii) The unit is percent. B mb Thickness : It is the vertical distance between two pressure levels. In general the distance will be a function of the density of the air between the two pressures levels, which is directly related to the temperature of the air. Thus, thickness is a good indicator of the mean temperature in the layer of 57
66 atmosphere between the two levels. Greater thickness indicates warmer air. The units are dekameter (1 deka meter=10 meter, 10 meter is about 33 feet). One rule of thumb is that if the thickness of this layer is less than 540 dm, then any precipitation will be in the form of snow. C. Sea Level Pressure: Sea level pressure (SLP) is the surface pressure interpolated down to sea level from the altitude of the grid box of the model. This corresponds to the barometric pressure one hears reported on local radio or TV weather reports. The blue line indicates SLP. The unit is millibar. Valleys in SLP often indicate frontal passages and often coincide with pronounced changes in wind direction, temperatures and humidity. In subtropical regions (the deserts of the Southwest and much of the Sunbelt during summer) the SLP often oscillates daily with a peak in the early morning and a trough during mid-afternoon. D. Stability Indices : The stability indices are measure of the potential for strong or severe weather. The indices shown here are the Lifted Index (LI) and the Convective Available Potential Energy (CAPE). Lifted Index: The LI, indicated by the red line is a measure of the thunderstorm potential. i) LI values greater than 0 indicates that thunderstorms are unlikely. ii) LI values between 0 and -2indicates that thunderstorms are possible with good trigger. iii) LI values between -3 and -5 indicates that thunderstorms are probable. iv) LI values less than -5 indicates a strong potential of severe thunderstorms. 58
67 CAPE (Convective Available Potential Energy) : The purple bars indicate the CAPE value at the surface in units of J/kg. CAPE is a measure of the buoyancy of a layer. The larger the CAPE, the greater the potential for severe weather. Any value greater than 1000 J/kg indicates instability and the possibility of thunderstorms. The base line for the bar graph of CAPE is 0(zero). E. Wind at 10 meter Height : 10-Meter Winds (about 33 feet above the ground) correspond to typically measured winds at weather stations. The yellow line indicates wind speed. The unit is in m/s. F. 2-meter Temperatures: Air temperature and dew point temperature are given at the 2-meter level (6½ feet above ground). The dew point temperature is the temperature that a sample of air would have if it were cooled (at constant pressure) until it reached saturation. The dew point temperature is an alternative way to describe the amount of moisture or humidity in the air. If the dew-point temperature is close to the air temperature, the relative humidity is high and if the dew point is well below the air temperature, the relative humidity is low. Air temperature is indicated by the red line (with colour shading below the line to aid interpretation). Dew point temperature is indicated by the grey line. The unit of Temperature is Degree Celsius. The freezing level is drawn with a dot-dashed black line. Temperatures at the specified times are given, so low and high temperatures may fall between the hours specified, and thus exceed the range shown. 59
68 G. Relative Humidity 2-Meter Height : The green line and graduated green shading indicates relative humidity at 2 meter height. The units are percent. H. Cloud Cover: Clouds are aggregate of very small water droplets, ice crystals or a mixture of both with its base above the earth s surface. A classification is made in level high, medium or low at which the various cloud genera are usually encountered. In temperate regions, the approximate limits are high, 5-13 km ( ft); medium, 2-7 km ( ft); low, 0-2 km ( ft). As shown in picture above the panel has a blue background to show the cloud-free areas. The panel is divided into three horizontal layers for the display of low, middle, and high cloud cover, which are drawn as white bars. If the white bar covers the full height of its layer, that is 100% cloudiness. Cloud cover is measured in Octa. In meteorology, an octa is a unit of measurement used to describe the amount of cloud cover at any given location such as a weather station. Sky conditions are estimated in terms of how many eighths of the sky are covered in cloud, ranging from 0 octa (completely clear sky) through to 8 octa (completely overcast). 60

69 Clear sky Mainly clear Partly cloudy Generally cloudy Cloudy Overcast sky 0 Octa 1-2 Octa of Sky covered 3-4 Octa of Sky covered 5-7 Octa of Sky covered >7 Octa of Sky covered Sky completely covered by cloud I. Precipitation: The bar graph as shown in image below indicates predicted precipitation types and amounts. Precipitation Type: The colour indicates the type of precipitation, rain, sleet, snow or ice pellets. Narrow red bars within the other bars indicate the portion of precipitation likely to come from convection (showers and thunderstorms). The unit is in millimetre. At the right end corner it shows the total rainfall for the next 10 days in mm. The state wise Meteogram can be visualised by clicking of Meteogram tab on Regional Weather Portal. 61

70 The Meteogram graphs of any location in the country can be viewed by clicking on all India Meteogram tab on the home page of Weather Portal. 62

71 8.1 GFS model for rainfall forecast: It provides daily rainfall forecast for 10 days based on current day observations. This is an effective visualisation based planning tool available with system operators. 63
72 9. METAR (Meteorological Terminal Aviation Routine Weather Report) METAR is scheduled observation taken at the end of each hour/half hour at important airports. METAR is a format for reporting weather information. A METAR weather report is predominantly used by pilots for fulfilment of a part of a pre-flight weather briefing and by meteorologists, who use aggregated METAR information to assist in weather forecasting. METAR is the scheduled observation taken at the end of each hour/half hour at important airports. A typical METAR contains data for the temperature, dew point, wind direction and speed, precipitation, cloud cover and height, visibility and barometric pressure. A METAR may also contain information on precipitation amounts, lightning, and other information that would be of interest to pilots or meteorologists. The visibility at an airport can provide a good idea about status of fog/smog. Decoding a typical METAR: Sample METAR Code: VIDP Z 09006KT 2500 HZ FEW 030 SCT /11 Q1009 NOSIG VIDP: Station Code (IGI New Delhi ) Z: Date and Time in UTC (Z) i.e. Date 09 th, Time 17: KT: Speed of wind in Knots 2500 HZ: Visibility 2500 meter (Haze) {Most important for system operators for estimating fog at a particular location} FEW 030 SCT 100: Few clouds at 3000 meter and scattered cloud at a height of meter 17/11: Air Temperature is 17 degree and dew point temperature is 11 degree Q1009: Pressure in hpa NOSIG: No significant change is expected in the reported conditions for next two hours. Abbreviations used in METAR code is enclosed at Annexure-I 64
 Bay Bulletin: This is issued in Eastern Region and Western Region.This part contains two type of bulletin. Sea Area Bulletin: It contains information regarding visibility and wind over sea area.")
73 10. Region Specific Forecast (i) Fog Forecast: Fog Forecast is issued from five airports of the Northern Region.it gives the outlook of fog for the first 6 hours and also for the subsequent 12 hrs. (ii) Bay Bulletin: This is issued in Eastern Region and Western Region.This part contains two type of bulletin. Sea Area Bulletin: It contains information regarding visibility and wind over sea area. 65
74 66
75 Coastal Area Bulletin: This contains information regarding visibility, wind, weather, sea condition and port warning. 67

76 (iii) Cyclone Alert: Cyclones are intense low pressure areas - from the center of which pressure increases outwards. The amount of the pressure drop in the center and the rate at which it increases outwards gives the intensity of the cyclones and the strength of winds. Tropical cyclones are warm core low pressure systems having a large vortex in the atmosphere, which is maintained by the release of latent heat by convective clouds that form over warm oceans. In the northern hemisphere, the winds in a cyclone blow anticlockwise in the lower troposphere and clockwise in the upper troposphere. However, in the southern hemisphere, the winds of the cyclone blow in the opposite direction i.e. clockwise in the lower levels and anticlockwise in the upper levels. A full-grown cyclone is a violent whirl in the atmosphere with 150 to 1000 km diameter and 10 to 15 km height. Gale winds of 150 to 250 kmph or more spiral around the center of very low pressure area with 30 to 100 hpa below the normal sea level pressure. In a fully developed cyclonic storm, there are four major components of horizontal structure viz. eye, wall cloud region, rain/spiral bands and outer storm area. A schematic diagram is given below: Eye Eye-wall Spiral Cloud bands Convective Cells The most spectacular part of a matured cyclonic storm is its eye, which forms at the centre of the storm inside a Central Dense Overcast (CDO) region. The eye has a diameter of about 10 to 50 km, which is generally cloud free and is surrounded by thick wall clouds around it. The eye is surrounded by a km thick wall of convective clouds where the maximum 68
77 winds occur. This is the most dangerous part of a cyclonic storm. The height of the wall goes up to 10 to 15 km. The intense convection in this wall cloud region produces torrential rain, sometimes of the order of 50 cm in 24 hrs. Beyond the eye wall region, the major convective clouds in a cyclonic storm, responsible for heavy rains, have a spirally banded structure. These spiral bands are sometimes hundreds of kilometres long and a few kilometres wide. The spiral bands are easily identifiable in radar and satellite pictures, as a number of thunderstorm cells (Cumulonimbus clouds) are embedded in them that produce heavy rainfall (typical rate 3 cm/hr, which in extreme cases may reach upto 10 cm/hr). There are four stages of Cyclone Warning Pre Cyclone Watch: This is issued to Cabinet Secretary and other senior officials indicating formation of a cyclonic disturbance having potential to intensify into tropical cyclone and the coastal belt likely to be affected. Cyclone Alert: The alert issued at least 48 hours in advance indicating expected adverse weather conditions. Cyclone Warning: The warning is issued at least 24 hours in advance indicating latest position of tropical cyclone, intensity, time and point of landfall, storm surge height, type of damages expected and actions suggested. Post landfall Outlook: This is issued about 12 hours before the landfall and till cyclone force wind prevails. District collectors of interior districts besides the coastal area are also informed. Finally a De-warning message is issued when the tropical cyclone weakens into depression stage. The average life span of a cyclonic storm is about 4 to 5 days. 69
78 Cyclone intensity and damage expected to power system and communication lines: Intensity Damage Expected to Power and Communication Lines Deep Depression (52-62 km/hr) Nil Cyclone Storm (63-87 km/hr) Sever Cyclone Storm ( km/hr) Very Severe Cyclonic Storm ( km/hr) Super Cyclone (222 km/hr and above) Minor Minor Large scale disruption of power and communication lines Total disruption of power and communication lines (iv) Port Warning: The India Meteorological Department (through the area cyclone warning centres (ACWCs)/ cyclone warning centres (CWCs) maintains a port warning service by which the port officers are warned by high priority telegrams about disturbed weather likely to affect their ports. On receipt of the warning telegrams from the ACWC/CWC, the port officers hoist appropriate visual signals prominently on signal masts so that they are visible from a distance. Mariners and other sea-faring people, including fishermen who may not be literate, are generally aware of the meaning of these signals and the port authorities are always ready to explain them whenever necessary. At some ports, the meanings of the signals are displayed in English as well as in the local languages prominently on a notice board. While the India meteorological department is responsible for issuing the warnings, the port authorities arrange the display of signals. In addition to hoisting the signals, the port officers have, in most cases, make arrangements for disseminating the warnings received by them, to country craft and sailing vessels in the harbours. (v) Forecast for Andaman and Nicobar islands: This forecast is issued in Eastern Region. The forecast provides district level weather forecast (Rainfall) and weather warning for rain, squall and thunder squall for Andaman and Nicobar islands. 70

79 11. LAUNCH OF WEATHER PORTAL The Weather Portal for Power Sector was launched by Shri Piyush Goyal Union Minister of State (IC) for Power, Coal, and New& Renewable Energy on 23 rd June 2017: Press Coverage: Press Information Bureau Government of India Ministry of Power 23-June :05 IST Shri Piyush Goyal launches POSOCO-IMD Weather Portal for Power Sector Shri Piyush Goyal Union Minister of State (IC) for Power, Coal, New & Renewable Energy and Mines launched Weather Portal for Power Sector in association with POSOCO and IMD at the meeting of the Forum of Regulators here today. 71
80 Day to day weather variations have an impact on load demand and energy production, transport and distribution management, as well as energy prices. Extreme events such as heat waves or cold waves, wind storms or floods can of course have dramatic consequences on the production means or the electrical grid of a country including physical damage to the infrastructure. The information available in the portal regarding weather forecast shall help state discoms to take pro-active steps regarding short term and medium term management processes and supply planning requirements and also for better planning for infrastructure availability to ensure cost effective and reliable supply. 72
81 12. Workshops and Other Initiatives A. Workshops: Workshop on Deployment of Meteorological data in Power Sector was carried out in all Regions as per the following schedule. Northern Region : 15 th September 2015 Southern Region : 31 st July 2015 & 27 th October 2015 (at RMC Chennai) Western Region : 24 th August 2015 Eastern Region : 6 th November 2015 North Eastern Region : 12 th September 2015 Representatives from central and state sector power utilities participated in the Workshops. B. Presentation on the weather portal was delivered in the 19 th meeting of FOLD (Forum of Load Dispatchers) on 12 th June 2017 held at NRLDC, New Delhi. C. Presentation on the weather portal was delivered in the OCC meetings and special meetings taken by Central Electricity Authority (CEA) on renewable integration. D. A weather group (weather_power@googlegroups.com) for power sector has been created for sharing weather warnings and other important developments in weather. E. Meteogram data such as rainfall (mm), dew point temperature, maximum and minimum temperature (degree C), humidity (%), wind speed at 10 meter height (m/s), cloud cover (%) (low, medium and high) and indices for thunderstorm (J/Kg) for more 400 locations have been made available to the system operators across the country. The available data is for 10 days with a resolution time of 3 hours 73
 etc.")
82 13. Experience so far All the RLDCs, NLDC and constituents have started using the products / features available on the weather Portal on regular basis. The forecast available at the portal helps constituents to take proactive steps such as demand estimation, decisions on STOA (Short Term Open Access) etc. The near real time information available from Radar and Satellite help system operators to take real time decisions related to Grid operation. Northern Region Uttar Pradesh: (i) Meteogram, wind and rain forecast for 27/28/ helped in better load assessment of UP control area by U.P. State Load Despatch Centre. As anticipated, UP demand went down from MW to MW due to change in weather conditions. Accordingly STOA & purchase from power exchange of the order of 2000 MW was reduced i.e. backing down of approximately 13 MU of costly thermal generation. Total Power Exchange & Bilateral /5/ /5/ /5/ /5/ /5/ /5/ /5/
83 (ii) Meteogram, wind and rain forecast for 21 to 24 September, 2017 helped in load assessment and demand forecast of UP control area. It has reduced demand from to MW accordingly STOA from IEX and bilateral/banking of about 2000 MW was not scheduled. Approximately 17MU direct purchase from IEX and thermal backing of costly power station were carried out. In real time operation, it was also helpful in managing over drawl/under drawl quickly. (iii) BRPL (BSES Rajdhani Power Ltd): The Delhi s Discom BRPL has managed to take proactive action to manage its drawl from the grid and purchases from power exchange/bilateral contracts. The discom has made savings by utilising weather portal. BRPL has used meteogram to predict the increasing temperature and therefore increase in demand, based on which requests were made to SLDC Delhi to bring on bar additional units. This also helped in following merit order despatch, by avoiding costly power exchange purchases during peak summer. In addition to meteogram, live radar imagery helped sending in timely revision for backing down of generating stations in anticipation of thunderstorms/ rain, which saved under drawl of power thereby also ensuring grid security. The summary of savings made by the discom on different occasions is as follows: S.no Date Savings (Mus) 1 10/05/ /05/ /06/ /08/ /08/ /09/ /09/ The details shared by BRPL is enclosed as Annexure-III (IV) Northern Regional Load Despatch Centre (NRLDC) : Northern Region and Eastern Region of the power system in India face foggy conditions during night and early morning hours of winter months. The fog coupled with pollution leads to tripping of EHV lines. To mitigate the adverse effect of tripping on power system, Grid operators have taken successful action based on near real time colour composite images of fog from Satellite image. Two such cases have been explained in detail. 75

84 (a) Tripping of 765kV Anpara C-Unnao. Frequent tripping of 765kV Anpara C-Unnao line attributed due to fog during winter nights ( ) Date Time of Tripping Time of Revival :38 hrs 16:31 hrs :49 hrs 10:06 hrs :30 hrs 10:48 hrs :24 hrs 10:53 hrs :55 hrs 18:45 hrs :18 hrs 10:59 hrs. Fog build up during night hours Satellite image at 01:30 hrs dated Satellite image at 03:30 hrs dated


85 Fog build up during night Satellite image at 03:00 hrs dated Satellite image at 05:30 hrs dated Fog build up during night Satellite image at 01:30 hrs dated Satellite image at 03:00 hrs dated
86 It was observed that due to tripping of 765kV Anpara C Unnao line, line loadings of other 400kV lines especially 400kV Anpara - Sarnath D/C increased beyond permissible limits (>700MW per ckt). Operating these lines on such high loading poses a threat to grid security. Action taken: From the inputs of weather portal regarding spread of fog, UP was advised to back down generation in Anpara complex and increase generation in other plants to meet its load, in the interest of grid security. Low generation in Anpara complex ensures that in the event of tripping of 765kV Anpara C-Unnao line or any other 400kV line in Anpara complex (due to fog), the loading of other lines does not exceed operating limits. This gives operator an increased time window for corrective action. (b) Transients in HVDC Rihand-Dadri during foggy winter nights Transients in HVDC Rihand-Dadri were observed during night shifts for the period ( ). To prevent the occurrence of flash over RVMO mode of HVDC was utilized. Action taken: Visualization of fog from Satellite image at the weather portal was used to ascertain the requirement of putting the HVDC in RVMO mode. RRVPNL has shared its experience in following words: It is a great experience to browse through the weather portal. It has been quite useful for our load forecasting as well. Eastern Region (i) Depression over northwest Bay of Bengal on There was a depression over northwest Bay of Bengal on It was known beforehand from the weather website that heavy rain at isolated places was very likely over West Bengal and Odisha. Anticipating lower demand and high frequency, ERLDC suggested NLDC to issue regulation down instruction in advance which helped in maintaining frequency profile. (ii) Demand prediction of Bihar Earlier Bihar was not capable of predicting demand profile accurately, causing a large difference between schedule and actual exchange. With the introduction of weather portal the demand prediction of Bihar improved remarkably. Here is a comparison of schedule and actual exchange on 08 th October of 2016 and
87 Scheduled and Actual exchange of Bihar on date: Frequency Actual Schedule Scheduled and Actual exchange of Bihar on date: Frequency Actual Schedule (iii) Depression over north-west Bay of Bengal on As per the day-ahead warning obtained from weather website it was known that depression over Gangetic West Bengal had intensified and heavy to very heavy rainfall at a few places and extremely heavy rainfall at isolated places is very likely over Gangetic West Bengal during next 24 hours and 79
88 isolated heavy to very heavy rainfall during subsequent 24 hours. Accordingly the following course of action was decided to battle the situation: Restore the lines which are out on overvoltage in order to ensure system connectivity and reliability. Plan the generation backing down required in West Bengal according to estimated demand reduction. In case of sudden load crash, inform NLDC for support through RRAS down dispatch. Sensitize all the SLDCs and generating stations in the region regarding the cyclone. (iv) Proactive action by West Bengal based on weather data: Meteogram, wind and rain forecast for helped in better load assessment of West Bengal control area by W.B State Load Dispatch Centre. As anticipated, West Bengal demand went down from 7051 MW to 5929 MW due to change in weather conditions. Accordingly, purchase of power through STOA (day-ahead) & Power Exchange was reduced by West Bengal from MU (on the previous day) to MU for which resulted in overall saving of power procurement cost. So with the implementation of the website, advance planning was possible to handle situations of extreme weather conditions. Southern Region Cyclone OCKHI- Southern Region Weather portal for Southern Region helped the system operator and the system reliability team to take precautionary measures in issuing warning notes to the Southern States to prepare for a bad weather and a probable cyclone. Weather portal gave timely warning on the depression formed over southwest Bay of Bengal near southeast Sri Lanka coast in the morning of 29th November, It was identified that this depression would develop into a cyclonic storm during the next 12 hours. System reliability and study group of SRLDC prepared an alert report explaining the probable cyclone and various precautions to be taken during the cyclone period by the system operator. The following aspects were of utmost importance for the system operation. 80
89 1. Rainfall Information and Wind Warning: It was informed that there would be widespread rainfall in parts of southern Tamilnadu and Kerala. Tamilnadu was advised to be prepared for a demand reduction of approx MW due to this and thus have reduced their internal Generation. Kerala also witnessed a 350 MW reduction in demand; internal generation was regulated by 200 MW. Totally internal generation of Southern Region was reduced by 2500 MW. 2. Precautions Taken It was expected that a voltage rise would occur in the Southern Grid due to load loss. All the Bus-Reactors were made available to combat over-voltages. Thermal generators were instructed for maximizing reactive power absorption All the transmission line outages were deferred during the cyclone period. 3. Kudankulam Nuclear Power Station ( 2 x 1000 MW) Since the cyclone was passing close by to this nuclear station, a plan was prepared for restoration of supply in-case of any emergency. 4. Traction Supply All the important feeder points were identified for South Western Railways for immediate restoration. There was no loss of traction supply in Tamilnadu and Kerala. 81


90 Monitoring of Cyclone OCKHI 30 Th November st December nd December rd December


91 4 th December th December 2017 (night hours) 5 th December th December 2017 (night hours) 83
92 North Eastern Region NERLDC delivered a presentation on weather portal of North Eastern Region during 132 nd OCC meeting held at Guwahati on 12 th May, Scientists from RMC, Guwahati also delivered a presentation on the weather portal of North Eastern Region during 134th OCC meeting held at Guwahati on 28 th July, Since inception of the Weather Portal, NERLDC is using the portal of North Eastern Region for Real- Time Grid Management and the same is made available as a separate TAB in NERLDC website for easy reference. Usage of weather portal of North Eastern Region by NERLDC is mentioned below: 1. Usage of Weather Portal on Daily Basis: Regional weather forecast report is mailed to all the SLDCs, ISGSs for taking appropriate measures on Daily Basis. Nowcast data of 7 (seven) cities are available as of now which are monitored from time to time. 3 hours forecasted maximum temperature, relative humidity and rainfall data are used by the system operators of NERLDC for hydro dispatch scheduling and as well as mailed to all the SLDCs for computation of load forecast and ISGSs for generation planning on daily basis. 2. Usage of Weather Portal for Cyclone Warnings: Cyclone MORA : Cyclonic storm "MORA" over east central Bay of Bengal was issued by Indian Meteorological Department vide bulletin no 12 dated The same was also available in cyclone warning tab in weather portal of North Eastern Region. Heavy rainfall warning was issued Assam, Manipur, Meghalaya, Mizoram, Nagaland and Tripura. NERLDC immediately informed all the SLDCs and ISGSs about the upcoming cyclonic storm MORA. NERLDC also informed all the SLDCs and ISGSs that due to the cyclonic effect there may be extensive load crash as well as the generation loss in the NER especially in Tripura. To tackle emergency situations, the generators were informed that they may be requested to maintain the technical minimum or units may be asked to back down for the security of the power system. All the SLDCs and ISGSs responded to the Cyclone MORA warning and 84
93 reported its preparedness to take care of the situation. Time to time update about the path of Cyclone MORA were monitored by real time operators and all SLDCs and ISGSs were also informed about the same. Load crash due to adverse weather conditions was also reported by Assam, Manipur, Mizoram and Meghalaya during cyclone MORA. The brief details of total amount of load and generation loss is given below: Date States Affected Total Load Loss Total Generation Loss Assam, Manipur, Mizoram, Meghalaya 558 Nil Assam 194 Nil 3. Usage of Weather Portal for Weather Warnings: Weather warnings as issued by Indian Meteorological Department regarding rainfall, foggy conditions are informed to the SLDCs and ISGSs and are requested to be vigilant. The warnings are used for real time grid management also by NERLDC system operators. Based on the warnings on fog, gas based generators were informed to maintain adequate filters in stock to tackle any emergency situation. 4. Usage of Weather Portal for Load Forecasting: NERLDC is working on the usage of weather data for load forecasting. Currently 3 hours forecasted maximum temperature, relative humidity and rainfall data are only available from IMD. Currently load forecasting is being done for 15 mins time block and high forecasted error is coming for usage of repetitive data for 3 hours. Minimum of 1 hour forecasted maximum temperature, relative humidity and rainfall shall be used for minimizing the forecasted error. For better load forecasting, the seasonal pattern of variation of load with respect to temperature, relative humidity, rainfall, wind speed, wind direction etc. is being studied. 85
94 5. Usage of Weather Portal for Real Time Grid Operation: In real time, the Nowcast feature of weather portal is extensively used for monitoring and alerting the SLDCs. The SLDCs are made aware of any disturbance in weather conditions and they are advised to manage their load accordingly. The weather portal also allows the real-time grid operator to remain more vigil as in case of heavy wind, cyclone, or heavy lightning, the events of tripping also increase. 6. Usage of Weather Portal for Scheduling: The warnings of inclement weather help in predicting sudden unprecedented decrease in demand. In such cases where demand is low due to inclement weather, generation schedule of hydro machines is revised such that only optimal numbers of hydro units are running to meet the reduced demand. The states are advised to monitor the weather conditions at various locations in their respective states and revise their power requisition, if needed. 86
95 14. Road Ahead Structured weather services for power sector. Use of Radar products and Satellite image in real time grid operation. Use of Meteogram, Satellite image and Radar data for load forecasting/re generation forecasting. Use of Meteogram for generation planning and transmission outage planning. Inflow forecasting: Generation from a run of river hydro power station depends upon the water inflow into river basin. Weather monitoring stations and RADAR may be utilized to estimate precipitation. Inclusion of power system network as a base layer in RAPID software. Upon successful inclusion, system operators can interact like actual satellite workstation and may zoom to any substation or transmission line path and make themselves aware of weather conditions. Establishment of IMD desk at National Load Despatch Centre for power sector with following assignments. Daily National/Regional weather report generation. Providing monthly /seasonal weather outlook. Providing weather data for load/re forecasting. Deciphering Satellite images / RADAR images for system operators. Rainfall estimate in catchment area of hydro plants for inflow forecasting /silt forecasting. Coordination with IMD for value added weather information. Conducting workshops for power sector professionals. The Indian Air Force (IAF) has joined hands with IMD to share real time lightening related data. IAF has installed more than 142 sensors to detect lightening across the country. Tripping of lines due to lightening is almost 3 times higher in North Eastern Region compared to other parts of the country. Predicting lightening incidents by IMD shall be very useful for system operators and transmission companies. 87
96 15. Regional Contact details of IMD Northern Region : Director AMSS M.O. Palam, I.G.I. Airport, New Delhi Telefax: Phone: amss @yahoo.co.in North Eastern Region: Regional Meteorological Centre LGB International Airport Guwahati, Assam, ( INDIA ) Guwahati Phone : / Tele Fax : ddgm-rmc-guw@nic.in Eastern Region: Deputy Director General of Meteorology, Regional Meteorological Centre, 4, Duel Avenue, Alipore, Kolkata Telephone : Fax : rmckol@dataone.in Western Region: Deputy Director General of Meteorology Regional Meteorological Centre, Near R.C Church, Next Ashwini Naval Hospital,Colaba, Mumbai Telephone: / Southern Region: Deputy Director General of Meteorology, Regional Meteorological Centre, 50 (New 6) College Road,Chennai For all weather related enquiries contact Duty officer Area Cyclone warning Centre (24 hours) Telephone: Fax: acwctp@gmail.com 88

97 Annexure-I 89
98 Annexure-II City Code in Radar Image Northern Region Abbreviation Meaning Delhi NCR IGI IGI Airport New Delhi Delhi NCR GUR Gurugram Delhi NCR FRD Faridabad Delhi NCR GZB Gaziabad UP BAG Bagpat UP MRT Meerut UP MZF Muzaffarnagar UP BIJ Bijnaur UP MRD Muradabad UP SHB Sambhal UP BDS Bulandsahar UP SWN Sahsawan UP BDN Badaun UP BRY Bareilly UP ALG Aligarh UP HTH Hathrash UP ETA Eta UP MNP Mainpuri UP ETW Etawah UP PLB Pilibhit UP RMP Rampur UP LKP Lakhimpur UP KNJ Kannauj UP KNP Kanpur 90
99 UP LKN Lucknow UP UNO Unnao UP CHK Chitrakoot UP JHN Jhansi UP MHP Mauranipur UP LLT Lalitpur UP ALB Allahabad UP FZD Faizabad UP GDA Gonda UP BRC Bahraich UP BST Basti UP SKN Santkabirnagar UP GKP Gorakhpur UP MTR Mahrajganj UP KGN Kushinagar UP DOR Deoria UP MAU Mau UP BLA Balia UP JNP Jaunpur UP VNS Varanasi UP SRN Santravidasnagar UP MZP Mirzapur Haryana PLW Palwal Haryana HDL Hodal Haryana NUH Nuh Haryana REW Rewari Haryana NAR Narnaul Haryana JHJ Jhajjar Haryana ROH Rohtak Haryana BWN Bhiwani 91
100 Haryana HSR Hisar Haryana PNP Panipat Haryana FTB Fatehabad Haryana SSA Sirsa Haryana KTL Kaithal Haryana KNL Karnal Haryana KSH Kurukshetra Haryana YAN Yamuna nagar Haryana AMB Ambala Rajasthan ALW Alwar Rajasthan BRP Bharatpur Rajasthan DHP Dhulpur Rajasthan DSA Dausa Rajasthan KRL Karauli Rajasthan TNK Tonk Rajasthan JPR Jaipur Rajasthan BDI Bundi Rajasthan BRN Baran Rajasthan JHW Jhalwar Rajasthan CHG Chittorgarh Rajasthan BLW Bhilwara Rajasthan RJM Rajasmand Rajasthan UDP Udaipur Rajasthan AJM Ajmer Rajasthan JDP Jodhpur Rajasthan JLR Jaisalmer Rajasthan SRH Sorohi Rajasthan NGR Nagaur Rajasthan BKN Bikaner Rajasthan JHUN Jhunjhunu 92
101 Rajasthan PLM Pilani Rajasthan CRU Churu Rajasthan HMS Hanumangarh Rajasthan GGN Ganganagar Punjab DVGR Devigarh Punjab PTL Patiala Punjab SNGR Sangrur Punjab MNS Mansa Punjab BTD Bhatinda Punjab MNDBL Mandidawali Punjab ABHR Abohar Punjab FZLK Fazilka Punjab MKTSR Muktsar Punjab FDKT Faridkot Punjab FZPR Ferozepur Punjab ZIRA Zira Punjab NBH Nabha Punjab KHNA Khanna Punjab LDN Ludhiana Punjab NSHR Nawanshahr Punjab NKD Nakodar Punjab JLNDR Jalandhar Punjab NGL Nangal Punjab ADMPR Adampur Punjab HSRPR Hoshiarpur Punjab DSUA Dasuya Punjab GDP Gurudaspur Punjab BTL Batala Punjab AJNL Ajnala Punjab AMRTSR Amritsar 93
102 Punjab KPRTL Kapurthala Punjab CHD Chandigarh J&K SRN Srinagar J&K GDB Ganderbal J&K KGN Kangan J&K SHP Shopian J&K KLG Kulgam J&K ANG Anantnag J&K QZD Qauzigund J&K KNG Kokernag J&K BNL Banihal J&K RJR Rajouri J&K PNH Poonch J&K URI Uri J&K TGR Tangdhar J&K GLM Gulmarg J&K BRM Baramulla J&K HDW Handwara J&K KUP Kupwara J&K BDP Bandipora J&K SMG Sonamarg J&K BTL Baltal J&K ANC Amarnath J&K PHL Pahlgam Eastern Region West Bengal KOL Kolkata West Bengal DD Dumdum West Bengal UNP Udaynarayanpur West Bengal KLG Kolaghat West Bengal DDH Diamond harbour 94
103 West Bengal CNG Canning West Bengal HLD Haldia West Bengal RDG Raidighi West Bengal ABG Arambagh West Bengal HBR Habra West Bengal BSH Bashirhat West Bengal HGJ Hinagalganj West Bengal BNG Bongaon West Bengal KRG Krishnanagr West Bengal BDW Bardhman West Bengal MDP Medinpure West Bengal JRM Jhagram West Bengal BNK Bankura West Bengal DGP Durgapur West Bengal SKT Shantiniketan West Bengal SGR Sagar West Bengal DGH Digha West Bengal ASL Asansol West Bengal SUR Suri West Bengal BRP Berhampore West Bengal PRL Purulia Bihar PTN Patna Bihar CHP Chhapra Bihar JNG Jahanabad Bihar ARA Aara Bihar BXR Buxar Bihar SRM Sasaram Bihar ABD Aurnagabad Bihar GYA Gaya Bihar NWD Nawada 95
104 Bihar BHR Bihar sharif Bihar SMP Samastipur Bihar MZF Muzzafarpur Bihar SWN Siwan Bihar BHB Bhabua Bihar DTG Daltonganj Bihar CHT Chauparan Bihar HZB Hazaribagh Bihar KDM Koderma Bihar GDH Giridih Bihar DGR Deoghar Bihar BNK Banka Bihar BGP Bhagalpur Bihar JMI Jamui Bihar LKS Lakhisarai Bihar MGR Munger Bihar BGS Begusarai Bihar KGR Khagria Bihar SHS Saharsha Bihar SPL Supaul Bihar MDP Madhepura Bihar DBG Darbhanga Bihar MDB Madhubani Bihar STM Sitamarhi Bihar GPG Gopalganj Bihar MTH Motihari Bihar BTH Bettiah Bihar KDPR Krushnandapur Bihar JSP Jagatshingpur Bihar JJPR Jajpur 96
105 Bihar DNKL Dhenkanal Bihar ANGUL Angul Bihar NYGH Nayagarh Bihar GNJM Ganjam Bihar TLCR Talcher Bihar KEJR Keonjhar North-Eastern Region Tripura AGT Agartala Tripura UDP Udaipur Tripura BLN Belonia Tripura SBR Sabroom Tripura AMB Ambassa Tripura KML Kamalpur Mizoram AZL Aizwal Assam MBR Mohanbari Assam TSK Tinsukia Assam DGB Digboi Assam SBG Sivasagar Assam LKP Lakhimpur Assam JRT Jorhat Assam GHP Gohpur Assam GLT Golaghat Assam TZP Tezpur Assam NGO Nagaon Assam LMD Lumding Arunachal Pradesh PSG Pasighat Arunachal Pradesh ALN Along Arunachal Pradesh DPJ Daporijo Arunachal Pradesh ZRO Zero Arunachal Pradesh KNS Khonsa 97
106 Southern Region Tamilnadu NGR Nagalpuram Tamilnadu VLR Vellore Tamilnadu KAN Kanchipuram Tamilnadu CGP Chengalpattu Tamilnadu PLC Pulicat Tamilnadu SHR Sriharikota Tamilnadu TPL Tirupati Tamilnadu GDR Gudur Tamilnadu AMB Ambur Tamilnadu YEL Yelagiri Tamilnadu PLR Polur Tamilnadu TVM Tiruvannamalai Tamilnadu TDV Tindivanam Tamilnadu CEY Cheyur Tamilnadu PDC Puducherry Tamilnadu CDL Cuddalore Tamilnadu NLR Nellore Tamilnadu NLP Nellore palem Tamilnadu RJM Rajamet Tamilnadu RYC Rayochoty Tamilnadu MDP Madanpalle Tamilnadu MUL Mulbagal Tamilnadu KRG Krishnagiri Tamilnadu HAR Harur Tamilnadu KLK Kallkurichi Tamilnadu CHD Chidambaram Tamilnadu ARL Ariyalur Tamilnadu SLM Salem Tamilnadu UDG Udayagiri 98
107 Telangana HYD Hyderabad Telangana SBD Shamshabad Telangana BHG Bhuvangiri Telangana SGD Sangareddy Telangana MDC Medchal Telangana MDK Medak Telangana SDP Siddipet Telangana JGN Jangaon Telangana WGL Warangal Telangana NLG Nalgonda Telangana DVK Devarkonda Telangana MBN Mehbubnagar Telangana NGKR Nagarkurnool Telangana WNP Wanaparthy Telangana NSG Nagarjunasagar Telangana SYP Suryapet Telangana GNT Guntur Telangana KHM Khammam Telangana MBB Mahbubabad Telangana BHU Bhupalpally Telangana KRM Karimnagar Telangana JGT Jagtial Telangana MCH Mancherial Telangana ASB Asifabad Telangana NIR Nirmal Telangana NZB Nizamabad Telangana NPT Narayanpet Karnataka RCH Raichur Telangana GDW Gadwal Andhra Pradesh KRN Kurnool 99
108 Telangana RMG Ramagundam Telangana PDP Peddapalli Telangana VKB Vikrabad Andhra Pradesh VJA Vijayawada Andhra Pradesh MPT Machilipatnam Andhra Pradesh NSP Narsapur Andhra Pradesh RJY Rajahmundry Andhra Pradesh KND Kakinada Andhra Pradesh VSK Vishakhapatnam Andhra Pradesh VZM Vizianagram Andhra Pradesh KLN Kalingapatnam Western Region GOA PNJ Panjim GOA ANJ Anjuna GOA MOR Morjim GOA DBIM Dabolin GOA SHI Shiroda GOA MRGAO Mormugao GOA PON Ponda GOA VAL Valpoi GOA SQLH Sanquelim GOA PER Pernem GOA VNG Vengurla GOA DVG Devbagh GOA QPM Quepem GOA CRNZL Caranzol GOA SNGM Sanguem GOA CAN Canacona GOA NET Netravali GOA VRLM Verlem 100
109 GOA DWD Dudhsagr Madhya Pradesh BRS Berasia Madhya Pradesh NRG Narsinghgarh Madhya Pradesh BRA Biaora Madhya Pradesh SGP Sarangpur Madhya Pradesh KAD Kannod Madhya Pradesh ITS Itarasi Madhya Pradesh UDP Udaipur Madhya Pradesh GBSD GanjBasoda Madhya Pradesh SIG Siroj Madhya Pradesh ASK Ashoknagar Madhya Pradesh TKG Tikamgarh 101
110 INDEX BRPL Case Study on Savings due to Weather Portal S. No Description Page No 1 Savings on Savings on Savings on Savings on Savings on Savings on Savings on

111 BRPL : Case Study for Total Power Exchange, IDT & Bilateral

112 BRPL : Case Study for Weather Forecast 104


113 Radar Image BRPL : Case Study for
114 00:00-00:15 00:30-00:45 01:00-01:15 01:30-01:45 02:00-02:15 02:30-02:45 03:00-03:15 03:30-03:45 04:00-04:15 04:30-04:45 05:00-05:15 05:30-05:45 06:00-06:15 06:30-06:45 07:00-07:15 07:30-07:45 08:00-08:15 08:30-08:45 09:00-09:15 09:30-09:45 10:00-10:15 10:30-10:45 11:00-11:15 11:30-11:45 12:00-12:15 12:30-12:45 13:00-13:15 13:30-13:45 14:00-14:15 14:30-14:45 15:00-15:15 15:30-15:45 16:00-16:15 16:30-16:45 17:00-17:15 17:30-17:45 18:00-18:15 18:30-18:45 19:00-19:15 19:30-19:45 20:00-20:15 20:30-20:45 21:00-21:15 21:30-21:45 22:00-22:15 22:30-22:45 23:00-23:15 23:30-23:45 BRPL : Case Study for BRPL's Demand BRPL's Demand Max Drop 396 MW during 20:15-20:30 Avg Drop 128 MW
115 00:00-00:15 00:30-00:45 01:00-01:15 01:30-01:45 02:00-02:15 02:30-02:45 03:00-03:15 03:30-03:45 04:00-04:15 04:30-04:45 05:00-05:15 05:30-05:45 06:00-06:15 06:30-06:45 07:00-07:15 07:30-07:45 08:00-08:15 08:30-08:45 09:00-09:15 09:30-09:45 10:00-10:15 10:30-10:45 11:00-11:15 11:30-11:45 12:00-12:15 12:30-12:45 13:00-13:15 13:30-13:45 14:00-14:15 14:30-14:45 15:00-15:15 15:30-15:45 16:00-16:15 16:30-16:45 17:00-17:15 17:30-17:45 18:00-18:15 18:30-18:45 19:00-19:15 19:30-19:45 20:00-20:15 20:30-20:45 21:00-21:15 21:30-21:45 22:00-22:15 22:30-22:45 23:00-23:15 23:30-23:45 BRPL : Case Study for Timely MW Reduction Date: MW Reduction Prior Schedule Final Schedule Total MUs reduced = 0.24 MUs 107

116 BRPL : Case Study for Total Power Exchange & Bilateral

117 BRPL : Case Study for Weather Forecast 109
118 00:00-00:15 00:30-00:45 01:00-01:15 01:30-01:45 02:00-02:15 02:30-02:45 03:00-03:15 03:30-03:45 04:00-04:15 04:30-04:45 05:00-05:15 05:30-05:45 06:00-06:15 06:30-06:45 07:00-07:15 07:30-07:45 08:00-08:15 08:30-08:45 09:00-09:15 09:30-09:45 10:00-10:15 10:30-10:45 11:00-11:15 11:30-11:45 12:00-12:15 12:30-12:45 13:00-13:15 13:30-13:45 14:00-14:15 14:30-14:45 15:00-15:15 15:30-15:45 16:00-16:15 16:30-16:45 17:00-17:15 17:30-17:45 18:00-18:15 18:30-18:45 19:00-19:15 19:30-19:45 20:00-20:15 20:30-20:45 21:00-21:15 21:30-21:45 22:00-22:15 22:30-22:45 23:00-23:15 23:30-23:45 BRPL : Case Study for BRPL's Demand BRPL's Demand
119 00:00-00:15 00:30-00:45 01:00-01:15 01:30-01:45 02:00-02:15 02:30-02:45 03:00-03:15 03:30-03:45 04:00-04:15 04:30-04:45 05:00-05:15 05:30-05:45 06:00-06:15 06:30-06:45 07:00-07:15 07:30-07:45 08:00-08:15 08:30-08:45 09:00-09:15 09:30-09:45 10:00-10:15 10:30-10:45 11:00-11:15 11:30-11:45 12:00-12:15 12:30-12:45 13:00-13:15 13:30-13:45 14:00-14:15 14:30-14:45 15:00-15:15 15:30-15:45 16:00-16:15 16:30-16:45 17:00-17:15 17:30-17:45 18:00-18:15 18:30-18:45 19:00-19:15 19:30-19:45 20:00-20:15 20:30-20:45 21:00-21:15 21:30-21:45 22:00-22:15 22:30-22:45 23:00-23:15 23:30-23:45 BRPL : Case Study for Timely MW Reduction Date : MW Reduction Prior Schedule Final Schedule Total MUs reduced = 0.48 MUs 111
120 BRPL : Case Study for Total Power Exchange, IDT & Bilateral
121 00:00-00:15 00:30-00:45 01:00-01:15 01:30-01:45 02:00-02:15 02:30-02:45 03:00-03:15 03:30-03:45 04:00-04:15 04:30-04:45 05:00-05:15 05:30-05:45 06:00-06:15 06:30-06:45 07:00-07:15 07:30-07:45 08:00-08:15 08:30-08:45 09:00-09:15 09:30-09:45 10:00-10:15 10:30-10:45 11:00-11:15 11:30-11:45 12:00-12:15 12:30-12:45 13:00-13:15 13:30-13:45 14:00-14:15 14:30-14:45 15:00-15:15 15:30-15:45 16:00-16:15 16:30-16:45 17:00-17:15 17:30-17:45 18:00-18:15 18:30-18:45 19:00-19:15 19:30-19:45 20:00-20:15 20:30-20:45 21:00-21:15 21:30-21:45 22:00-22:15 22:30-22:45 23:00-23:15 23:30-23:45 BRPL : Case Study for BRPL's Demand BRPL's Demand
122 BRPL : Case Study for Timely MW Reduction Dare: MW Reduction Prior Schedule Final Schedule Total MUs reduced = 1.49 MUs 114
123 BRPL : Case Study for Total Power Exchange, IDT & Bilateral

124 BRPL : Case Study for Weather Forecast 116
125 00:00-00:15 00:30-00:45 01:00-01:15 01:30-01:45 02:00-02:15 02:30-02:45 03:00-03:15 03:30-03:45 04:00-04:15 04:30-04:45 05:00-05:15 05:30-05:45 06:00-06:15 06:30-06:45 07:00-07:15 07:30-07:45 08:00-08:15 08:30-08:45 09:00-09:15 09:30-09:45 10:00-10:15 10:30-10:45 11:00-11:15 11:30-11:45 12:00-12:15 12:30-12:45 13:00-13:15 13:30-13:45 14:00-14:15 14:30-14:45 15:00-15:15 15:30-15:45 16:00-16:15 16:30-16:45 17:00-17:15 17:30-17:45 18:00-18:15 18:30-18:45 19:00-19:15 19:30-19:45 20:00-20:15 20:30-20:45 21:00-21:15 21:30-21:45 22:00-22:15 22:30-22:45 23:00-23:15 23:30-23:45 BRPL : Case Study for BRPL's Demand BRPL's Demand
126 00:00-00:15 00:30-00:45 01:00-01:15 01:30-01:45 02:00-02:15 02:30-02:45 03:00-03:15 03:30-03:45 04:00-04:15 04:30-04:45 05:00-05:15 05:30-05:45 06:00-06:15 06:30-06:45 07:00-07:15 07:30-07:45 08:00-08:15 08:30-08:45 09:00-09:15 09:30-09:45 10:00-10:15 10:30-10:45 11:00-11:15 11:30-11:45 12:00-12:15 12:30-12:45 13:00-13:15 13:30-13:45 14:00-14:15 14:30-14:45 15:00-15:15 15:30-15:45 16:00-16:15 16:30-16:45 17:00-17:15 17:30-17:45 18:00-18:15 18:30-18:45 19:00-19:15 19:30-19:45 20:00-20:15 20:30-20:45 21:00-21:15 21:30-21:45 22:00-22:15 22:30-22:45 23:00-23:15 23:30-23:45 BRPL : Case Study for Timely MW Reduction Date: MW Reduction Prior Schedule Final Schedule Total MUs reduced = 0.43 MUs 118
127 00:00-00:15 00:30-00:45 01:00-01:15 01:30-01:45 02:00-02:15 02:30-02:45 03:00-03:15 03:30-03:45 04:00-04:15 04:30-04:45 05:00-05:15 05:30-05:45 06:00-06:15 06:30-06:45 07:00-07:15 07:30-07:45 08:00-08:15 08:30-08:45 09:00-09:15 09:30-09:45 10:00-10:15 10:30-10:45 11:00-11:15 11:30-11:45 12:00-12:15 12:30-12:45 13:00-13:15 13:30-13:45 14:00-14:15 14:30-14:45 15:00-15:15 15:30-15:45 16:00-16:15 16:30-16:45 17:00-17:15 17:30-17:45 18:00-18:15 18:30-18:45 19:00-19:15 19:30-19:45 20:00-20:15 20:30-20:45 21:00-21:15 21:30-21:45 22:00-22:15 22:30-22:45 23:00-23:15 23:30-23:45 BRPL : Case Study for BRPL's Demand BRPL's Demand Max Drop 401 MW during 15:00-15:15 Avg Drop 151 MW
128 00:00-00:15 00:30-00:45 01:00-01:15 01:30-01:45 02:00-02:15 02:30-02:45 03:00-03:15 03:30-03:45 04:00-04:15 04:30-04:45 05:00-05:15 05:30-05:45 06:00-06:15 06:30-06:45 07:00-07:15 07:30-07:45 08:00-08:15 08:30-08:45 09:00-09:15 09:30-09:45 10:00-10:15 10:30-10:45 11:00-11:15 11:30-11:45 12:00-12:15 12:30-12:45 13:00-13:15 13:30-13:45 14:00-14:15 14:30-14:45 15:00-15:15 15:30-15:45 16:00-16:15 16:30-16:45 17:00-17:15 17:30-17:45 18:00-18:15 18:30-18:45 19:00-19:15 19:30-19:45 20:00-20:15 20:30-20:45 21:00-21:15 21:30-21:45 22:00-22:15 22:30-22:45 23:00-23:15 23:30-23:45 BRPL : Case Study for Timely MW Reduction Date: MW Reduction Prior Schedule Final Schedule Total MUs reduced = 1.26 MUs 120
129 BRPL : Case Study for Total Power Exchange, IDT & Bilateral
130 BRPL : Case Study for Weather Forecast 122
131 00:00-00:15 00:30-00:45 01:00-01:15 01:30-01:45 02:00-02:15 02:30-02:45 03:00-03:15 03:30-03:45 04:00-04:15 04:30-04:45 05:00-05:15 05:30-05:45 06:00-06:15 06:30-06:45 07:00-07:15 07:30-07:45 08:00-08:15 08:30-08:45 09:00-09:15 09:30-09:45 10:00-10:15 10:30-10:45 11:00-11:15 11:30-11:45 12:00-12:15 12:30-12:45 13:00-13:15 13:30-13:45 14:00-14:15 14:30-14:45 15:00-15:15 15:30-15:45 16:00-16:15 16:30-16:45 17:00-17:15 17:30-17:45 18:00-18:15 18:30-18:45 19:00-19:15 19:30-19:45 20:00-20:15 20:30-20:45 21:00-21:15 21:30-21:45 22:00-22:15 22:30-22:45 23:00-23:15 23:30-23:45 BRPL : Case Study for BRPL's Demand BRPL's Demand Max Drop 610 MW during 22:15-22:30 Avg Drop 229 MW
132 00:00-00:15 00:30-00:45 01:00-01:15 01:30-01:45 02:00-02:15 02:30-02:45 03:00-03:15 03:30-03:45 04:00-04:15 04:30-04:45 05:00-05:15 05:30-05:45 06:00-06:15 06:30-06:45 07:00-07:15 07:30-07:45 08:00-08:15 08:30-08:45 09:00-09:15 09:30-09:45 10:00-10:15 10:30-10:45 11:00-11:15 11:30-11:45 12:00-12:15 12:30-12:45 13:00-13:15 13:30-13:45 14:00-14:15 14:30-14:45 15:00-15:15 15:30-15:45 16:00-16:15 16:30-16:45 17:00-17:15 17:30-17:45 18:00-18:15 18:30-18:45 19:00-19:15 19:30-19:45 20:00-20:15 20:30-20:45 21:00-21:15 21:30-21:45 22:00-22:15 22:30-22:45 23:00-23:15 23:30-23:45 BRPL : Case Study for Timely MW Reduction Date: MW Reduction Prior Schedule Final Schedule Total MUs reduced = 2.19 MUs 124
133 BRPL : Case Study for Total Power Exchange, IDT & Bilateral
134 BRPL : Case Study for Weather Forecast 126
135 00:00-00:15 00:30-00:45 01:00-01:15 01:30-01:45 02:00-02:15 02:30-02:45 03:00-03:15 03:30-03:45 04:00-04:15 04:30-04:45 05:00-05:15 05:30-05:45 06:00-06:15 06:30-06:45 07:00-07:15 07:30-07:45 08:00-08:15 08:30-08:45 09:00-09:15 09:30-09:45 10:00-10:15 10:30-10:45 11:00-11:15 11:30-11:45 12:00-12:15 12:30-12:45 13:00-13:15 13:30-13:45 14:00-14:15 14:30-14:45 15:00-15:15 15:30-15:45 16:00-16:15 16:30-16:45 17:00-17:15 17:30-17:45 18:00-18:15 18:30-18:45 19:00-19:15 19:30-19:45 20:00-20:15 20:30-20:45 21:00-21:15 21:30-21:45 22:00-22:15 22:30-22:45 23:00-23:15 23:30-23:45 BRPL : Case Study for BRPL's Demand BRPL's Demand Max Drop 503 MW during 01:15-01:30 Avg Drop 232 MW
136 00:00-00:15 00:30-00:45 01:00-01:15 01:30-01:45 02:00-02:15 02:30-02:45 03:00-03:15 03:30-03:45 04:00-04:15 04:30-04:45 05:00-05:15 05:30-05:45 06:00-06:15 06:30-06:45 07:00-07:15 07:30-07:45 08:00-08:15 08:30-08:45 09:00-09:15 09:30-09:45 10:00-10:15 10:30-10:45 11:00-11:15 11:30-11:45 12:00-12:15 12:30-12:45 13:00-13:15 13:30-13:45 14:00-14:15 14:30-14:45 15:00-15:15 15:30-15:45 16:00-16:15 16:30-16:45 17:00-17:15 17:30-17:45 18:00-18:15 18:30-18:45 19:00-19:15 19:30-19:45 20:00-20:15 20:30-20:45 21:00-21:15 21:30-21:45 22:00-22:15 22:30-22:45 23:00-23:15 23:30-23:45 BRPL : Case Study for Timely MW Reduction Date: MW Reduction Prior Schedule Final Schedule Total MUs reduced = 1.87 MUs 128
137 Acronyms AOD BRPL CEA DWR FOLD GPI GPR IMD IMSRA LST LWIR MIR NLDC NRLDC OCC OLR PPI POSOCO QPE RAPID Aerosol Optical Depth BSES Rajdhani Power Limited Centre Electricity Authority Doppler weather Radar Forum of Load Despatchers Global Precipitation Index Geo-Physical Parameters India Meteorological Department INSAT Multi-Spectral Rainfall Algorithm Land Surface Temperature Long Wave Infra-Red Medium Wave Infra-Red National Load Despatch Centre Northern Region Load Despatch Centre Operation Coordination Committee Outgoing long wave Radiation Plan Position Indicator Power System Operation Corporation Quantitative Precipitation Estimates Real time Analysis of Products & Information Dissemination RMC RLDC Regional Meteorological Centre Regional Load Despatch Centre 129
138 RRVPNL RRAS SAC SLDC SRLDC SST STOA SWIR UTH WDSS II Rajasthan Rajya Vidyut Prasaran Nigam Limited Reserves Regulation Ancillary Services Satellite Application Centre State Load Despatch Centre Southern Region Load Despatch Centre Sea Surface Temperature Short Term Open Access Short Wave Infra-Red Upper Troposphere Humidity Warning Decision Support System 130
139 DISCLAIMER This disclaimer is applicable to the Reference Document on Weather Portal for Indian Power System. The document has been prepared based on the presentations given by IMD on various occasions in POSOCO and information available in public domain. By using or accessing the Reference Document you agree with the disclaimer without any qualification or limitation. In no event, Power System Operation Corporation Ltd. ( POSOCO) will be liable for claim made by the users including seeking any clarification for any of the inaccuracies in the information provided in this reference document, though all efforts have been made to ensure accuracy. Under no circumstances, the POSOCO would be liable for any expense, loss or damage, without limitation, indirect or consequential loss or damage, or any other expense, loss or damage whatsoever arising from use, in connection with the use of this Reference Document on Weather Portal for Indian Power System or contents appearing thereon. 131

140
ALL INDIA WEATHER SUMMARY AND FORECAST BULLETIN
 Saturday 21 April 2018 MORNING Time of Issue: 0800 hours IST ALL INDIA WEATHER SUMMARY AND FORECAST BULLETIN Significant Weather Features Isolated thunder squalls and hailstorms are very likely over Sub
ALL INDIA WEATHER SUMMARY AND FORECAST BULLETIN
 Sunday 22 April 2018 NIGHT Time of Issue: 2000 hours IST ALL INDIA WEATHER SUMMARY AND FORECAST BULLETIN Significant Weather Features The ongoing fairly widespread rainfall activity with isolated thunder
ALL INDIA WEATHER SUMMARY AND FORECAST BULLETIN
 Tuesday 08 May 2018 MID DAY Time of Issue: 1345 hours IST ALL INDIA WEATHER SUMMARY AND FORECAST BULLETIN Significant Weather Features Under the influence of the present Western Disturbance over Jammu
W E E K L Y MONSOON INSIGHT
 W E E K L Y MONSOON INSIGHT 08 th July 2016 Indian Monsoon Dynamics Recent Weather Development India received 35% surplus rainfall in the week ended 6 July with all regions recording above-normal rainfall
Long Range Forecast Update for 2014 Southwest Monsoon Rainfall
 Earth System Science Organization (ESSO) Ministry of Earth Sciences (MoES) India Meteorological Department PRESS RELEASE New Delhi, 9 June 2014 Long Update for 2014 Southwest Monsoon Rainfall HIGHLIGHTS
Prediction of western disturbances and associated weather over Western Himalayas
 Prediction of western disturbances and associated weather over Western Himalayas H. R. Hatwar*, B. P. Yadav and Y. V. Rama Rao India Meteorological Department, Lodi Road, New Delhi 110 003, India Two cases
3. HYDROMETEROLOGY. 3.1 Introduction. 3.2 Hydro-meteorological Aspect. 3.3 Rain Gauge Stations
 3. HYDROMETEROLOGY 3.1 Introduction Hydrometeorology is a branch of meteorology and hydrology that studies the transfer of water and energy between the land surface and the lower atmosphere. Detailed hydrological
ALL INDIA INSTALLED CAPACITY (IN MW) OF POWER STATIONS
 OF POWER STATIONS") Region Northern Region Western Region Southern Region Eastern Region North Eastern Region Islands ALL INDIA Figures at decimal may not tally due to rounding off ALL INDIA INSTALLED CAPACITY (IN MW) OF
Region Northern Region Western Region Southern Region Eastern Region North Eastern Region Islands ALL INDIA Figures at decimal may not tally due to rounding off ALL INDIA INSTALLED CAPACITY (IN MW) OF
VALIDATION OF INSAT-3D DERIVED RAINFALL. (Submitted by Suman Goyal, IMD) Summary and Purpose of Document
 Summary and Purpose of Document") WORLD METEOROLOGICAL ORGANIZATION COMMISSION FOR BASIC SYSTEMS OPEN PROGRAMME AREA GROUP ON INTEGRATED OBSERVING SYSTEMS INTER-PROGRAMME EXPERT TEAM ON SATELLITE UTILIZATION AND PRODUCTS SECOND SESSION
WORLD METEOROLOGICAL ORGANIZATION COMMISSION FOR BASIC SYSTEMS OPEN PROGRAMME AREA GROUP ON INTEGRATED OBSERVING SYSTEMS INTER-PROGRAMME EXPERT TEAM ON SATELLITE UTILIZATION AND PRODUCTS SECOND SESSION
ALL INDIA INSTALLED CAPACITY (IN MW) OF POWER STATIONS
 OF POWER STATIONS") Region Northern Region Western Region Southern Region Eastern Region North Eastern Region Islands ALL INDIA Figures at decimal may not tally due to rounding off ALL INDIA INSTALLED CAPACITY (IN MW) OF
Region Northern Region Western Region Southern Region Eastern Region North Eastern Region Islands ALL INDIA Figures at decimal may not tally due to rounding off ALL INDIA INSTALLED CAPACITY (IN MW) OF
Government of India India Meteorological Department (Ministry of Earth Sciences) Subject: Current weather conditions and forecast for next two weeks
 Subject: Current weather conditions and forecast for next two weeks") Government of India India Meteorological Department (Ministry of Earth Sciences) Press Release Dated 18 June, 2010 Subject: Current weather conditions and forecast for next two weeks Advance of monsoon
Government of India India Meteorological Department (Ministry of Earth Sciences) Press Release Dated 18 June, 2010 Subject: Current weather conditions and forecast for next two weeks Advance of monsoon
Suppressed Surface Heating over northwestern parts of the Country and the ensuing Monsoon Rainfall
 Suppressed Surface Heating over northwestern parts of the Country and the ensuing Monsoon Rainfall During this year, the temperatures have been below normal over north and northwestern parts of India.
ALL INDIA INSTALLED CAPACITY (IN MW) OF POWER STATIONS
 OF POWER STATIONS") Region Northern Region Western Region Southern Region Eastern Region North Eastern Region Islands ALL INDIA Figures at decimal may not tally due to rounding off ALL INDIA INSTALLED CAPACITY (IN MW) OF
Region Northern Region Western Region Southern Region Eastern Region North Eastern Region Islands ALL INDIA Figures at decimal may not tally due to rounding off ALL INDIA INSTALLED CAPACITY (IN MW) OF
Part 1: Weather Forecast Severe Weather Warnings (Source: IMD, Date: 1 st September, 2008)
") Sphere India Unified Response Strategy Situation report (India Floods 2008) 01 st September 2008 Part 1: Weather Forecast Severe Weather Warnings (Source: IMD, Date: 1 st September, 2008) HEAVY RAINFALL
Sphere India Unified Response Strategy Situation report (India Floods 2008) 01 st September 2008 Part 1: Weather Forecast Severe Weather Warnings (Source: IMD, Date: 1 st September, 2008) HEAVY RAINFALL
ISSUED BY KENDRIYA VIDYALAYA - DOWNLOADED FROM
 CHAPTER -11 WATER IN THE ATMOSPHERE This chapter deals with Humidity, types of humidity, relative humidity, absolute humidity, specific humidity, dew point, condensation, saturated air, types of precipitation
Date of. Issued by (AICRPAM), & Earth System
, & Earth System") National Agromet Advisory Service Bulletin Based on Extended Range Weather Forecast (ERFS) Validity: 29 September 12 October 2017 Date of Issue: 29 September 2017 Issued by Indian Council of Agricultural
National Agromet Advisory Service Bulletin Based on Extended Range Weather Forecast (ERFS) Validity: 29 September 12 October 2017 Date of Issue: 29 September 2017 Issued by Indian Council of Agricultural
Weather Studies Introduction to Atmospheric Science
 Weather Studies Introduction to Atmospheric Science American Meteorological Society Chapter 1 Monitoring The Weather Credit: This presentation was prepared for AMS by Michael Leach, Professor of Geography
CURRENT STATUS OF MONSOON Main Meteorological conditions of the last week (27August to 2 September)
") CURRENT STATUS OF MONSOON 2009 Main Meteorological conditions of the last week (27August to 2 September) Last week s low pressure area over Orissa and neighbourhood moved west-northwestwards across central
CURRENT STATUS OF MONSOON 2009 Main Meteorological conditions of the last week (27August to 2 September) Last week s low pressure area over Orissa and neighbourhood moved west-northwestwards across central
according to and water. High atmospheric pressure - Cold dry air is other air so it remains close to the earth, giving weather.
 EARTH'S ATMOSPHERE Composition of the atmosphere - Earth's atmosphere consists of nitrogen ( %), oxygen ( %), small amounts of carbon dioxide, methane, argon, krypton, ozone, neon and other gases such
1 What Is Climate? TAKE A LOOK 2. Explain Why do areas near the equator tend to have high temperatures?
 CHAPTER 17 1 What Is Climate? SECTION Climate BEFORE YOU READ After you read this section, you should be able to answer these questions: What is climate? What factors affect climate? How do climates differ
Key Finding: Long Term Trend During 2014: Rain in Indian Tradition Measuring Rain
 Chapter 34 RAINFALL Key Finding: Long Term Trend Despite of theories suggesting increase in rainfall in Asian Region due to global warming, no significant trend has been observed at all India level (confirmed
Guided Notes Weather. Part 2: Meteorology Air Masses Fronts Weather Maps Storms Storm Preparation
 Guided Notes Weather Part 2: Meteorology Air Masses Fronts Weather Maps Storms Storm Preparation The map below shows North America and its surrounding bodies of water. Country borders are shown. On the
WEATHER. rain. thunder. The explosive sound of air as it is heated by lightning.
 WEATHER rain thunder The explosive sound of air as it is heated by lightning. rainbow lightning hurricane They are intense storms with swirling winds up to 150 miles per hour. tornado cold front warm front
Fluid Circulation Review. Vocabulary. - Dark colored surfaces absorb more energy.
 Fluid Circulation Review Vocabulary Absorption - taking in energy as in radiation. For example, the ground will absorb the sun s radiation faster than the ocean water. Air pressure Albedo - Dark colored
Weather Notes. Chapter 16, 17, & 18
 Weather Notes Chapter 16, 17, & 18 Weather Weather is the condition of the Earth s atmosphere at a particular place and time Weather It is the movement of energy through the atmosphere Energy comes from
Atmosphere and Weather Revision Notes
 Atmosphere and Weather Revision Notes Atmosphere The blanket of gases that surrounds the Earth is called the atmosphere. The main gases are nitrogen (78 %), oxygen (21 %), water vapour, ozone and carbon
Unit: Weather Study Guide
 Name: Period: Unit: Weather Study Guide Define each vocabulary word on a separate piece of paper or index card. Weather Climate Temperature Wind chill Heat index Sky conditions UV index Visibility Wind
Status of Indian Satellite Meteorological Programme
 Status of Indian Satellite Meteorological Programme Pradeep K Thapliyal Space Applications Centre (SAC) Indian Space research Organisation (ISRO) Ahmedabad (INDIA) Email: pkthapliyal@sac.isro.gov.in International
Weather and Climate 1. Elements of the weather
 Weather and Climate 1 affect = to have an effect on, influence, change altitude = the height of a place above the sea axis = the line around which an object rotates certain = special consist of = to be
Advanced Hydrology. (Web course)
") Advanced Hydrology (Web course) Subhankar Karmakar Assistant Professor Centre for Environmental Science and Engineering (CESE) Indian Institute of Technology Bombay Powai, Mumbai 400 076 Email: skarmakar@iitb.ac.in
Advanced Hydrology (Web course) Subhankar Karmakar Assistant Professor Centre for Environmental Science and Engineering (CESE) Indian Institute of Technology Bombay Powai, Mumbai 400 076 Email: skarmakar@iitb.ac.in
Science 1206 Chapter 1 - Inquiring about Weather
 Science 1206 Chapter 1 - Inquiring about Weather 1.1 - The Atmosphere: Energy Transfer and Properties (pp. 10-25) Weather and the Atmosphere weather the physical conditions of the atmosphere at a specific
Ch. 3: Weather Patterns. Sect. 1: Air Mass & Fronts Sect. 2: Storms Sect. 3: Predicting the Weather
 Ch. 3: Weather Patterns Sect. 1: Air Mass & Fronts Sect. 2: Storms Sect. 3: Predicting the Weather Sect. 1: Air Masses & Fronts An air mass is a huge body of air that has similar temperature, humidity,
DEPARTMENT OF EARTH & CLIMATE SCIENCES SAN FRANCISCO STATE UNIVERSITY. Metr Fall 2014 Test #1 September 30, 2014
 DEPARTMENT OF EARTH & CLIMATE SCIENCES SAN FRANCISCO STATE UNIVERSITY NAME Metr 302.02 Fall 2014 Test #1 September 30, 2014 200 pts (4 pts each answer) Part I. Surface Chart Interpretation. Questions 1
Climate versus Weather
 Climate versus Weather What is climate? Climate is the average weather usually taken over a 30-year time period for a particular region and time period. Climate is not the same as weather, but rather,
N. K. Manglik Director
 N. K. Manglik Director Hydro-meteorological observations could be broadly defined as the scientific way for collection of flow data at a specific location along the river including selected meteorological
25.1 Air Masses. Section 25.1 Objectives
 Section 25.1 Objectives Explain how an air mass forms. List the four main types of air masses. Describe how air masses affect the weather of North America. Air Masses 25.1 Air Masses Differences in air
DEPARTMENT OF EARTH & CLIMATE SCIENCES Name SAN FRANCISCO STATE UNIVERSITY Nov 29, ERTH 360 Test #2 200 pts
 DEPARTMENT OF EARTH & CLIMATE SCIENCES Name SAN FRANCISCO STATE UNIVERSITY Nov 29, 2018 ERTH 360 Test #2 200 pts Each question is worth 4 points. Indicate your BEST CHOICE for each question on the Scantron
Update on SCOPE-Nowcasting Pilot Project Real Time Ocean Products Suman Goyal Scientist-E
 Update on SCOPE-Nowcasting Pilot Project Real Time Ocean Products Suman Goyal Scientist-E 19-22 Nov 2013 SCOPE-Nowcasting-1 Agenda Item 5 Pilot Projects Overview Users /Clients User requirements Product
DEPARTMENT OF GEOSCIENCES SAN FRANCISCO STATE UNIVERSITY. Metr Fall 2012 Test #1 200 pts. Part I. Surface Chart Interpretation.
 DEPARTMENT OF GEOSCIENCES SAN FRANCISCO STATE UNIVERSITY NAME Metr 356.01 Fall 2012 Test #1 200 pts Part I. Surface Chart Interpretation. Figure 1. Surface Chart for 1500Z 7 September 2007 1 1. Pressure
Foundations of Earth Science, 6e Lutgens, Tarbuck, & Tasa
 Foundations of Earth Science, 6e Lutgens, Tarbuck, & Tasa Weather Patterns and Severe Weather Foundations, 6e - Chapter 14 Stan Hatfield Southwestern Illinois College Air masses Characteristics Large body
WEATHER. Review Note Cards
 WEATHER Review Note Cards Thermometer Weather instrument that measures air temperature Units include F, C, and K ESRT 13 Sling Psychrometer Weather instrument that measures relative humidity and dewpoint
What a Hurricane Needs to Develop
 Weather Weather is the current atmospheric conditions, such as air temperature, wind speed, wind direction, cloud cover, precipitation, relative humidity, air pressure, etc. 8.10B: global patterns of atmospheric
Tuesday, September 13, 16
 Weather Weather State Objectives 4.c, 4.d, 4.h. Discussion What are some ways in which weather affects your everyday life? Discussion What are some ways in which weather affects your everyday life? What
Mid-Latitude Cyclones and Fronts. Lecture 12 AOS 101
 Mid-Latitude Cyclones and Fronts Lecture 12 AOS 101 Homework 4 COLDEST TEMPS GEOSTROPHIC BALANCE Homework 4 FASTEST WINDS L Consider an air parcel rising through the atmosphere The parcel expands as it
Earth Science Chapter 16 and 17. Weather and Climate
 Earth Science Chapter 16 and 17 Weather and Climate Prediction Old way Groundhog Color of the sky Modern way satellites instruments computers Goal Weather Factors Studied by meteorologists Several factors
Warming Earth and its Atmosphere The Diurnal and Seasonal Cycles
 Warming Earth and its Atmosphere The Diurnal and Seasonal Cycles Or, what happens to the energy received from the sun? First We Need to Understand The Ways in Which Heat Can be Transferred in the Atmosphere
Lecture 19: Operational Remote Sensing in Visible, IR, and Microwave Channels
 MET 4994 Remote Sensing: Radar and Satellite Meteorology MET 5994 Remote Sensing in Meteorology Lecture 19: Operational Remote Sensing in Visible, IR, and Microwave Channels Before you use data from any
By: J Malherbe, R Kuschke
 2015-10-27 By: J Malherbe, R Kuschke Contents Summary...2 Overview of expected conditions over South Africa during the next few days...3 Significant weather events (27 October 2 November)...3 Conditions
WATER IN THE ATMOSPHERE
 CHAPTER Y ou have already learnt that the air contains water vapour. It varies from zero to four per cent by volume of the atmosphere and plays an important role in the weather phenomena. Water is present
Aviation Hazards: Thunderstorms and Deep Convection
 Aviation Hazards: Thunderstorms and Deep Convection TREND Diagnosis of thunderstorm hazards using imagery Contents Satellite imagery Visible, infrared, water vapour Basic cloud identification Identifying
3 Severe Weather. Critical Thinking
 CHAPTER 2 3 Severe Weather SECTION Understanding Weather BEFORE YOU READ After you read this section, you should be able to answer these questions: What are some types of severe weather? How can you stay
AIR MASSES. Large bodies of air. SOURCE REGIONS areas where air masses originate
 Large bodies of air AIR MASSES SOURCE REGIONS areas where air masses originate Uniform in composition Light surface winds Dominated by high surface pressure The longer the air mass remains over a region,
Ch. 3: Weather Patterns
 Ch. 3: Weather Patterns Sect. 1: Air Mass & Fronts Sect. 2: Storms Sect. 3: Predicting the Weather Sect. 4: Weather forecasters use advanced technologies Ch. 3 Weather Fronts and Storms Objective(s) 7.E.1.3
Climate & Earth System Science. Introduction to Meteorology & Climate. Chapter 05 SOME OBSERVING INSTRUMENTS. Instrument Enclosure.
 Climate & Earth System Science Introduction to Meteorology & Climate MAPH 10050 Peter Lynch Peter Lynch Meteorology & Climate Centre School of Mathematical Sciences University College Dublin Meteorology
GEOGRAPHY EYA NOTES. Weather. atmosphere. Weather and climate
 GEOGRAPHY EYA NOTES Weather and climate Weather The condition of the atmosphere at a specific place over a relatively short period of time Climate The atmospheric conditions of a specific place over a
ATMOSPHERIC ENERGY and GLOBAL TEMPERATURES. Physical Geography (Geog. 300) Prof. Hugh Howard American River College
 Prof. Hugh Howard American River College") ATMOSPHERIC ENERGY and GLOBAL TEMPERATURES Physical Geography (Geog. 300) Prof. Hugh Howard American River College RADIATION FROM the SUN SOLAR RADIATION Primarily shortwave (UV-SIR) Insolation Incoming
ATMOSPHERIC ENERGY and GLOBAL TEMPERATURES Physical Geography (Geog. 300) Prof. Hugh Howard American River College RADIATION FROM the SUN SOLAR RADIATION Primarily shortwave (UV-SIR) Insolation Incoming
Wind direction measures in degrees Occasion described with codes, when is calm or variable wind. Explanation
 Introduction The searching results explanations of meteorological data Depending on the parameter, the instrumental measuring or visual observation method is used for the meteorological observations. Instrumentally
Weather is the of the Earth s atmosphere at a place and time. It is the movement of through the atmosphere o Energy comes from the
 Weather Notes Weather Weather is the of the Earth s atmosphere at a place and time It is the movement of through the atmosphere o Energy comes from the The sun is the force that weather The sun s energy
Use the terms from the following list to complete the sentences below. Each term may be used only once.
 Skills Worksheet Directed Reading Section: Air Masses Use the terms from the following list to complete the sentences below. Each term may be used only once. high pressure poles low pressure equator wind
ROLE OF SATELLITE DERIVED PRODUCTS IN MONITORING THE FOG AT JPNI AIRPORT PATNA
 ROLE OF SATELLITE DERIVED PRODUCTS IN MONITORING THE FOG AT JPNI AIRPORT PATNA *Giri R.K. 1, Devendra, Pradhan 2 and Sen A.K. 1 1 Meteorological Centre, Patna (Bihar)-India 2 Regional Meteorological Centre,
Guided Notes Weather. Part 1: Weather Factors Temperature Humidity Air Pressure Winds Station Models
 Guided Notes Weather Part 1: Weather Factors Temperature Humidity Air Pressure Winds Station Models. 1. What is weather? Weather: short-term atmospheric conditions in a specific area at a specific time
HYDROMET SERVICES FOR FLOOD FORECASTING. Dr. Surinder Kaur IMD, India, New Delhi
 HYDROMET SERVICES FOR FLOOD FORECASTING Dr. Surinder Kaur IMD, India, New Delhi Real Time Rainfall monitoring Hydromet Services Hyomet design Flood meteorological Services AWS=675 ARG=1289 Surface obs(dept)=
b. The boundary between two different air masses is called a.
 NAME Earth Science Weather WebQuest Part 1. Air Masses 1. Find out what an air mass is. http://okfirst.mesonet.org/train/meteorology/airmasses.html a. What is an air mass? An air mass is b. The boundary
Moisture, Clouds, and Precipitation: Clouds and Precipitation. Dr. Michael J Passow
 Moisture, Clouds, and Precipitation: Clouds and Precipitation Dr. Michael J Passow What Processes Lift Air? Clouds require three things: water vapor, a condensation nucleus, and cooling Cooling usually
WATER IN THE ATMOSPHERE
 WATER IN THE ATMOSPHERE I. Humidity A. Defined as water vapor or moisture in the air (from evaporation and condensation). B. The atmosphere gains moisture from the evaporation of water from oceans, lakes,
AFP Surveillance Bulletin - India Report for week 1, ending 5 January 2019
 Jan-18 Feb-18 Mar-18 Apr-18 May-18 Jun-18 Jul-18 Aug-18 Sep-18 Oct-18 Nov-18 Dec-18 Jan-19 Table 1: cases by month of paralysis onset, last 13 months State/UT's Total cases in cases as on week 1, cases
also known as barometric pressure; weight of the air above the surface of the earth; measured by a barometer air pressure, high
 Weather Vocabulary Vocabulary Term Meaning/Definition air mass * large bodies of air that have the similar properties throughout such as temperature, humidity, and air pressure; causes most of the weather
10.1 TEMPERATURE, THERMAL ENERGY AND HEAT Name: Date: Block: (Reference: pp of BC Science 10)
") 10.1 TEMPERATURE, THERMAL ENERGY AND HEAT Name: Date: Block: (Reference: pp. 424-435 of BC Science 10) kinetic molecular theory: explains that matter is made up of tiny that are constantly. These atoms
10.1 TEMPERATURE, THERMAL ENERGY AND HEAT Name: Date: Block: (Reference: pp. 424-435 of BC Science 10) kinetic molecular theory: explains that matter is made up of tiny that are constantly. These atoms
Unit 4 Review Guide: Weather
 Unit 4 Review Guide: Weather Weather: The condition of the atmosphere at a specific time and place. Freezing: To become hardened into ice or into a solid body Deposition: The change in state of matter
How to display RGB imagery by SATAID
 How to display RGB imagery by SATAID Akihiro SHIMIZU Meteorological Satellite Center (MSC), Japan Meteorological Agency (JMA) Ver. 2015110500 RGB imagery on SATAID SATAID software has a function of overlapping
Go With the Flow From High to Low Investigating Isobars
 Go With the Flow From High to Low Investigating Isobars Science 10 Mrs. Purba Air Masses The air over a warm surface can be heated, causing it to rise above more dense air. The result is the formation
Week: Dates: 3/2 3/20 Unit: Climate
 clementaged.weebly.com Name: EVEN Period: Week: 28 30 Dates: 3/2 3/20 Unit: Climate Monday Tuesday Wednesday Thursday Friday 2 O 3 E *Vocabulary *Water in the Atmosphere and Clouds Notes *Cloud Drawings
Evidence for Weakening of Indian Summer Monsoon and SA CORDEX Results from RegCM
 Evidence for Weakening of Indian Summer Monsoon and SA CORDEX Results from RegCM S K Dash Centre for Atmospheric Sciences Indian Institute of Technology Delhi Based on a paper entitled Projected Seasonal
Figure 1. Idealized global atmospheric circulation (C = surface convergence, D = surface divergence).
.") page - Laboratory Exercise #8 - Introduction to Atmospheric Science: Global Circulation and Weather Makers Section A - Global Atmospheric Circulation: To understand weather you need to understand how the
page - Laboratory Exercise #8 - Introduction to Atmospheric Science: Global Circulation and Weather Makers Section A - Global Atmospheric Circulation: To understand weather you need to understand how the
Analysis of Heavy Precipitation Events Over Western Himalayan Region
 INTERNATIONAL JOURNAL OF EARTH AND ATMOSPHERIC SCIENCE Journal homepage: www.jakraya.com/journal/ijeas Analysis of Heavy Precipitation Events Over Western Himalayan Region B.P. Yadav, Naresh Kumar and
National Meteorological Library and Archive
 National Meteorological Library and Archive Fact sheet No. 4 Climate of the United Kingdom Causes of the weather in the United Kingdom The United Kingdom lies in the latitude of predominately westerly
1 What Is Climate? TAKE A LOOK 2. Explain Why do areas near the equator tend to have high temperatures?
 CHAPTER 17 1 What Is Climate? SECTION Climate BEFORE YOU READ After you read this section, you should be able to answer these questions: What is climate? What factors affect climate? How do climates differ
Radiative Transfer Model based Bias Correction in INSAT-3D/3DR Thermal Observations to Improve Sea Surface Temperature Retrieval
 Radiative Transfer Model based Bias Correction in INSAT-3D/3DR Thermal Observations to Improve Sea Surface Temperature Retrieval Rishi K Gangwar, Buddhi P Jangid, and Pradeep K Thapliyal Space Applications
Lecture #14 March 29, 2010, Monday. Air Masses & Fronts
 Lecture #14 March 29, 2010, Monday Air Masses & Fronts General definitions air masses source regions fronts Air masses formation types Fronts formation types Air Masses General Definitions a large body
UNIT 1. WEATHER AND CLIMATE. PRIMARY 4/ Social Science Pedro Antonio López Hernández
 UNIT 1. WEATHER AND CLIMATE PRIMARY 4/ Social Science Pedro Antonio López Hernández LAYERS OF THE ATMOSPHERE The atmosphere is a mixture of gases that surround Earth and separate it from the rest of the
4 Forecasting Weather
 CHAPTER 16 4 Forecasting Weather SECTION Understanding Weather BEFORE YOU READ After you read this section, you should be able to answer these questions: What instruments are used to forecast weather?
Geographical location and climatic condition of the
 Geographical location and climatic condition of the study sites North eastern region of India is comprised of eight states namely; Arunachal Pradesh, Assam, Manipur, Meghalaya, Mizoram, Nagaland, Sikkim
Copyright 2015 Edmentum All rights reserved.
 Copyright 2015 Edmentum All rights reserved. weather 1 1. Sharon woke up on a sunny morning and ate breakfast. Then she looked outside and saw tall, quickly forming clouds. The clouds looked ready to rain.
Forecasting Local Weather
 Forecasting Local Weather Sea/Land Breeze Temperature Dew Fog Frost Snow Thunderstorms Tropical Cyclones Temperatures: Radiation Balance Typical Diurnal Variation of Temperature Min soon after dawn Temp
Understanding Weather and Climate Risk. Matthew Perry Sharing an Uncertain World Conference The Geological Society, 13 July 2017
 Understanding Weather and Climate Risk Matthew Perry Sharing an Uncertain World Conference The Geological Society, 13 July 2017 What is risk in a weather and climate context? Hazard: something with the
3) What is the difference between latitude and longitude and what is their affect on local and world weather and climate?
 What is the difference between latitude and longitude and what is their affect on local and world weather and climate?") www.discoveryeducation.com 1) Describe the difference between climate and weather citing an example of each. Describe how water (ocean, lake, river) has a local effect on weather and climate and provide
www.discoveryeducation.com 1) Describe the difference between climate and weather citing an example of each. Describe how water (ocean, lake, river) has a local effect on weather and climate and provide
Created by Mrs. Susan Dennison
 Created by Mrs. Susan Dennison 2015-2015 The atmosphere is a layer of invisible gas (air) that surrounds the Earth. It wraps around the planet like a blanket. All weather happens in the lower atmosphere.
Mr. P s Science Test!
 WEATHER- 2017 Mr. P s Science Test! # Name Date 1. Draw and label a weather station model. (10 pts) 2. The is the layer of the atmosphere with our weather. 3. Meteorologists classify clouds in about different
ESCI 344 Tropical Meteorology Lesson 7 Temperature, Clouds, and Rain
 ESCI 344 Tropical Meteorology Lesson 7 Temperature, Clouds, and Rain References: Forecaster s Guide to Tropical Meteorology (updated), Ramage Tropical Climatology, McGregor and Nieuwolt Climate and Weather
Numerical Simulation of a Severe Thunderstorm over Delhi Using WRF Model
 International Journal of Scientific and Research Publications, Volume 5, Issue 6, June 2015 1 Numerical Simulation of a Severe Thunderstorm over Delhi Using WRF Model Jaya Singh 1, Ajay Gairola 1, Someshwar
On my honor, I have neither given nor received unauthorized aid on this examination.
 PHYSICS DEPARTMENT MET 1010 Final Exam December 18, 2008 Name (print): Signature: On my honor, I have neither given nor received unauthorized aid on this examination. YOUR TEST NUMBER IS THE 5-DIGIT NUMBER
Storm and Storm Systems Related Vocabulary and Definitions. Magnitudes are measured differently for different hazard types:
 Storm and Storm Systems Related Vocabulary and Definitions Magnitude: this is an indication of the scale of an event, often synonymous with intensity or size. In natural systems, magnitude is also related
ATMOSPHERIC CIRCULATION AND WIND
 ATMOSPHERIC CIRCULATION AND WIND The source of water for precipitation is the moisture laden air masses that circulate through the atmosphere. Atmospheric circulation is affected by the location on the
INSAT-3D PRODUCTS FOR THE MONSOON MONITORING and APPLICATIONS
 INSAT-3D PRODUCTS FOR THE MONSOON MONITORING and APPLICATIONS Ashim Kumar Mitra 23-24 February 2016 National Satellite Meteorological Center, India Meteorological Department, New Delhi-110003 Current Indian
Remote Sensing in Meteorology: Satellites and Radar. AT 351 Lab 10 April 2, Remote Sensing
 Remote Sensing in Meteorology: Satellites and Radar AT 351 Lab 10 April 2, 2008 Remote Sensing Remote sensing is gathering information about something without being in physical contact with it typically
5 Atmospheric Disturbances 7 1.Cyclones- tropical and temperate and associated weather conditions. 2.Anticyclones and associated weather conditions.
 5 Atmospheric Disturbances 7 1.Cyclones- tropical and temperate and associated weather conditions. 2.Anticyclones and associated weather conditions. atmospheric disturbances (weather systems) that are
The Climatology of Clouds using surface observations. S.G. Warren and C.J. Hahn Encyclopedia of Atmospheric Sciences.
 The Climatology of Clouds using surface observations S.G. Warren and C.J. Hahn Encyclopedia of Atmospheric Sciences Gill-Ran Jeong Cloud Climatology The time-averaged geographical distribution of cloud
5) Water vapor is water in the state. a. solid b. liquid c. *gas
 Water vapor is water in the state. a. solid b. liquid c. *gas") 1 NAME DATE January 15, 2004_ GRADE 5 SCIENCE SOL REVIEW WEATHER LABEL the 3 stages of the water cycle ( evaporation, condensation, precipitation.). 1) The sketch above shows: a. a life cycle. b. *the
1 NAME DATE January 15, 2004_ GRADE 5 SCIENCE SOL REVIEW WEATHER LABEL the 3 stages of the water cycle ( evaporation, condensation, precipitation.). 1) The sketch above shows: a. a life cycle. b. *the