Arizona Climate Summary September 2018 Summary of conditions for August 2018
|
|
|
- Leslie Parker
- 5 years ago
- Views:
Transcription


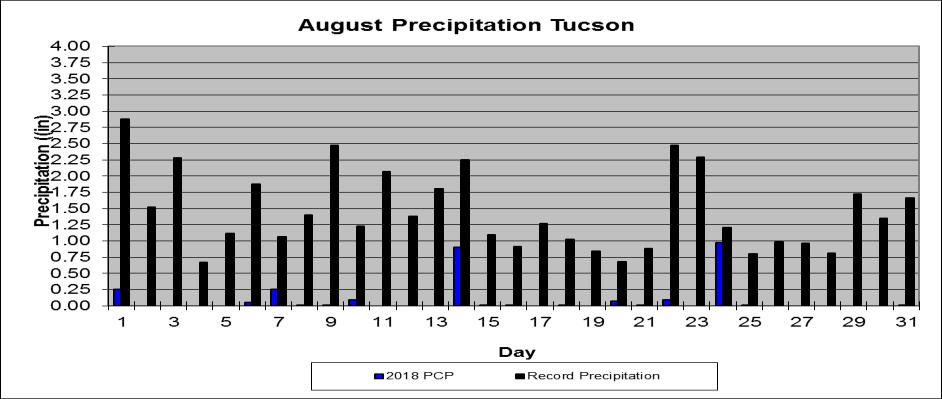
1 August 2018 Temperature and Precipitation Summary Arizona Climate Summary September 2018 Summary of conditions for August 2018 August 1 st 15 th : August began with high pressure centered over the state and scattered rain showers.. Rain fell every day somewhere in the state through the 27 th of the month. During the first 5 days, the rainfall totals included 0.31 at Bisbee-Douglas, 1.11 at Flagstaff, 0.24 at the Grand Canyon, 0.49 at Kingman, 0.11 at Page, 0.05 at Phoenix Airport, 1.05 at Prescott, 0.92 at Sonora Desert Museum, 0.26 at Tucson Airport, 0.34 at Window Rock, 0.23 at Winslow, 0.20 at Cottonwood, 0.55 at Douglas, 0.13 at Eloy, 0.02 at Payson, 0.28 at Seligman and 0.19 at Show Low. Daily rainfall amounts picked up significantly through the 15 th with 0.50 at Bisbee-Douglas on the 6 th -7 th, 1.10 at Coronado on the 8 th, 1.06 at Pinnacle Peak on the 9 th, 2.01 at East Mesa on the 10 th, 2.80 at Carefree on the 11 th, 0.29 at Coronado NM and Phantom Ranch on the 12 th, 0.54 at Flagstaff on the 13 th, 1.31 at Flagstaff on the 14 th, and 1.07 at Safford on the 15 th. Daytime temperatures during the first week of August ranged from 111 to 114 o F in the southwest deserts and 79 to 88 o F at the higher elevations. Nighttime temperatures ranged from mid 70s to 91 o F in the southwest deserts 55 to 66 o F at the higher elevations. Both daytime and nighttime temperatures cooled off 5 to 10 degrees during the 2 nd week of August as storms became more widespread. August 16 th 31 st : Monsoon activity continued through the 27 th. From the 16 th through the 20 th, daily totals were less than 0.75 and daytime temperatures ranged from 102 to 110 o F in the southwest deserts and low to mid 50s in the higher elevations. Daily rainfall totals increased on the 21 st through the 25 th, with 0.85 at Grand Canyon Airport on the 21 st, 0.97 at the Grand Canyon North Rim on the 22 nd, 1.58 at Seligman on the 23 rd, 1.31 at Carefree on the 24 th, and 0.98 at Tucson on the 25 th. By the 28 th, the high pressure had moved to the east over Texas and dry air moved into the state. Rainfall the rest of the month was very light and spotty. No rainfall was reported on the 28 th or 29 th, and the heaviest rainfall was reported at Coronado National Monument, 0.05 on the 30 th and 0.02 on the 31 st. High temperatures ranged from 106 to 108 o Fin the deserts and 66 to 77 o F at the higher elevations. In This Issue: Overview of August, graphs of the August daily maximum and minimum temperatures, precipitation, mean daily dew points for Flagstaff, Phoenix, and Tucson; August climate statistics, maps of mean monthly maximum and minimum temperatures, precipitation, dew points, wind speeds for August; short-term drought maps for the beginning and end of August 2018; Long-term Drought Map through August and graphs of the mean August temperature and precipitation for the period of record for Tucson, Phoenix, and Flagstaff, graphs of the cumulative precipitation for the calendar year for Flagstaff, Phoenix, and Tucson. Climate calendars for Flagstaff, Phoenix, Tucson, Prescott, Winslow and Yuma, including daily and monthly normals and extremes, for each month of the year, are not yet updated through See p.21 of this report for calendar abbreviations. Data are preliminary and are from the National Weather Service Forecast Offices in Flagstaff, Phoenix and Tucson. **Note: The discrepancy between the Statewide Temperature and Precipitation values for Phoenix, Flagstaff and Tucson and the daily values in their graphs are due to the reporting times. Statewide Temperature and Precipitation values are taken at 5pm, while official daily records at the airports are taken from Midnight to Midnight. Dr. Nancy J. Selover, State Climatologist Edited by Nancy J. Selover 2018 Arizona State Climate Office 1


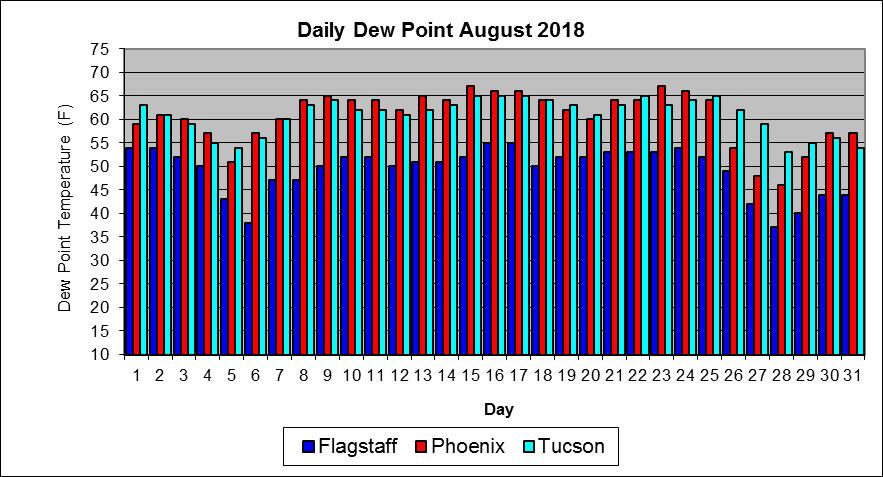
2 August 2018 Daily Temperature, Precipitation, & Dew Point for Flagstaff, Phoenix, and Tucson 2
3 3
4 FLAGSTAFF CLIMATE STATISTICS August 2018 This August was tied for 26 th warmest with 3 other years (1934, 1946, 1981) and was the 10 th wettest on record. Avg Max Temp(F) 79.4 Normal 78.4 Avg Min Temp(F) 51.5 Normal 50.1 Avg Mean Temp(F) 65.4 Normal 64.2 Departure from Normal (F) +1.2 Highest Monthly Avg Temp (F) 67.5 in 1944 Lowest Monthly Avg Temp (F) 59.5 in 1968 Highest Temp this month (F): 88 on 6 th & 7 th Lowest Temp this month (F): 44 on 28 th Record High (F): 93 on 8/02/1902 Record Low (F): 32 on 8/23/1968 Temperature or precipitation records this month: 14 th Precip 1.31 set, previous record 1.10 in 1909 Flagstaff Number of Days of: Minimum Temp 55 o F or higher 6 Minimum Temp 50 o F or lower 9 Maximum Temp 85 o F or higher 4 Maximum Temp 75 o F or lower 8 Heating Degree Days 35 Normal 56 Cooling Degree Days 57 Normal 33 Degree base 65 o F Total August Precipitation 5.15 Normal August Precipitation 3.11 Departure from normal Greatest 24-Hr Precipitation 1.31 on 14 th Total Precipitation Year-to-Date Departure from Normal Total August Snowfall 0.0 Normal 0.0 Record August Snowfall 0.0 Number of Days: Clear 26 Partly Cloudy 5 Cloudy 0 Greatest August Precipitation 8.77 in 1904 Least August Precipitation: 0.26 in Average Wind Speed Highest Peak Gust 5.2 mph 37 mph from 200 o on 21 st PHOENIX CLIMATE STATISTICS August 2018 This August was tied for 21 st warmest on record with 2 other years (2010, 2017) and the 26 th wettest on record. Avg Max Temp(F) Normal Avg Min Temp(F) 83.1 Normal 82.7 Avg Mean Temp (F) 94.0 Normal 93.6 Departure from Normal (F) +0.4 Highest Monthly Avg Temp (F) 98.3 in 2011 Lowest Monthly Avg Temp (F) 84.6 in 1918 Highest Temp this month (F) 114 on 6 th Lowest Temp this month (F): 72 on 10 th Record High (F): 117 on 8/14/2015, 8/26/2011 Record Low (F): 58 on 8/20/ Temperature or precipitation records this month: 4 th HiMin 91 set, previous record 90 in th HiMax 114 tied, first set in th Precip 0.56 set, previous record 0.32 in th HiMin 90 set, previous record 88 in 2007 Phoenix Number of Days of: Minimum Temp 80 o F or lower 11 Minimum Temp 90 o F or higher 4 Maximum Temp 100 o F or lower 4 Maximum Temp 110 o F or higher 7 Heating Degree Days 0 Normal 0 Cooling Degree Days 907 Normal 885 Degree base 65 o F Total August Precipitation 1.50 Normal August Precipitation 1.00
5 Departure from normal Greatest 24-Hr Precipitation 0.56 on 10th Total Precipitation Year-to-Date 2.97 Departure from Normal Greatest August Precipitation 5.33 in 1951 Least August Precipitation 0.00 in 1973, 1975, 2002 Number of Days: Clear 12 Partly Cloudy 19 Cloudy 0 Average Wind Speed 7.4 mph Highest Peak Gust 64 mph from 50 o on 8 th TUCSON CLIMATE STATISTICS August 2018 This August was tied for 15 th warmest on record with 1998 and had no significant ranking for precipitation. Avg Max Temp(F) 98.0 Normal 97.4 Avg Min Temp(F) 75.0 Normal 73.3 Avg Mean Temp(F) 86.5 Normal 85.3 Departure from Normal (F) +1.2 Highest Monthly Avg Temp (F) 90.2 in 1994 Lowest Monthly Avg Temp (F) 80.8 in 1923 Highest Temp this month (F): Lowest Temp this month (F): Record High (F): 112 on 8/01/1993 Record Low (F): 55 on 8/20/ on 6 th 68 on 24 th Temperature or precipitation records this month: 5 th HiMin 84 tied, first set in th HiMax 109 tied, first set in 1995 Tucson Number of Days of: Minimum Temp 70 o F or lower 3 Minimum Temp 80 o F or higher 5 Maximum Temp 95 o F or lower 11 Maximum Temp 105 o F or higher 6 Heating Degree Days 0 Normal 0 Cooling Degree Days 671 Normal 631 Degree base 65 o F Total August Precipitation 2.71 Normal August Precipitation 2.39 Departure from normal Greatest 24-Hr Precipitation 0.98 on 24 th Total Precipitation Year-to-Date 7.86 Departure from Normal Greatest August Precipitation 7.93 in 1955 Least August Precipitation 0.08 in 1924 Number of Days: Clear Partly Cloudy Cloudy Average Wind Speed Highest Peak Gust M M M 6.7 mph 60 mph from 230 o on 1 st Data are from the National Weather Service and the National Climatic Data Center and are preliminary. 5
6 Wind Speeds for August: Day Phoenix Flagstaff Tucson (mph) Avg Max Avg Max Avg Max Dew Points for August: Daily Average Dew Point ( o F): Day Flg Phx Tuc
7 The 7
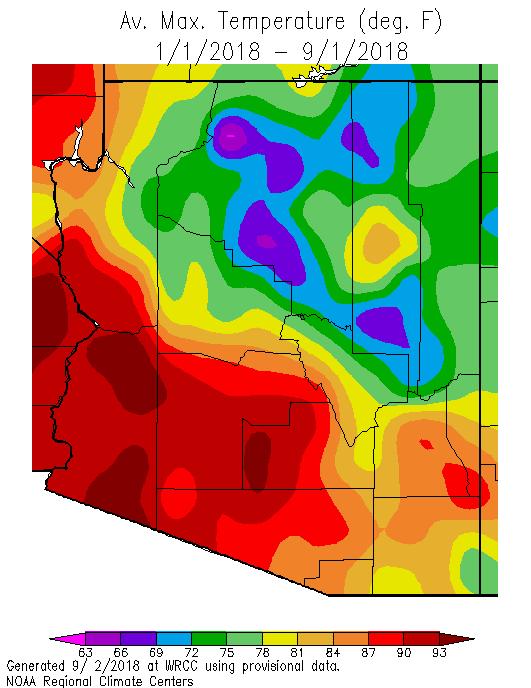
8 August 2018 The minimum temperatures ranged from 30 o F at Meteor Crater and Hannagan Meadow to 79 o F at Goodyear Airport. The lowest maximum temperature of 74 o F was recorded at Snowslide Canyon and the highest was 120 o F at Havasu. The highest rainfall totals were 7.40 at Kitt Peak and 7.08 at Prescott. The lowest average dew point was 40 o F at Flagstaff and the highest was 66 o F at Coolidge and Sahuarito. The highest peak wind gust was 53 mph at Mesa and 51 at Maricopa. Average wind speeds ranged from 3 mph in many locations to 13 mph at Kingman. 8

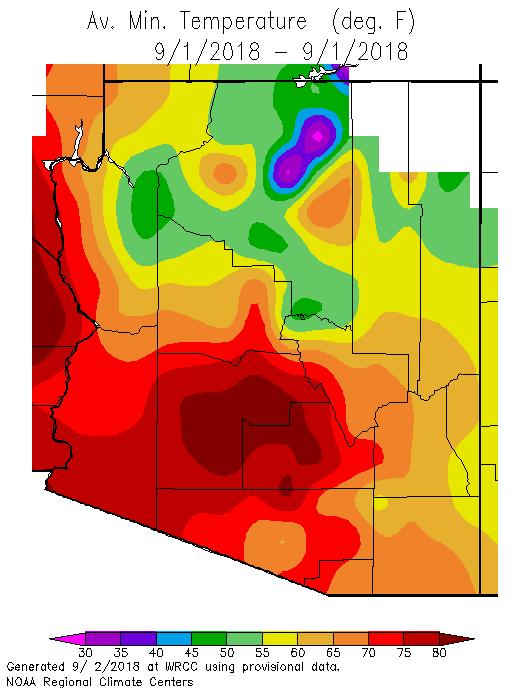
9 T August 2018 The highest average minimum temperature was 87 o F at Laughlin-Bullhead City, and the lowest average minimum temperature was 40 o F at the east entrance to the Grand Canyon. The highest average maximum temperature was 112 o F at Bullhead City and Havasu and the lowest average maximum temperature was 67 o F at Snowslide Canyon. 9
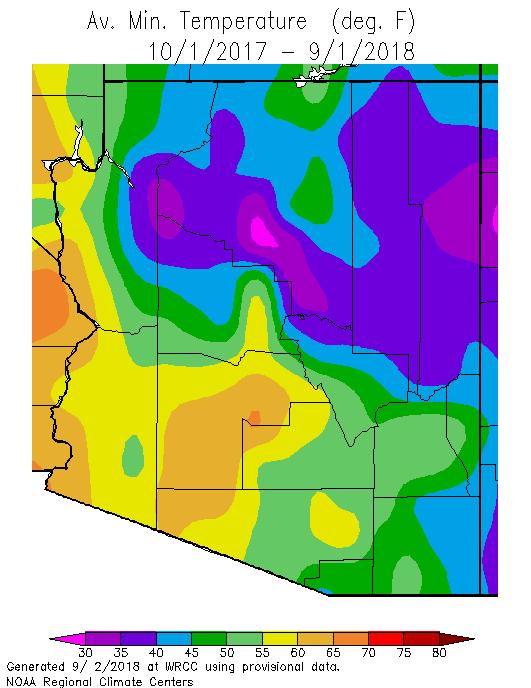
 along the Maricopa/Gila County border and reduction of Extreme Drought (D3) in central Maricopa and")
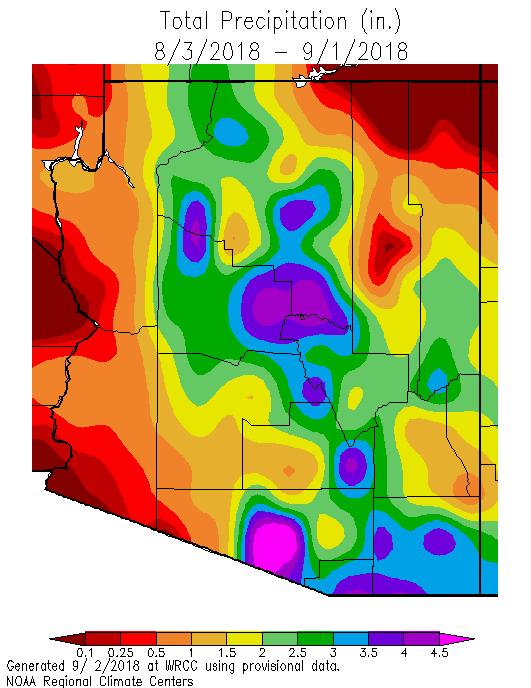
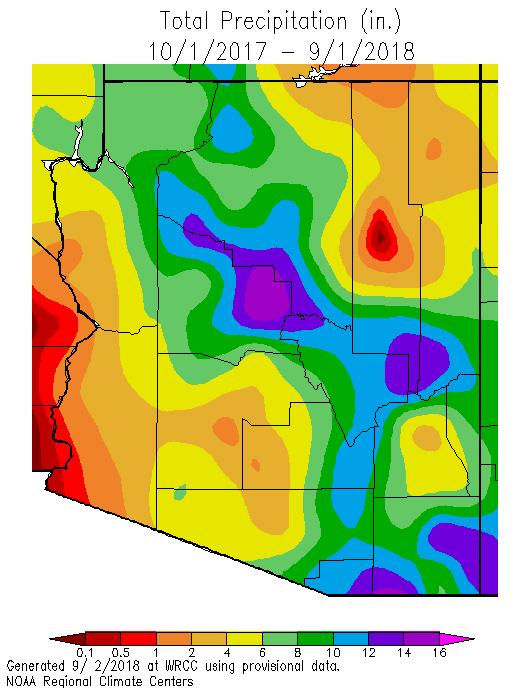
10 Short term drought maps for July 31 st on left and August 28 th on right. The monsoon activity in central and southern Arizona has led to removal of Exceptional Drought (D4) along the Maricopa/Gila County border and reduction of Extreme Drought (D3) in central Maricopa and western Pinal and Pima counties. Exceptional Drought (D4) dropped from 10.55% of the state to 8.62%. Extreme Drought has been reduced from 47% to 40%. While monsoon precipitation has benefitted northern and eastern Arizona, the greatest improvement has been in southeastern Arizona which was the big loser during the winter wet season. 10
.")
11 The long-term drought map for August shows hydrologic drought, and this month it is based on precipitation and evaporation using the Standardized Precipitation Evaporative Index (SPEI) over the past 24-, 36-, and 48- months. This depiction is for water resources, not short-term drought (rangeland conditions). Though much of Coconino and northern Mohave County show up as abnormally dry or moderate drought, there are significant water resource issues, such as wells going dry and water hauling. A few small areas in Mohave and southwestern La Paz County show No Drought (white), but this is due to a lack of data around those locations. 11
12 12

13 August August minimum temperatures were 0-2 o F warmer than average across most of the state with a couple of cooler than normal spots in southern Navajo and Apache counties, eastern Gila County, and the Yavapai/Coconino/Gila County borders. Northern Coconino and southern Mohave counties were 2-6 degrees warmer than normal. Daytime temperatures have been 1-4 o F warmer than average across northern and southeastern Arizona. South Central Arizona has been 0-3 o F cooler than average, largely due to storm events. Rainfall has been much greater than average across central Arizona, but less than average in eastern and western Arizona. 13
14 14
15 Calendar Year 2018 Calendar year minimum temperatures across Arizona have been 1 to 3 o F warmer than average, though a few spots have been slightly cooler than average. Daytime temperatures have been 1 to 3 o F warmer than average in southern Arizona and 2-5 o F warmer than average in the northern half of the state. In spite of the wet August in central Arizona, this area, along with northeastern and southwestern Arizona, has received less than 70% of average precipitation. A few spots have received near average or above average precipitation this calendar year. 15
16 16

17 s aham, Cochise, La Paz, OPima and 2018 Water Year Water Year 2018 minimum temperatures have ranged from 1-3 o F warmer than average in central and southern Arizona and Coconino County, while Apache, Navajo, and La Paz counties have had some cooler than average temperatures. Daytime temperatures in the state have been 2 to 6 o F warmer than average mostly due to the lack of cold winter storms. The monsoon rainfall has not yet been enough to make up for the significant deficits left by the dry fall, winter and spring.. Most of the state has still received less than 70% of normal precipitation and many areas have received less than 50%. Only September remains to make up this deficit. 17


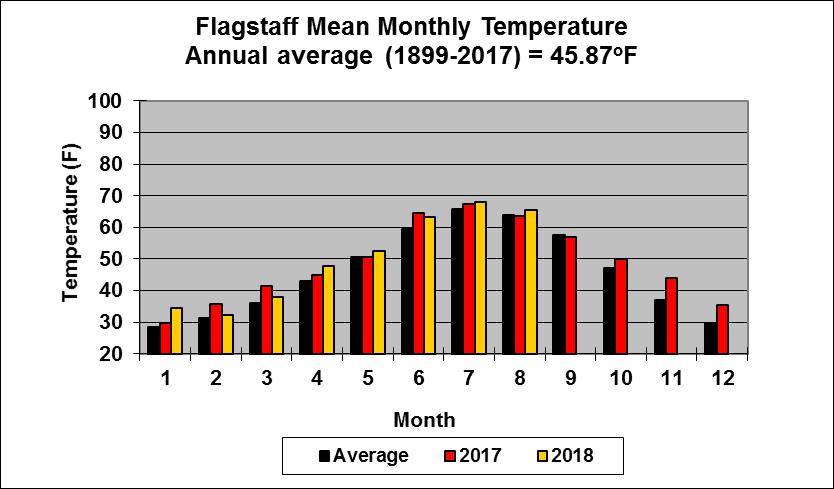
18 August Mean Temperature Graphs Flagstaff, Phoenix, and Tucson : 18
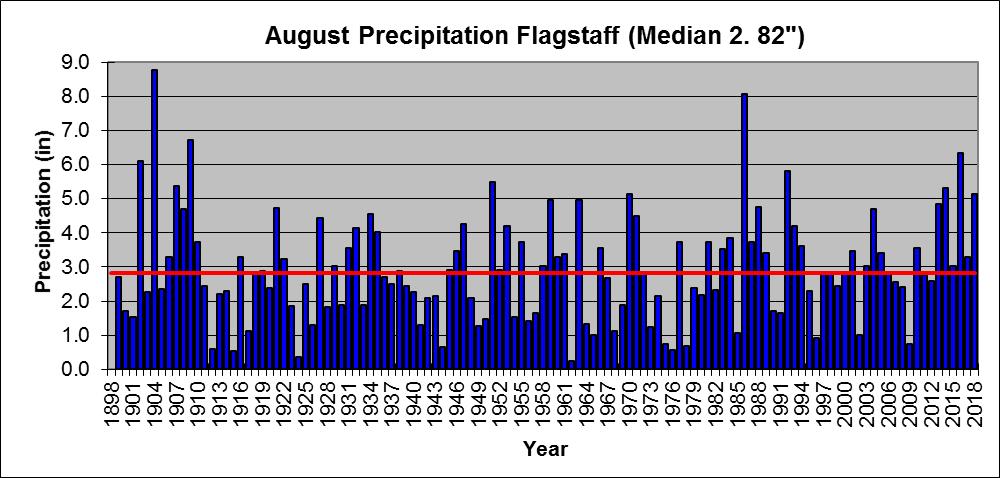
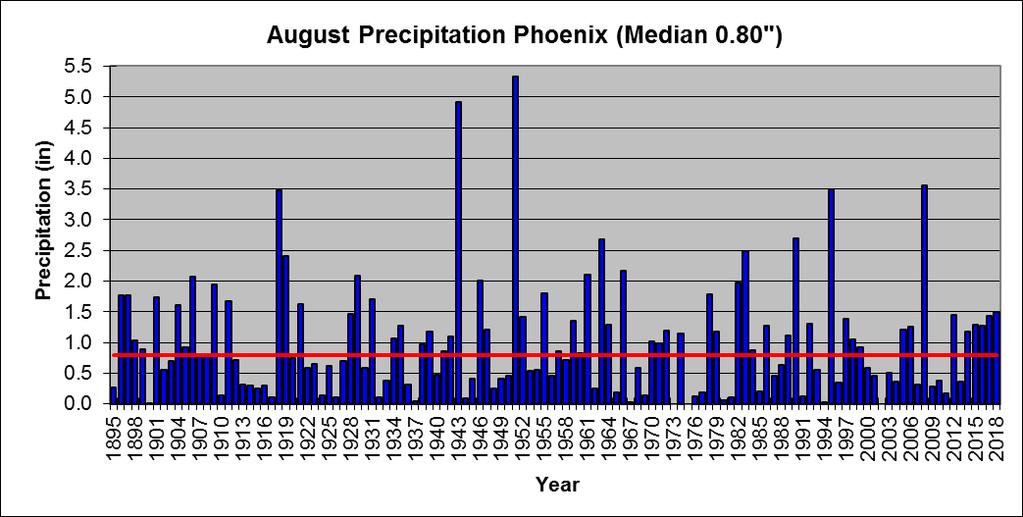
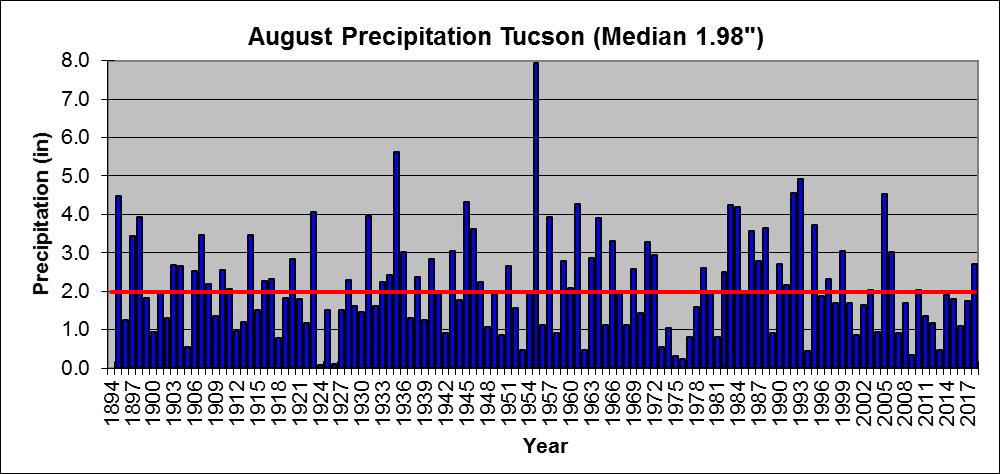
19 August Precipitation Graphs Flagstaff, Phoenix, and Tucson


20 2018 Cumulative Precipitation Graphs Flagstaff, Phoenix and Tucson: Flagstaff is 0.17 above normal, Phoenix is 2.31 below normal, and Tucson is 0.05 below normal. 20
 LO MAX = Lowest maximum temperature for that day (F) LO MIN = Lowest minimum temperature for that day (F) HI")
21 The downloadable normals and extremes calendars use the following abbreviations: NORM = 30 year ( ) average value (degrees Fahrenheit (F)) OBS = The temperature observation for that day this year AVG = Average daily temperature HI MAX = Highest maximum temperature for that day (F) LO MAX = Lowest maximum temperature for that day (F) LO MIN = Lowest minimum temperature for that day (F) HI MIN = Highest minimum temperature for that day (F) Mx PCP = Maximum precipitation for that day (inches) Mx SNO = Maximum snowfall for that day (inches) 21
Arizona Climate Summary October 2018 Summary of conditions for September 2018
 Arizona Climate Summary October 2018 Summary of conditions for September 2018 September 2018 Temperature and Precipitation Summary September 1 st 17 th : The wet pattern from August continued into September
Arizona Climate Summary September 2017 Summary of conditions for August 2017
 August 2017 Temperature and Precipitation Summary Arizona Climate Summary September 2017 Summary of conditions for August 2017 August 1 st 15 th : The monsoon activity that ended July continued into the
Arizona Climate Summary February 2018 Summary of conditions for January 2018
 Arizona Climate Summary February 2018 Summary of conditions for January 2018 January 2018 Temperature and Precipitation Summary January 1 st 19 th : The new year began with a ridge of high pressure over
Arizona Climate Summary November 2018 Summary of conditions for October 2018
 Arizona Climate Summary November 2018 Summary of conditions for October 2018 October 2018 Temperature and Precipitation Summary October 1 st 15 th : The 2018 water year ending September 30 th was exceptionally
Arizona Climate Summary April 2018 Summary of conditions for March 2018
 Arizona Climate Summary April 2018 Summary of conditions for March 2018 March 2018 Temperature and Precipitation Summary March 1 st 16 th : March began with rainfall in southeastern Arizona as the tail
Arizona Climate Summary
 Arizona Climate Summary August 2016 Summary of conditions for July 2016 July 2016 Temperature and Precipitation Summary July 1 st 15 th : As June ended and July began, a shortwave moved through the southwest
Arizona Climate Summary December 2016 Summary of conditions for November 2016
 Arizona Climate Summary December 2016 Summary of conditions for November 2016 November 2016 Temperature and Precipitation Summary November 1 st 16 th : November began with a dry low pressure system moving
Arizona Climate Summary June 2017 Summary of conditions for May 2017
 Arizona Climate Summary June 2017 Summary of conditions for May 2017 May 2017 Temperature and Precipitation Summary May 1 st 16 th : A strong ridge of high pressure developed over the southwest during
Arizona Climate Summary November 2016 Summary of conditions for October 2016
 Arizona Climate Summary November 2016 Summary of conditions for October 2016 October 2016 Temperature and Precipitation Summary October 1 st 16 th : October began with high pressure over Mexico, bringing
Arizona Climate Summary November 2015 Summary of conditions for October 2015
 October 2015 Temperature and Precipitation Summary Arizona Climate Summary November 2015 Summary of conditions for October 2015 October 1 st 14 th : October began with high pressure over the southwest,
Arizona Climate Summary December 2017 Summary of conditions for November 2017
 November 2017 Temperature and Precipitation Summary Arizona Climate Summary December 2017 Summary of conditions for November 2017 November 1 st 17 th : October ended with a little bit of precipitation
Arizona Climate Summary
 August 2015 Temperature and Precipitation Summary Arizona Climate Summary September 2015 Summary of conditions for August 2015 August 1 st 16 th : August was a wet month across the state with only 3 days
Arizona Climate Summary January 2017 Summary of conditions for December 2016
 Arizona Climate Summary January 2017 Summary of conditions for December 2016 December 2016 Temperature and Precipitation Summary December 1 st 15 th : Similar to November, December began with a dry trough
Arizona Climate Summary July 2015 Summary of conditions for June 2015
 June 2015 Temperature and Precipitation Summary Arizona Climate Summary July 2015 Summary of conditions for June 2015 June 1 st 14 th : Similar to May, June began with high pressure in the west, and conditions
Arizona Climate Summary May 2015 Summary of conditions for April 2015
 Arizona Climate Summary May 2015 Summary of conditions for April 2015 April 2015 Temperature and Precipitation Summary April 1 st 16 th : April began with very light showers in Nogales and Coronado National
Arizona Climate Summary
 April 2016 Temperature and Precipitation Summary Arizona Climate Summary May 2016 Summary of conditions for April 2016 April 1 st 15 th : April 1 st saw the tail end of a low pressure system move out of
Arizona Climate Summary October 2015 Summary of conditions for September 2015
 September 2015 Temperature and Precipitation Summary Arizona Climate Summary October 2015 Summary of conditions for September 2015 September 1 st 18 th : September began with high pressure over southern
Arizona Climate Summary August 2013
 Arizona Climate Summary August 2013 Summary of conditions for July 2013 July 2013 Temperature and Precipitation Summary July 1 st 16 th : To start off the month of July, a high pressure system came in
Arizona Climate Summary November 2017 Summary of conditions for October 2017
 Arizona Climate Summary November 2017 Summary of conditions for October 2017 October 2017 Temperature and Precipitation Summary October 1 st 18 th : A low pressure system from the northwestern U.S. moved
Arizona Climate Summary May 2018 Summary of conditions for April 2018
 April 2018 Temperature and Precipitation Summary Arizona Climate Summary May 2018 Summary of conditions for April 2018 April 1 st 16 th : April was a very dry month across Arizona. Several low pressure
Arizona Climate Summary October 2016 Summary of conditions for September 2016
 September 2016 Temperature and Precipitation Summary Arizona Climate Summary October 2016 Summary of conditions for September 2016 September 1 st 14 th : High pressure over the Four Corners brought rainfall
Arizona Climate Summary
 May 2015 Temperature and Precipitation Summary Arizona Climate Summary June 2015 Summary of conditions for May 2015 May 1 st 14 th : May began with high pressure in the west, and May 1 st was dry statewide,
Arizona Climate Summary October 2013
 Arizona Climate Summary October 2013 Summary of conditions for September 2013 September 2013 Temperature and Precipitation Summary September 1 st 16 th : With moist conditions still present throughout
Arizona Climate Summary February 2016 Summary of conditions for January 2016
 January 2016 Temperature and Precipitation Summary Arizona Climate Summary February 2016 Summary of conditions for January 2016 January 1 st 14 th : The new year began with high pressure over the southwest
Arizona Climate Summary November 2013
 Arizona Climate Summary November 2013 Summary of conditions for October 2013 October 2013 Temperature and Precipitation Summary October 1 st 16 th : The month of October started off with fair weather conditions
Arizona Climate Summary May 2012
 Arizona Climate Summary May 2012 Summary of conditions for April 2012 April 2012 Temperature and Precipitation Summary April 1 st 16 th : Although April began with another low pressure system sweeping
Arizona Climate Summary February 2012
 Arizona Climate Summary February 2012 Summary of conditions for January 2012 January 2012 Temperature and Precipitation Summary January 1 st 20 th : The New Year has started on a very dry note. The La
Arizona Climate Summary
 Arizona Climate Summary April 2014 Summary of conditions for March 2014 March 2014 Temperature and Precipitation Summary March 1 st 16 th : We started off the month of March with a significant precipitation
Arizona Climate Summary June 2013
 Arizona Climate Summary June 2013 Summary of conditions for May 2013 May 2013 Temperature and Precipitation Summary May 1 st 16 th : May began with above normal daily temperatures and breezy conditions
Arizona Climate Summary September 2014 Summary of conditions for August 2014
 Arizona Climate Summary September 2014 Summary of conditions for August 2014 August 2014 Temperature and Precipitation Summary August 1 st 16 th : The first 5 days of August were quite wet with high pressure
Arizona Climate Summary
 Arizona Climate Summary March 2014 Summary of conditions for February 2014 February 2014 Temperature and Precipitation Summary February 1 st 16 th : We started off the month of February with some moisture
Arizona Climate Summary
 Arizona Climate Summary June 2012 Summary of conditions for May 2012 May 2012 Temperature and Precipitation Summary May 1 st 16 th : May began with a surface cold front sweeping across the western states
Arizona Climate Summary May 2013
 Arizona Climate Summary May 2013 Summary of conditions for April 2013 April 2013 Temperature and Precipitation Summary April 1 st 16 th : The first week of April featured a ridge of high pressure over
Arizona Climate Summary March 2013
 Arizona Climate Summary March 2013 Summary of conditions for February 2013 February 2013 Temperature and Precipitation Summary February 1 st 16 th : February began with a ridge of high pressure over the
Arizona Climate Summary April 2013
 Arizona Climate Summary April 2013 Summary of conditions for March 2013 March 2013 Temperature and Precipitation Summary March 1 st 16 th : March began as a ridge of high pressure progressed across the
Arizona Climate Summary October 2012
 Arizona Climate Summary October 2012 Summary of conditions for September 2012 September 2012 Temperature and Precipitation Summary September 1 st 14 th : September began with an upper level low pressure
2012 Growing Season Weather Summary for North Dakota. Adnan Akyüz and Barbara A. Mullins Department of Soil Science October 30, 2012
 2012 Growing Season Weather Summary for North Dakota Adnan Akyüz and Barbara A. Mullins Department of Soil Science October 30, 2012 Introduction The 2012 growing season (the period from April through September)
Monthly Long Range Weather Commentary Issued: July 18, 2014 Steven A. Root, CCM, President/CEO
 Monthly Long Range Weather Commentary Issued: July 18, 2014 Steven A. Root, CCM, President/CEO sroot@weatherbank.com JUNE 2014 REVIEW Climate Highlights The Month in Review The average temperature for
Monthly Long Range Weather Commentary Issued: May 15, 2014 Steven A. Root, CCM, President/CEO
 Monthly Long Range Weather Commentary Issued: May 15, 2014 Steven A. Root, CCM, President/CEO sroot@weatherbank.com APRIL 2014 REVIEW Climate Highlights The Month in Review The average temperature for
Colorado State University, Fort Collins, CO Weather Station Monthly Summary Report
 Colorado State University, Fort Collins, CO Weather Station Monthly Summary Report Month: January Year: 2019 Temperature: Mean T max was 47.2 F which is 3.0 above the 1981-2010 normal for the month. This
Champaign-Urbana 2000 Annual Weather Summary
 Champaign-Urbana 2000 Annual Weather Summary ILLINOIS STATE WATER SURVEY 2204 Griffith Dr. Champaign, IL 61820 wxobsrvr@sws.uiuc.edu Maria Peters, Weather Observer January: January started on a mild note,
2011 Year in Review TORNADOES
 2011 Year in Review The year 2011 had weather events that will be remembered for a long time. Two significant tornado outbreaks in April, widespread damage and power outages from Hurricane Irene in August
Champaign-Urbana 2001 Annual Weather Summary
 Champaign-Urbana 2001 Annual Weather Summary ILLINOIS STATE WATER SURVEY 2204 Griffith Dr. Champaign, IL 61820 wxobsrvr@sws.uiuc.edu Maria Peters, Weather Observer January: After a cold and snowy December,
Champaign-Urbana 1998 Annual Weather Summary
 Champaign-Urbana 1998 Annual Weather Summary ILLINOIS STATE WATER SURVEY Audrey Bryan, Weather Observer 2204 Griffith Dr. Champaign, IL 61820 wxobsrvr@sparc.sws.uiuc.edu The development of the El Nìno
Champaign-Urbana 1999 Annual Weather Summary
 Champaign-Urbana 1999 Annual Weather Summary ILLINOIS STATE WATER SURVEY 2204 Griffith Dr. Champaign, IL 61820 wxobsrvr@sws.uiuc.edu Maria Peters, Weather Observer A major snowstorm kicked off the new
The hydrologic service area (HSA) for this office covers Central Kentucky and South Central Indiana.
 for this office covers Central Kentucky and South Central Indiana.") January 2012 February 13, 2012 An X inside this box indicates that no flooding occurred within this hydrologic service area. January 2012 continued the string of wet months this winter. Rainfall was generally
January 2012 February 13, 2012 An X inside this box indicates that no flooding occurred within this hydrologic service area. January 2012 continued the string of wet months this winter. Rainfall was generally
Colorado State University, Fort Collins, CO Weather Station Monthly Summary Report
 Colorado State University, Fort Collins, CO Weather Station Monthly Summary Report Month: December Year: 2017 Temperature: Mean T max was 47.2 F which is 4.4 above the 1981-2010 normal for the month. This
The Weather Wire. Contents: Summer 2018 Outlook. Summer 2018 Outlook Drought Monitor May Summary/Statistics June Preview Rainfall Totals
 The Weather Wire June 2018 Volume 25 Number 6 Contents: Summer 2018 Outlook Drought Monitor May Summary/Statistics June Preview Rainfall Totals Summer 2018 Outlook June 1 st marked the first day of meteorological
Monthly Long Range Weather Commentary Issued: February 15, 2015 Steven A. Root, CCM, President/CEO
 Monthly Long Range Weather Commentary Issued: February 15, 2015 Steven A. Root, CCM, President/CEO sroot@weatherbank.com JANUARY 2015 Climate Highlights The Month in Review During January, the average
The Pennsylvania Observer
 The Pennsylvania Observer October 1, 2015 September 2015 - Pennsylvania Weather Recap By: Quinn Lease The month of September will be remembered for its above normal temperatures and dry conditions that
The Pennsylvania Observer
 The Pennsylvania Observer The Pennsylvania Observer September 16, 2004 Recap of Pennsylvania's weather from August 6 - September 12, 2004. http://pasc.met.psu.edu/pa_climatologist/nl/archive/20040916/sec1.php
Colorado State University, Fort Collins, CO Weather Station Monthly Summary Report
 Colorado State University, Fort Collins, CO Weather Station Monthly Summary Report Month: December Year: 2016 Temperature: Mean T max was 39.7 F which is 3.1 below the 1981-2010 normal for the month. This
KANSAS CLIMATE SUMMARY February 2015
 KANSAS CLIMATE SUMMARY February 2015 Extended Cold Despite some record warm readings at a few locations, February was characterized by colder than normal conditions. This was particularly true during the
October 2015 Volume 22 Number 10
 The Weather Wire October 2015 Volume 22 Number 10 Contents: Local Frost/Freeze Information Drought Monitor September Summary/Statistics October Preview Rainfall Totals Local Frost Freeze Information Many
May 2016 Volume 23 Number 5
 The Weather Wire May 2016 Volume 23 Number 5 Contents: Winter Summary Current Colorado and West-wide Snow Pack Drought Monitor April Summary/Statistics May Preview Snowfall Totals Winter Summary The Front
National Wildland Significant Fire Potential Outlook
 National Wildland Significant Fire Potential Outlook National Interagency Fire Center Predictive Services Issued: September, 2007 Wildland Fire Outlook September through December 2007 Significant fire
SOUTHERN CLIMATE MONITOR
 SOUTHERN CLIMATE MONITOR MARCH 2011 VOLUME 1, ISSUE 3 IN THIS ISSUE: Page 2 to 4 Severe Thunderstorm Climatology in the SCIPP Region Page 4 Drought Update Page 5 Southern U.S. Precipitation Summary for
Monthly Long Range Weather Commentary Issued: SEPTEMBER 19, 2016 Steven A. Root, CCM, Chief Analytics Officer, Sr. VP,
 Monthly Long Range Weather Commentary Issued: SEPTEMBER 19, 2016 Steven A. Root, CCM, Chief Analytics Officer, Sr. VP, sroot@weatherbank.com SEPTEMBER 2016 Climate Highlights The Month in Review The contiguous
KANSAS CLIMATE SUMMARY August 2015
 KANSAS CLIMATE SUMMARY August 2015 Cool and Dry August was drier than normal in most of the state. State-wide average precipitation was 2.80 inches or 85 percent of normal. The Northeast division of the
NIDIS Drought and Water Assessment
 7/23/13 1:57 PM PRECIPITATION The images above use daily precipitation statistics from NWS COOP, CoCoRaHS, and CoAgMet stations. From top to bottom, and left to right: most recent 7-days of accumulated
The Pennsylvania Observer
 The Pennsylvania Observer April 2, 2009 March 2009 Pennsylvania Weather Recap Prepared by Curt Harpster For the month of March the saying, In like a lion and out like a lamb really fit the pattern quite
WeatherManager Weekly
 Issue 288 July 14, 2016 WeatherManager Weekly Industries We Serve Agriculture Energy/Utilities Construction Transportation Retail Our Weather Protection Products Standard Temperature Products Lowest Daily
Weather and Climate Summary and Forecast August 2018 Report
 Weather and Climate Summary and Forecast August 2018 Report Gregory V. Jones Linfield College August 5, 2018 Summary: July 2018 will likely go down as one of the top five warmest July s on record for many
Nebraska experienced a wide
 Issue 1 August 2016 CLIMATE UPDATE A MONTHLY SUMMARY FROM THE neclimate.unl.edu August saw reprieve from dryness, cooler temps Overview Nebraska experienced a wide range of conditions across the state
PRECIPITATION. Last Week Precipitation:
 2/24/2015 NIDIS Drought and Water Assessment PRECIPITATION The images above use daily precipitation statistics from NWS COOP, CoCoRaHS, and CoAgMet stations. From top to bottom, and left to right: most
Colorado State University, Fort Collins, CO Weather Station Monthly Summary Report
 Colorado State University, Fort Collins, CO Weather Station Monthly Summary Report Month: February Year: 2017 Webcam catching a hawk watching over the station. Temperature: Mean T max was 54.4 F which
Monthly Long Range Weather Commentary Issued: NOVEMBER 16, 2015 Steven A. Root, CCM, Chief Analytics Officer, Sr. VP, sales
 Monthly Long Range Weather Commentary Issued: NOVEMBER 16, 2015 Steven A. Root, CCM, Chief Analytics Officer, Sr. VP, sales sroot@weatherbank.com OCTOBER 2015 Climate Highlights The Month in Review The
Current Water Conditions in Massachusetts January 11, 2008
 Current Water Conditions in Massachusetts January 11, 2008 December precipitation was above normal December streamflows were below normal and normal December ground-water levels were below normal and normal
SEPTEMBER 2013 REVIEW
 Monthly Long Range Weather Commentary Issued: October 21, 2013 Steven A. Root, CCM, President/CEO sroot@weatherbank.com SEPTEMBER 2013 REVIEW Climate Highlights The Month in Review The average temperature
Seasonal Climate Forecast August October 2013 Verification (Issued: November 17, 2013)
") Seasonal Climate Forecast August October 2013 Verification (Issued: November 17, 2013) Note: This product is published by the Oregon Department of Agriculture (ODA), in cooperation with the Oregon Department
Seasonal Climate Forecast August October 2013 Verification (Issued: November 17, 2013) Note: This product is published by the Oregon Department of Agriculture (ODA), in cooperation with the Oregon Department
NIDIS Intermountain West Drought Early Warning System October 17, 2017
 NIDIS Drought and Water Assessment NIDIS Intermountain West Drought Early Warning System October 17, 2017 Precipitation The images above use daily precipitation statistics from NWS COOP, CoCoRaHS, and
KANSAS CLIMATE SUMMARY January 2018
 KANSAS CLIMATE SUMMARY January 2018 Some welcome moisture After an extended period with little to no moisture, parts of Kansas recorded some significant precipitation. At Tribune, a small snow event on
October Precipitation Statistics (124 Years) Rank: Figure 2: Historical October precipitation time series for Maryland.
 Rank: Figure 2: Historical October precipitation time series for Maryland.") PRECIPITATION Based on the National Centers for Environmental Information (NCEI), Office of the Maryland State the statewide total October precipitation was 3.88 inches, which was 1.01 inches less than
PRECIPITATION Based on the National Centers for Environmental Information (NCEI), Office of the Maryland State the statewide total October precipitation was 3.88 inches, which was 1.01 inches less than
Monthly Long Range Weather Commentary Issued: APRIL 1, 2015 Steven A. Root, CCM, President/CEO
 Monthly Long Range Weather Commentary Issued: APRIL 1, 2015 Steven A. Root, CCM, President/CEO sroot@weatherbank.com FEBRUARY 2015 Climate Highlights The Month in Review The February contiguous U.S. temperature
Weather and Climate Summary and Forecast November 2017 Report
 Weather and Climate Summary and Forecast November 2017 Report Gregory V. Jones Linfield College November 7, 2017 Summary: October was relatively cool and wet north, while warm and very dry south. Dry conditions
November 2017 Volume 24 Number 11
 The Weather Wire November 2017 Volume 24 Number 11 Contents: Colorado Snow Statistics Drought Monitor October Summary/Statistics November Preview Snowfall Totals Rainfall Totals Colorado Snow Statistics
April 2011 Volume 18 Number 4
 The Weather Wire April 2011 Volume 18 Number 4 Contents: Winter Summary to Date Drought Monitor March Summary/Statistics April Preview Sunrise/Sunset Snow Totals Winter Summary to Date The Front Range
Climate. Annual Temperature (Last 30 Years) January Temperature. July Temperature. Average Precipitation (Last 30 Years)
 January Temperature. July Temperature. Average Precipitation (Last 30 Years)") Climate Annual Temperature (Last 30 Years) Average Annual High Temp. (F)70, (C)21 Average Annual Low Temp. (F)43, (C)6 January Temperature Average January High Temp. (F)48, (C)9 Average January Low Temp.
Climate Annual Temperature (Last 30 Years) Average Annual High Temp. (F)70, (C)21 Average Annual Low Temp. (F)43, (C)6 January Temperature Average January High Temp. (F)48, (C)9 Average January Low Temp.
The Climate of Texas County
 The Climate of Texas County Texas County is part of the Western High Plains in the north and west and the Southwestern Tablelands in the east. The Western High Plains are characterized by abundant cropland
NIDIS Weekly Climate, Water and Drought Assessment Summary. Upper Colorado River Basin
 NIDIS Weekly Climate, Water and Drought Assessment Summary Upper Colorado River Basin August 3, 2010 Precipitation and Snowpack Fig. 1: July precipitation in inches Fig. 2: July precip as percent of average
The Pennsylvania Observer
 The Pennsylvania Observer March 4, 2009 February 2009 Pennsylvania Weather Recap Prepared by Chris Slocum In Punxsutawney, Pa, the world's most famous groundhog, Punxsutawney Phil, spotted his shadow on
Monthly Long Range Weather Commentary Issued: APRIL 18, 2017 Steven A. Root, CCM, Chief Analytics Officer, Sr. VP,
 Monthly Long Range Weather Commentary Issued: APRIL 18, 2017 Steven A. Root, CCM, Chief Analytics Officer, Sr. VP, sroot@weatherbank.com MARCH 2017 Climate Highlights The Month in Review The average contiguous
Weather History on the Bishop Paiute Reservation
 Weather History on the Bishop Paiute Reservation -211 For additional information contact Toni Richards, Air Quality Specialist 76 873 784 toni.richards@bishoppaiute.org Updated 2//214 3:14 PM Weather History
KANSAS CLIMATE SUMMARY April 2017
 KANSAS CLIMATE SUMMARY April 2017 Epic Blizzard While much of the month was warmer than normal, the last week brought a return to cold, wintery weather in the western third of the state, and cold rainy
September 2018 Volume: 01, No: 9. Office of the Maryland State Climatologist. Department of Atmospheric and Oceanic Science
 Office of the Maryland State Climatologist Department of Atmospheric and Oceanic Science 4254 Stadium Dr, College Park, MD 20742 www.atmos.umd.edu/~climate PRECIPITATION Based on the National Centers for
Precipitation. Standardized Precipitation Index. NIDIS Intermountain West Drought Early Warning System September 5, 2017
 9/6/2017 NIDIS Drought and Water Assessment NIDIS Intermountain West Drought Early Warning System September 5, 2017 Precipitation The images above use daily precipitation statistics from NWS COOP, CoCoRaHS,
A summary of the weather year based on data from the Zumwalt weather station
 ZUMWALT PRAIRIE WEATHER 2016 A summary of the weather year based on data from the Zumwalt weather station Figure 1. An unusual summer storm on July 10, 2016 brought the second-largest precipitation day
KANSAS CLIMATE SUMMARY October 2016
 KANSAS CLIMATE SUMMARY October 2016 Record warmth Temperatures continued the warmer than normal pattern through much of October. The state-wide average temperature was 60.9 of, or 5.6 degrees warmer than
Monthly Long Range Weather Commentary Issued: APRIL 25, 2016 Steven A. Root, CCM, Chief Analytics Officer, Sr. VP, sales
 Monthly Long Range Weather Commentary Issued: APRIL 25, 2016 Steven A. Root, CCM, Chief Analytics Officer, Sr. VP, sales sroot@weatherbank.com MARCH 2016 Climate Highlights The Month in Review The March
Weather and Climate Summary and Forecast October 2018 Report
 Weather and Climate Summary and Forecast October 2018 Report Gregory V. Jones Linfield College October 4, 2018 Summary: Much of Washington, Oregon, coastal California and the Bay Area and delta region
The Pennsylvania Observer
 The Pennsylvania Observer December 2, 2015 November 2015 - Pennsylvania Weather Recap By: Anthny Chiavaroli This November was dry with above average temperatures across the state. Western PA saw some very
Presentation Overview. Southwestern Climate: Past, present and future. Global Energy Balance. What is climate?
 Southwestern Climate: Past, present and future Mike Crimmins Climate Science Extension Specialist Dept. of Soil, Water, & Env. Science & Arizona Cooperative Extension The University of Arizona Presentation
Weather and Climate Summary and Forecast Summer 2017
 Weather and Climate Summary and Forecast Summer 2017 Gregory V. Jones Southern Oregon University August 4, 2017 July largely held true to forecast, although it ended with the start of one of the most extreme
NIDIS Drought and Water Assessment
 NIDIS Drought and Water Assessment PRECIPITATION The images above use daily precipitation statistics from NWS COOP, CoCoRaHS, and CoAgMet stations. From top to bottom, and left to right: most recent 7-days
Weather and Climate Summary and Forecast Fall/Winter 2016
 Weather and Climate Summary and Forecast Fall/Winter 2016 Gregory V. Jones Southern Oregon University November 5, 2016 After a year where we were seemingly off by a month in terms of temperatures (March
The Pennsylvania Observer
 The Pennsylvania Observer January 5, 2009 December 2008 Pennsylvania Weather Recap The final month of 2008 was much wetter than average and a bit colder than normal. In spite of this combination, most
The Pennsylvania Observer
 The Pennsylvania Observer June 2, 2010 May 2010 Pennsylvania Weather Recap This month completed one of the warmest springs on record in Pennsylvania. With about 75% of the days averaging above normal,
The Weather Wire. Contents: Wildfires Burning Across Colorado
 The Weather Wire July 2018 Volume 25 Number 7 Contents: Wildfires Burning Across Colorado Drought Monitor June Summary/Statistics July Preview Rainfall Totals Wildfires Burning Across Colorado Following
The Climate of Marshall County
 The Climate of Marshall County Marshall County is part of the Crosstimbers. This region is a transition region from the Central Great Plains to the more irregular terrain of southeastern Oklahoma. Average
The Climate of Murray County
 The Climate of Murray County Murray County is part of the Crosstimbers. This region is a transition between prairies and the mountains of southeastern Oklahoma. Average annual precipitation ranges from