Arizona Climate Summary October 2015 Summary of conditions for September 2015
|
|
|
- Augustus Gregory
- 5 years ago
- Views:
Transcription


1 September 2015 Temperature and Precipitation Summary Arizona Climate Summary October 2015 Summary of conditions for September 2015 September 1 st 18 th : September began with high pressure over southern New Mexico, bringing more moisture into Arizona. Rain fell somewhere in Arizona every day through the 15 th. During this time the heaviest rain day was September 1 when 1.06 fell at Davis Monthan AFB, and 0.76 fell at Tucson. Over the next week the high pressure moved around eastern New Mexico and western Texas, continuing to bring moisture into Arizona and New Mexico. Rain showers were isolated but not heavy, covering the eastern 2/3 of the state. Daily amounts over this period included 0.40 at Alpine on the 2 nd, 0.45 at Nogales on the 3 rd, 0.66 at Winslow on the 4 th, 0.42 at Flagstaff on the 5th, 0.80 at Cottonwood on the 6th, 0.56 at Nogales, 0.43 at St. Johns on the 7th, and 0.80 at Coronado National Monument on the 8 th. Temperatures during this period were on the low 100s in southern and western Arizonan, low 80s and upper 70s in northern Arizona and low to mid70s at the higher elevations. By the 9 th, the high pressure had moved over northern Mexico, bringing moisture to western Arizona. Yuma reported 0.86 on the 9 th, Sonora Desert Museum had 0.13 on the 10 th, and Elgin had 0.22 on the 11 th. By the 12 th, the high pressure settled over Arizona, and Payson received 0.18, and Nogales had 0.92 on the 13 th. By the 14 th, the high pressure had moved off the Baja California coast and a strong low pressure system swept into the state on the 14 th and 15 th and Youngtown had 0.60 and Phoenix had 0.32 on the 14 th. Also on the 14 th heavy rain in southern Utah caused flash flooding in Zion National Park, Hildale, UT and Colorado City, AZ, killing 18 people with several others missing. Seligman had 0.93 on the 15 th. On the 16 th only 0.01 of rain was reported in the state and no rain fell on the 17 th or 18 th as high pressure remained centered over northern Mexico. September 19 th 30 th : By the 19 th the high pressure system pushed more tropical moisture into the state bringing heavier rainfall to the southeast counties. Elgin had 1.01 and Bisbee had 0.43 on the 19 th. On the 21 st, Douglas had 1.22, Alpine had 1.15, Tucson had 1.04, Davis Monthan AFB had 1.02, and Nogales had On the 22 nd, Davis Monthan had another 0.76, Tucson had another 0.47, and Alpine had another On the 23 rd, the moisture had moved into central Arizona and Scottsdale Airport had 1.45, east Mesa had 0.96, and Phoenix Airport had That was the end of the monsoon activity as the high pressure moved over Arizona on the 24 th and remained there through the end of the month, ending the southerly flow of moisture into the state. No more rain was reported in the state from the 24 th through the end of September. Data are preliminary and are from the National Weather Service Forecast Offices in Flagstaff, Phoenix and Tucson. **Note: The discrepancy between the Statewide Temperature and Precipitation values for Phoenix, Flagstaff and Tucson and the daily values in their graphs are due to the reporting times. Statewide Temperature and Precipitation values are taken at 5pm, while official daily records at the airports are taken from Midnight to Midnight. In This Issue: Overview of September, graphs of the September daily maximum and minimum temperatures, precipitation, mean daily dew points for Flagstaff, Phoenix, and Tucson; September climate statistics, maps of mean monthly maximum and minimum temperatures, precipitation, dew points, wind speeds for September; and graphs of the mean September temperature and precipitation for the period of record for Tucson, Phoenix, and Flagstaff, graphs of the cumulative precipitation for the calendar year for Flagstaff, Phoenix, and Tucson. Climate calendars for Flagstaff, Phoenix, Tucson, Prescott, Winslow and Yuma, including daily and monthly normals and extremes, for each month of the year, can be downloaded directly from the State Climate website. See p.21 of this report for calendar abbreviations. Dr. Nancy J. Selover, State Climatologist Edited by Nancy J. Selover 2015 Arizona State Climate Office 1


2 September 2015 Daily Temperature, Precipitation, & Dew Point for Flagstaff, Phoenix, and Tucson 2


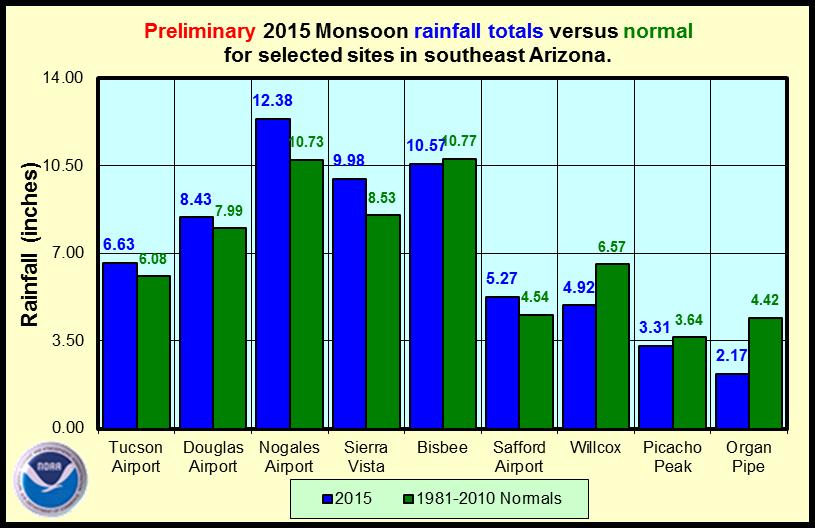
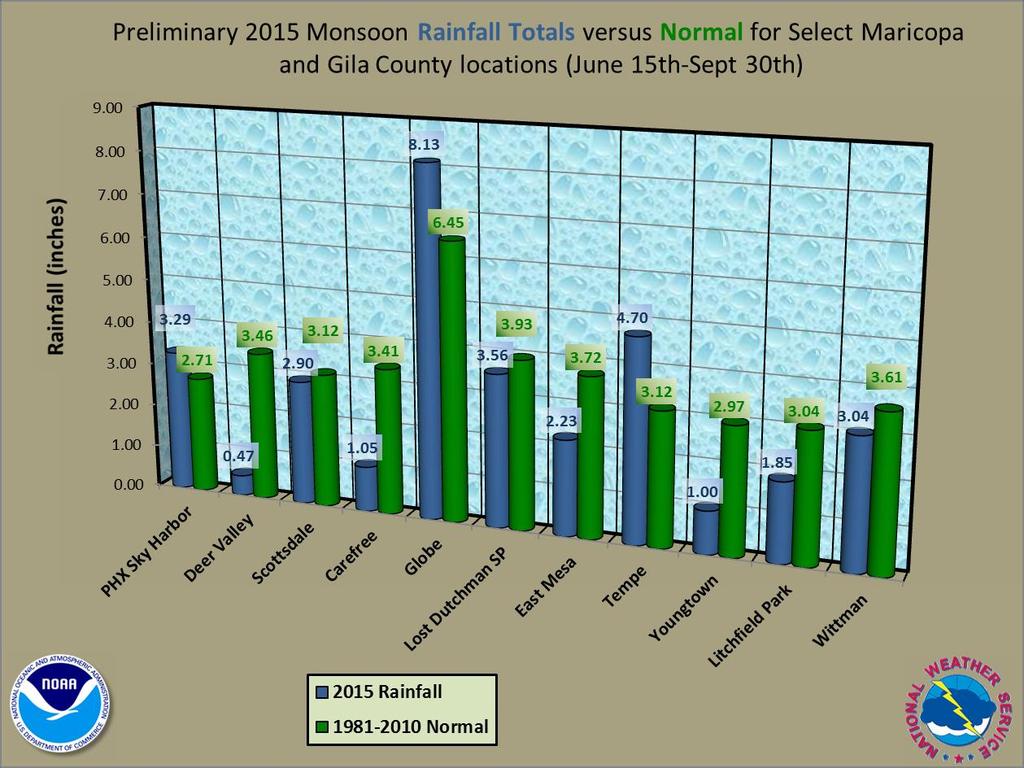
3 Monsoon: Overall the monsoon was wetter than average in northern, southern, and eastern Arizona, and drier than normal in western Arizona, southeastern California and western Maricopa County. The NOAA tables below show monsoon totals for selected cities in Arizona and southeastern California. For more monsoon statistics for cities in Arizona, visit the Tucson NWS Monsoon website: the Flagstaff NWS Monsoon Summary webpage: and the Phoenix NWS Monsoon Summary webpage: 3
4 4
 60.3 Normal 57.4 Departure from Normal (F) +2.9 Highest Monthly Avg Temp (F) 62.1 in 1947 Lowest Monthly Avg Temp (F) 52.")
5 FLAGSTAFF CLIMATE STATISTICS September 2015 This September was tied for 11warmest with 1948, and had no significant ranking for precipitation. Avg Max Temp (F) 75.3 Normal 73.4 Avg Min Temp (F) 45.4 Normal 41.8 Avg Mean Temp (F) 60.3 Normal 57.4 Departure from Normal (F) +2.9 Highest Monthly Avg Temp (F) 62.1 in 1947 Lowest Monthly Avg Temp (F) 52.3 in 1912 Highest Temp this month (F): 82 on 11 th Lowest Temp this month (F): 37 on 19 th Record High (F): 91 on 9/1,2,3/1948 Record Low (F): 20 on 9/22/1912 Temperature or precipitation records this month: 15 th HiMin 53 set, previous record 52 in 1997 Flagstaff Number of Days of: Minimum Temp 50 o F or higher 4 Minimum Temp 50 o F or lower 6 Maximum Temp 80 o F or higher 3 Maximum Temp 70 o F or lower 4 Heating Degree Days 131 Normal 230 Cooling Degree Days 0 Normal 3 Degree base 65 o F Total September Precipitation 1.25 Normal September Precipitation 2.38 Departure from normal Greatest 24-Hr Precipitation 0.53 on 4-5 th Total Precipitation Year-to-Date Departure from Normal Number of Days: Clear 22 Partly Cloudy 8 Cloudy 0 Greatest September Precipitation 6.75 in 1983 Least September Precipitation 0.00 in 1955, 1957, 1973, 1992 Average Wind Speed Highest Peak Gust 5.4 mph 369mph from 220 o on 16 th 5
6 PHOENIX CLIMATE STATISTICS September 2015 This September was tied with 2008 as the 12 th warmest and had no significant ranking for precipitation. Avg Max Temp(F) Normal 99.8 Avg Min Temp(F) 76.4 Normal 76.9 Avg Mean Temp (F) 89.9 Normal 88.4 Departure from Normal (F) +1.5 Highest Monthly Avg Temp (F) 92.2 in 2001 Lowest Monthly Avg Temp (F) 79.9 in 1900, 1912 Highest Temp this month (F): Lowest Temp this month (F): 107 on 12 th 72 on 23 rd Record High (F): 113 on 9/05/1945 Record Low (F): 47 on 9/20-21/1965, 9/22/1895 Temperature or precipitation records this month: 22 nd Precip 0.41 tied, first set in th HiMin 82 set, first set in th HiMin 82 set, first set in 2010 Heating Degree Days 0 Normal 0 Cooling Degree Days 752 Normal 700 Degree base 65 o F Total September Precipitation 0.81 Normal September Precipitation 0.64 Departure from normal Greatest 24-Hr Precipitation /22 Total Precipitation Year-to-Date 5.98 Departure from Normal Number of Days: Clear 11 Partly Cloudy 16 Cloudy 3 Greatest September Precipitation 5.41 in 1939 Least September Precipitation 0.00 in 1973, 1968, and 1988 and 13 other years. Average Wind Speed 6.3 mph Highest Peak Gust 57 mph from 200 o on 14 th Phoenix Number of Days of: Minimum Temp 80 o F or lower 18 Minimum Temp 85 o F or higher 2 Maximum Temp 100 o F or lower 14 Maximum Temp 105 o F or higher 4 TUCSON CLIMATE STATISTICS September 2015 This September was tied for 19 th warmest with 1995 and 2014 and had no significant ranking for precipitation. Avg Max Temp(F) 93.9 Normal 94.5 Avg Min Temp(F) 71.7 Normal 68.6 Avg Mean Temp(F) 82.8 Normal 81.6 Departure from Normal (F) +1.2 Highest Monthly Avg Temp (F) in 2000 Lowest Monthly Avg Temp (F) 76.3 in 1964 Highest Temp this month (F): 102 on 12 th Lowest Temp this month (F): 68 on 22 nd, 23 rd, 29 th Record High (F): 107 on 09/14/2000, 9/11-11/1990, 6 Record Low (F): 43 on 098/26/1913 No temperature or precipitation records this month Tucson Number of Days of: Minimum Temp 70 o F or lower 11 Minimum Temp 75 o F or higher 4 Maximum Temp 905 o F or lower 6 Maximum Temp 100 o F or higher 2 Total September Precipitation 2.40 Normal September Precipitation 1.29 Departure from normal Greatest 24-Hr Precipitation 1.04 on Total Precipitation Year-to-Date Departure from Normal +1.34
7 Greatest September Precipitation 5.60 in 2011 Least September Precipitation 0.00 in 1898, 1953, 1957, 19598, Number of Days: Clear 23 Partly Cloudy 3 Cloudy 0 Average Wind Speed Highest Peak Gust 6.7 mph 49 mph from 280 o on 22 nd Data are from the National Weather Service and the National Climatic Data Center and are preliminary. 7
8 Wind Speeds for May: Day Phoenix Flagstaff Tucson (mph) Avg Max Avg Max Avg Max M Dew Points for May: Daily Average Dew Point ( o F): Day Phx Tuc Flg
9 The 9

10 The lowest minimum temperatures ranged from 22 o F at Grand Canyon East Entrance to 78 o F at Yucca. The lowest maximum temperature of 68 o F was recorded at Snowslide Canyon, while the highest maximum temperature of 113 o F was reported at Yuma. The lowest rainfall amount was 0.00 at several stations in Arizona and the highest were 5.86 at Vail and 5.80 at Tubac. The lowest average dew point was 34 o F at Window Rock and the highest was 68 o F at Yuma. The highest peak wind gust was 51 mph at Yuma. 10
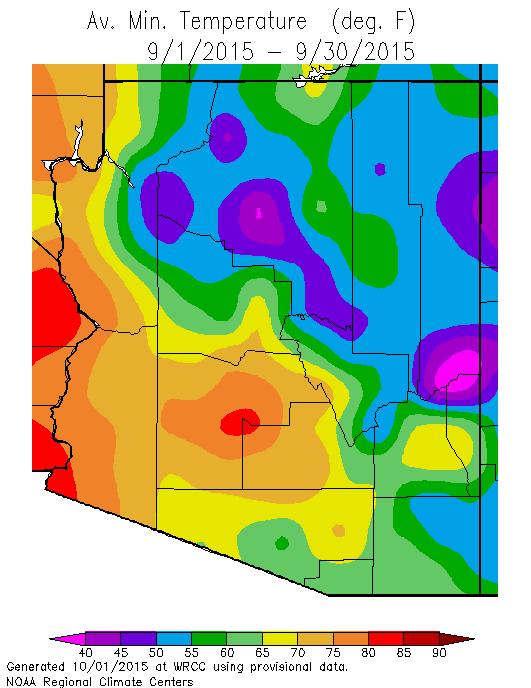
11 T September 2015 The highest average minimum temperature was 80 o F at Yuma and the lowest average minimum temperature was 40 o F at Sunset Crater. The highest average maximum temperature was 106 o F at Bullhead City and lowest average maximum temperature was 62 o F at Snowslide Canyon. 11
12 12


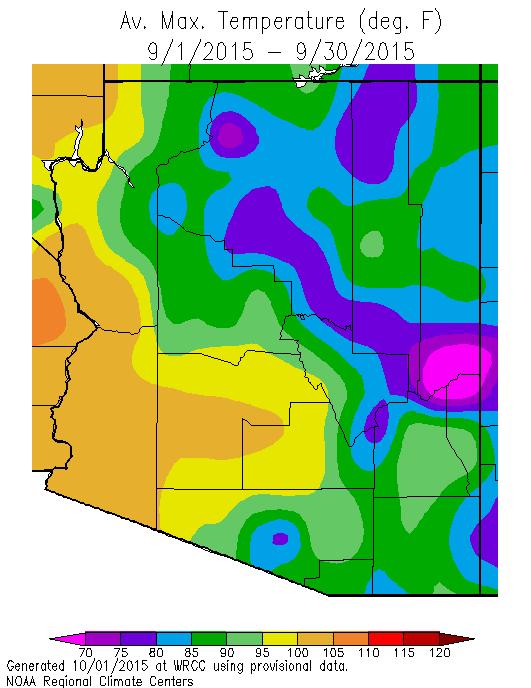
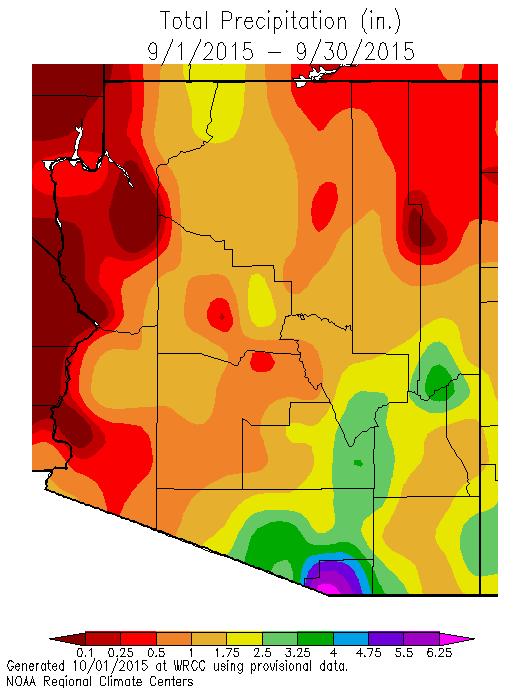
13 September September minimum temperatures were 0 to 6 o F warmer than average across northern Arizona, while a few locations in southern Arizona had slightly cooler than average temperatures. Daytime temperatures were 0 to 3 o F warmer than average across northern Arizona. Southern Arizona was 0 to 3 o F cooler than average due to increased thunderstorm activity in southern and southeastern Arizona. The cold bullseye in southern Gila County is an error, likely due to a recent change in the sensor location. September precipitation was concentrated in southern Arizona, with one very strong storm in southern Utah causing flash flooding on the Arizona Strip that swept away two vehicles and killed 12 people in Hildale, UT and Colorado City,AZ 13
14 14


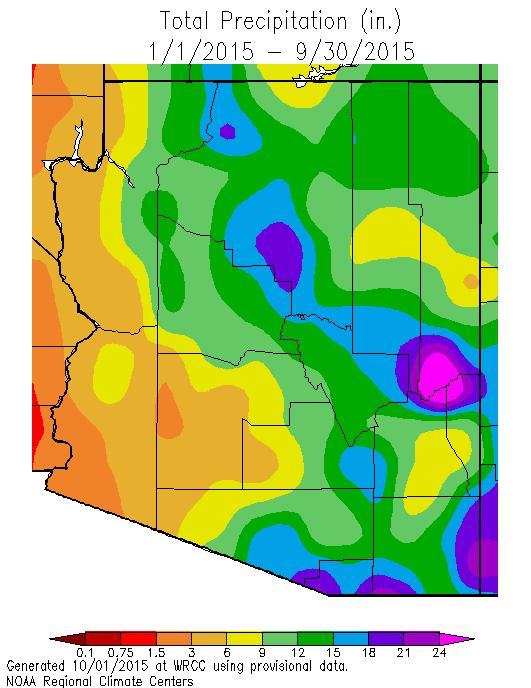
15 Calendar Year 2015 Calendar year minimum temperatures have been generally 0 to 4 o F warmer than average across most of the state, with the warmest conditions in central Gila County. Daytime temperatures were also about 0 to 3 o F warmer than average across northern Arizona, and only slightly warmer than average across the southeastern counties. Cooler than normal areas include western Pinal County. Precipitation has been much above normal across the Colorado Plateau as well as across the southeast. Parts of Mohave, Maricopa, Yavapai, Gila and Yuma counties have been drier than average so far this year. 15
16 16


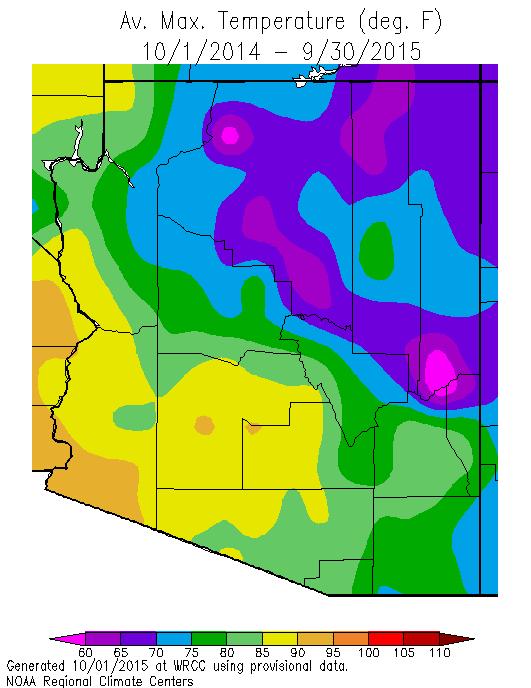
17 2015 Water Year The water year ended with minimum temperatures 1 to 4 o F warmer than average across the northern 2/3 of the state and as much as 2 o F warmer than average in the southeast. Daytime temperatures have been 1.5 to 3 o F warmer than average across northern Arizona and the western counties. Southeastern Arizona has been 0.5 to 2 o F warmer than normal, with cool pockets in western Maricopa and Pinal Counties. The cool bullseye is due to a recent sensor move in Gila County. Precipitation has been well below average in Maricopa, Yavapai, Mohave, and Yuma counties. The Colorado Plateau has received 120 to 200% of normal precipitation, and southern Arizona is also wetter than average. The Mogollon Rim, however, did not have a wet year.. 17


18 September Mean Temperature Graphs Flagstaff, Phoenix, and Tucson : 18


19 September Mean Precipitation Graphs Flagstaff, Phoenix, and Tucson : 19


20 2015 Cumulative Precipitation Graphs Flagstaff, Phoenix and Tucson: Flagstaff is 3.10 wetter than normal, Tucson is 1.34 wetter than normal and Phoenix is 0.06 wetter than normal. 20
21 The downloadable normals and extremes calendars use the following abbreviations: NORM = 30 year ( ) average value (degrees Fahrenheit (F)) OBS = The temperature observation for that day this year AVG = Average daily temperature HI MAX = Highest maximum temperature for that day (F) LO MAX = Lowest maximum temperature for that day (F) LO MIN = Lowest minimum temperature for that day (F) HI MIN = Highest minimum temperature for that day (F) Mx PCP = Maximum precipitation for that day (inches) Mx SNO = Maximum snowfall for that day (inches) 21
Arizona Climate Summary
 August 2015 Temperature and Precipitation Summary Arizona Climate Summary September 2015 Summary of conditions for August 2015 August 1 st 16 th : August was a wet month across the state with only 3 days
Arizona Climate Summary July 2015 Summary of conditions for June 2015
 June 2015 Temperature and Precipitation Summary Arizona Climate Summary July 2015 Summary of conditions for June 2015 June 1 st 14 th : Similar to May, June began with high pressure in the west, and conditions
Arizona Climate Summary September 2017 Summary of conditions for August 2017
 August 2017 Temperature and Precipitation Summary Arizona Climate Summary September 2017 Summary of conditions for August 2017 August 1 st 15 th : The monsoon activity that ended July continued into the
Arizona Climate Summary
 Arizona Climate Summary August 2016 Summary of conditions for July 2016 July 2016 Temperature and Precipitation Summary July 1 st 15 th : As June ended and July began, a shortwave moved through the southwest
Arizona Climate Summary November 2015 Summary of conditions for October 2015
 October 2015 Temperature and Precipitation Summary Arizona Climate Summary November 2015 Summary of conditions for October 2015 October 1 st 14 th : October began with high pressure over the southwest,
Arizona Climate Summary October 2018 Summary of conditions for September 2018
 Arizona Climate Summary October 2018 Summary of conditions for September 2018 September 2018 Temperature and Precipitation Summary September 1 st 17 th : The wet pattern from August continued into September
Arizona Climate Summary May 2015 Summary of conditions for April 2015
 Arizona Climate Summary May 2015 Summary of conditions for April 2015 April 2015 Temperature and Precipitation Summary April 1 st 16 th : April began with very light showers in Nogales and Coronado National
Arizona Climate Summary September 2018 Summary of conditions for August 2018
 August 2018 Temperature and Precipitation Summary Arizona Climate Summary September 2018 Summary of conditions for August 2018 August 1 st 15 th : August began with high pressure centered over the state
Arizona Climate Summary November 2018 Summary of conditions for October 2018
 Arizona Climate Summary November 2018 Summary of conditions for October 2018 October 2018 Temperature and Precipitation Summary October 1 st 15 th : The 2018 water year ending September 30 th was exceptionally
Arizona Climate Summary August 2013
 Arizona Climate Summary August 2013 Summary of conditions for July 2013 July 2013 Temperature and Precipitation Summary July 1 st 16 th : To start off the month of July, a high pressure system came in
Arizona Climate Summary December 2016 Summary of conditions for November 2016
 Arizona Climate Summary December 2016 Summary of conditions for November 2016 November 2016 Temperature and Precipitation Summary November 1 st 16 th : November began with a dry low pressure system moving
Arizona Climate Summary November 2016 Summary of conditions for October 2016
 Arizona Climate Summary November 2016 Summary of conditions for October 2016 October 2016 Temperature and Precipitation Summary October 1 st 16 th : October began with high pressure over Mexico, bringing
Arizona Climate Summary October 2016 Summary of conditions for September 2016
 September 2016 Temperature and Precipitation Summary Arizona Climate Summary October 2016 Summary of conditions for September 2016 September 1 st 14 th : High pressure over the Four Corners brought rainfall
Arizona Climate Summary February 2016 Summary of conditions for January 2016
 January 2016 Temperature and Precipitation Summary Arizona Climate Summary February 2016 Summary of conditions for January 2016 January 1 st 14 th : The new year began with high pressure over the southwest
Arizona Climate Summary
 April 2016 Temperature and Precipitation Summary Arizona Climate Summary May 2016 Summary of conditions for April 2016 April 1 st 15 th : April 1 st saw the tail end of a low pressure system move out of
Arizona Climate Summary
 Arizona Climate Summary April 2014 Summary of conditions for March 2014 March 2014 Temperature and Precipitation Summary March 1 st 16 th : We started off the month of March with a significant precipitation
Arizona Climate Summary October 2013
 Arizona Climate Summary October 2013 Summary of conditions for September 2013 September 2013 Temperature and Precipitation Summary September 1 st 16 th : With moist conditions still present throughout
Arizona Climate Summary January 2017 Summary of conditions for December 2016
 Arizona Climate Summary January 2017 Summary of conditions for December 2016 December 2016 Temperature and Precipitation Summary December 1 st 15 th : Similar to November, December began with a dry trough
Arizona Climate Summary September 2014 Summary of conditions for August 2014
 Arizona Climate Summary September 2014 Summary of conditions for August 2014 August 2014 Temperature and Precipitation Summary August 1 st 16 th : The first 5 days of August were quite wet with high pressure
Arizona Climate Summary
 May 2015 Temperature and Precipitation Summary Arizona Climate Summary June 2015 Summary of conditions for May 2015 May 1 st 14 th : May began with high pressure in the west, and May 1 st was dry statewide,
Arizona Climate Summary April 2018 Summary of conditions for March 2018
 Arizona Climate Summary April 2018 Summary of conditions for March 2018 March 2018 Temperature and Precipitation Summary March 1 st 16 th : March began with rainfall in southeastern Arizona as the tail
Arizona Climate Summary June 2017 Summary of conditions for May 2017
 Arizona Climate Summary June 2017 Summary of conditions for May 2017 May 2017 Temperature and Precipitation Summary May 1 st 16 th : A strong ridge of high pressure developed over the southwest during
Arizona Climate Summary June 2013
 Arizona Climate Summary June 2013 Summary of conditions for May 2013 May 2013 Temperature and Precipitation Summary May 1 st 16 th : May began with above normal daily temperatures and breezy conditions
Arizona Climate Summary December 2017 Summary of conditions for November 2017
 November 2017 Temperature and Precipitation Summary Arizona Climate Summary December 2017 Summary of conditions for November 2017 November 1 st 17 th : October ended with a little bit of precipitation
Arizona Climate Summary November 2017 Summary of conditions for October 2017
 Arizona Climate Summary November 2017 Summary of conditions for October 2017 October 2017 Temperature and Precipitation Summary October 1 st 18 th : A low pressure system from the northwestern U.S. moved
Arizona Climate Summary November 2013
 Arizona Climate Summary November 2013 Summary of conditions for October 2013 October 2013 Temperature and Precipitation Summary October 1 st 16 th : The month of October started off with fair weather conditions
Arizona Climate Summary February 2018 Summary of conditions for January 2018
 Arizona Climate Summary February 2018 Summary of conditions for January 2018 January 2018 Temperature and Precipitation Summary January 1 st 19 th : The new year began with a ridge of high pressure over
Arizona Climate Summary February 2012
 Arizona Climate Summary February 2012 Summary of conditions for January 2012 January 2012 Temperature and Precipitation Summary January 1 st 20 th : The New Year has started on a very dry note. The La
Arizona Climate Summary May 2012
 Arizona Climate Summary May 2012 Summary of conditions for April 2012 April 2012 Temperature and Precipitation Summary April 1 st 16 th : Although April began with another low pressure system sweeping
Arizona Climate Summary March 2013
 Arizona Climate Summary March 2013 Summary of conditions for February 2013 February 2013 Temperature and Precipitation Summary February 1 st 16 th : February began with a ridge of high pressure over the
Arizona Climate Summary
 Arizona Climate Summary June 2012 Summary of conditions for May 2012 May 2012 Temperature and Precipitation Summary May 1 st 16 th : May began with a surface cold front sweeping across the western states
Arizona Climate Summary
 Arizona Climate Summary March 2014 Summary of conditions for February 2014 February 2014 Temperature and Precipitation Summary February 1 st 16 th : We started off the month of February with some moisture
Arizona Climate Summary May 2018 Summary of conditions for April 2018
 April 2018 Temperature and Precipitation Summary Arizona Climate Summary May 2018 Summary of conditions for April 2018 April 1 st 16 th : April was a very dry month across Arizona. Several low pressure
Arizona Climate Summary April 2013
 Arizona Climate Summary April 2013 Summary of conditions for March 2013 March 2013 Temperature and Precipitation Summary March 1 st 16 th : March began as a ridge of high pressure progressed across the
Arizona Climate Summary May 2013
 Arizona Climate Summary May 2013 Summary of conditions for April 2013 April 2013 Temperature and Precipitation Summary April 1 st 16 th : The first week of April featured a ridge of high pressure over
Arizona Climate Summary October 2012
 Arizona Climate Summary October 2012 Summary of conditions for September 2012 September 2012 Temperature and Precipitation Summary September 1 st 14 th : September began with an upper level low pressure
Colorado State University, Fort Collins, CO Weather Station Monthly Summary Report
 Colorado State University, Fort Collins, CO Weather Station Monthly Summary Report Month: December Year: 2017 Temperature: Mean T max was 47.2 F which is 4.4 above the 1981-2010 normal for the month. This
Colorado State University, Fort Collins, CO Weather Station Monthly Summary Report
 Colorado State University, Fort Collins, CO Weather Station Monthly Summary Report Month: January Year: 2019 Temperature: Mean T max was 47.2 F which is 3.0 above the 1981-2010 normal for the month. This
Colorado State University, Fort Collins, CO Weather Station Monthly Summary Report
 Colorado State University, Fort Collins, CO Weather Station Monthly Summary Report Month: December Year: 2016 Temperature: Mean T max was 39.7 F which is 3.1 below the 1981-2010 normal for the month. This
The Pennsylvania Observer
 The Pennsylvania Observer The Pennsylvania Observer September 16, 2004 Recap of Pennsylvania's weather from August 6 - September 12, 2004. http://pasc.met.psu.edu/pa_climatologist/nl/archive/20040916/sec1.php
Weather and Climate Summary and Forecast August 2018 Report
 Weather and Climate Summary and Forecast August 2018 Report Gregory V. Jones Linfield College August 5, 2018 Summary: July 2018 will likely go down as one of the top five warmest July s on record for many
Monthly Long Range Weather Commentary Issued: SEPTEMBER 19, 2016 Steven A. Root, CCM, Chief Analytics Officer, Sr. VP,
 Monthly Long Range Weather Commentary Issued: SEPTEMBER 19, 2016 Steven A. Root, CCM, Chief Analytics Officer, Sr. VP, sroot@weatherbank.com SEPTEMBER 2016 Climate Highlights The Month in Review The contiguous
2012 Growing Season Weather Summary for North Dakota. Adnan Akyüz and Barbara A. Mullins Department of Soil Science October 30, 2012
 2012 Growing Season Weather Summary for North Dakota Adnan Akyüz and Barbara A. Mullins Department of Soil Science October 30, 2012 Introduction The 2012 growing season (the period from April through September)
Monthly Long Range Weather Commentary Issued: May 15, 2014 Steven A. Root, CCM, President/CEO
 Monthly Long Range Weather Commentary Issued: May 15, 2014 Steven A. Root, CCM, President/CEO sroot@weatherbank.com APRIL 2014 REVIEW Climate Highlights The Month in Review The average temperature for
Monthly Long Range Weather Commentary Issued: SEPTEMBER 19, 2015 Steven A. Root, CCM, Chief Analytics Officer, Sr. VP, sales
 Monthly Long Range Weather Commentary Issued: SEPTEMBER 19, 2015 Steven A. Root, CCM, Chief Analytics Officer, Sr. VP, sales sroot@weatherbank.com AUGUST 2015 Climate Highlights The Month in Review The
The Pennsylvania Observer
 The Pennsylvania Observer October 1, 2015 September 2015 - Pennsylvania Weather Recap By: Quinn Lease The month of September will be remembered for its above normal temperatures and dry conditions that
Monthly Long Range Weather Commentary Issued: July 18, 2014 Steven A. Root, CCM, President/CEO
 Monthly Long Range Weather Commentary Issued: July 18, 2014 Steven A. Root, CCM, President/CEO sroot@weatherbank.com JUNE 2014 REVIEW Climate Highlights The Month in Review The average temperature for
Issued by: National Weather Service San Joaquin Valley - Hanford CA. Issue time: 409 AM PST Wed Jan
 Forecast Information Location: New_Exchequer_Dam Updated: January 16, 2019, 11:45 am NWS Weather Discussion: Issued by: National Weather Service San Joaquin Valley - Hanford CA Issue time: 409 AM PST Wed
Monthly Long Range Weather Commentary Issued: February 15, 2015 Steven A. Root, CCM, President/CEO
 Monthly Long Range Weather Commentary Issued: February 15, 2015 Steven A. Root, CCM, President/CEO sroot@weatherbank.com JANUARY 2015 Climate Highlights The Month in Review During January, the average
2011 Year in Review TORNADOES
 2011 Year in Review The year 2011 had weather events that will be remembered for a long time. Two significant tornado outbreaks in April, widespread damage and power outages from Hurricane Irene in August
MIAMI-SOUTH FLORIDA National Weather Service Forecast Office
 MIAMI-SOUTH FLORIDA National Weather Service Forecast Office http://www.weather.gov/miami June 2015 South Florida Weather Summary Dry East, Wet West...Drought Remains SE Florida July 3, 2015: Depending
Monthly Long Range Weather Commentary Issued: NOVEMBER 16, 2015 Steven A. Root, CCM, Chief Analytics Officer, Sr. VP, sales
 Monthly Long Range Weather Commentary Issued: NOVEMBER 16, 2015 Steven A. Root, CCM, Chief Analytics Officer, Sr. VP, sales sroot@weatherbank.com OCTOBER 2015 Climate Highlights The Month in Review The
LOCAL CLIMATOLOGICAL DATA FOR FREEPORT ILLINOIS
 Climatological Summary: LOCAL CLIMATOLOGICAL DATA FOR FREEPORT ILLINOIS 1905-1990 Freeport (Stephenson County) has a temperate continental climate, dominated by maritime tropical air from the Gulf of Mexico
January 2006 Climate Summary
 Ashley Brooks (765) 494-6574 Feb 9, 2006 http://www.iclimate.org January 1-3 January 2006 Climate Summary Unseasonably warm conditions welcomed in the New Year with highs in the 40s across the northern
Weather and Climate Summary and Forecast October 2018 Report
 Weather and Climate Summary and Forecast October 2018 Report Gregory V. Jones Linfield College October 4, 2018 Summary: Much of Washington, Oregon, coastal California and the Bay Area and delta region
National Wildland Significant Fire Potential Outlook
 National Wildland Significant Fire Potential Outlook National Interagency Fire Center Predictive Services Issued: September, 2007 Wildland Fire Outlook September through December 2007 Significant fire
The Pennsylvania Observer
 The Pennsylvania Observer June 2, 2010 May 2010 Pennsylvania Weather Recap This month completed one of the warmest springs on record in Pennsylvania. With about 75% of the days averaging above normal,
Champaign-Urbana 1998 Annual Weather Summary
 Champaign-Urbana 1998 Annual Weather Summary ILLINOIS STATE WATER SURVEY Audrey Bryan, Weather Observer 2204 Griffith Dr. Champaign, IL 61820 wxobsrvr@sparc.sws.uiuc.edu The development of the El Nìno
Weather and Climate Summary and Forecast Summer 2017
 Weather and Climate Summary and Forecast Summer 2017 Gregory V. Jones Southern Oregon University August 4, 2017 July largely held true to forecast, although it ended with the start of one of the most extreme
The Weather Wire. Contents: Summer 2018 Outlook. Summer 2018 Outlook Drought Monitor May Summary/Statistics June Preview Rainfall Totals
 The Weather Wire June 2018 Volume 25 Number 6 Contents: Summer 2018 Outlook Drought Monitor May Summary/Statistics June Preview Rainfall Totals Summer 2018 Outlook June 1 st marked the first day of meteorological
SEPTEMBER 2013 REVIEW
 Monthly Long Range Weather Commentary Issued: October 21, 2013 Steven A. Root, CCM, President/CEO sroot@weatherbank.com SEPTEMBER 2013 REVIEW Climate Highlights The Month in Review The average temperature
Champaign-Urbana 2000 Annual Weather Summary
 Champaign-Urbana 2000 Annual Weather Summary ILLINOIS STATE WATER SURVEY 2204 Griffith Dr. Champaign, IL 61820 wxobsrvr@sws.uiuc.edu Maria Peters, Weather Observer January: January started on a mild note,
Champaign-Urbana 2001 Annual Weather Summary
 Champaign-Urbana 2001 Annual Weather Summary ILLINOIS STATE WATER SURVEY 2204 Griffith Dr. Champaign, IL 61820 wxobsrvr@sws.uiuc.edu Maria Peters, Weather Observer January: After a cold and snowy December,
Presentation Overview. Southwestern Climate: Past, present and future. Global Energy Balance. What is climate?
 Southwestern Climate: Past, present and future Mike Crimmins Climate Science Extension Specialist Dept. of Soil, Water, & Env. Science & Arizona Cooperative Extension The University of Arizona Presentation
The Pennsylvania Observer
 The Pennsylvania Observer September 3, 2008 Summer 2008 Weather Summary Written by: Brian Thompson The opening days of June started dry, but a warm front brought a widespread rain a couple of days into
November 2017 Volume 24 Number 11
 The Weather Wire November 2017 Volume 24 Number 11 Contents: Colorado Snow Statistics Drought Monitor October Summary/Statistics November Preview Snowfall Totals Rainfall Totals Colorado Snow Statistics
Investigation of the Arizona Severe Weather Event of August 8 th, 1997
 Investigation of the Arizona Severe Weather Event of August 8 th, 1997 Tim Hollfelder May 10 th, 2006 Abstract Synoptic scale forcings were very weak for these thunderstorms on August 7-8, 1997 over the
KANSAS CLIMATE SUMMARY January 2018
 KANSAS CLIMATE SUMMARY January 2018 Some welcome moisture After an extended period with little to no moisture, parts of Kansas recorded some significant precipitation. At Tribune, a small snow event on
Monthly Long Range Weather Commentary Issued: APRIL 25, 2016 Steven A. Root, CCM, Chief Analytics Officer, Sr. VP, sales
 Monthly Long Range Weather Commentary Issued: APRIL 25, 2016 Steven A. Root, CCM, Chief Analytics Officer, Sr. VP, sales sroot@weatherbank.com MARCH 2016 Climate Highlights The Month in Review The March
Champaign-Urbana 1999 Annual Weather Summary
 Champaign-Urbana 1999 Annual Weather Summary ILLINOIS STATE WATER SURVEY 2204 Griffith Dr. Champaign, IL 61820 wxobsrvr@sws.uiuc.edu Maria Peters, Weather Observer A major snowstorm kicked off the new
Colorado State University, Fort Collins, CO Weather Station Monthly Summary Report
 Colorado State University, Fort Collins, CO Weather Station Monthly Summary Report Month: February Year: 2017 Webcam catching a hawk watching over the station. Temperature: Mean T max was 54.4 F which
WeatherManager Weekly
 Issue 288 July 14, 2016 WeatherManager Weekly Industries We Serve Agriculture Energy/Utilities Construction Transportation Retail Our Weather Protection Products Standard Temperature Products Lowest Daily
August 2006 Summary. August 1-5
 Ashley Brooks (765) 494-6574 Sep 8, 2006 http://www.iclimate.org August 1-5 August 2006 Summary The heat wave that started during the end of July continued into the beginning parts of August with temperatures
Monthly Long Range Weather Commentary Issued: APRIL 18, 2017 Steven A. Root, CCM, Chief Analytics Officer, Sr. VP,
 Monthly Long Range Weather Commentary Issued: APRIL 18, 2017 Steven A. Root, CCM, Chief Analytics Officer, Sr. VP, sroot@weatherbank.com MARCH 2017 Climate Highlights The Month in Review The average contiguous
The Weather Wire. Contents: Wildfires Burning Across Colorado
 The Weather Wire July 2018 Volume 25 Number 7 Contents: Wildfires Burning Across Colorado Drought Monitor June Summary/Statistics July Preview Rainfall Totals Wildfires Burning Across Colorado Following
NIDIS Intermountain West Drought Early Warning System October 17, 2017
 NIDIS Drought and Water Assessment NIDIS Intermountain West Drought Early Warning System October 17, 2017 Precipitation The images above use daily precipitation statistics from NWS COOP, CoCoRaHS, and
NIDIS Intermountain West Drought Early Warning System December 11, 2018
 NIDIS Drought and Water Assessment NIDIS Intermountain West Drought Early Warning System December 11, 2018 Precipitation The images above use daily precipitation statistics from NWS COOP, CoCoRaHS, and
October 2015 Volume 22 Number 10
 The Weather Wire October 2015 Volume 22 Number 10 Contents: Local Frost/Freeze Information Drought Monitor September Summary/Statistics October Preview Rainfall Totals Local Frost Freeze Information Many
October Precipitation Statistics (124 Years) Rank: Figure 2: Historical October precipitation time series for Maryland.
 Rank: Figure 2: Historical October precipitation time series for Maryland.") PRECIPITATION Based on the National Centers for Environmental Information (NCEI), Office of the Maryland State the statewide total October precipitation was 3.88 inches, which was 1.01 inches less than
PRECIPITATION Based on the National Centers for Environmental Information (NCEI), Office of the Maryland State the statewide total October precipitation was 3.88 inches, which was 1.01 inches less than
Climate. Annual Temperature (Last 30 Years) January Temperature. July Temperature. Average Precipitation (Last 30 Years)
 January Temperature. July Temperature. Average Precipitation (Last 30 Years)") Climate Annual Temperature (Last 30 Years) Average Annual High Temp. (F)70, (C)21 Average Annual Low Temp. (F)43, (C)6 January Temperature Average January High Temp. (F)48, (C)9 Average January Low Temp.
Climate Annual Temperature (Last 30 Years) Average Annual High Temp. (F)70, (C)21 Average Annual Low Temp. (F)43, (C)6 January Temperature Average January High Temp. (F)48, (C)9 Average January Low Temp.
The hydrologic service area (HSA) for this office covers Central Kentucky and South Central Indiana.
 for this office covers Central Kentucky and South Central Indiana.") January 2012 February 13, 2012 An X inside this box indicates that no flooding occurred within this hydrologic service area. January 2012 continued the string of wet months this winter. Rainfall was generally
January 2012 February 13, 2012 An X inside this box indicates that no flooding occurred within this hydrologic service area. January 2012 continued the string of wet months this winter. Rainfall was generally
Weather and Climate Summary and Forecast Fall/Winter 2016
 Weather and Climate Summary and Forecast Fall/Winter 2016 Gregory V. Jones Southern Oregon University November 5, 2016 After a year where we were seemingly off by a month in terms of temperatures (March
L.O Students will learn about factors that influences the environment
 Name L.O Students will learn about factors that influences the environment Date 1. At the present time, glaciers occur mostly in areas of A) high latitude or high altitude B) low latitude or low altitude
Weather and Climate Summary and Forecast November 2017 Report
 Weather and Climate Summary and Forecast November 2017 Report Gregory V. Jones Linfield College November 7, 2017 Summary: October was relatively cool and wet north, while warm and very dry south. Dry conditions
PRECIPITATION. Last Week Precipitation:
 2/24/2015 NIDIS Drought and Water Assessment PRECIPITATION The images above use daily precipitation statistics from NWS COOP, CoCoRaHS, and CoAgMet stations. From top to bottom, and left to right: most
NIDIS Weekly Climate, Water and Drought Assessment Summary. Upper Colorado River Basin
 NIDIS Weekly Climate, Water and Drought Assessment Summary Upper Colorado River Basin August 3, 2010 Precipitation and Snowpack Fig. 1: July precipitation in inches Fig. 2: July precip as percent of average
The Pennsylvania Observer
 The Pennsylvania Observer April 2, 2009 March 2009 Pennsylvania Weather Recap Prepared by Curt Harpster For the month of March the saying, In like a lion and out like a lamb really fit the pattern quite
Arizona Department of Environmental Quality Air Quality Division Air Assessment Section March 17, 2005
 Assessment of Qualification for Treatment Under the Arizona Natural and Exceptional Events Policy for the High Particulates (PM 10 ) Concentration Event in the Buckeye Area on September 18, 2004 Arizona
A summary of the heat episodes of June 2017
 A summary of the heat episodes of June 2017 By Richard H. Grumm and Elissa A. Smith National Weather Service State College, PA 1. Overview Over 1800 record high temperatures were set or tied during the
Monthly Long Range Weather Commentary Issued: APRIL 1, 2015 Steven A. Root, CCM, President/CEO
 Monthly Long Range Weather Commentary Issued: APRIL 1, 2015 Steven A. Root, CCM, President/CEO sroot@weatherbank.com FEBRUARY 2015 Climate Highlights The Month in Review The February contiguous U.S. temperature
The Weather Wire. Contents: Hail in Colorado. Hail in Colorado Drought Monitor June Summary/Statistics July Preview Rainfall Totals
 The Weather Wire July 2016 Volume 23 Number 7 Contents: Hail in Colorado Drought Monitor June Summary/Statistics July Preview Rainfall Totals Hail in Colorado Anyone who has lived in Colorado for long
Weather and Climate of the Rogue Valley By Gregory V. Jones, Ph.D., Southern Oregon University
 Weather and Climate of the Rogue Valley By Gregory V. Jones, Ph.D., Southern Oregon University The Rogue Valley region is one of many intermountain valley areas along the west coast of the United States.
NIDIS Drought and Water Assessment
 NIDIS Drought and Water Assessment PRECIPITATION The images above use daily precipitation statistics from NWS COOP, CoCoRaHS, and CoAgMet stations. From top to bottom, and left to right: most recent 7-days
NIDIS Intermountain West Drought Early Warning System September 4, 2018
 NIDIS Drought and Water Assessment NIDIS Intermountain West Drought Early Warning System September 4, 2018 Precipitation The images above use daily precipitation statistics from NWS COOP, CoCoRaHS, and
West Henrico Co. - Glen Allen Weather Center N W. - Koontz
 PAGE #1 Oct 2017 West Henrico Co. - Glen Allen Weather Center 37.6554 N. 77.5692 W. - Koontz 1 2 3 4 5 6 7 8 9 10 11 12 13 14 15 16 17 18 19 Oct Week TEMPERATURE F TEMPERATURE F SKY PRECIPITATION FROZ.
NIDIS Intermountain West Drought Early Warning System February 12, 2019
 NIDIS Intermountain West Drought Early Warning System February 12, 2019 Precipitation The images above use daily precipitation statistics from NWS COOP, CoCoRaHS, and CoAgMet stations. From top to bottom,
Weather and Climate Summary and Forecast Winter
 Weather and Climate Summary and Forecast Winter 2016-17 Gregory V. Jones Southern Oregon University December 5, 2016 Well after an October that felt more like November, we just finished a November that
SOUTHERN CLIMATE MONITOR
 SOUTHERN CLIMATE MONITOR MARCH 2011 VOLUME 1, ISSUE 3 IN THIS ISSUE: Page 2 to 4 Severe Thunderstorm Climatology in the SCIPP Region Page 4 Drought Update Page 5 Southern U.S. Precipitation Summary for
NIDIS Intermountain West Drought Early Warning System July 18, 2017
 NIDIS Drought and Water Assessment NIDIS Intermountain West Drought Early Warning System July 18, 2017 Precipitation The images above use daily precipitation statistics from NWS COOP, CoCoRaHS, and CoAgMet
The Pennsylvania Observer
 The Pennsylvania Observer January 5, 2009 December 2008 Pennsylvania Weather Recap The final month of 2008 was much wetter than average and a bit colder than normal. In spite of this combination, most