Arizona Climate Summary October 2013
|
|
|
- Amos Hutchinson
- 5 years ago
- Views:
Transcription


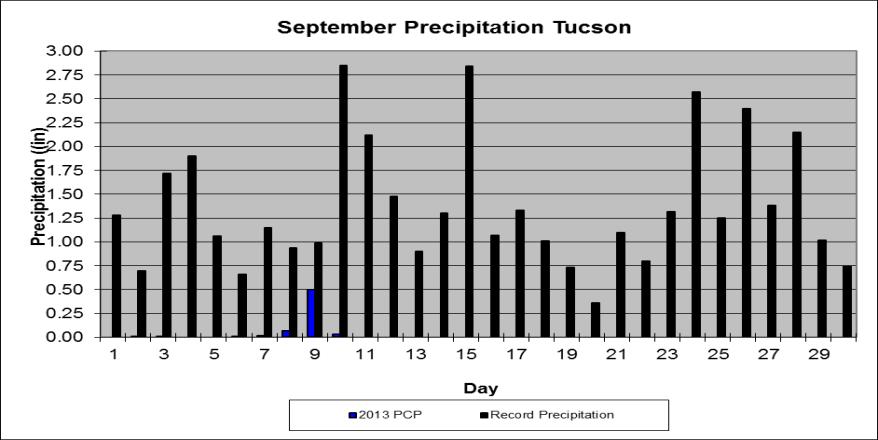
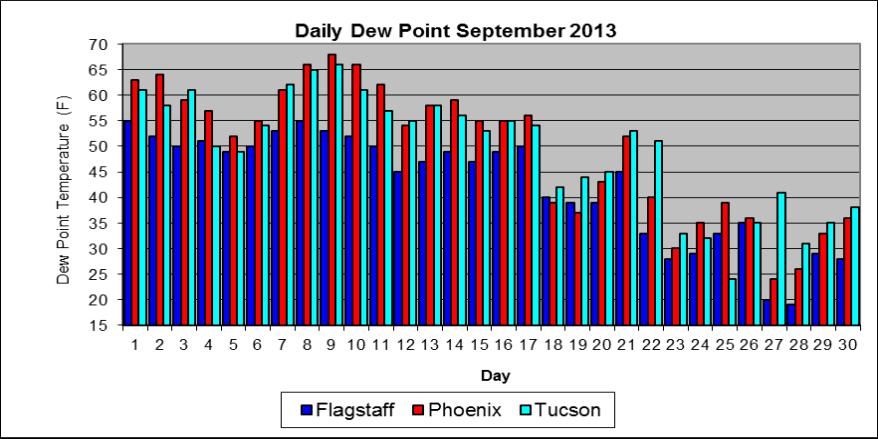
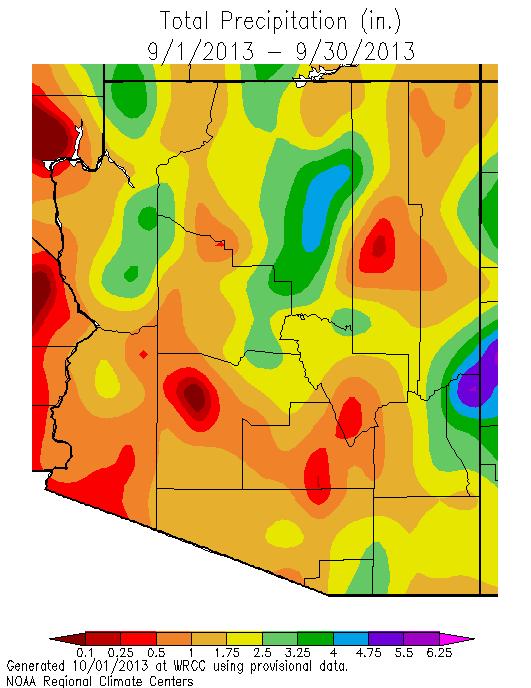
1 Arizona Climate Summary October 2013 Summary of conditions for September 2013 September 2013 Temperature and Precipitation Summary September 1 st 16 th : With moist conditions still present throughout the state, September started off with a fair amount of precipitation. Toward the end of the first week and into the second week of the month, major cities recorded their greatest 24-hour precipitation value with Flagstaff reporting 1.01 of rainfall, and Phoenix and Tucson both reporting half an inch of rainfall on the 9 th. Much drier conditions following the first two weeks, with only 0.03 of precipitation recorded in Flagstaff on the 14 th and 0.02 on the 15 th and 16 th. Phoenix and Tucson did not report precipitation. Flagstaff set new record of 63 degrees for lowest maximum on the 10 th, beating the previous record of 65 degrees in Phoenix set new records for highest minimum on the 6 th and precipitation on the 9 th. The new highest minimum for Phoenix on the 6 th is 89 degrees, where the previous record was 87 degrees in The newest precipitation record for Phoenix on the 9 th is 0.50 from the previous record of 0.32 in Tucson set a new record of 80 degrees for highest minimum, from the previous record of 77degrees in September 17 th 30 th : A large high pressure ridge in the jet stream settled over the Midwest allowing for dry air to be pulled in from the west into Arizona. Drier conditions persisted for the rest of the month and throughout most of the state. Nighttime lows began to drop as a result of the dry air as well as the daytime highs. A deep trough in the jet stream over the west coast and into northern Arizona produced strong winds at the surface, but the atmosphere remained relatively stable due to the diminished amount of atmospheric moisture. On the 18 th, dew point temperatures dropped into the 30s and never recovered, so the monsoon activity was essentially over. A maximum peak wind gust of 64 mph was reported in Flagstaff on the 26 th. On the 16 th, Phoenix reported a highest minimum of 88 degrees, beating the previous record of 86 degrees in 1998, and, on the 17 th, Phoenix reported a highest minimum temperature of 88 degrees, beating the previous record of 85 degrees in The last 8 days of the month were dry over most of the state. Southern Arizona continued to have rain through the 22 nd, and Flagstaff had 0.19 on the 27 th. The first freezing day of the year was the 23 rd when Flagstaff, Grand Canyon and Window Rock all had freezing temperatures. In This Issue: Overview of September, graphs of the September daily maximum and minimum temperatures, precipitation, mean daily dew points for Flagstaff, Phoenix, and Tucson; September climate statistics, maps of mean monthly maximum and minimum temperatures, precipitation, dew points, wind speeds for September; and graphs of the mean September temperature and precipitation for the period of record for Tucson, Phoenix, and Flagstaff, graphs of the cumulative precipitation for the calendar year for Flagstaff, Phoenix, and Tucson. Climate calendars for Flagstaff, Phoenix, Tucson, Prescott, Winslow and Yuma, including daily and monthly normals and extremes, for each month of the year, can be downloaded directly from the State Climate website. See p. 16 of this report for calendar abbreviations. Data are preliminary and are from the National Weather Service Forecast Offices in Flagstaff, Phoenix and Tucson. **Note: The discrepancy between the Statewide Temperature and Precipitation values for Phoenix, Flagstaff and Tucson and the daily values in their graphs are due to the reporting times. Statewide Temperature and Precipitation values are taken at 5pm, while official daily records at the airports are taken from Midnight to Midnight. State Climate Office Dr. Nancy J. Selover, State Climatologist Tel: Arizona State Climate Office 1 School of Geographical Sciences & Urban Planning Arizona State University Tempe, AZ Edited by Nancy J. Selover & Richard Ames

2 September 2013 Daily Temperature, Precipitation, & Dew Point for Flagstaff, Phoenix, and Tucson 2
3 3
4 FLAGSTAFF CLIMATE STATISTICS September 2013 This September had no significant ranking in temperature and precipitation. Avg Max Temp (F) 71.4 Normal 72.9 Avg Min Temp (F) 42.7 Normal 42.0 Avg Mean Temp (F) 57.1 Normal 57.4 Departure from Normal (F) -0.3 Highest Monthly Avg Temp (F) 62.1 in 1947 Lowest Monthly Avg Temp (F) 52.3 in 1912 Highest Temp this month (F): 81 on 3 rd and 4 th Lowest Temp this month (F): 25 on 8 th Record High (F): 91 on 09/03/1948 Record Low (F): 20 on 09/22/1912 Temperature or precipitation records this month: 6 th LoMax 58 tied, first set in th LoMax 63 set, previous record 65 in 1996 Flagstaff Number of Days of: Minimum Temp 50 o F or higher 7 Minimum Temp 30 o F or lower 4 Maximum Temp 80 o F or higher 2 Maximum Temp 65 o F or lower 7 Heating Degree Days 236 Normal 229 Cooling Degree Days 4 Normal 3 Degree base 65 o F Total September Precipitation 3.25 Normal September Precipitation 2.38 Departure from normal 0.87 Greatest 24-Hr Precipitation 1.60 on 09/08-09/09 Total Precipitation Year-to-Date Departure from Normal 4.36 Number of Days: Clear 24 Partly Cloudy 4 Cloudy 2 Greatest September Precipitation 6.75 in 1983 Least September Precipitation 0.00 in 1992 and 4 other years Average Wind Speed Highest Peak Gust 5.0 mph 64 mph from 230 o on 26 th PHOENIX CLIMATE STATISTICS September 2013 This September had no significant ranking in temperature and precipitation. Avg Max Temp(F) 99.5 Normal 99.8 Avg Min Temp(F) 77.9 Normal 76.9 Avg Mean Temp (F) 88.7 Normal 88.4 Departure from Normal (F) 0.3 Highest Monthly Avg Temp (F) 92.2 in 2001 Lowest Monthly Avg Temp (F) 78.9 in 1912 Highest Temp this month (F): 111 on 6 th and 7 th Lowest Temp this month (F): 63 on 28 th Record High (F): 116 on 09/01/1950 Record Low (F): 47 on 09/21/1965 Temperature and precipitation records this month: 5 th HiMax 111 tied, first set in th HiMax 111 tied, first set in th HiMin 89 set, previous record 87 in th LoMax 84 tied, first set in th Precip 0.50 set, previous record th LoMax 86 tied, first set in th HiMin 88 set, previous record 86 in th HiMin 88 set, previous record 85 in 1992 Phoenix Number of Days of: Minimum Temp 70 o F or lower 6 Minimum Temp 85 o F or higher 8 Maximum Temp 90 o F or lower 4 Maximum Temp 110 o F or higher 3 4
5 Heating Degree Days 0 Normal 0 Cooling Degree Days 719 Normal 700 Degree base 65 o F Total September Precipitation 0.86 Normal September Precipitation 0.64 Departure from normal 0.22 Greatest 24-Hr Precipitation 0.50 on 09/09-09/09 Total Precipitation Year-to-Date 5.60 Departure from Normal Number of Days: Clear 20 Partly Cloudy 10 Cloudy 0 Greatest September Precipitation 5.41 in 1939 Least September Precipitation 0.00 in 2001 and 15 other years Average Wind Speed 6.5 mph Highest Peak Gust 35 mph from 200 o on 2 nd TUCSON CLIMATE STATISTICS September 2013 This September had no significant ranking in temperature and precipitation. Avg Max Temp(F) 95.5 Normal 94.5 Avg Min Temp(F) 70.4 Normal 68.6 Avg Mean Temp(F) 82.9 Normal 81.6 Departure from Normal (F) 1.3 Highest Monthly Avg Temp (F) 84.8 in 2000 Lowest Monthly Avg Temp (F) 76.3 in 1964 Highest Temp this month (F): Lowest Temp this month (F): Record High (F): 107 on 09/14/2000 Record Low (F): 43 on 09/26/ on 3 rd and 5 th 57 on 28 th Temperature or precipitation records this month: 13 th HiMin 76 tied, first set in th HiMin 78 tied, first set in th HiMin 80 set, previous record 77 in th HiMin 81 tied, first set in 1928 Tucson Number of Days of: Minimum Temp 60 o F or lower 2 Minimum Temp 80 o F or higher 2 Maximum Temp 80 o F or lower 1 Maximum Temp 100 o F or higher 10 Heating Degree Days 0 Normal 0 Cooling Degree Days 547 Normal 497 Degree base 65 o F Total September Precipitation 0.63 Normal September Precipitation 1.29 Departure from normal Greatest 24-Hr Precipitation 0.53 on 09/09-09/10 Total Precipitation Year-to-Date 5.48 Departure from Normal Greatest September Precipitation 5.60 in 2011 Least September Precipitation 0.00 in 1968 and 5 other years Number of Days: Clear 26 Partly Cloudy 4 Cloudy 0 Average Wind Speed Highest Peak Gust 7.6 mph 40 mph from 230 o on 26 th Data are from the National Weather Service and the National Climatic Data Center and are preliminary. 5
6 Winds for September: Day Phoenix Flagstaff Tucson (mph) Avg Max Avg Max Avg Max M Dew Points for September: Daily Average Dew Point ( o F): Day Phx Tuc Flg
7 7
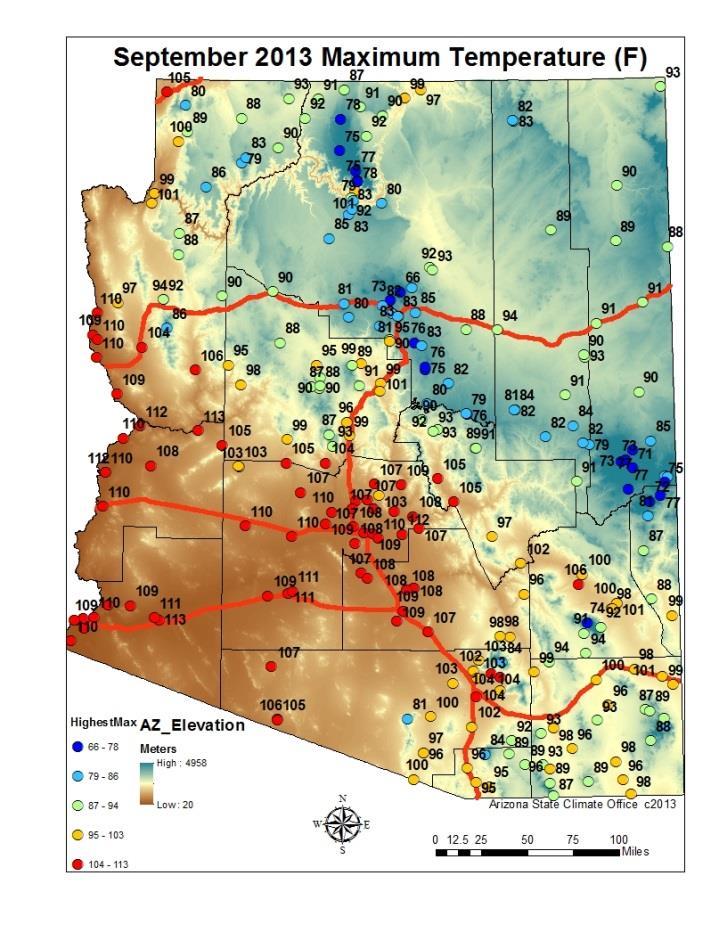
8 The lowest minimum temperature was 20 o F at Springerville, and the highest minimum was 89 o F at Phoenix Sky Harbor airport. The lowest maximum temperature of 65 o F was recorded at Lindberg Hill, while the highest maximum temperature of 112 o F was reported at Parker and East Mesa. The lowest rainfall amount was 0.02 at Yuma and the highest was 6.43 at Mount Logan. The lowest dew point was 19 o F at Flagstaff and the highest was 68 o F at Phoenix. The highest peak wind gust was 64 mph at both Tweeds Point and Horse camp Canyon. 8
9 9


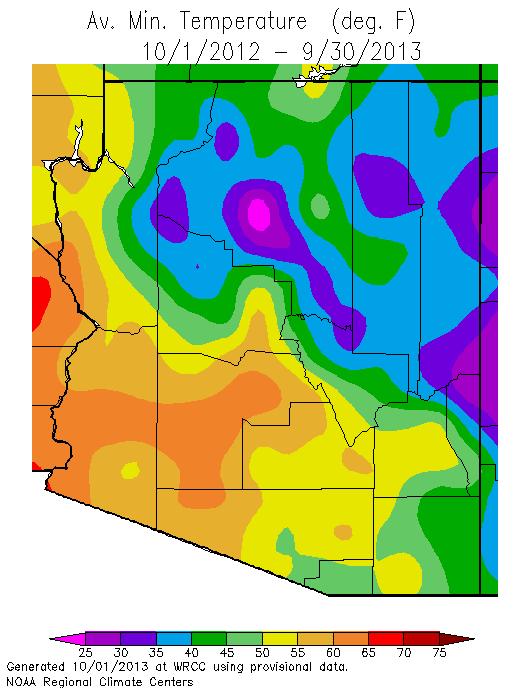
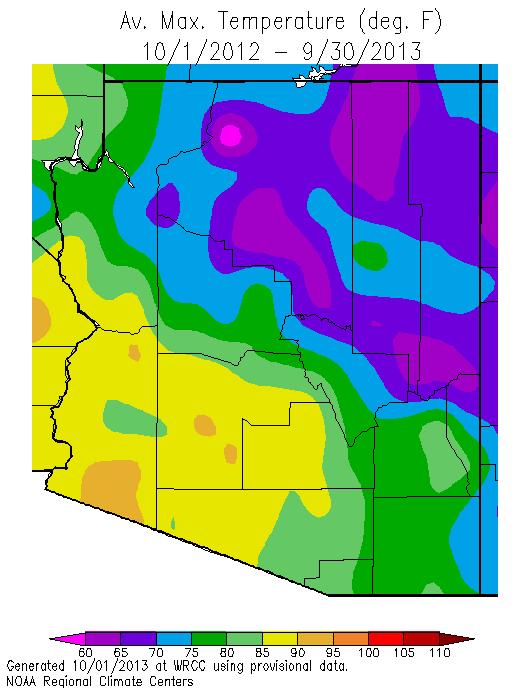
10 September minimum temperatures were generally within 2 o F of normal statewide, with two significant exceptions. Western Pima County was as much as 8 degrees cooler than normal and Gila County was as much as 8 degrees warmer than normal. However, since Gila County was also much warmer than normal last month, it is possible that there has been an instrument move or some other change to the reporting station. Daytime temperatures were generally cooler than normal, but the variation ranges from 2 or 3oF cooler in central Arizona to 5oF cooler in the northwest corner of the state. Northern Graham and Greenlee and southern Apache counties were slightly warmer than normal. September precipitation was extremely variable, just as it was in August with most areas receiving more rainfall than normal but a few areas of western Maricopa, Yavapai and Coconino, and eastern Pinal county much drier than normal. 10
11 11


12 Calendar Year 2013 Nighttime temperatures for the calendar year continue to be within 2 o F of normal for this time of year, with cooler temperatures on the Colorado Plateau and in Pima County, and warmer temperatures along the Colorado River Valley and in the southeastern counties. Daytime temperatures have been more variable around the state. Yuma, La Paz, western Yavapai, and southern Cochise counties were o F warmer than normal while the eastern Gila, southern and central Navajo, central Apache, central Pima and Pinal counties, were 0.5 to 1.5 o F cooler than normal. Precipitation has been less than 70% of normal in western Maricopa, western Yavapai, eastern Pima, and Graham counties. The wet spots for the year are now east central Coconino County, and La Paz County. 12
13 13


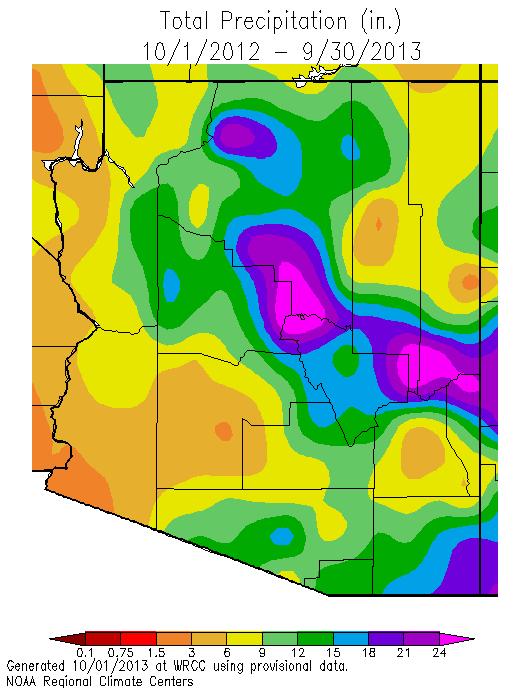
14 2013 Water Year Minimum temperatures ended up within 2 o F of normal across the state, with the cooler locations in Coconino, Apache, Navajo, and western Pima counties. Maximum temperatures were within 2 o F of normal in statewide, with warmer conditions in the west and southeast, and cooler conditions in northeast, south central and east central Arizona. The water year precipitation totals are above average in north central Arizona and La Paz County, but continue to be much drier than average in western Maricopa and Graham counties as well as northern Mohave and Apache counties, western Coconino and eastern Pima County. 14


15 September Mean Temperature Graphs Flagstaff, Phoenix, and Tucson : 15


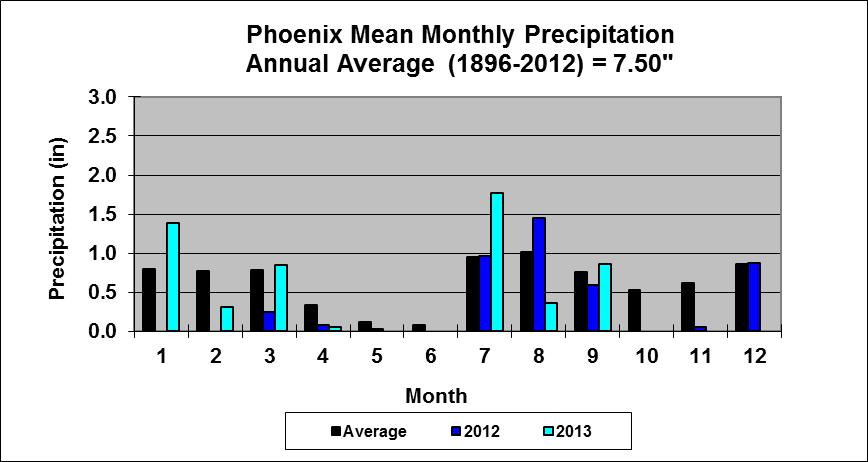
16 September Mean Precipitation Graphs Flagstaff, Phoenix, and Tucson : 16


17 2013 Cumulative Precipitation Graphs Flagstaff, Phoenix and Tucson: After the monsoon, precipitation is above average in Flagstaff, near average in Phoenix, and below average in Tucson. 17
 LO MAX = Lowest maximum temperature for that day (F) LO MIN = Lowest minimum temperature for that day (F) HI")
18 The downloadable normals and extremes calendars use the following abbreviations: NORM = 30 year ( ) average value (degrees Fahrenheit (F)) OBS = The temperature observation for that day this year AVG = Average daily temperature HI MAX = Highest maximum temperature for that day (F) LO MAX = Lowest maximum temperature for that day (F) LO MIN = Lowest minimum temperature for that day (F) HI MIN = Highest minimum temperature for that day (F) Mx PCP = Maximum precipitation for that day (inches) Mx SNO = Maximum snowfall for that day (inches) 18
Arizona Climate Summary August 2013
 Arizona Climate Summary August 2013 Summary of conditions for July 2013 July 2013 Temperature and Precipitation Summary July 1 st 16 th : To start off the month of July, a high pressure system came in
Arizona Climate Summary November 2013
 Arizona Climate Summary November 2013 Summary of conditions for October 2013 October 2013 Temperature and Precipitation Summary October 1 st 16 th : The month of October started off with fair weather conditions
Arizona Climate Summary
 Arizona Climate Summary April 2014 Summary of conditions for March 2014 March 2014 Temperature and Precipitation Summary March 1 st 16 th : We started off the month of March with a significant precipitation
Arizona Climate Summary June 2013
 Arizona Climate Summary June 2013 Summary of conditions for May 2013 May 2013 Temperature and Precipitation Summary May 1 st 16 th : May began with above normal daily temperatures and breezy conditions
Arizona Climate Summary
 Arizona Climate Summary March 2014 Summary of conditions for February 2014 February 2014 Temperature and Precipitation Summary February 1 st 16 th : We started off the month of February with some moisture
Arizona Climate Summary
 August 2015 Temperature and Precipitation Summary Arizona Climate Summary September 2015 Summary of conditions for August 2015 August 1 st 16 th : August was a wet month across the state with only 3 days
Arizona Climate Summary October 2016 Summary of conditions for September 2016
 September 2016 Temperature and Precipitation Summary Arizona Climate Summary October 2016 Summary of conditions for September 2016 September 1 st 14 th : High pressure over the Four Corners brought rainfall
Arizona Climate Summary November 2015 Summary of conditions for October 2015
 October 2015 Temperature and Precipitation Summary Arizona Climate Summary November 2015 Summary of conditions for October 2015 October 1 st 14 th : October began with high pressure over the southwest,
Arizona Climate Summary May 2015 Summary of conditions for April 2015
 Arizona Climate Summary May 2015 Summary of conditions for April 2015 April 2015 Temperature and Precipitation Summary April 1 st 16 th : April began with very light showers in Nogales and Coronado National
Arizona Climate Summary July 2015 Summary of conditions for June 2015
 June 2015 Temperature and Precipitation Summary Arizona Climate Summary July 2015 Summary of conditions for June 2015 June 1 st 14 th : Similar to May, June began with high pressure in the west, and conditions
Arizona Climate Summary January 2017 Summary of conditions for December 2016
 Arizona Climate Summary January 2017 Summary of conditions for December 2016 December 2016 Temperature and Precipitation Summary December 1 st 15 th : Similar to November, December began with a dry trough
Arizona Climate Summary April 2013
 Arizona Climate Summary April 2013 Summary of conditions for March 2013 March 2013 Temperature and Precipitation Summary March 1 st 16 th : March began as a ridge of high pressure progressed across the
Arizona Climate Summary September 2017 Summary of conditions for August 2017
 August 2017 Temperature and Precipitation Summary Arizona Climate Summary September 2017 Summary of conditions for August 2017 August 1 st 15 th : The monsoon activity that ended July continued into the
Arizona Climate Summary November 2017 Summary of conditions for October 2017
 Arizona Climate Summary November 2017 Summary of conditions for October 2017 October 2017 Temperature and Precipitation Summary October 1 st 18 th : A low pressure system from the northwestern U.S. moved
Arizona Climate Summary June 2017 Summary of conditions for May 2017
 Arizona Climate Summary June 2017 Summary of conditions for May 2017 May 2017 Temperature and Precipitation Summary May 1 st 16 th : A strong ridge of high pressure developed over the southwest during
Arizona Climate Summary October 2018 Summary of conditions for September 2018
 Arizona Climate Summary October 2018 Summary of conditions for September 2018 September 2018 Temperature and Precipitation Summary September 1 st 17 th : The wet pattern from August continued into September
Arizona Climate Summary December 2017 Summary of conditions for November 2017
 November 2017 Temperature and Precipitation Summary Arizona Climate Summary December 2017 Summary of conditions for November 2017 November 1 st 17 th : October ended with a little bit of precipitation
Arizona Climate Summary
 Arizona Climate Summary August 2016 Summary of conditions for July 2016 July 2016 Temperature and Precipitation Summary July 1 st 15 th : As June ended and July began, a shortwave moved through the southwest
Arizona Climate Summary November 2016 Summary of conditions for October 2016
 Arizona Climate Summary November 2016 Summary of conditions for October 2016 October 2016 Temperature and Precipitation Summary October 1 st 16 th : October began with high pressure over Mexico, bringing
Arizona Climate Summary February 2012
 Arizona Climate Summary February 2012 Summary of conditions for January 2012 January 2012 Temperature and Precipitation Summary January 1 st 20 th : The New Year has started on a very dry note. The La
Arizona Climate Summary September 2018 Summary of conditions for August 2018
 August 2018 Temperature and Precipitation Summary Arizona Climate Summary September 2018 Summary of conditions for August 2018 August 1 st 15 th : August began with high pressure centered over the state
Arizona Climate Summary
 May 2015 Temperature and Precipitation Summary Arizona Climate Summary June 2015 Summary of conditions for May 2015 May 1 st 14 th : May began with high pressure in the west, and May 1 st was dry statewide,
Arizona Climate Summary May 2012
 Arizona Climate Summary May 2012 Summary of conditions for April 2012 April 2012 Temperature and Precipitation Summary April 1 st 16 th : Although April began with another low pressure system sweeping
Arizona Climate Summary
 April 2016 Temperature and Precipitation Summary Arizona Climate Summary May 2016 Summary of conditions for April 2016 April 1 st 15 th : April 1 st saw the tail end of a low pressure system move out of
Arizona Climate Summary May 2013
 Arizona Climate Summary May 2013 Summary of conditions for April 2013 April 2013 Temperature and Precipitation Summary April 1 st 16 th : The first week of April featured a ridge of high pressure over
Arizona Climate Summary October 2015 Summary of conditions for September 2015
 September 2015 Temperature and Precipitation Summary Arizona Climate Summary October 2015 Summary of conditions for September 2015 September 1 st 18 th : September began with high pressure over southern
Arizona Climate Summary December 2016 Summary of conditions for November 2016
 Arizona Climate Summary December 2016 Summary of conditions for November 2016 November 2016 Temperature and Precipitation Summary November 1 st 16 th : November began with a dry low pressure system moving
Arizona Climate Summary November 2018 Summary of conditions for October 2018
 Arizona Climate Summary November 2018 Summary of conditions for October 2018 October 2018 Temperature and Precipitation Summary October 1 st 15 th : The 2018 water year ending September 30 th was exceptionally
Arizona Climate Summary March 2013
 Arizona Climate Summary March 2013 Summary of conditions for February 2013 February 2013 Temperature and Precipitation Summary February 1 st 16 th : February began with a ridge of high pressure over the
Arizona Climate Summary May 2018 Summary of conditions for April 2018
 April 2018 Temperature and Precipitation Summary Arizona Climate Summary May 2018 Summary of conditions for April 2018 April 1 st 16 th : April was a very dry month across Arizona. Several low pressure
Arizona Climate Summary
 Arizona Climate Summary June 2012 Summary of conditions for May 2012 May 2012 Temperature and Precipitation Summary May 1 st 16 th : May began with a surface cold front sweeping across the western states
Arizona Climate Summary February 2016 Summary of conditions for January 2016
 January 2016 Temperature and Precipitation Summary Arizona Climate Summary February 2016 Summary of conditions for January 2016 January 1 st 14 th : The new year began with high pressure over the southwest
Arizona Climate Summary February 2018 Summary of conditions for January 2018
 Arizona Climate Summary February 2018 Summary of conditions for January 2018 January 2018 Temperature and Precipitation Summary January 1 st 19 th : The new year began with a ridge of high pressure over
Arizona Climate Summary April 2018 Summary of conditions for March 2018
 Arizona Climate Summary April 2018 Summary of conditions for March 2018 March 2018 Temperature and Precipitation Summary March 1 st 16 th : March began with rainfall in southeastern Arizona as the tail
Arizona Climate Summary October 2012
 Arizona Climate Summary October 2012 Summary of conditions for September 2012 September 2012 Temperature and Precipitation Summary September 1 st 14 th : September began with an upper level low pressure
Arizona Climate Summary September 2014 Summary of conditions for August 2014
 Arizona Climate Summary September 2014 Summary of conditions for August 2014 August 2014 Temperature and Precipitation Summary August 1 st 16 th : The first 5 days of August were quite wet with high pressure
Colorado State University, Fort Collins, CO Weather Station Monthly Summary Report
 Colorado State University, Fort Collins, CO Weather Station Monthly Summary Report Month: December Year: 2017 Temperature: Mean T max was 47.2 F which is 4.4 above the 1981-2010 normal for the month. This
Colorado State University, Fort Collins, CO Weather Station Monthly Summary Report
 Colorado State University, Fort Collins, CO Weather Station Monthly Summary Report Month: December Year: 2016 Temperature: Mean T max was 39.7 F which is 3.1 below the 1981-2010 normal for the month. This
Monthly Long Range Weather Commentary Issued: July 18, 2014 Steven A. Root, CCM, President/CEO
 Monthly Long Range Weather Commentary Issued: July 18, 2014 Steven A. Root, CCM, President/CEO sroot@weatherbank.com JUNE 2014 REVIEW Climate Highlights The Month in Review The average temperature for
Colorado State University, Fort Collins, CO Weather Station Monthly Summary Report
 Colorado State University, Fort Collins, CO Weather Station Monthly Summary Report Month: January Year: 2019 Temperature: Mean T max was 47.2 F which is 3.0 above the 1981-2010 normal for the month. This
Champaign-Urbana 1999 Annual Weather Summary
 Champaign-Urbana 1999 Annual Weather Summary ILLINOIS STATE WATER SURVEY 2204 Griffith Dr. Champaign, IL 61820 wxobsrvr@sws.uiuc.edu Maria Peters, Weather Observer A major snowstorm kicked off the new
2012 Growing Season Weather Summary for North Dakota. Adnan Akyüz and Barbara A. Mullins Department of Soil Science October 30, 2012
 2012 Growing Season Weather Summary for North Dakota Adnan Akyüz and Barbara A. Mullins Department of Soil Science October 30, 2012 Introduction The 2012 growing season (the period from April through September)
2011 Year in Review TORNADOES
 2011 Year in Review The year 2011 had weather events that will be remembered for a long time. Two significant tornado outbreaks in April, widespread damage and power outages from Hurricane Irene in August
Monthly Long Range Weather Commentary Issued: February 15, 2015 Steven A. Root, CCM, President/CEO
 Monthly Long Range Weather Commentary Issued: February 15, 2015 Steven A. Root, CCM, President/CEO sroot@weatherbank.com JANUARY 2015 Climate Highlights The Month in Review During January, the average
Champaign-Urbana 2000 Annual Weather Summary
 Champaign-Urbana 2000 Annual Weather Summary ILLINOIS STATE WATER SURVEY 2204 Griffith Dr. Champaign, IL 61820 wxobsrvr@sws.uiuc.edu Maria Peters, Weather Observer January: January started on a mild note,
Champaign-Urbana 1998 Annual Weather Summary
 Champaign-Urbana 1998 Annual Weather Summary ILLINOIS STATE WATER SURVEY Audrey Bryan, Weather Observer 2204 Griffith Dr. Champaign, IL 61820 wxobsrvr@sparc.sws.uiuc.edu The development of the El Nìno
The Pennsylvania Observer
 The Pennsylvania Observer October 1, 2015 September 2015 - Pennsylvania Weather Recap By: Quinn Lease The month of September will be remembered for its above normal temperatures and dry conditions that
October 2015 Volume 22 Number 10
 The Weather Wire October 2015 Volume 22 Number 10 Contents: Local Frost/Freeze Information Drought Monitor September Summary/Statistics October Preview Rainfall Totals Local Frost Freeze Information Many
KANSAS CLIMATE SUMMARY January 2018
 KANSAS CLIMATE SUMMARY January 2018 Some welcome moisture After an extended period with little to no moisture, parts of Kansas recorded some significant precipitation. At Tribune, a small snow event on
SEPTEMBER 2013 REVIEW
 Monthly Long Range Weather Commentary Issued: October 21, 2013 Steven A. Root, CCM, President/CEO sroot@weatherbank.com SEPTEMBER 2013 REVIEW Climate Highlights The Month in Review The average temperature
Climate. Annual Temperature (Last 30 Years) January Temperature. July Temperature. Average Precipitation (Last 30 Years)
 January Temperature. July Temperature. Average Precipitation (Last 30 Years)") Climate Annual Temperature (Last 30 Years) Average Annual High Temp. (F)70, (C)21 Average Annual Low Temp. (F)43, (C)6 January Temperature Average January High Temp. (F)48, (C)9 Average January Low Temp.
Climate Annual Temperature (Last 30 Years) Average Annual High Temp. (F)70, (C)21 Average Annual Low Temp. (F)43, (C)6 January Temperature Average January High Temp. (F)48, (C)9 Average January Low Temp.
The Pennsylvania Observer
 The Pennsylvania Observer The Pennsylvania Observer September 16, 2004 Recap of Pennsylvania's weather from August 6 - September 12, 2004. http://pasc.met.psu.edu/pa_climatologist/nl/archive/20040916/sec1.php
Monthly Long Range Weather Commentary Issued: APRIL 1, 2015 Steven A. Root, CCM, President/CEO
 Monthly Long Range Weather Commentary Issued: APRIL 1, 2015 Steven A. Root, CCM, President/CEO sroot@weatherbank.com FEBRUARY 2015 Climate Highlights The Month in Review The February contiguous U.S. temperature
Weather and Climate Summary and Forecast August 2018 Report
 Weather and Climate Summary and Forecast August 2018 Report Gregory V. Jones Linfield College August 5, 2018 Summary: July 2018 will likely go down as one of the top five warmest July s on record for many
A summary of the heat episodes of June 2017
 A summary of the heat episodes of June 2017 By Richard H. Grumm and Elissa A. Smith National Weather Service State College, PA 1. Overview Over 1800 record high temperatures were set or tied during the
The Weather Wire. Contents: Summer 2018 Outlook. Summer 2018 Outlook Drought Monitor May Summary/Statistics June Preview Rainfall Totals
 The Weather Wire June 2018 Volume 25 Number 6 Contents: Summer 2018 Outlook Drought Monitor May Summary/Statistics June Preview Rainfall Totals Summer 2018 Outlook June 1 st marked the first day of meteorological
Monthly Long Range Weather Commentary Issued: May 15, 2014 Steven A. Root, CCM, President/CEO
 Monthly Long Range Weather Commentary Issued: May 15, 2014 Steven A. Root, CCM, President/CEO sroot@weatherbank.com APRIL 2014 REVIEW Climate Highlights The Month in Review The average temperature for
NIDIS Drought and Water Assessment
 NIDIS Drought and Water Assessment PRECIPITATION The images above use daily precipitation statistics from NWS COOP, CoCoRaHS, and CoAgMet stations. From top to bottom, and left to right: most recent 7-days
National Wildland Significant Fire Potential Outlook
 National Wildland Significant Fire Potential Outlook National Interagency Fire Center Predictive Services Issued: September, 2007 Wildland Fire Outlook September through December 2007 Significant fire
The Pennsylvania Observer
 The Pennsylvania Observer April 2, 2009 March 2009 Pennsylvania Weather Recap Prepared by Curt Harpster For the month of March the saying, In like a lion and out like a lamb really fit the pattern quite
Monthly Long Range Weather Commentary Issued: APRIL 25, 2016 Steven A. Root, CCM, Chief Analytics Officer, Sr. VP, sales
 Monthly Long Range Weather Commentary Issued: APRIL 25, 2016 Steven A. Root, CCM, Chief Analytics Officer, Sr. VP, sales sroot@weatherbank.com MARCH 2016 Climate Highlights The Month in Review The March
Monthly Long Range Weather Commentary Issued: NOVEMBER 16, 2015 Steven A. Root, CCM, Chief Analytics Officer, Sr. VP, sales
 Monthly Long Range Weather Commentary Issued: NOVEMBER 16, 2015 Steven A. Root, CCM, Chief Analytics Officer, Sr. VP, sales sroot@weatherbank.com OCTOBER 2015 Climate Highlights The Month in Review The
July 2007 Climate Summary
 Dan Bowman (765) 494-6574 Sep 3, 2007 http://www.iclimate.org Summary July 2007 Climate Summary The month of July ended as a very unusual month. Many events occurred during the month of July that is not
The Pennsylvania Observer
 The Pennsylvania Observer March 4, 2009 February 2009 Pennsylvania Weather Recap Prepared by Chris Slocum In Punxsutawney, Pa, the world's most famous groundhog, Punxsutawney Phil, spotted his shadow on
The Pennsylvania Observer
 The Pennsylvania Observer September 3, 2008 Summer 2008 Weather Summary Written by: Brian Thompson The opening days of June started dry, but a warm front brought a widespread rain a couple of days into
The Pennsylvania Observer
 The Pennsylvania Observer January 5, 2009 December 2008 Pennsylvania Weather Recap The final month of 2008 was much wetter than average and a bit colder than normal. In spite of this combination, most
NIDIS Drought and Water Assessment
 7/23/13 1:57 PM PRECIPITATION The images above use daily precipitation statistics from NWS COOP, CoCoRaHS, and CoAgMet stations. From top to bottom, and left to right: most recent 7-days of accumulated
Monthly Long Range Weather Commentary Issued: SEPTEMBER 19, 2016 Steven A. Root, CCM, Chief Analytics Officer, Sr. VP,
 Monthly Long Range Weather Commentary Issued: SEPTEMBER 19, 2016 Steven A. Root, CCM, Chief Analytics Officer, Sr. VP, sroot@weatherbank.com SEPTEMBER 2016 Climate Highlights The Month in Review The contiguous
Impacts of the April 2013 Mean trough over central North America
 Impacts of the April 2013 Mean trough over central North America By Richard H. Grumm National Weather Service State College, PA Abstract: The mean 500 hpa flow over North America featured a trough over
Nebraska experienced a wide
 Issue 1 August 2016 CLIMATE UPDATE A MONTHLY SUMMARY FROM THE neclimate.unl.edu August saw reprieve from dryness, cooler temps Overview Nebraska experienced a wide range of conditions across the state
Presentation Overview. Southwestern Climate: Past, present and future. Global Energy Balance. What is climate?
 Southwestern Climate: Past, present and future Mike Crimmins Climate Science Extension Specialist Dept. of Soil, Water, & Env. Science & Arizona Cooperative Extension The University of Arizona Presentation
Champaign-Urbana 2001 Annual Weather Summary
 Champaign-Urbana 2001 Annual Weather Summary ILLINOIS STATE WATER SURVEY 2204 Griffith Dr. Champaign, IL 61820 wxobsrvr@sws.uiuc.edu Maria Peters, Weather Observer January: After a cold and snowy December,
Monthly Long Range Weather Commentary Issued: APRIL 18, 2017 Steven A. Root, CCM, Chief Analytics Officer, Sr. VP,
 Monthly Long Range Weather Commentary Issued: APRIL 18, 2017 Steven A. Root, CCM, Chief Analytics Officer, Sr. VP, sroot@weatherbank.com MARCH 2017 Climate Highlights The Month in Review The average contiguous
LOCAL CLIMATOLOGICAL DATA FOR FREEPORT ILLINOIS
 Climatological Summary: LOCAL CLIMATOLOGICAL DATA FOR FREEPORT ILLINOIS 1905-1990 Freeport (Stephenson County) has a temperate continental climate, dominated by maritime tropical air from the Gulf of Mexico
KANSAS CLIMATE SUMMARY March 2018
 KANSAS CLIMATE SUMMARY March 2018 Another Dry Month The Southwest Division again missed out on most of the precipitation during March. State-wide the average precipitation was 0.97 inches or 41 percent
May 2005 Climate Summary
 Ashley Brooks (765) 494-6574 Jun 7, 2005 http://iclimate.org May 2005 Climate Summary May 1-5 Early May was characterized by an upper-level trough that was in place over Indiana that brought in very cool
Precipitation. Standardized Precipitation Index. NIDIS Intermountain West Drought Early Warning System September 5, 2017
 9/6/2017 NIDIS Drought and Water Assessment NIDIS Intermountain West Drought Early Warning System September 5, 2017 Precipitation The images above use daily precipitation statistics from NWS COOP, CoCoRaHS,
Weather and Climate Summary and Forecast Summer 2016
 Weather and Climate Summary and Forecast Summer 2016 Gregory V. Jones Southern Oregon University August 5, 2016 The month of July saw the continued flip, flop of the western US temperatures. It was warm
KANSAS CLIMATE SUMMARY May 2018
 KANSAS CLIMATE SUMMARY May 2018 From Cold to Hot May came close to setting the record as the hottest since 1895. The state-wide average temperature for the month was 70.6 o F. This was 7.2 degrees warmer
Weather and Climate Summary and Forecast Summer 2017
 Weather and Climate Summary and Forecast Summer 2017 Gregory V. Jones Southern Oregon University August 4, 2017 July largely held true to forecast, although it ended with the start of one of the most extreme
October Precipitation Statistics (124 Years) Rank: Figure 2: Historical October precipitation time series for Maryland.
 Rank: Figure 2: Historical October precipitation time series for Maryland.") PRECIPITATION Based on the National Centers for Environmental Information (NCEI), Office of the Maryland State the statewide total October precipitation was 3.88 inches, which was 1.01 inches less than
PRECIPITATION Based on the National Centers for Environmental Information (NCEI), Office of the Maryland State the statewide total October precipitation was 3.88 inches, which was 1.01 inches less than
Monthly Long Range Weather Commentary Issued: SEPTEMBER 19, 2015 Steven A. Root, CCM, Chief Analytics Officer, Sr. VP, sales
 Monthly Long Range Weather Commentary Issued: SEPTEMBER 19, 2015 Steven A. Root, CCM, Chief Analytics Officer, Sr. VP, sales sroot@weatherbank.com AUGUST 2015 Climate Highlights The Month in Review The
January 2011 Calendar Year Runoff Forecast
 January 2011 Calendar Year Runoff Forecast 2010 Runoff Year Calendar Year 2010 was the third highest year of runoff in the Missouri River Basin above Sioux City with 38.8 MAF, behind 1978 and 1997 which
KANSAS CLIMATE SUMMARY June 2017
 KANSAS CLIMATE SUMMARY June 2017 Uneven rainfall The wet May gave way to uneven rainfall in June. The statewide average precipitation was 3.23 inches or 74 percent of normal. The East Central and West
Weather and Climate Summary and Forecast October 2017 Report
 Weather and Climate Summary and Forecast October 2017 Report Gregory V. Jones Linfield College October 4, 2017 Summary: Typical variability in September temperatures with the onset of fall conditions evident
KANSAS CLIMATE SUMMARY August 2015
 KANSAS CLIMATE SUMMARY August 2015 Cool and Dry August was drier than normal in most of the state. State-wide average precipitation was 2.80 inches or 85 percent of normal. The Northeast division of the
Definitions Weather and Climate Climates of NYS Weather Climate 2012 Characteristics of Climate Regions of NYS NYS s Climates 1.
 Definitions Climates of NYS Prof. Anthony Grande 2012 Weather and Climate Weather the state of the atmosphere at one point in time. The elements of weather are temperature, t air pressure, wind and moisture.
NIDIS Drought and Water Assessment
 NIDIS Drought and Water Assessment PRECIPITATION The images above use daily precipitation statistics from NWS COOP, CoCoRaHS, and CoAgMet stations. From top to bottom, and left to right: most recent 7-days
New Hampshire State Climate Office Dr. Mary D. Stampone, State Climatologist
 New Hampshire State Climate Office Dr. Mary D. Stampone, State Climatologist University of New Hampshire c/o Department of Geography 73 Main Street Durham, NH 03824 Phone: 603-862-3136 Fax: 603-862-4362
National Meteorological Library and Archive
 National Meteorological Library and Archive Fact sheet No. 4 Climate of the United Kingdom Causes of the weather in the United Kingdom The United Kingdom lies in the latitude of predominately westerly
NIDIS Weekly Climate, Water and Drought Assessment Summary. Upper Colorado River Basin
 NIDIS Weekly Climate, Water and Drought Assessment Summary Upper Colorado River Basin August 3, 2010 Precipitation and Snowpack Fig. 1: July precipitation in inches Fig. 2: July precip as percent of average
PRECIPITATION. Last Week Precipitation:
 12/3/2014 NIDIS Drought and Water Assessment PRECIPITATION The images above use daily precipitation statistics from NWS COOP, CoCoRaHS, and CoAgMet stations. From top to bottom, and left to right: most
KANSAS CLIMATE SUMMARY October 2016
 KANSAS CLIMATE SUMMARY October 2016 Record warmth Temperatures continued the warmer than normal pattern through much of October. The state-wide average temperature was 60.9 of, or 5.6 degrees warmer than
Weather and Climate Summary and Forecast October 2018 Report
 Weather and Climate Summary and Forecast October 2018 Report Gregory V. Jones Linfield College October 4, 2018 Summary: Much of Washington, Oregon, coastal California and the Bay Area and delta region
The Pennsylvania Observer
 The Pennsylvania Observer June 2, 2010 May 2010 Pennsylvania Weather Recap This month completed one of the warmest springs on record in Pennsylvania. With about 75% of the days averaging above normal,
The Pennsylvania Observer
 The Pennsylvania Observer January 5, 2016 December 2015 - Pennsylvania Weather Recap By: Arthur Person December is the first of the three coldest months of the year. Sometimes it can be naughty, and sometimes
Paul M. Iñiguez* NOAA/National Weather Service, Phoenix, AZ
 JP2.9 THE PHOENIX RAINFALL INDEX Paul M. Iñiguez* NOAA/National Weather Service, Phoenix, AZ 1. INTRODUCTION Like many other large western cities, Phoenix has a database of daily weather observations,
The Weather Wire. Current Colorado Snowpack. Contents:
 The Weather Wire January 2019 Volume 26 Number 1 Contents: Current Colorado Snowpack Denver Snowfall Since 1999-2000 Denver 2018 Climate Review Drought Monitor December Summary/Statistics January Preview
NIDIS Intermountain West Drought Early Warning System September 4, 2018
 NIDIS Drought and Water Assessment NIDIS Intermountain West Drought Early Warning System September 4, 2018 Precipitation The images above use daily precipitation statistics from NWS COOP, CoCoRaHS, and
The Weather Wire. Contents: Wildfires Burning Across Colorado
 The Weather Wire July 2018 Volume 25 Number 7 Contents: Wildfires Burning Across Colorado Drought Monitor June Summary/Statistics July Preview Rainfall Totals Wildfires Burning Across Colorado Following