Arizona Climate Summary April 2018 Summary of conditions for March 2018
|
|
|
- Delilah Bates
- 6 years ago
- Views:
Transcription


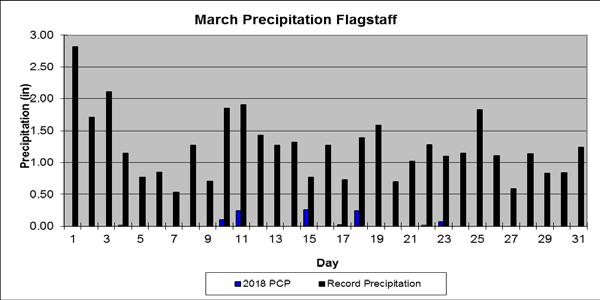
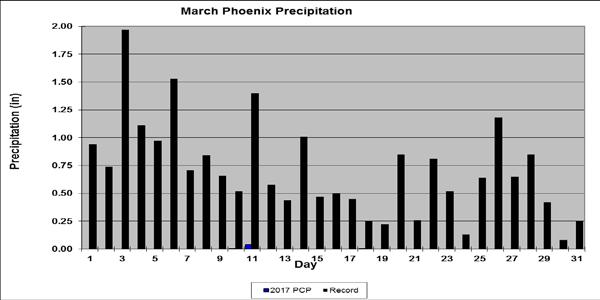
1 Arizona Climate Summary April 2018 Summary of conditions for March 2018 March 2018 Temperature and Precipitation Summary March 1 st 16 th : March began with rainfall in southeastern Arizona as the tail end of a low pressure system exited the state. Douglas reported The rest of the state was dry with cooler than normal temperatures. Highs in the SW deserts were in the low 70s and the mountains were in the mid to upper 30s. The next two days were dry, but cool, as the next low pressure system moved slowly across California and Nevada. On the 4 th, the southern edge of that storm crossed northern Arizona, but only Flagstaff and the north rim of the Grand Canyon received rainfall, both less than High pressure moved in and remained in control through the 9 th, raising temperatures back up into the lower 80s. A shortwave moved into the state on the 10 th and remained through the morning of the 13 th, bringing rain and cooler temperatures. Storm totals included 1.0 of snow at the north rim of the Grand Canyon, 0.31 of rain at Flagstaff, 0.44 at the Grand Canyon Airport, 0.30 at Kingman, 0.43 at Page, 0.04 at Phoenix, 0.24 at Prescott, 0.88 at St. Johns, 0.02 at Scottsdale, 0.39 at Valle, 0.37 at Window Rock, 0.08 at Winslow, 0.55 at Canyon de Chelly, 0.41 at Cottonwood, 0.05 at Apache Junction and East Mesa, 0.60 at Payson, 0.41 at Petrified Forest, 0.15 at Pinnacle Peak, 0.52 at Seligman, 0.12 at Show Low, and 0.82 at Springerville. Southern Arizona remained dry. The state remained dry on the 14 th before the next system moved in on the 15 th. A cold low pressure system crossed northern Arizona on the 15 th and 16 th, dropping snow on Flagstaff and Bellemont (1.0 each). Kingman had 0.09 of rain, while Prescott and St. Johns had 0.02, Page had 0.04, Window Rock and Payson had 0.08, Show Low had 0.10, Williams had 0.04 and the southern half of the state again remained dry. March 17 th 31 st : The 17 th was dry across the state before the next system moved quickly through on the 18 th, dropping rain and snow across the northern half of the state. Snow totals included 3.0 at Flagstaff AP, 0.2 at Bellemont, 4.8 at the north rim of the Grand Canyon, and 2.0 at Phantom Ranch. Rainfall totals were light and widely scattered, and generally less than The 19 th, 20 th and 21 st were dry and temperatures rebounded to above normal levels, reaching the 80s in the southwest deserts. Another weak low pressure system passed across northern and central Arizona from the 22 nd through the 24 th, bringing scattered rain showers including 0.07 at Kingman, 0.16 at Page and 0.05 at Coronado National Monument. The 25 th was dry between storms. The last storm system of the month moved through on the 26 th through the 28 th. Very little moisture was associated with this storm, as with most storms in March, but it did reach into southern Arizona. Grand Canyon AP had 0.03, Safford had 0.20, St. Johns, 0.26, Alpine 0.20, and Petrified Forest had High pressure moved in for the last three days of the month and into April raising temperatures into the upper 80s and lower 90s in the southwest deserts and upper 60s and lower 70s at the higher elevations. In This Issue: Overview of March, graphs of the March daily maximum and minimum temperatures, precipitation, mean daily dew points for Flagstaff, Phoenix, and Tucson; March climate statistics, maps of mean monthly maximum and minimum temperatures, precipitation, dew points, wind speeds for March; short-term drought maps for the beginning and end of March 2018; Long-term Drought Map; and graphs of the mean March temperature and precipitation for the period of record for Tucson, Phoenix, and Flagstaff, graphs of the cumulative precipitation for the calendar year for Flagstaff, Phoenix, and Tucson. Climate calendars for Flagstaff, Phoenix, Tucson, Prescott, Winslow and Yuma, including daily and monthly normals and extremes, for each month of the year, are not yet updated through See p.21 of this report for calendar abbreviations. Data are preliminary and are from the National Weather Service Forecast Offices in Flagstaff, Phoenix and Tucson. **Note: The discrepancy between the Statewide Temperature and Precipitation values for Phoenix, Flagstaff and Tucson and the daily values in their graphs are due to the reporting times. Statewide Temperature and Precipitation values are taken at 5pm, while official daily records at the airports are taken from Midnight to Midnight. Dr. Nancy J. Selover, State Climatologist Edited by Nancy J. Selover 2018 Arizona State Climate Office 1

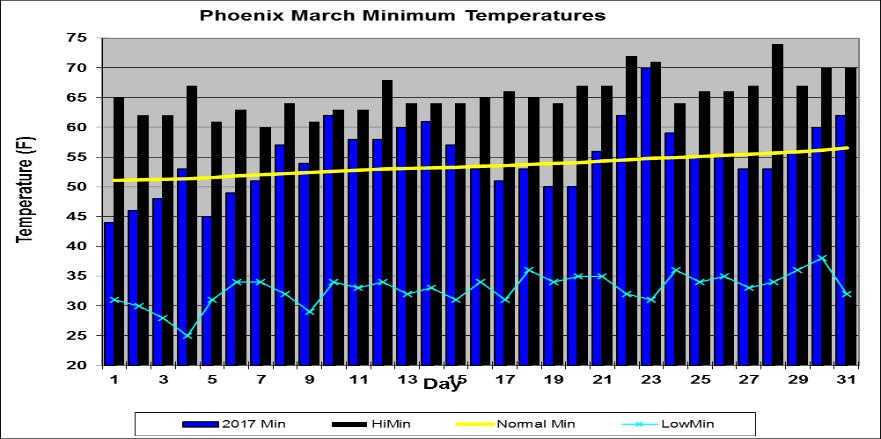
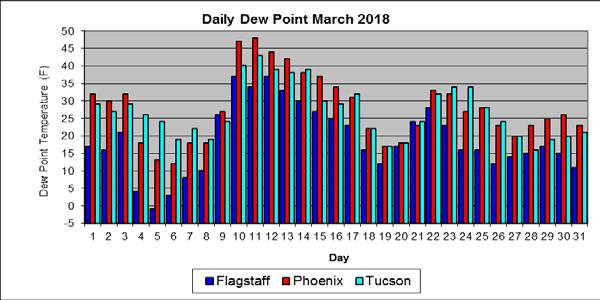
2 March 2018 Daily Temperature, Precipitation, & Dew Point for Flagstaff, Phoenix, and Tucson 2
3 3
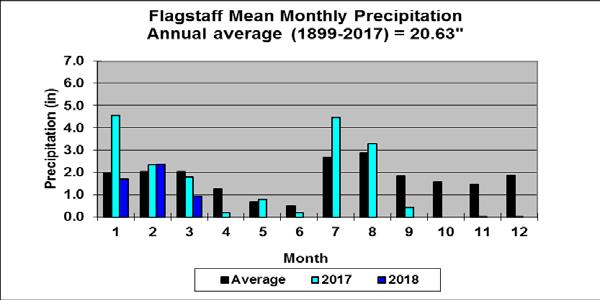
4 FLAGSTAFF CLIMATE STATISTICS March 2018 This March had no significant ranking for temperature or precipitation. Avg Max Temp(F) 51.6 Normal 50.4 Avg Min Temp(F) 24.0 Normal 23.6 Avg Mean Temp(F) 37.8 Normal 37.0 Departure from Normal (F) +0.8 Highest Monthly Avg Temp (F) 44.9 in 1934 Lowest Monthly Avg Temp (F) 26.8 in 1973 Highest Temp this month (F): 69 on 31 st Lowest Temp this month (F): 14 on 7 th Record High (F): 73 on 3/17/2007, 3/26/1988, 3/31/1966 Record Low (F): -16 on 3/04/1966 No temperature or precipitation records this month: Flagstaff Number of Days of: Minimum Temp 25 o F or higher 15 Minimum Temp 20 o F or lower 9 Maximum Temp 60 o F or higher 6 Maximum Temp 50 o F or lower 16 Heating Degree Days 835 Normal 867 Cooling Degree Days 0 Normal 0 Degree base 65 o F Total March Precipitation 0.93 Normal March Precipitation 2.12 Departure from normal Greatest 24-Hr Precipitation 0.25 on 15 th Total Precipitation Year-to-Date 5.01 Departure from Normal Total March Snowfall 37.4 Normal 93.9 Record March Snowfall 84.3 in 1901 Number of Days: Clear 21 Partly Cloudy 9 Cloudy 1 Greatest March Precipitation 6.75 in 1970 Least March Precipitation: Trace in 1972 Average Wind Speed Highest Peak Gust 8.6 mph 50 mph from 220 o on 14 th PHOENIX CLIMATE STATISTICS March 2018 This March was the 17 th warmest and 19 th driest on record. Phoenix has had 6 days of rain since January 1 st and only 8 days of rain since Aug 23 rd. Avg Max Temp(F) 78.8 Normal 76.9 Avg Min Temp(F) 54.9 Normal 53.5 Avg Mean Temp (F) 66.8 Normal 65.2 Departure from Normal (F) +1.6 Highest Monthly Avg Temp (F) 72.3 in 2004 Lowest Monthly Avg Temp (F) 54.3 in 1897 Highest Temp this month (F) Lowest Temp this month (F): Record High (F): 100 on 3/26/1988 Record Low (F): 25 on 3/04/ on 31 st 44 on 1 st No temperature or precipitation records this month: Phoenix Number of Days of: Minimum Temp 50 o F or lower 7 Minimum Temp 60 o F or higher 7 Maximum Temp 70 o F or lower 2 Maximum Temp 80 o F or higher 15 Heating Degree Days 35 Normal 81 Cooling Degree Days 100 Normal 87 Degree base 65 o F Total March Precipitation 0.04 Normal March Precipitation 0.99 Departure from normal Greatest 24-Hr Precipitation 0.04 on 11 th 4
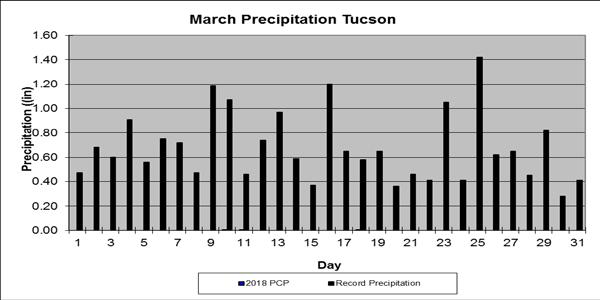
5 Total Precipitation Year-to-Date 0.77 Departure from Normal Greatest March Precipitation 4.82 in 1941 Least March Precipitation 0.00 in 2008, 2016 and 11 other years Number of Days: Clear 8 Partly Cloudy 21 Cloudy 2 Average Wind Speed 6.2 mph Highest Peak Gust 32 mph from 250 o on 15 th TUCSON CLIMATE STATISTICS March 2018 This March was tied for 15 th warmest with 2007 and was the 9 th driest on record. Avg Max Temp(F) 77.0 Normal 74.1 Avg Min Temp(F) 48.9 Normal 46.2 Avg Mean Temp(F) 63.0 Normal 60.1 Departure from Normal (F) +2.9 Highest Monthly Avg Temp (F) 67.9 in 2017 Lowest Monthly Avg Temp (F) 51.5 in 1973 Highest Temp this month (F): Lowest Temp this month (F): Record High (F): 99 on 3/26/1988 Record Low (F): 20 on 3/04/ on 22 nd 34 on 1 st Temperature or precipitation records this month: 14 th HiMin 58 set, previous record 57 in nd HiMax 91 set, previous record 90 in 1990 Tucson Number of Days of: Minimum Temp 45 o F or lower 10 Minimum Temp 55 o F or higher 8 Maximum Temp 70 o F or lower 7 Maximum Temp 80 o F or higher 11 Heating Degree Days 103 Normal 179 Cooling Degree Days 44 Normal 29 Degree base 65 o F Total March Precipitation 0.00 Normal March Precipitation 0.73 Departure from normal Greatest 24-Hr Precipitation Trace on 10 th, 11 th, 18 th Total Precipitation Year-to-Date 1.98 Departure from Normal Greatest March Precipitation 3.88 in 1905 Least March Precipitation 0.00 in 1984, 1956, 1933, and 5 other years. Number of Days: Clear 10 Partly Cloudy 0 Cloudy 0 Average Wind Speed Highest Peak Gust 6.8 mph 37 mph from 220 o on 24 th Data are from the National Weather Service and the National Climatic Data Center and are preliminary. 5
6 Wind Speeds for March: Day Phoenix Flagstaff Tucson (mph) Avg Max Avg Max Avg Max Dew Points for March: Daily Average Dew Point ( o F): Day Phx Tuc Flg
7 The 7

8 March 2018 The minimum temperatures ranged from -1 o F at Lindbergh Hill and Snowslide Canyon to 51 o F at Sedona. The lowest maximum temperature of 52 o F was recorded at Sunrise Mountain and the highest was 96 o F at Tacna and Roll. The highest rainfall totals were 2.70 at Snowslide Canyon and 2.59 at Sunset Crater, and the lowest was 0.00 at many stations. The lowest average dew point was 16 o F at Flagstaff and the highest was 37 o F at Paloma. The highest peak wind gust was 42 mph at San Simon. Average wind speeds ranged from 2 mph at Phoenix Encanto to 12 mph at Laughlin-Bullhead City, Show Low and Flagstaff Airports. 8
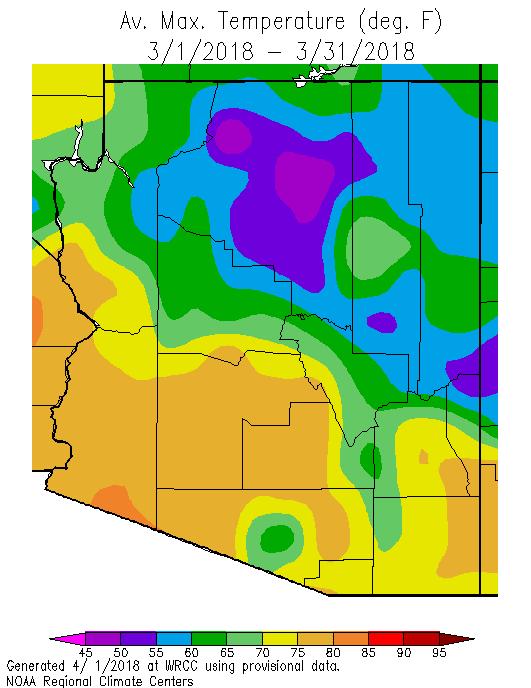
9 T March 2018 The highest average minimum temperature was 56 o F at Yuma, and the lowest average minimum temperature was 18 o F at Sunrise Mountain. The highest average maximum temperature was 90 o F at Clark Field and the lowest average maximum temperature was 43 o F at Snowslide Canyon. 9
 across Coconino, Yavapai, Mohave, La Paz and Yuma counties.")
10 Short term drought maps for February 27 th on left and March 27 th on right. The relatively dry March led to an expansion of Severe Drought (D2) across Coconino, Yavapai, Mohave, La Paz and Yuma counties. Extreme Drought (D3) was introduced into central Arizona and expanded across the northeast counties. Extreme Drought (D3) increased from 9.27% of the state last month to 46.49% by the end of March. 10
 over the past 24-, 36-, and 48-months.")
11 Long-term drought map for March for Arizona shows hydrologic drought, and is based on both precipitation and evaporation using the Standardized Precipitation Index (SPI) and Standardized Precipitation Evaporative Index (SPEI) over the past 24-, 36-, and 48-months. While a few areas are shown as No Drought, these are mostly likely due to a lack of data, as the entire state is experiencing a long-term deficit of precipitation and reduced recharge to aquifers and reservoirs, as well as enhanced evaporation due to the high temperatures. 11
12 12


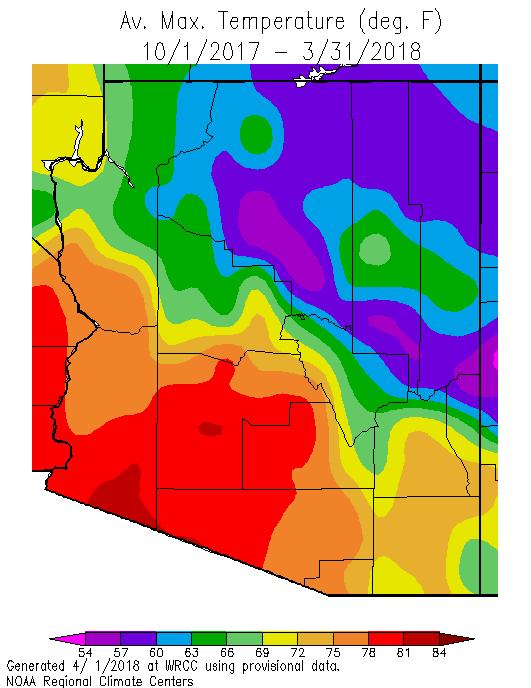
13 March March minimum temperatures were within 2 o F of average across the state with warmer than average temperatures in southeastern and west central Arizona where few winter storms ventured. Northeastern Arizona was cooler than average as the winter storms brushed across the northern third of the state, bringing more cool air than moisture. Daytime temperatures were also within 2 o F of average across most of the state, with western Arizona cooler than normal and eastern Arizona warmer. March was even drier than February with most of the state receiving less than 50% of average March precipitation. Only southern Apache County had above average precipitation. 13
14 14

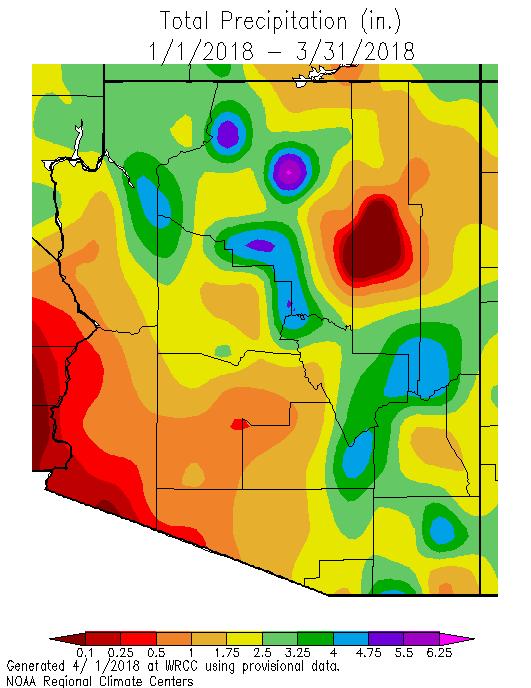
15 Calendar Year 2018 Calendar year minimum temperatures across Arizona were 0 to 3 o F warmer than average except the northeast which was 0 to 3 o F cooler than average. Daytime temperatures have been 3 to 5 o F warmer than average. Since January most of the state has received less than 70% of average precipitation though the southwest quarter has received less than 50% of average. Southeastern Arizona and southern Apache County received over 110% of average precipitation, primarily in February. 15
16 16


17 s aham, Cochise, La Paz, OPima and 2018 Water Year Water Year 2018 minimum temperatures have been 0 to 4 o F warmer than normal across the southern half of the state and within 2 o F of normal in northern Arizona. La Paz County appears to have been much warmer than normal, but the bullseye may be due to bad data or a station move. Daytime temperatures have been 2 to 6 o F warmer than normal statewide, with a few pockets that have been 6 to 8 o F warmer than average. The entire state has received less than 50% of normal precipitation since October 1 st in one of our driest winters on record. 17


18 March Mean Temperature Graphs Flagstaff, Phoenix, and Tucson : 18
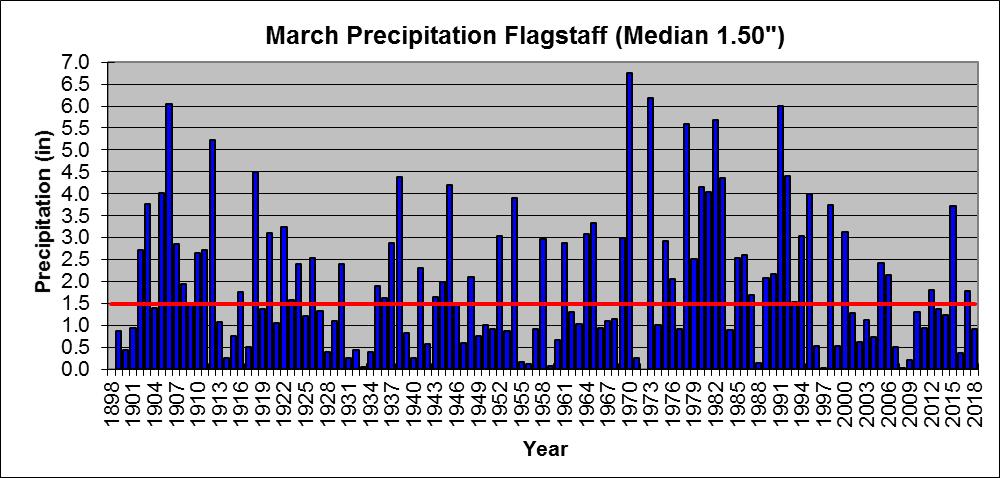
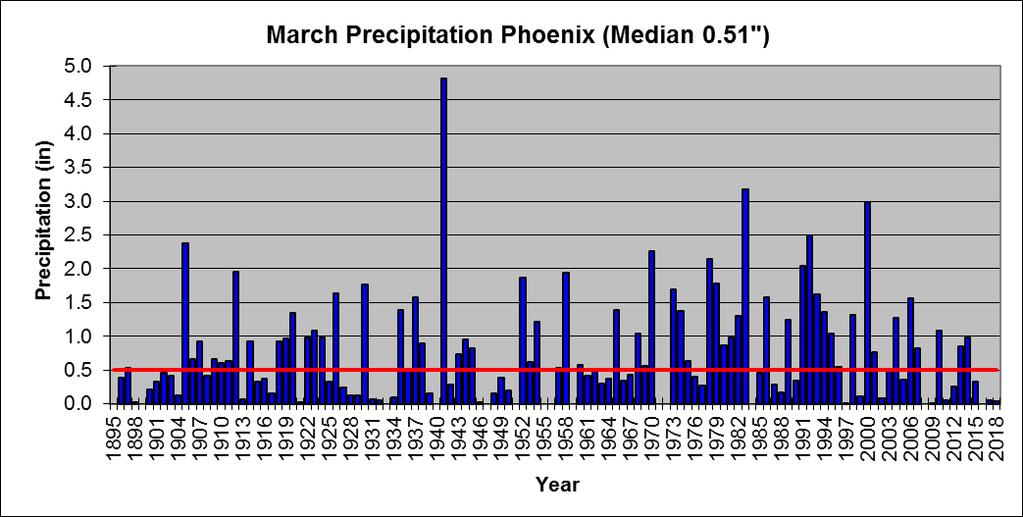
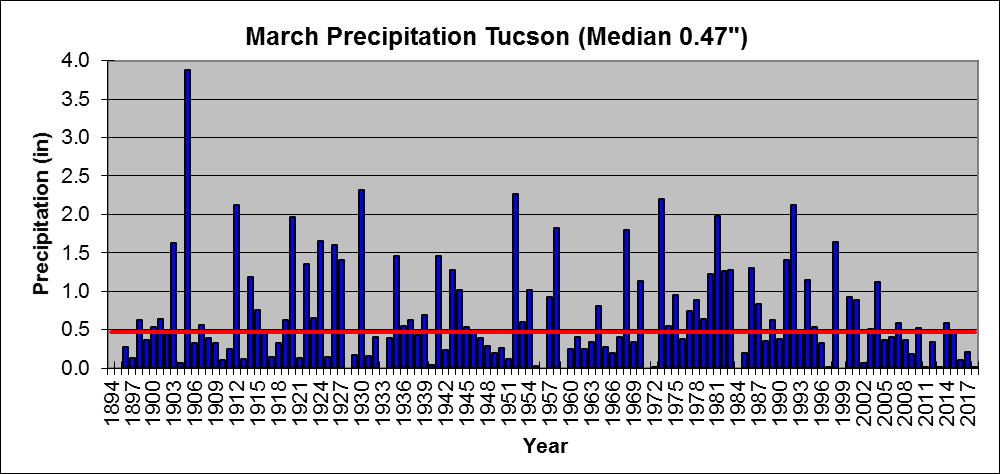
19 March Mean Precipitation Graphs Flagstaff, Phoenix, and Tucson


20 2018 Cumulative Precipitation Graphs Flagstaff, Phoenix and Tucson: Flagstaff is 1.32 below normal, Phoenix is 2.05 below normal, and Tucson is 0.55 below normal. 20
21 The downloadable normals and extremes calendars use the following abbreviations: NORM = 30 year ( ) average value (degrees Fahrenheit (F)) OBS = The temperature observation for that day this year AVG = Average daily temperature HI MAX = Highest maximum temperature for that day (F) LO MAX = Lowest maximum temperature for that day (F) LO MIN = Lowest minimum temperature for that day (F) HI MIN = Highest minimum temperature for that day (F) Mx PCP = Maximum precipitation for that day (inches) Mx SNO = Maximum snowfall for that day (inches) 21
Arizona Climate Summary February 2018 Summary of conditions for January 2018
 Arizona Climate Summary February 2018 Summary of conditions for January 2018 January 2018 Temperature and Precipitation Summary January 1 st 19 th : The new year began with a ridge of high pressure over
Arizona Climate Summary November 2018 Summary of conditions for October 2018
 Arizona Climate Summary November 2018 Summary of conditions for October 2018 October 2018 Temperature and Precipitation Summary October 1 st 15 th : The 2018 water year ending September 30 th was exceptionally
Arizona Climate Summary October 2018 Summary of conditions for September 2018
 Arizona Climate Summary October 2018 Summary of conditions for September 2018 September 2018 Temperature and Precipitation Summary September 1 st 17 th : The wet pattern from August continued into September
Arizona Climate Summary May 2018 Summary of conditions for April 2018
 April 2018 Temperature and Precipitation Summary Arizona Climate Summary May 2018 Summary of conditions for April 2018 April 1 st 16 th : April was a very dry month across Arizona. Several low pressure
Arizona Climate Summary September 2018 Summary of conditions for August 2018
 August 2018 Temperature and Precipitation Summary Arizona Climate Summary September 2018 Summary of conditions for August 2018 August 1 st 15 th : August began with high pressure centered over the state
Arizona Climate Summary November 2015 Summary of conditions for October 2015
 October 2015 Temperature and Precipitation Summary Arizona Climate Summary November 2015 Summary of conditions for October 2015 October 1 st 14 th : October began with high pressure over the southwest,
Arizona Climate Summary December 2016 Summary of conditions for November 2016
 Arizona Climate Summary December 2016 Summary of conditions for November 2016 November 2016 Temperature and Precipitation Summary November 1 st 16 th : November began with a dry low pressure system moving
Arizona Climate Summary June 2017 Summary of conditions for May 2017
 Arizona Climate Summary June 2017 Summary of conditions for May 2017 May 2017 Temperature and Precipitation Summary May 1 st 16 th : A strong ridge of high pressure developed over the southwest during
Arizona Climate Summary December 2017 Summary of conditions for November 2017
 November 2017 Temperature and Precipitation Summary Arizona Climate Summary December 2017 Summary of conditions for November 2017 November 1 st 17 th : October ended with a little bit of precipitation
Arizona Climate Summary September 2017 Summary of conditions for August 2017
 August 2017 Temperature and Precipitation Summary Arizona Climate Summary September 2017 Summary of conditions for August 2017 August 1 st 15 th : The monsoon activity that ended July continued into the
Arizona Climate Summary November 2016 Summary of conditions for October 2016
 Arizona Climate Summary November 2016 Summary of conditions for October 2016 October 2016 Temperature and Precipitation Summary October 1 st 16 th : October began with high pressure over Mexico, bringing
Arizona Climate Summary November 2017 Summary of conditions for October 2017
 Arizona Climate Summary November 2017 Summary of conditions for October 2017 October 2017 Temperature and Precipitation Summary October 1 st 18 th : A low pressure system from the northwestern U.S. moved
Arizona Climate Summary
 Arizona Climate Summary August 2016 Summary of conditions for July 2016 July 2016 Temperature and Precipitation Summary July 1 st 15 th : As June ended and July began, a shortwave moved through the southwest
Arizona Climate Summary
 April 2016 Temperature and Precipitation Summary Arizona Climate Summary May 2016 Summary of conditions for April 2016 April 1 st 15 th : April 1 st saw the tail end of a low pressure system move out of
Arizona Climate Summary January 2017 Summary of conditions for December 2016
 Arizona Climate Summary January 2017 Summary of conditions for December 2016 December 2016 Temperature and Precipitation Summary December 1 st 15 th : Similar to November, December began with a dry trough
Arizona Climate Summary October 2016 Summary of conditions for September 2016
 September 2016 Temperature and Precipitation Summary Arizona Climate Summary October 2016 Summary of conditions for September 2016 September 1 st 14 th : High pressure over the Four Corners brought rainfall
Arizona Climate Summary
 August 2015 Temperature and Precipitation Summary Arizona Climate Summary September 2015 Summary of conditions for August 2015 August 1 st 16 th : August was a wet month across the state with only 3 days
Arizona Climate Summary
 May 2015 Temperature and Precipitation Summary Arizona Climate Summary June 2015 Summary of conditions for May 2015 May 1 st 14 th : May began with high pressure in the west, and May 1 st was dry statewide,
Arizona Climate Summary May 2015 Summary of conditions for April 2015
 Arizona Climate Summary May 2015 Summary of conditions for April 2015 April 2015 Temperature and Precipitation Summary April 1 st 16 th : April began with very light showers in Nogales and Coronado National
Arizona Climate Summary July 2015 Summary of conditions for June 2015
 June 2015 Temperature and Precipitation Summary Arizona Climate Summary July 2015 Summary of conditions for June 2015 June 1 st 14 th : Similar to May, June began with high pressure in the west, and conditions
Arizona Climate Summary February 2016 Summary of conditions for January 2016
 January 2016 Temperature and Precipitation Summary Arizona Climate Summary February 2016 Summary of conditions for January 2016 January 1 st 14 th : The new year began with high pressure over the southwest
Arizona Climate Summary October 2015 Summary of conditions for September 2015
 September 2015 Temperature and Precipitation Summary Arizona Climate Summary October 2015 Summary of conditions for September 2015 September 1 st 18 th : September began with high pressure over southern
Arizona Climate Summary June 2013
 Arizona Climate Summary June 2013 Summary of conditions for May 2013 May 2013 Temperature and Precipitation Summary May 1 st 16 th : May began with above normal daily temperatures and breezy conditions
Arizona Climate Summary February 2012
 Arizona Climate Summary February 2012 Summary of conditions for January 2012 January 2012 Temperature and Precipitation Summary January 1 st 20 th : The New Year has started on a very dry note. The La
Arizona Climate Summary
 Arizona Climate Summary March 2014 Summary of conditions for February 2014 February 2014 Temperature and Precipitation Summary February 1 st 16 th : We started off the month of February with some moisture
Arizona Climate Summary May 2012
 Arizona Climate Summary May 2012 Summary of conditions for April 2012 April 2012 Temperature and Precipitation Summary April 1 st 16 th : Although April began with another low pressure system sweeping
Arizona Climate Summary March 2013
 Arizona Climate Summary March 2013 Summary of conditions for February 2013 February 2013 Temperature and Precipitation Summary February 1 st 16 th : February began with a ridge of high pressure over the
Arizona Climate Summary August 2013
 Arizona Climate Summary August 2013 Summary of conditions for July 2013 July 2013 Temperature and Precipitation Summary July 1 st 16 th : To start off the month of July, a high pressure system came in
Arizona Climate Summary
 Arizona Climate Summary April 2014 Summary of conditions for March 2014 March 2014 Temperature and Precipitation Summary March 1 st 16 th : We started off the month of March with a significant precipitation
Arizona Climate Summary April 2013
 Arizona Climate Summary April 2013 Summary of conditions for March 2013 March 2013 Temperature and Precipitation Summary March 1 st 16 th : March began as a ridge of high pressure progressed across the
Arizona Climate Summary October 2013
 Arizona Climate Summary October 2013 Summary of conditions for September 2013 September 2013 Temperature and Precipitation Summary September 1 st 16 th : With moist conditions still present throughout
Arizona Climate Summary November 2013
 Arizona Climate Summary November 2013 Summary of conditions for October 2013 October 2013 Temperature and Precipitation Summary October 1 st 16 th : The month of October started off with fair weather conditions
Arizona Climate Summary
 Arizona Climate Summary June 2012 Summary of conditions for May 2012 May 2012 Temperature and Precipitation Summary May 1 st 16 th : May began with a surface cold front sweeping across the western states
Arizona Climate Summary May 2013
 Arizona Climate Summary May 2013 Summary of conditions for April 2013 April 2013 Temperature and Precipitation Summary April 1 st 16 th : The first week of April featured a ridge of high pressure over
Arizona Climate Summary September 2014 Summary of conditions for August 2014
 Arizona Climate Summary September 2014 Summary of conditions for August 2014 August 2014 Temperature and Precipitation Summary August 1 st 16 th : The first 5 days of August were quite wet with high pressure
Arizona Climate Summary October 2012
 Arizona Climate Summary October 2012 Summary of conditions for September 2012 September 2012 Temperature and Precipitation Summary September 1 st 14 th : September began with an upper level low pressure
Monthly Long Range Weather Commentary Issued: February 15, 2015 Steven A. Root, CCM, President/CEO
 Monthly Long Range Weather Commentary Issued: February 15, 2015 Steven A. Root, CCM, President/CEO sroot@weatherbank.com JANUARY 2015 Climate Highlights The Month in Review During January, the average
Colorado State University, Fort Collins, CO Weather Station Monthly Summary Report
 Colorado State University, Fort Collins, CO Weather Station Monthly Summary Report Month: January Year: 2019 Temperature: Mean T max was 47.2 F which is 3.0 above the 1981-2010 normal for the month. This
Colorado State University, Fort Collins, CO Weather Station Monthly Summary Report
 Colorado State University, Fort Collins, CO Weather Station Monthly Summary Report Month: December Year: 2017 Temperature: Mean T max was 47.2 F which is 4.4 above the 1981-2010 normal for the month. This
2012 Growing Season Weather Summary for North Dakota. Adnan Akyüz and Barbara A. Mullins Department of Soil Science October 30, 2012
 2012 Growing Season Weather Summary for North Dakota Adnan Akyüz and Barbara A. Mullins Department of Soil Science October 30, 2012 Introduction The 2012 growing season (the period from April through September)
KANSAS CLIMATE SUMMARY January 2018
 KANSAS CLIMATE SUMMARY January 2018 Some welcome moisture After an extended period with little to no moisture, parts of Kansas recorded some significant precipitation. At Tribune, a small snow event on
Colorado State University, Fort Collins, CO Weather Station Monthly Summary Report
 Colorado State University, Fort Collins, CO Weather Station Monthly Summary Report Month: December Year: 2016 Temperature: Mean T max was 39.7 F which is 3.1 below the 1981-2010 normal for the month. This
KANSAS CLIMATE SUMMARY February 2017
 KANSAS CLIMATE SUMMARY February 2017 Warm and dry February was much warmer and drier than normal. The state-wide average temperature was 41.9 o F, which is 7.9 degrees warmer than normal. This places it
KANSAS CLIMATE SUMMARY August 2015
 KANSAS CLIMATE SUMMARY August 2015 Cool and Dry August was drier than normal in most of the state. State-wide average precipitation was 2.80 inches or 85 percent of normal. The Northeast division of the
Monthly Long Range Weather Commentary Issued: May 15, 2014 Steven A. Root, CCM, President/CEO
 Monthly Long Range Weather Commentary Issued: May 15, 2014 Steven A. Root, CCM, President/CEO sroot@weatherbank.com APRIL 2014 REVIEW Climate Highlights The Month in Review The average temperature for
The Pennsylvania Observer
 The Pennsylvania Observer April 2, 2009 March 2009 Pennsylvania Weather Recap Prepared by Curt Harpster For the month of March the saying, In like a lion and out like a lamb really fit the pattern quite
PRECIPITATION. Last Week Precipitation:
 2/24/2015 NIDIS Drought and Water Assessment PRECIPITATION The images above use daily precipitation statistics from NWS COOP, CoCoRaHS, and CoAgMet stations. From top to bottom, and left to right: most
Monthly Long Range Weather Commentary Issued: APRIL 1, 2015 Steven A. Root, CCM, President/CEO
 Monthly Long Range Weather Commentary Issued: APRIL 1, 2015 Steven A. Root, CCM, President/CEO sroot@weatherbank.com FEBRUARY 2015 Climate Highlights The Month in Review The February contiguous U.S. temperature
January 2006 Climate Summary
 Ashley Brooks (765) 494-6574 Feb 9, 2006 http://www.iclimate.org January 1-3 January 2006 Climate Summary Unseasonably warm conditions welcomed in the New Year with highs in the 40s across the northern
Champaign-Urbana 2000 Annual Weather Summary
 Champaign-Urbana 2000 Annual Weather Summary ILLINOIS STATE WATER SURVEY 2204 Griffith Dr. Champaign, IL 61820 wxobsrvr@sws.uiuc.edu Maria Peters, Weather Observer January: January started on a mild note,
Champaign-Urbana 1999 Annual Weather Summary
 Champaign-Urbana 1999 Annual Weather Summary ILLINOIS STATE WATER SURVEY 2204 Griffith Dr. Champaign, IL 61820 wxobsrvr@sws.uiuc.edu Maria Peters, Weather Observer A major snowstorm kicked off the new
Weather and Climate Summary and Forecast February 2018 Report
 Weather and Climate Summary and Forecast February 2018 Report Gregory V. Jones Linfield College February 5, 2018 Summary: For the majority of the month of January the persistent ridge of high pressure
The hydrologic service area (HSA) for this office covers Central Kentucky and South Central Indiana.
 for this office covers Central Kentucky and South Central Indiana.") January 2012 February 13, 2012 An X inside this box indicates that no flooding occurred within this hydrologic service area. January 2012 continued the string of wet months this winter. Rainfall was generally
January 2012 February 13, 2012 An X inside this box indicates that no flooding occurred within this hydrologic service area. January 2012 continued the string of wet months this winter. Rainfall was generally
KANSAS CLIMATE SUMMARY March 2018
 KANSAS CLIMATE SUMMARY March 2018 Another Dry Month The Southwest Division again missed out on most of the precipitation during March. State-wide the average precipitation was 0.97 inches or 41 percent
NIDIS Intermountain West Drought Early Warning System October 17, 2017
 NIDIS Drought and Water Assessment NIDIS Intermountain West Drought Early Warning System October 17, 2017 Precipitation The images above use daily precipitation statistics from NWS COOP, CoCoRaHS, and
The Weather Wire. Current Colorado Snowpack. Contents:
 The Weather Wire January 2019 Volume 26 Number 1 Contents: Current Colorado Snowpack Denver Snowfall Since 1999-2000 Denver 2018 Climate Review Drought Monitor December Summary/Statistics January Preview
Monthly Long Range Weather Commentary Issued: APRIL 18, 2017 Steven A. Root, CCM, Chief Analytics Officer, Sr. VP,
 Monthly Long Range Weather Commentary Issued: APRIL 18, 2017 Steven A. Root, CCM, Chief Analytics Officer, Sr. VP, sroot@weatherbank.com MARCH 2017 Climate Highlights The Month in Review The average contiguous
Champaign-Urbana 1998 Annual Weather Summary
 Champaign-Urbana 1998 Annual Weather Summary ILLINOIS STATE WATER SURVEY Audrey Bryan, Weather Observer 2204 Griffith Dr. Champaign, IL 61820 wxobsrvr@sparc.sws.uiuc.edu The development of the El Nìno
January 25, Summary
 January 25, 2013 Summary Precipitation since the December 17, 2012, Drought Update has been slightly below average in parts of central and northern Illinois and above average in southern Illinois. Soil
NIDIS Drought and Water Assessment
 NIDIS Drought and Water Assessment PRECIPITATION The images above use daily precipitation statistics from NWS COOP, CoCoRaHS, and CoAgMet stations. From top to bottom, and left to right: most recent 7-days
2011 Year in Review TORNADOES
 2011 Year in Review The year 2011 had weather events that will be remembered for a long time. Two significant tornado outbreaks in April, widespread damage and power outages from Hurricane Irene in August
Weather and Climate Summary and Forecast November 2017 Report
 Weather and Climate Summary and Forecast November 2017 Report Gregory V. Jones Linfield College November 7, 2017 Summary: October was relatively cool and wet north, while warm and very dry south. Dry conditions
Weather and Climate Summary and Forecast October 2018 Report
 Weather and Climate Summary and Forecast October 2018 Report Gregory V. Jones Linfield College October 4, 2018 Summary: Much of Washington, Oregon, coastal California and the Bay Area and delta region
KANSAS CLIMATE SUMMARY February 2015
 KANSAS CLIMATE SUMMARY February 2015 Extended Cold Despite some record warm readings at a few locations, February was characterized by colder than normal conditions. This was particularly true during the
NIDIS Intermountain West Drought Early Warning System December 11, 2018
 NIDIS Drought and Water Assessment NIDIS Intermountain West Drought Early Warning System December 11, 2018 Precipitation The images above use daily precipitation statistics from NWS COOP, CoCoRaHS, and
The following information is provided for your use in describing climate and water supply conditions in the West as of April 1, 2003.
 Natural Resources Conservation Service National Water and Climate Center 101 SW Main Street, Suite 1600 Portland, OR 97204-3224 Date: April 8, 2003 Subject: April 1, 2003 Western Snowpack Conditions and
Champaign-Urbana 2001 Annual Weather Summary
 Champaign-Urbana 2001 Annual Weather Summary ILLINOIS STATE WATER SURVEY 2204 Griffith Dr. Champaign, IL 61820 wxobsrvr@sws.uiuc.edu Maria Peters, Weather Observer January: After a cold and snowy December,
Monthly Long Range Weather Commentary Issued: APRIL 25, 2016 Steven A. Root, CCM, Chief Analytics Officer, Sr. VP, sales
 Monthly Long Range Weather Commentary Issued: APRIL 25, 2016 Steven A. Root, CCM, Chief Analytics Officer, Sr. VP, sales sroot@weatherbank.com MARCH 2016 Climate Highlights The Month in Review The March
SOUTHERN CLIMATE MONITOR
 SOUTHERN CLIMATE MONITOR MARCH 2011 VOLUME 1, ISSUE 3 IN THIS ISSUE: Page 2 to 4 Severe Thunderstorm Climatology in the SCIPP Region Page 4 Drought Update Page 5 Southern U.S. Precipitation Summary for
The Pennsylvania Observer
 The Pennsylvania Observer December 2, 2015 November 2015 - Pennsylvania Weather Recap By: Anthny Chiavaroli This November was dry with above average temperatures across the state. Western PA saw some very
NIDIS Intermountain West Regional Drought Early Warning System February 7, 2017
 NIDIS Drought and Water Assessment NIDIS Intermountain West Regional Drought Early Warning System February 7, 2017 Precipitation The images above use daily precipitation statistics from NWS COOP, CoCoRaHS,
May 2016 Volume 23 Number 5
 The Weather Wire May 2016 Volume 23 Number 5 Contents: Winter Summary Current Colorado and West-wide Snow Pack Drought Monitor April Summary/Statistics May Preview Snowfall Totals Winter Summary The Front
KANSAS CLIMATE SUMMARY October 2016
 KANSAS CLIMATE SUMMARY October 2016 Record warmth Temperatures continued the warmer than normal pattern through much of October. The state-wide average temperature was 60.9 of, or 5.6 degrees warmer than
NIDIS Intermountain West Drought Early Warning System April 18, 2017
 1 of 11 4/18/2017 3:42 PM Precipitation NIDIS Intermountain West Drought Early Warning System April 18, 2017 The images above use daily precipitation statistics from NWS COOP, CoCoRaHS, and CoAgMet stations.
Weather and Climate Summary and Forecast Fall/Winter 2016
 Weather and Climate Summary and Forecast Fall/Winter 2016 Gregory V. Jones Southern Oregon University November 5, 2016 After a year where we were seemingly off by a month in terms of temperatures (March
Weather and Climate Summary and Forecast August 2018 Report
 Weather and Climate Summary and Forecast August 2018 Report Gregory V. Jones Linfield College August 5, 2018 Summary: July 2018 will likely go down as one of the top five warmest July s on record for many
Weather and Climate Summary and Forecast Winter
 Weather and Climate Summary and Forecast Winter 2016-17 Gregory V. Jones Southern Oregon University February 7, 2017 What a difference from last year at this time. Temperatures in January and February
Weather and Climate of the Rogue Valley By Gregory V. Jones, Ph.D., Southern Oregon University
 Weather and Climate of the Rogue Valley By Gregory V. Jones, Ph.D., Southern Oregon University The Rogue Valley region is one of many intermountain valley areas along the west coast of the United States.
PRECIPITATION. Last Week Precipitation:
 12/3/2014 NIDIS Drought and Water Assessment PRECIPITATION The images above use daily precipitation statistics from NWS COOP, CoCoRaHS, and CoAgMet stations. From top to bottom, and left to right: most
Climate. Annual Temperature (Last 30 Years) January Temperature. July Temperature. Average Precipitation (Last 30 Years)
 January Temperature. July Temperature. Average Precipitation (Last 30 Years)") Climate Annual Temperature (Last 30 Years) Average Annual High Temp. (F)70, (C)21 Average Annual Low Temp. (F)43, (C)6 January Temperature Average January High Temp. (F)48, (C)9 Average January Low Temp.
Climate Annual Temperature (Last 30 Years) Average Annual High Temp. (F)70, (C)21 Average Annual Low Temp. (F)43, (C)6 January Temperature Average January High Temp. (F)48, (C)9 Average January Low Temp.
The Pennsylvania Observer
 The Pennsylvania Observer January 5, 2009 December 2008 Pennsylvania Weather Recap The final month of 2008 was much wetter than average and a bit colder than normal. In spite of this combination, most
Weather and Climate Summary and Forecast April 2018 Report
 Weather and Climate Summary and Forecast April 2018 Report Gregory V. Jones Linfield College April 4, 2018 Summary: A near Miracle March played out bringing cooler and wetter conditions to the majority
NATIONAL WEATHER SERVICE
 January 2016 February 9, 2016 This was a dry month across the HSA despite one large and several smaller snowfalls. Most locations ended up 1-2 inches below normal for the month. The driest locations at
Illinois Drought Update, December 1, 2005 DROUGHT RESPONSE TASK FORCE Illinois State Water Survey, Department of Natural Resources
 Illinois Drought Update, December 1, 2005 DROUGHT RESPONSE TASK FORCE Illinois State Water Survey, Department of Natural Resources For more drought information please go to http://www.sws.uiuc.edu/. SUMMARY.
NIDIS Intermountain West Drought Early Warning System February 6, 2018
 NIDIS Intermountain West Drought Early Warning System February 6, 2018 Precipitation The images above use daily precipitation statistics from NWS COOP, CoCoRaHS, and CoAgMet stations. From top to bottom,
NIDIS Drought and Water Assessment
 7/23/13 1:57 PM PRECIPITATION The images above use daily precipitation statistics from NWS COOP, CoCoRaHS, and CoAgMet stations. From top to bottom, and left to right: most recent 7-days of accumulated
NIDIS Intermountain West Drought Early Warning System February 12, 2019
 NIDIS Intermountain West Drought Early Warning System February 12, 2019 Precipitation The images above use daily precipitation statistics from NWS COOP, CoCoRaHS, and CoAgMet stations. From top to bottom,
The Pennsylvania Observer
 The Pennsylvania Observer October 1, 2015 September 2015 - Pennsylvania Weather Recap By: Quinn Lease The month of September will be remembered for its above normal temperatures and dry conditions that
The Weather Wire. Contents: Summer 2018 Outlook. Summer 2018 Outlook Drought Monitor May Summary/Statistics June Preview Rainfall Totals
 The Weather Wire June 2018 Volume 25 Number 6 Contents: Summer 2018 Outlook Drought Monitor May Summary/Statistics June Preview Rainfall Totals Summer 2018 Outlook June 1 st marked the first day of meteorological
The Climate of Murray County
 The Climate of Murray County Murray County is part of the Crosstimbers. This region is a transition between prairies and the mountains of southeastern Oklahoma. Average annual precipitation ranges from
Nebraska experienced a wide
 Issue 1 August 2016 CLIMATE UPDATE A MONTHLY SUMMARY FROM THE neclimate.unl.edu August saw reprieve from dryness, cooler temps Overview Nebraska experienced a wide range of conditions across the state
The Pennsylvania Observer
 The Pennsylvania Observer March 4, 2009 February 2009 Pennsylvania Weather Recap Prepared by Chris Slocum In Punxsutawney, Pa, the world's most famous groundhog, Punxsutawney Phil, spotted his shadow on
Colorado State University, Fort Collins, CO Weather Station Monthly Summary Report
 Colorado State University, Fort Collins, CO Weather Station Monthly Summary Report Month: February Year: 2017 Webcam catching a hawk watching over the station. Temperature: Mean T max was 54.4 F which
Current Water Conditions in Massachusetts January 11, 2008
 Current Water Conditions in Massachusetts January 11, 2008 December precipitation was above normal December streamflows were below normal and normal December ground-water levels were below normal and normal
Issued by: National Weather Service San Joaquin Valley - Hanford CA. Issue time: 409 AM PST Wed Jan
 Forecast Information Location: New_Exchequer_Dam Updated: January 16, 2019, 11:45 am NWS Weather Discussion: Issued by: National Weather Service San Joaquin Valley - Hanford CA Issue time: 409 AM PST Wed
Monthly Long Range Weather Commentary Issued: July 18, 2014 Steven A. Root, CCM, President/CEO
 Monthly Long Range Weather Commentary Issued: July 18, 2014 Steven A. Root, CCM, President/CEO sroot@weatherbank.com JUNE 2014 REVIEW Climate Highlights The Month in Review The average temperature for
Monthly Long Range Weather Commentary Issued: SEPTEMBER 19, 2016 Steven A. Root, CCM, Chief Analytics Officer, Sr. VP,
 Monthly Long Range Weather Commentary Issued: SEPTEMBER 19, 2016 Steven A. Root, CCM, Chief Analytics Officer, Sr. VP, sroot@weatherbank.com SEPTEMBER 2016 Climate Highlights The Month in Review The contiguous
October Precipitation Statistics (124 Years) Rank: Figure 2: Historical October precipitation time series for Maryland.
 Rank: Figure 2: Historical October precipitation time series for Maryland.") PRECIPITATION Based on the National Centers for Environmental Information (NCEI), Office of the Maryland State the statewide total October precipitation was 3.88 inches, which was 1.01 inches less than
PRECIPITATION Based on the National Centers for Environmental Information (NCEI), Office of the Maryland State the statewide total October precipitation was 3.88 inches, which was 1.01 inches less than
NIDIS Intermountain West Drought Early Warning System May 1, 2018
 NIDIS Intermountain West Drought Early Warning System May 1, 2018 Precipitation The images above use daily precipitation statistics from NWS COOP, CoCoRaHS, and CoAgMet stations. From top to bottom, and
National Wildland Significant Fire Potential Outlook
 National Wildland Significant Fire Potential Outlook National Interagency Fire Center Predictive Services Issued: September, 2007 Wildland Fire Outlook September through December 2007 Significant fire