Predicting daily total phosphorus and suspended solids across Wisconsin stream reaches for impairment assessment
|
|
|
- Norah Stafford
- 5 years ago
- Views:
Transcription

1 Predicting daily total phosphorus and suspended solids across Wisconsin stream reaches for impairment assessment Alex Latzka & Matt Diebel AWRA WI 10 March 2017
2 Motivation Predict total phosphorus and total suspended solids for Wisconsin streams High-resolution & large spatial scope

3 Motivation Predict total phosphorus and total suspended solids for Wisconsin streams High-resolution & large spatial scope Challenge: 235 USGS gages in WI, but 162,000 stream reaches including many headwaters What to do for ungauged streams without discharge?
4
5
6 Look back in time to see what precipitation was : - leading up to day of prediction - for each watershed


7 Look back in time to see what precipitation was : - leading up to day of prediction - for each watershed Use antecedent precipitation instead of discharge
8 Antecedent precipitation in lieu of discharge

9 Antecedent precipitation in lieu of discharge
10 Antecedent precipitation in lieu of Calculated effective precipitation Precipitation + snowmelt snow Sum effective precip on day of interest and 365 preceeding days, where each day is weighted by a decay function discharge
11 Antecedent precipitation in lieu of Calculated effective precipitation Precipitation + snowmelt snow Sum effective precip on day of interest and 365 preceding days, where each day is weighted by a decay function Lag/Decay function: Calculate a lag parameter based on WSA & SLOPE for each reach For TSS: M = *log(WSA) For TP: M = *log(WSA) *(SLOPE) discharge
 Fixed spatial predictors: Reach and watershed characteristics (land use, soils, etc.")
12 TP/TSS Model Spatio-temporal predictors: Weather (daily temp. and preceding precipitation) Fixed spatial predictors: Reach and watershed characteristics (land use, soils, etc.) Measured TP (23,028 obs. at 1,473 sites) & TSS (11,859 obs. at 513 sites) for model fitting
 *permeability ABC cos(2πdoy) *percent agriculture ABC 7-day temp anomaly ABC,1 *percent urban ABC antecedent precipitation index ABC,1 sin(2πdoy) antecedent precipitation index 2 ABC,1")
13 Model structure Predict TP and TSS for stream reach C on day 1 log(tp c,1 ) or log TSS c,1 = βx c,1 + γ c Z c,1 + ε X (fixed effects) Z (random effects) *slope ABC intercept *log(watershed area ABC ) sin(2πdoy) *permeability ABC cos(2πdoy) *percent agriculture ABC 7-day temp anomaly ABC,1 *percent urban ABC antecedent precipitation index ABC,1 sin(2πdoy) antecedent precipitation index 2 ABC,1 cos(2πdoy) 7-day temp anomaly ABC,1 antecedent precipitation index ABC,1 *allowed to interact with antecedent precipitation
14 Model summary Relative effects of each predictor TSS Model TP Model holding other variables constant at their average values

15
16 Model summary Interactions with Precipitation TP Model holding other variables constant at their average values
17 How do sites TP concentrations vary between 10 th percentile and 90 th percentile of precip?
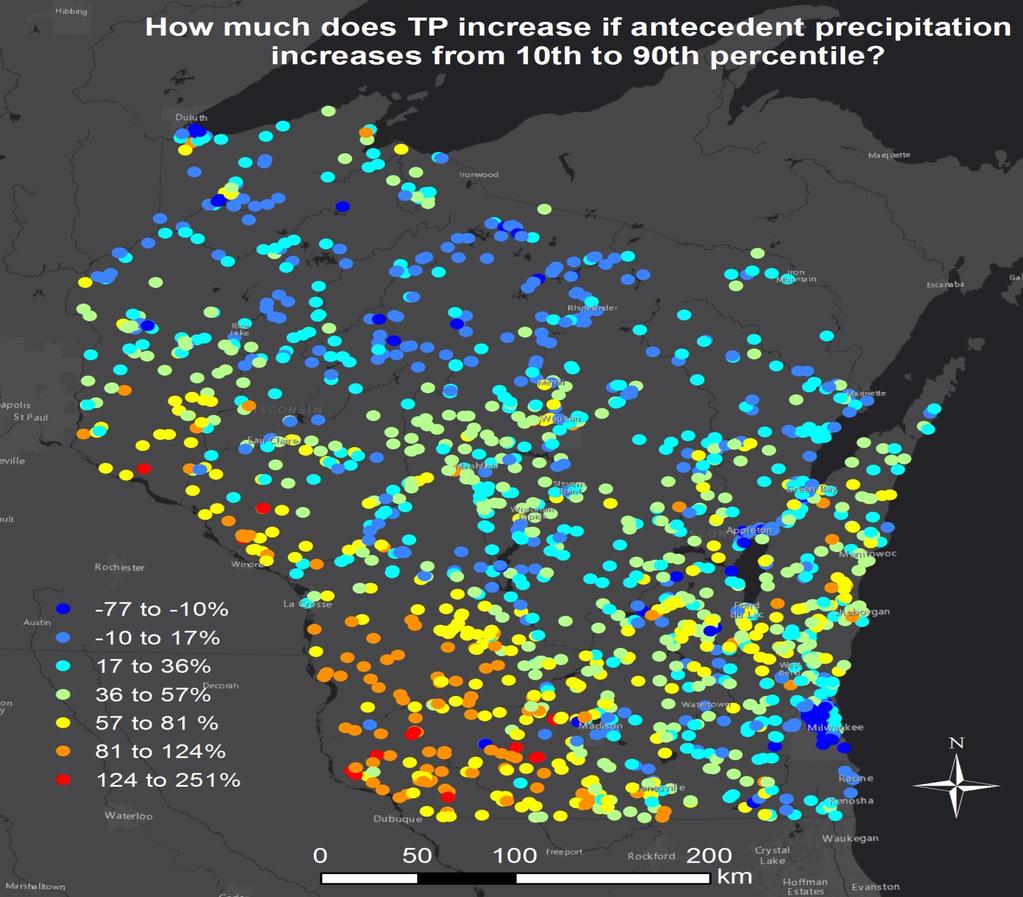
18
19 What causes differences in response to precipitation?
20 What causes differences in response to precipitation?


21 Effect of random effects Kickapoo River Milwaukee River Bower Creek

22
23 Model summary TSS Model TP Model
24 Overall, TP model performs similarly to LOADEST
25 Applications Incorporate hourly precipitation data Incorporate spatial autocorrelation terms Provide predictions, reports, and apps to local biologists and stakeholders Use AUCs from predicted TSS distributions to test effects on macroinvertebrates and fish Assess impairment due to TSS
26 Acknowledgments Funding: EPA Water Resources Institute Support Wisconsin DNR UW Aquatic Sciences Center DNR Water Evaluation Section, Streams Tech. Team, and Modeling Tech. Team

27 Questions?
28 TSS Model

29 Site-specific responses of TP to precip.
30 Site-level comparisons to LOADEST: Our model is similar, and sometimes better


31 Site reports: Auto-filled & generated for each site
32 Site-level model outputs TSS Model (Sugar River) TP Model (Kickapoo River)

33 Inferring power to detect change What is the minimum detectable TP/TSS reduction?
34 Has TP or TSS changed? Look at time series of model residuals (after controlling for weather, seasonality, etc.) Without any change, these should be randomly distributed along the 0 line If there is a change, there will be a shift at some time Test for a shift with segmented regression
35 Has TP or TSS changed? Look at time series of model residuals (after controlling for weather, seasonality, etc.) Without any change, these should be randomly distributed along the 0 line If there is a change, there will be a shift at some time Test for a shift with segmented regression
36 Has TP or TSS changed? Look at time series of model residuals (after controlling for weather, seasonality, etc.) Without any change, these should be randomly distributed along the 0 line If there is a change, there will be a shift at some time Test for a shift with segmented regression
37 Has TP or TSS changed? Look at time series of model residuals (after controlling for weather, seasonality, etc.) Without any change, these should be randomly distributed along the 0 line If there is a change, there will be a shift at some time Test for a shift with segmented regression
Exploring the role of channel processes and legacy sediment in nutrient and sediment delivery, Upper Pecatonica River, Wisconsin
 Exploring the role of channel processes and legacy sediment in nutrient and sediment delivery, Upper Pecatonica River, Wisconsin Faith Fitzpatrick and Rebecca Carvin (USGS WI Water Science Center), Robert
Modeling Upland and Channel Sources of Sediment in the Le Sueur River Watershed, Minnesota
 Modeling Upland and Channel Sources of Sediment in the Le Sueur River Watershed, Minnesota Solomon Folle and David Mulla Department of Soil, Water and Climate University of Minnesota August 6, 2009 5 th
Appendix D. Model Setup, Calibration, and Validation
 . Model Setup, Calibration, and Validation Lower Grand River Watershed TMDL January 1 1. Model Selection and Setup The Loading Simulation Program in C++ (LSPC) was selected to address the modeling needs
DEVELOPMENT AND APPLICATION OF A HYDROCLIMATOLOGICAL STREAM TEMPERATURE MODEL WITHIN SWAT
 DEVELOPMENT AND APPLICATION OF A HYDROCLIMATOLOGICAL STREAM TEMPERATURE MODEL WITHIN SWAT Darren L. Ficklin 1, Yuzhou Luo 2, Iris T. Stewart 1, Edwin P. Maurer 3 1 Environmental Studies Institute, Santa
Lake Tahoe Watershed Model. Lessons Learned through the Model Development Process
 Lake Tahoe Watershed Model Lessons Learned through the Model Development Process Presentation Outline Discussion of Project Objectives Model Configuration/Special Considerations Data and Research Integration
Sediment and nutrient transport and storage along the urban stream corridor
 Sediment and nutrient transport and storage along the urban stream corridor Greg Noe, Cliff Hupp, Ed Schenk, Jackie Batson, Nancy Rybicki, Allen Gellis What is the role of floodplains everywhere? Noe 2013,
Modeling the Effects of Climate and Land Cover Change in the Stoney Brook Subbasin of the St. Louis River Watershed
 Modeling the Effects of Climate and Land Cover Change in the Stoney Brook Subbasin of the St. Louis River Watershed Joe Johnson and Jesse Pruette 214 NASA Research Internship Geospatial Technologies Program
Patrick Baskfield. Scott Matteson. Minnesota Pollution Control Agency. Minnesota State University Water Resource Center
 Regression Analysis of Total Suspended Solids Concentrations to Estimate Streambank, Upland Field, and Classic Gully Sediment Contributions to Minnesota River Tributaries Patrick Baskfield Minnesota Pollution
TABLE OF CONTENTS. 3.1 Synoptic Patterns Precipitation and Topography Precipitation Regionalization... 11
 TABLE OF CONTENTS ABSTRACT... iii 1 INTRODUCTION... 1 2 DATA SOURCES AND METHODS... 2 2.1 Data Sources... 2 2.2 Frequency Analysis... 2 2.2.1 Precipitation... 2 2.2.2 Streamflow... 2 2.3 Calculation of
A New Class of Spatial Statistical Model for Data on Stream Networks: Overview and Applications
 A New Class of Spatial Statistical Model for Data on Stream Networks: Overview and Applications Jay Ver Hoef Erin Peterson Dan Isaak Spatial Statistical Models for Stream Networks Examples of Autocorrelated
Flood Forecasting Tools for Ungauged Streams in Alberta: Status and Lessons from the Flood of 2013
 Flood Forecasting Tools for Ungauged Streams in Alberta: Status and Lessons from the Flood of 2013 John Pomeroy, Xing Fang, Kevin Shook, Tom Brown Centre for Hydrology, University of Saskatchewan, Saskatoon
Stream Water Quality Assessment of Long Point Gully, Graywood Gully, and Sand Point Gully: Conesus Lake Tributaries Spring 2012
 The College at Brockport: State University of New York Digital Commons @Brockport Technical Reports Studies on Water Resources of New York State and the Great Lakes 6-2012 Stream Water Quality Assessment
Stochastic decadal simulation: Utility for water resource planning
 Stochastic decadal simulation: Utility for water resource planning Arthur M. Greene, Lisa Goddard, Molly Hellmuth, Paula Gonzalez International Research Institute for Climate and Society (IRI) Columbia
Operational Hydrologic Ensemble Forecasting. Rob Hartman Hydrologist in Charge NWS / California-Nevada River Forecast Center
 Operational Hydrologic Ensemble Forecasting Rob Hartman Hydrologist in Charge NWS / California-Nevada River Forecast Center Mission of NWS Hydrologic Services Program Provide river and flood forecasts
Squaw Creek. General Information
 General Information is a tributary to the Salmon River. It enters the north side of the river about 0 miles downstream of North Fork, Idaho. The study reach is about a 30 ft length of stream about 2 miles
Avoiding Nutrient Applications During Critical Periods with a Real-time Decision Support Tool: Wisconsin s Runoff Risk Advisory Forecast (RRAF)
") Avoiding Nutrient Applications During Critical Periods with a Real-time Decision Support Tool: Wisconsin s Runoff Risk Advisory Forecast (RRAF) Dustin Goering National Weather Service 27 Feb 2015 Overview
Avoiding Nutrient Applications During Critical Periods with a Real-time Decision Support Tool: Wisconsin s Runoff Risk Advisory Forecast (RRAF) Dustin Goering National Weather Service 27 Feb 2015 Overview
Objectives: After completing this assignment, you should be able to:
 Data Analysis Assignment #1 Evaluating the effects of watershed land use on storm runoff Assignment due: 21 February 2013, 5 pm Objectives: After completing this assignment, you should be able to: 1) Calculate
Chapter 6 Mapping and Online Tools
 Chapter 6 Mapping and Online Tools The stream site you monitor is just part of a much larger system. When analyzing stream health, it is important to take a holistic view by considering the entire watershed.
Nitrate and Phosphate A Loaded Question in Illinois
 Nitrate and Phosphate A Loaded Question in Illinois Kelly Warner U.S. Geological Survey Chief of Water-Quality and Groundwater Investigations Kelly Warner (Brent Dykes, Customer Analytics for Adobe) Data
Southern Sierra Critical Zone Observatory (CZO): hydrochemical characteristics, science & measurement strategy
: hydrochemical characteristics, science & measurement strategy") Southern Sierra Critical Zone Observatory (CZO): hydrochemical characteristics, science & measurement strategy R. Bales, C. Hunsaker, M. Conklin, J. Kirchner, B. Boyer, P. Kirchner underlying hypothesis:
Southern Sierra Critical Zone Observatory (CZO): hydrochemical characteristics, science & measurement strategy R. Bales, C. Hunsaker, M. Conklin, J. Kirchner, B. Boyer, P. Kirchner underlying hypothesis:
Climatic Change Implications for Hydrologic Systems in the Sierra Nevada
 Climatic Change Implications for Hydrologic Systems in the Sierra Nevada Part Two: The HSPF Model: Basis For Watershed Yield Calculator Part two presents an an overview of why the hydrologic yield calculator
5/4/2017 Fountain Creek. Gage Analysis. Homework 6. Clifton, Cundiff, Pour, Queen, and Zey CIVE 717
 5/4/2017 Fountain Creek Gage Analysis Homework 6 Clifton, Cundiff, Pour, Queen, and Zey CIVE 717 Introduction: The CIVE 717 class members, Nate Clifton, Susan Cundiff, Ali Reza Nowrooz Pour, Robbie Queen
to low order streams, or percolated down to the water table (Yang et al., 2009). The prevalence of
. The prevalence of") Introduction The Effect of Land-cover Changes on Lag Time in the Banklick Creek Watershed, KY Katelyn Toebbe University of Louisville Department of Geography and Geosciences Urbanization in a watershed
Introduction The Effect of Land-cover Changes on Lag Time in the Banklick Creek Watershed, KY Katelyn Toebbe University of Louisville Department of Geography and Geosciences Urbanization in a watershed
Use of benthic invertebrate biological indicators in evaluating sediment deposition impairment on the Middle Truckee River, California
 Use of benthic invertebrate biological indicators in evaluating sediment deposition impairment on the Middle Truckee River, California David B. Herbst Sierra Nevada Aquatic Research Laboratory University
The Importance of Snowmelt Runoff Modeling for Sustainable Development and Disaster Prevention
 The Importance of Snowmelt Runoff Modeling for Sustainable Development and Disaster Prevention Muzafar Malikov Space Research Centre Academy of Sciences Republic of Uzbekistan Water H 2 O Gas - Water Vapor
Modeling of peak inflow dates for a snowmelt dominated basin Evan Heisman. CVEN 6833: Advanced Data Analysis Fall 2012 Prof. Balaji Rajagopalan
 Modeling of peak inflow dates for a snowmelt dominated basin Evan Heisman CVEN 6833: Advanced Data Analysis Fall 2012 Prof. Balaji Rajagopalan The Dworshak reservoir, a project operated by the Army Corps
9. PROBABLE MAXIMUM PRECIPITATION AND PROBABLE MAXIMUM FLOOD
 9. PROBABLE MAXIMUM PRECIPITATION AND PROBABLE MAXIMUM FLOOD 9.1. Introduction Due to the size of Watana Dam and the economic importance of the Project to the Railbelt, the Probable Maximum Flood (PMF)
Influence of spatial variation in precipitation on artificial neural network rainfall-runoff model
 Hydrology Days 212 Influence of spatial variation in precipitation on artificial neural network rainfall-runoff model André Dozier 1 Department of Civil and Environmental Engineering, Colorado State University
Bayesian Hierarchical Modelling: Incorporating spatial information in water resources assessment and accounting
 Bayesian Hierarchical Modelling: Incorporating spatial information in water resources assessment and accounting Grace Chiu & Eric Lehmann (CSIRO Mathematics, Informatics and Statistics) A water information
Nina Omani, Raghavan Srinivasan, and Taesoo Lee. Spatial Sciences Laboratory, Texas A&M University
 Nina Omani, Raghavan Srinivasan, and Taesoo Lee Spatial Sciences Laboratory, Texas A&M University This project was initiated to develop and apply the SWAT model to two Texas estuaries in order to estimate
Water Year Day 2010
 mm mm SCA, % Storage, mm Sto, 1 mm Sat def, 1 mm 25 2 15 1 5 4 3 2 1 2 5 25 2 Saturation deficit depth (water table) Saturation deficit volume Root zone storage Unsaturated soil storage Groundwater storage
Big Wood River. General Information
 General Information The flows out of the southern portion of the Sawtooth National Recreation Area in central Idaho. The study reach is about a,200 ft length of river about.5 miles upstream from the discontinued
Cacapon Institute s Potomac Highlands Watershed School High School Lesson Plan for the Real-Time Data
 Cacapon Institute s Potomac Highlands Watershed School High School Lesson Plan for the Real-Time Data March 1 Overview The Real Time Data Portal can be used to explore scientific concepts of graphing,
The Delaware Environmental Monitoring & Analysis Center
 The Delaware Environmental Monitoring & Analysis Center Tina Callahan Delaware Estuary Science & Environmental Summit 2013 January 27-30, 2013 What is DEMAC? Delaware Environmental Monitoring & Analysis
NIDIS Weekly Climate, Water and Drought Assessment Summary Upper Colorado River Basin Pilot Project 13 July 2010
 NIDIS Weekly Climate, Water and Drought Assessment Summary Upper Colorado River Basin Pilot Project 13 July 2010 Precipitation and Snowpack Over the past week, precipitation in the Upper Colorado River
REDWOOD VALLEY SUBAREA
 Independent Science Review Panel Conceptual Model of Watershed Hydrology, Surface Water and Groundwater Interactions and Stream Ecology for the Russian River Watershed Appendices A-1 APPENDIX A A-2 REDWOOD
Combining Regressive and Auto-Regressive Models for Spatial-Temporal Prediction
 Combining Regressive and Auto-Regressive Models for Spatial-Temporal Prediction Dragoljub Pokrajac DPOKRAJA@EECS.WSU.EDU Zoran Obradovic ZORAN@EECS.WSU.EDU School of Electrical Engineering and Computer
NEW YORK STATE WATER RESOURCES INSTITUTE Department of Biological and Environmental Engineering
 NEW YORK STATE WATER RESOURCES INSTITUTE Department of Biological and Environmental Engineering 230 Riley-Robb Hall, Cornell University Tel: (607) 254-7163 Ithaca, NY 14853-5701 Fax: (607) 255-4080 http://wri.cals.cornell.edu
Application of an Enhanced, Fine-Scale SWAT Model to Target Land Management Practices for Maximizing Pollutant Reduction and Conservation Benefits
 Application of an Enhanced, Fine-Scale SWAT Model to Target Land Management Practices for Maximizing Pollutant Reduction and Conservation Benefits Amanda Flynn, Todd Redder, Joe DePinto, Derek Schlea Brian
Sierra Nevada Hydroclimatology: An Experimental Prediction of Maximum Daily Snowmelt Discharge in 2005
 Sierra Nevada Hydroclimatology: An Experimental Prediction of Maximum Daily Snowmelt Discharge in 2005 David Peterson, Jessica Lundquist, Iris Stewart, Noah Knowles, Madeline Solomon and Stephen Hager
A STUDY OF SOIL TEMPERATURE CLIMATOLOGY: COTTONWOOD, SOUTH DAKOTA SOIL TEMPERATURES FROM 1982 TO 2004
 Proceedings of the South Dakota Academy of Science, Vol. 87 (2008) 269 A STUDY OF SOIL TEMPERATURE CLIMATOLOGY: COTTONWOOD, SOUTH DAKOTA SOIL TEMPERATURES FROM 1982 TO 2004 Dennis P. Todey, Joanne Puetz
Implementing a Thermal Urban Runoff Model (TURM)
") 20 Implementing a Thermal Urban Runoff Model (TURM) K.E. Arrington, J.M. Norman, A. Roa-Espinosa and S.J. Ventura An Erosion Control and Stormwater Management Ordinance was recently adopted in Dane County,
20 Implementing a Thermal Urban Runoff Model (TURM) K.E. Arrington, J.M. Norman, A. Roa-Espinosa and S.J. Ventura An Erosion Control and Stormwater Management Ordinance was recently adopted in Dane County,
Bivariate Regression Analysis. The most useful means of discerning causality and significance of variables
 Bivariate Regression Analysis The most useful means of discerning causality and significance of variables Purpose of Regression Analysis Test causal hypotheses Make predictions from samples of data Derive
Technical Memorandum No Sediment Model
 Pajaro River Watershed Study in association with Technical Memorandum No. 1.2.9 Sediment Model Task: Development of Sediment Model To: PRWFPA Staff Working Group Prepared by: Gregory Morris and Elsie Parrilla
Typical Hydrologic Period Report (Final)
") (DELCORA) (Final) November 2015 (Updated April 2016) CSO Long-Term Control Plant Update REVISION CONTROL REV. NO. DATE ISSUED PREPARED BY DESCRIPTION OF CHANGES 1 4/26/16 Greeley and Hansen Pg. 1-3,
(DELCORA) (Final) November 2015 (Updated April 2016) CSO Long-Term Control Plant Update REVISION CONTROL REV. NO. DATE ISSUED PREPARED BY DESCRIPTION OF CHANGES 1 4/26/16 Greeley and Hansen Pg. 1-3,
Satellite data for hydrological forecasting
 Satellite data for hydrological forecasting Current use at ECMWF and perspective Shopping list! Our current tools does not allow direct use, but could be modified Christel Prudhomme Christel.prudhomme@ecmwf.int
Technical Memorandum FINAL
 Technical Memorandum FINAL To: Project File A previous effort to develop and calibrate a Soil and Water Assessment Tool (SWAT) watershed model for the Cedar River basin included a limited representation
Analysing River Discharge Data for Flood Analysis
 Analysing River Discharge Data for Flood Analysis This suggested response provides answers to the eleven questions posed on the web-site. Your report should have covered all of this material. (A) Produce
Drought and Future Water for Southern New Mexico
 Drought and Future Water for Southern New Mexico David S. Gutzler University of New Mexico gutzler@unm.edu * The big drought of 2018 * Longer term challenges for water supply * Forecasting streamflow Elephant
Environment Canada Modelling Systems and the 2013 Alberta Floods
 Environment Canada Modelling Systems and the 2013 Alberta Floods Calgary, Alberta February 19, 2014 Bruce Davison (EC) Al Pietroniro (EC) Nick Kouwen (UW) Anthony Liu (EC) Muluneh Mekonnen (AB) Ron Goodison
Hannah Moore CEE Juvenile Bull Trout Distribution in the South Fork Walla Walla River, Oregon
 Hannah Moore CEE 6440 Juvenile Bull Trout Distribution in the South Fork Walla Walla River, Oregon Introduction Bull trout (Salvelinus confluentus) are an endangered species historically found throughout
Changing Climate. An Engineering challenge for today and the future. Milwaukee School of Engineering December 2, 2015
 Changing Climate An Engineering challenge for today and the future David S. Liebl UW- Madison, EPD; UW-Extension; Wisconsin Initiative on Climate change Impacts Milwaukee School of Engineering December
NIDIS Intermountain West Drought Early Warning System May 23, 2017
 NIDIS Drought and Water Assessment NIDIS Intermountain West Drought Early Warning System May 23, 2017 Precipitation The images above use daily precipitation statistics from NWS COOP, CoCoRaHS, and CoAgMet
Climate also has a large influence on how local ecosystems have evolved and how we interact with them.
 The Mississippi River in a Changing Climate By Paul Lehman, P.Eng., General Manager Mississippi Valley Conservation (This article originally appeared in the Mississippi Lakes Association s 212 Mississippi
3/3/2013. The hydro cycle water returns from the sea. All "toilet to tap." Introduction to Environmental Geology, 5e
 Introduction to Environmental Geology, 5e Running Water: summary in haiku form Edward A. Keller Chapter 9 Rivers and Flooding Lecture Presentation prepared by X. Mara Chen, Salisbury University The hydro
The Documentation of Extreme Hydrometeorlogical Events: Two Case Studies in Utah, Water Year 2005
 The Documentation of Extreme Hydrometeorlogical Events: Two Case Studies in Utah, Water Year 2005 Tim Bardsley1*, Mark Losleben2, Randy Julander1 1. USDA, NRCS, Snow Survey Program, Salt Lake City, Utah.
MENOMONEE RIVER SEDIMENT TRANSPORT MODELING SYSTEM FINAL REPORT
 MENOMONEE RIVER SEDIMENT TRANSPORT MODELING SYSTEM FINAL REPORT Prepared for: U.S. ARMY CORPS OF ENGINEERS DETROIT DISTRICT BOX 127 DETROIT, MICHIGAN 48231 Prepared by: W.F. BAIRD & ASSOCIATES, LTD. 2981
-Assessment of current water conditions. - Precipitation Forecast. - Recommendations for Drought Monitor
 April 27, 2010 -Assessment of current water conditions - Precipitation Forecast - Recommendations for Drought Monitor 7 Day Precipitation 19-25 April 2010 Month-to-Date Precipitation 1-25 April 2010
Water Supply Conditions and Outlook June 4, 2018
 Water Supply Conditions and Outlook June 4, 2018 Flow Forecasting & Operations Planning Water Security Agency Overview Water supply conditions across Saskatchewan are generally good with most reservoir
Kootenai Basin Water Supply Update and Sturgeon Flow Augmentation Kootenai Valley Resource Initiative
 Kootenai Basin Water Supply Update and Sturgeon Flow Augmentation Kootenai Valley Resource Initiative Greg Hoffman Fishery Biologist / Kootenai River Basin Flood Engineer Libby Dam 15 May 2017 US Army
2016 Irrigated Crop Production Update
 2016 Irrigated Crop Production Update Mapping Climate Trends and Weather Extremes Across Alberta for the Period 1950-2010 Stefan W. Kienzle Department of Geography University of Lethbridge, Alberta, Canada
Digital Terrain Analysis for Root River Watershed
 Digital Terrain Analysis for Root River Watershed Prepared by: Tisha Hooks, Winona State University Consulting Center March 28, 2014 Executive Summary: The probability of erosion tended to be higher for
Watershed concepts for community environmental planning
 Purpose and Objectives Watershed concepts for community environmental planning Dale Bruns, Wilkes University USDA Rural GIS Consortium May 2007 Provide background on basic concepts in watershed, stream,
Stochastic Hydrology. a) Data Mining for Evolution of Association Rules for Droughts and Floods in India using Climate Inputs
 Data Mining for Evolution of Association Rules for Droughts and Floods in India using Climate Inputs") Stochastic Hydrology a) Data Mining for Evolution of Association Rules for Droughts and Floods in India using Climate Inputs An accurate prediction of extreme rainfall events can significantly aid in policy
Stochastic Hydrology a) Data Mining for Evolution of Association Rules for Droughts and Floods in India using Climate Inputs An accurate prediction of extreme rainfall events can significantly aid in policy
LESSON HEC-HMS
 LESSON 2.2 - HEC-HMS Introduction: TEAM 8 SCS method: The input data: Thiessen Polygons: Concentration Lag Time: SCS Method: Calculation of CN: Result figures: CONSTRUCTING HYDROGRAPH WITH HEC-HMS: Rainfall
Workshop: Build a Basic HEC-HMS Model from Scratch
 Workshop: Build a Basic HEC-HMS Model from Scratch This workshop is designed to help new users of HEC-HMS learn how to apply the software. Not all the capabilities in HEC-HMS are demonstrated in the workshop
WSWC/NOAA Workshops on S2S Precipitation Forecasting
 WSWC/NOAA Workshops on S2S Precipitation Forecasting San Diego, May 2015 Salt Lake City at NWS Western Region HQ, October 2015 Las Vegas at Colorado River Water Users Association, December 2015 College
CoCoRaHS Monitoring Colorado s s Water Resources through Community Collaborations
 CoCoRaHS Monitoring Colorado s s Water Resources through Community Collaborations Nolan Doesken Colorado Climate Center Atmospheric Science Department Colorado State University Presented at Sustaining
NOAA Spring Flood Outlook for Iowa
 NOAA Spring Flood Outlook for Iowa Safeguard Iowa Partnership March 10, 2015 1 Agenda Orientation Maps Current Conditions Weather Outlook Spring Flood Outlook 2 1 Orientation Maps 3 4 2 5 Current Conditions
Flooding in Western North Carolina: Some Spatial, Hydrologic, and Seasonal Characteristics CAUTION!! Outline. Basic Flood Facts.
 Flooding in Western North Carolina: Some Spatial, Hydrologic, and Seasonal Characteristics J. Greg Dobson CAUTION!! National Environmental Modeling and Analysis Center RENCI at UNC-Asheville Engagement
Disentangling Impacts of Climate & Land Use Changes on the Quantity & Quality of River Flows in Southern Ontario
 Disentangling Impacts of Climate & Land Use Changes on the Quantity & Quality of River Flows in Southern Ontario by Trevor Dickinson & Ramesh Rudra, Water Resources Engineering University of Guelph Acknowledgements
Section 4: Model Development and Application
 Section 4: Model Development and Application The hydrologic model for the Wissahickon Act 167 study was built using GIS layers of land use, hydrologic soil groups, terrain and orthophotography. Within
Precipitation. Standardized Precipitation Index. NIDIS Intermountain West Drought Early Warning System September 5, 2017
 9/6/2017 NIDIS Drought and Water Assessment NIDIS Intermountain West Drought Early Warning System September 5, 2017 Precipitation The images above use daily precipitation statistics from NWS COOP, CoCoRaHS,
Diagnostic Geomorphic Methods for Understanding Future Behavior of Lake Superior Streams What Have We Learned in Two Decades?
 Diagnostic Geomorphic Methods for Understanding Future Behavior of Lake Superior Streams What Have We Learned in Two Decades? Faith Fitzpatrick USGS WI Water Science Center, Middleton, WI fafitzpa@usgs.gov
Surface Hydrology Research Group Università degli Studi di Cagliari
 Surface Hydrology Research Group Università degli Studi di Cagliari Evaluation of Input Uncertainty in Nested Flood Forecasts: Coupling a Multifractal Precipitation Downscaling Model and a Fully-Distributed
Understanding the effects of roads in upland settings on hydrology, geomorphology and water quality
 Understanding the effects of roads in upland settings on hydrology, geomorphology and water quality Beverley Wemple Department of Geography and Rubenstein School of Environment & Natural Resources The
Tracking Seasonal Precipitation s Dependence on Root Zone Soil Moisture Using Regional Reanalysis
 Tracking Seasonal Precipitation s Dependence on Root Zone Soil Moisture Using Regional Reanalysis Peter Goble Russ S. Schumacher and Nolan J. Doesken Colorado State University Background The atmosphere
Landscape approaches for understanding and managing lakes. Dr. Kendra Spence Cheruvelil Scottish Freshwater Group 24 October 2013
 Landscape approaches for understanding and managing lakes Dr. Kendra Spence Cheruvelil Scottish Freshwater Group 24 October 2013 Making inferences from well studied ecosystems Variable Time Lake (data)
Near Real-Time Runoff Estimation Using Spatially Distributed Radar Rainfall Data. Jennifer Hadley 22 April 2003
 Near Real-Time Runoff Estimation Using Spatially Distributed Radar Rainfall Data Jennifer Hadley 22 April 2003 Introduction Water availability has become a major issue in Texas in the last several years,
NIDIS Intermountain West Drought Early Warning System December 11, 2018
 NIDIS Drought and Water Assessment NIDIS Intermountain West Drought Early Warning System December 11, 2018 Precipitation The images above use daily precipitation statistics from NWS COOP, CoCoRaHS, and
A Report on a Statistical Model to Forecast Seasonal Inflows to Cowichan Lake
 A Report on a Statistical Model to Forecast Seasonal Inflows to Cowichan Lake Prepared by: Allan Chapman, MSc, PGeo Hydrologist, Chapman Geoscience Ltd., and Former Head, BC River Forecast Centre Victoria
New NOAA Precipitation-Frequency Atlas for Wisconsin
 New NOAA Precipitation-Frequency Atlas for Wisconsin #215966 Presentation to the Milwaukee Metropolitan Sewerage District Technical Advisory Team January 16, 2014 Michael G. Hahn, P.E., P.H. SEWRPC Chief
-Assessment of current water conditions. - Precipitation Forecast. - Recommendations for Drought Monitor
 June 1, 2010 -Assessment of current water conditions - Precipitation Forecast - Recommendations for Drought Monitor Snotel WYTD Precipitation as Percentage of Average Upper Colorado Headwaters 88% of
FY 2002 ANNUAL PROJECT REPORT PROJECT NUMBER: 107. I. Project Title: Gunnison River / Aspinall Unit Temperature Model: Phase II
 COLORADO RIVER RECOVERY PROGRAM RECOVERY PROGRAM FY 2002 ANNUAL PROJECT REPORT PROJECT NUMBER: 107 I. Project Title: Gunnison River / Aspinall Unit Temperature Model: Phase II II. Principal Investigators:
Water information system advances American River basin. Roger Bales, Martha Conklin, Steve Glaser, Bob Rice & collaborators UC: SNRI & CITRIS
 Water information system advances American River basin Roger Bales, Martha Conklin, Steve Glaser, Bob Rice & collaborators UC: SNRI & CITRIS Opportunities Unprecedented level of information from low-cost
NIDIS Intermountain West Drought Early Warning System December 4, 2018
 12/4/2018 NIDIS Drought and Water Assessment NIDIS Intermountain West Drought Early Warning System December 4, 2018 Precipitation The images above use daily precipitation statistics from NWS COOP, CoCoRaHS,
Watershed Processes and Modeling
 Watershed Processes and Modeling Pierre Y. Julien Hyeonsik Kim Department of Civil Engineering Colorado State University Fort Collins, Colorado Kuala Lumpur - May Objectives Brief overview of Watershed
NREM 407/507 April Jordan River today Danube on Tuesday. 2. Quiz. 3. Discuss Stream Bank Stabilization
 NREM 407/507 April 9 1. Jordan River today Danube on Tuesday 2. Quiz 3. Discuss Stream Bank Stabilization 4. Lab Tuesday bring gloves, waders if you have them & be ready to get muddy, learn & have fun.
Upper Colorado River Basin Flows and Paleohydrology Jenny Ta
 Upper Colorado River Basin Flows and Paleohydrology Jenny Ta Introduction The Colorado River flows from its headwaters in the Rocky Mountains, through seven U.S. and two Mexican states into the Colorado
NIDIS Intermountain West Drought Early Warning System March 26, 2019
 NIDIS Intermountain West Drought Early Warning System March 26, 2019 The images above use daily precipitation statistics from NWS COOP, CoCoRaHS, and CoAgMet stations. From top to bottom, and left to right:
Bayesian dynamic modeling for large space-time weather datasets using Gaussian predictive processes
 Bayesian dynamic modeling for large space-time weather datasets using Gaussian predictive processes Andrew O. Finley 1 and Sudipto Banerjee 2 1 Department of Forestry & Department of Geography, Michigan
Each basin is surrounded & defined by a drainage divide (high point from which water flows away) Channel initiation
 Channel initiation") DRAINAGE BASINS A drainage basin or watershed is defined from a downstream point, working upstream, to include all of the hillslope & channel areas which drain to that point Each basin is surrounded &
DRAINAGE BASINS A drainage basin or watershed is defined from a downstream point, working upstream, to include all of the hillslope & channel areas which drain to that point Each basin is surrounded &
Assessing Spatial and Temporal Distribution of Sediment, Nitrogen and Phosphorous Loading in the Missouri River Basin (MORB)
") Assessing Spatial and Temporal Distribution of Sediment, Nitrogen and Phosphorous Loading in the Missouri River Basin (MORB) Zhonglong Zhang, PhD, PE, May Wu, PhD LimnoTech, Environmental Laboratory, ERDC,
Assessing Spatial and Temporal Distribution of Sediment, Nitrogen and Phosphorous Loading in the Missouri River Basin (MORB) Zhonglong Zhang, PhD, PE, May Wu, PhD LimnoTech, Environmental Laboratory, ERDC,
THE STATE OF SURFACE WATER GAUGING IN THE NAVAJO NATION
 THE STATE OF SURFACE WATER GAUGING IN THE NAVAJO NATION Aregai Tecle Professor of Hydrology Northern Arizona University Flagstaff, AZ Acknowledgement Many thanks to my research team mates and Elisabeth
Table (6): Annual precipitation amounts as recorded by stations X and Y. No. X Y
: Annual precipitation amounts as recorded by stations X and Y. No. X Y") Example: X and Y are two neighboring rainfall stations. Station X has complete records and station Y has some missing values. Find the linear correlation equation between the two series as mentioned in
Example: X and Y are two neighboring rainfall stations. Station X has complete records and station Y has some missing values. Find the linear correlation equation between the two series as mentioned in
Natural Shoreline Landscapes on Michigan Inland Lakes
 Natural Shoreline Landscapes on Michigan Inland Lakes Excerpts from Chapters 2 and 3 Photo Photo by Jane by Jane Herbert Herbert Did you know? Twenty-four species of amphibians, 25 species of reptiles,
Remaining Capacity in Great Lakes Reservoirs
 US Army Corps of Engineers Detroit District Remaining Capacity in Great Lakes Reservoirs Storage Capacity Behind Great Lakes Dams Field Data and Modeling Motivation for project Project overview Data and
Ciaran Harman Johns Hopkins University Department of Geography and Environmental Engineering
 Modeling unsteady lumped transport with time-varying transit time distributions Ciaran Harman Johns Hopkins University Department of Geography and Environmental Engineering Two views of transport Eulerian
Habitat Suitability for Forage Fishes in Chesapeake Bay
 Habitat Suitability for Forage Fishes in Chesapeake Bay Aug 2017 Jul 2019 Mary C Fabrizio Troy D Tuckey Aaron J Bever Michael L MacWilliams 21 June 2018 Photo: Chesapeake Bay Program Motivation Production
GIS BASED HYDROLOGICAL MODELLING FOR CLIMATE CHANGE IMPACT ASSESSMENT. Dr. Amardeep Singh, MoWR Prof. A. K. Gosain, IIT Delhi
 GIS BASED HYDROLOGICAL MODELLING FOR CLIMATE CHANGE IMPACT ASSESSMENT Dr. Amardeep Singh, MoWR Prof. A. K. Gosain, IIT Delhi Model Description SWAT (Soil and Water Assessment Tool) Conceptual, distributed,