Southern Sierra Critical Zone Observatory (CZO): hydrochemical characteristics, science & measurement strategy
|
|
|
- Eustacia Houston
- 5 years ago
- Views:
Transcription
geochemical processes, including weathering & the extent of coupling among the")
1 Southern Sierra Critical Zone Observatory (CZO): hydrochemical characteristics, science & measurement strategy R. Bales, C. Hunsaker, M. Conklin, J. Kirchner, B. Boyer, P. Kirchner underlying hypothesis: The distribution of soil moisture throughout the catchments controls (bio)geochemical processes, including weathering & the extent of coupling among the carbon & nitrogen cycles.
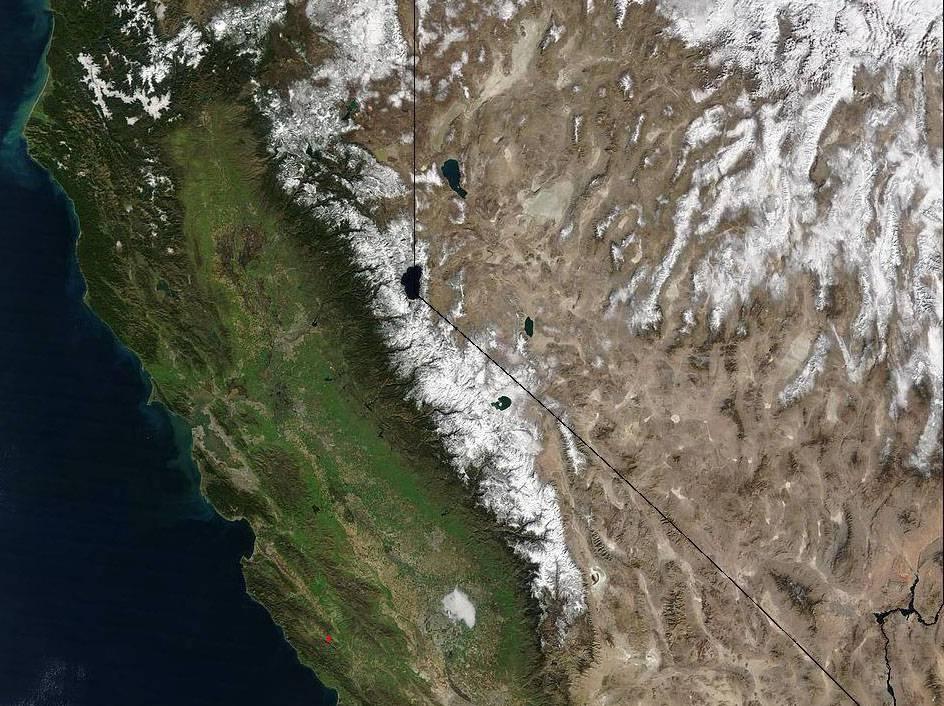
2 CZO

3 Mixed conifer forest dominates the CZO, which crosses the rainsnow transition (1,500-2,000 m)
4 Rain-snow transition zone undergoes rapid seasonal changes, going from snowcover to wet soil to dry soil over 1-2 months Soil volumetric water content drip edge SWE under canopy March April May 2007 snow depth Snow & SWE depth, cm

5 Steep gradients in temperature & precipitation result in a lag in spring runoff in going from lower to higher elevation 2004

6 High frequency stream patterns during snowmelt 2004
7 Wolverton Creek, Sequoia NP: stream stage Base - flow August 14 - September 7, 2007 Base-flow period, 2150 m elevation stage cm August September 0
8 Wolverton Creek, Sequoia NP: stage & precipitation Base - flow August 14 - September 7, 2007 Base-flow period, 2150 m elevation stage cm precip.001mm As we add measurements and integrate them causal relationships become increasingly clear August September 5 0
9 Wolverton Creek, Sequoia NP: stage, precip & air temperature Base - flow August 14 - September 7, 2007 Base-flow period, 2150 m elevation stage cm air temp C precip.001mm to 6 hour lag between daily low flow and Tmax or daily high flow and Tmin August September 0
10 Wolverton Creek, Sequoia NP: stage, precip, air temp & sap flow Base - flow August 14 - September 7, 2007 Base-flow period, 2150 m elevation stage cm sap-flow C air temp C precip.001mm Peak sapflow occurs at solar noon about 1 hr before Tmax August September 0
 than do those at lower elev. (7.2-7.1) Deficiency in ion balance made up by organic acidity Stream nutrients mostly in organic phase (DOC) Inorganic N important in soils")
11 Stream geochemistry Primarily Na +, Ca 2+, HCO 3 - Total ion conc. at higher elev. about half that at lower elev. Higher elev. streams exhibit wider average ph range ( ) than do those at lower elev. ( ) Deficiency in ion balance made up by organic acidity Stream nutrients mostly in organic phase (DOC) Inorganic N important in soils
12 Dissolved organic carbon & discharge Stream reactive nutrients mostly organic (DOC) Highest conc. during rain & snowmelt high water tables & flushing of DOC from landscape to stream Timing of DOC release controlled largely by timing of streamflow generation DOC, mg L -1 WY J F M A M J J A S O Discharge, L s -1 Data courtesy M Solomon
13 Weathering & landscape features Stepped topography: a reflection of water-related critical zone processes? It is thought that the stepped topography evident in this landscape is an integration over time of the thinner soils, lower soil moisture & thus less weathering associated with steeper slopes. The distribution of soil moisture throughout the catchments controls (bio)geochemical processes, including weathering & the extent of coupling between carbon & nitrogen cycles.
14 Wahrhaftig's hypothesis, 1965: "Irregular steps characterize the topography on granitic terrane on the west slope of the southern Sierra Nevada... the stepped topography is confined to granitic rocks & is believed to result primarily from the much more rapid weathering of granitic rocks where buried than where exposed." miles 2400 feet
15 Explicit links between hydrology, geochemical processes & landform evolution Steeper slopes --> thinner soils --> less persistent moisture --> slower weathering Shallower slopes --> thicker soils --> more persistent moisture --> faster weathering Integrating through time yields stepped topography. Test the Wahrhaftig hypothesis using soil moisture, weathering rates, denudation rates across landscape

16 Spatial sampling strategy Use multiple tracers to characterize both longerterm processes (millennia) & short-term responses Capture physiographic variability: slope, aspect, elevation, soil depth, streams
17 CZO as a community resource CZO program supported through NSF-EAR CZO home: Data: USFS-PSW instrumented catchments in place CZO instrumentation in progress, completion summer 2008 Contact: rbales@ucmerced.edu
Surface & subsurface processes in mountain environments
 Surface & subsurface processes in mountain environments evapotranspiration snowmelt precipitation infiltration Roger Bales Martha Conklin Robert Rice Fengjing Liu Peter Kirchner runoff sublimation ground
Water information system advances American River basin. Roger Bales, Martha Conklin, Steve Glaser, Bob Rice & collaborators UC: SNRI & CITRIS
 Water information system advances American River basin Roger Bales, Martha Conklin, Steve Glaser, Bob Rice & collaborators UC: SNRI & CITRIS Opportunities Unprecedented level of information from low-cost
Quenching the Valley s thirst: The connection between Sierra Nevada snowpack & regional water supply
 Quenching the Valley s thirst: The connection between Sierra Nevada snowpack & regional water supply Roger Bales, UC Merced Snow conditions Snow & climate change Research directions Sierra Nevada snow
A Review of the 2007 Water Year in Colorado
 A Review of the 2007 Water Year in Colorado Nolan Doesken Colorado Climate Center, CSU Mike Gillespie Snow Survey Division, USDA, NRCS Presented at the 28 th Annual AGU Hydrology Days, March 26, 2008,
Water Year Day 2010
 mm mm SCA, % Storage, mm Sto, 1 mm Sat def, 1 mm 25 2 15 1 5 4 3 2 1 2 5 25 2 Saturation deficit depth (water table) Saturation deficit volume Root zone storage Unsaturated soil storage Groundwater storage
Gateway Trail Project
 Gateway Trail Project Debris Flow Hazard Assessment By: Juan de la Fuente April 30, 2010 Background- On April 22, 2010, the Shasta-Trinity National Forest (Mt. Shasta-McCloud Unit) requested a geologic
Spring Water Supply and Weather Outlook How about that near Miracle March?
 Spring Water Supply and Weather Outlook How about that near Miracle March? tim.bardsley@noaa.gov NWS Reno 4.10.18 1 Out the Window March and early April have been Boom not Bust Key Points Up Front Wet
Water, geology, climate & soils: Sierra Nevada, Merced River & Central Valley connections
 Water, geology, climate & soils: Sierra Nevada, Merced River & Central Valley connections Geography & geology Merced River basin Climate & hydrology Soils & soil formation Roger Bales UC Merced Water,
Sediment loads and erosion in forest headwater streams of the Sierra Nevada, California
 Revisiting Experimental Catchment Studies in Forest Hydrology (Proceedings of a Workshop held during the XXV IUGG General Assembly in Melbourne, June July 2011) (IAHS Publ. 353, 2012). 195 Sediment loads
Flood Risk Assessment
 Flood Risk Assessment February 14, 2008 Larry Schick Army Corps of Engineers Seattle District Meteorologist General Assessment As promised, La Nina caused an active winter with above to much above normal
Climatic Change Implications for Hydrologic Systems in the Sierra Nevada
 Climatic Change Implications for Hydrologic Systems in the Sierra Nevada Part Two: The HSPF Model: Basis For Watershed Yield Calculator Part two presents an an overview of why the hydrologic yield calculator
The following information is provided for your use in describing climate and water supply conditions in the West as of April 1, 2003.
 Natural Resources Conservation Service National Water and Climate Center 101 SW Main Street, Suite 1600 Portland, OR 97204-3224 Date: April 8, 2003 Subject: April 1, 2003 Western Snowpack Conditions and
Oregon Water Conditions Report May 1, 2017
 Oregon Water Conditions Report May 1, 2017 Mountain snowpack in the higher elevations has continued to increase over the last two weeks. Statewide, most low and mid elevation snow has melted so the basin
Lake Tahoe Watershed Model. Lessons Learned through the Model Development Process
 Lake Tahoe Watershed Model Lessons Learned through the Model Development Process Presentation Outline Discussion of Project Objectives Model Configuration/Special Considerations Data and Research Integration
Spatially distributed water-balance and meteorological data from the Wolverton catchment, Sequoia National Park, California
 Manuscript under review for journal Earth Syst. Sci. Spatially distributed water-balance and meteorological data from the Wolverton catchment, Sequoia National Park, California Roger C. Bales 1, Erin M.
March 1, 2003 Western Snowpack Conditions and Water Supply Forecasts
 Natural Resources Conservation Service National Water and Climate Center 101 SW Main Street, Suite 1600 Portland, OR 97204-3224 Date: March 17, 2003 Subject: March 1, 2003 Western Snowpack Conditions and
Snowcover interaction with climate, topography & vegetation in mountain catchments
 Snowcover interaction with climate, topography & vegetation in mountain catchments DANNY MARKS Northwest Watershed Research Center USDA-Agricultural Agricultural Research Service Boise, Idaho USA RCEW
4. THE HBV MODEL APPLICATION TO THE KASARI CATCHMENT
 Application of HBV model to the Kasari River, 1994 Page 1 of 6 Application of the HBV model to the Kasari river for flow modulation of catchments characterised by specific underlying features by R. Vedom,
2. PHYSICAL SETTING FINAL GROUNDWATER MANAGEMENT PLAN. 2.1 Topography. 2.2 Climate
 FINAL GROUNDWATER MANAGEMENT PLAN 2. PHYSICAL SETTING Lassen County is a topographically diverse area at the confluence of the Cascade Range, Modoc Plateau, Sierra Nevada and Basin and Range geologic provinces.
Snowcover along elevation gradients in the Upper Merced and Tuolumne River basin of the Sierra Nevada of California from MODIS and blended ground data
 Snowcover along elevation gradients in the Upper Merced and Tuolumne River basin of the Sierra Nevada of California from MODIS and blended ground data Robert Rice a, Roger Bales a, Thomas H. Painter b,
Wind River Indian Reservation and Surrounding Area Climate and Drought Summary
 Northern Arapaho Tribe Wind River Indian Reservation and Surrounding Area Climate and Drought Summary Spring Events & Summer Outlook 2015 Spring Was Warm And Very Wet Across The Region The spring season
Oregon Water Conditions Report April 17, 2017
 Oregon Water Conditions Report April 17, 2017 Mountain snowpack continues to maintain significant levels for mid-april. By late March, statewide snowpack had declined to 118 percent of normal after starting
9. PROBABLE MAXIMUM PRECIPITATION AND PROBABLE MAXIMUM FLOOD
 9. PROBABLE MAXIMUM PRECIPITATION AND PROBABLE MAXIMUM FLOOD 9.1. Introduction Due to the size of Watana Dam and the economic importance of the Project to the Railbelt, the Probable Maximum Flood (PMF)
Chiang Rai Province CC Threat overview AAS1109 Mekong ARCC
 Chiang Rai Province CC Threat overview AAS1109 Mekong ARCC This threat overview relies on projections of future climate change in the Mekong Basin for the period 2045-2069 compared to a baseline of 1980-2005.
Drought and Future Water for Southern New Mexico
 Drought and Future Water for Southern New Mexico David S. Gutzler University of New Mexico gutzler@unm.edu * The big drought of 2018 * Longer term challenges for water supply * Forecasting streamflow Elephant
Preliminary Runoff Outlook February 2018
 Preliminary Runoff Outlook February 2018 Prepared by: Flow Forecasting & Operations Planning Water Security Agency General Overview The Water Security Agency (WSA) is preparing for 2018 spring runoff including
January 2011 Calendar Year Runoff Forecast
 January 2011 Calendar Year Runoff Forecast 2010 Runoff Year Calendar Year 2010 was the third highest year of runoff in the Missouri River Basin above Sioux City with 38.8 MAF, behind 1978 and 1997 which
Modeling of peak inflow dates for a snowmelt dominated basin Evan Heisman. CVEN 6833: Advanced Data Analysis Fall 2012 Prof. Balaji Rajagopalan
 Modeling of peak inflow dates for a snowmelt dominated basin Evan Heisman CVEN 6833: Advanced Data Analysis Fall 2012 Prof. Balaji Rajagopalan The Dworshak reservoir, a project operated by the Army Corps
Soil Formation. Lesson Plan: NRES B2-4
 Soil Formation Lesson Plan: NRES B2-4 1 Anticipated Problems 1. What are five different factors that affect soil formation? 2. What are some different types of parent material that affect soils? 3. What
Disentangling Impacts of Climate & Land Use Changes on the Quantity & Quality of River Flows in Southern Ontario
 Disentangling Impacts of Climate & Land Use Changes on the Quantity & Quality of River Flows in Southern Ontario by Trevor Dickinson & Ramesh Rudra, Water Resources Engineering University of Guelph Acknowledgements
Zachary Holden - US Forest Service Region 1, Missoula MT Alan Swanson University of Montana Dept. of Geography David Affleck University of Montana
 Progress modeling topographic variation in temperature and moisture for inland Northwest forest management Zachary Holden - US Forest Service Region 1, Missoula MT Alan Swanson University of Montana Dept.
Climate Change in Colorado: Recent Trends, Future Projections and Impacts An Update to the Executive Summary of the 2014 Report
 Climate Change in Colorado: Recent Trends, Future Projections and Impacts An Update to the Executive Summary of the 2014 Report Jeff Lukas, Western Water Assessment, University of Colorado Boulder - Lukas@colorado.edu
Vermont Soil Climate Analysis Network (SCAN) sites at Lye Brook and Mount Mansfield
 sites at Lye Brook and Mount Mansfield") Vermont Soil Climate Analysis Network (SCAN) sites at Lye Brook and Mount Mansfield 13 Years of Soil Temperature and Soil Moisture Data Collection September 2000 September 2013 Soil Climate Analysis Network
Vermont Soil Climate Analysis Network (SCAN) sites at Lye Brook and Mount Mansfield 13 Years of Soil Temperature and Soil Moisture Data Collection September 2000 September 2013 Soil Climate Analysis Network
January 25, Summary
 January 25, 2013 Summary Precipitation since the December 17, 2012, Drought Update has been slightly below average in parts of central and northern Illinois and above average in southern Illinois. Soil
Great Lakes Update. Volume 199: 2017 Annual Summary. Background
 Great Lakes Update Volume 199: 2017 Annual Summary Background The U.S. Army Corps of Engineers (USACE) tracks and forecasts the water levels of each of the Great Lakes. This report is primarily focused
STATISTICAL ESTIMATION AND RE- ANALYSIS OF PRECIPITATIONS OVER FRENCH MOUNTAIN RANGES
 STATISTICAL ESTIMATION AND RE- ANALYSIS OF PRECIPITATIONS OVER FRENCH MOUNTAIN RANGES USING WEATHER PATTERNS, WATER BALANCES AND SNOW MEASUREMENTS ASSIMILATION Frederic GOTTARDI EDF frederic.gottardi@edf.fr
Hillslope Hydrology Q 1 Q Understand hillslope runoff processes. 2. Understand the contribution of groundwater to storm runoff.
 Objectives Hillslope Hydrology Streams are the conduits of the surface and subsurface runoff generated in watersheds. SW-GW interaction needs to be understood from the watershed perspective. During a storm
September 2018 Weather Summary West Central Research and Outreach Center Morris, MN
 September 2018 Weather Summary The mean temperature for September was 60.6 F, which is 1.5 F above the average of 59.1 F (1886-2017). The high temperature for the month was 94 F on September 16 th. The
Presentation Overview. Southwestern Climate: Past, present and future. Global Energy Balance. What is climate?
 Southwestern Climate: Past, present and future Mike Crimmins Climate Science Extension Specialist Dept. of Soil, Water, & Env. Science & Arizona Cooperative Extension The University of Arizona Presentation
Sierra Nevada Hydroclimatology: An Experimental Prediction of Maximum Daily Snowmelt Discharge in 2005
 Sierra Nevada Hydroclimatology: An Experimental Prediction of Maximum Daily Snowmelt Discharge in 2005 David Peterson, Jessica Lundquist, Iris Stewart, Noah Knowles, Madeline Solomon and Stephen Hager
Operational Perspectives on Hydrologic Model Data Assimilation
 Operational Perspectives on Hydrologic Model Data Assimilation Rob Hartman Hydrologist in Charge NOAA / National Weather Service California-Nevada River Forecast Center Sacramento, CA USA Outline Operational
PH YSIC A L PROPERT IE S TERC.UCDAVIS.EDU
 PH YSIC A L PROPERT IE S 8 Lake surface level Daily since 1900 Lake surface level varies throughout the year. Lake level rises due to high stream inflow, groundwater inflow and precipitation directly onto
Illinois Drought Update, December 1, 2005 DROUGHT RESPONSE TASK FORCE Illinois State Water Survey, Department of Natural Resources
 Illinois Drought Update, December 1, 2005 DROUGHT RESPONSE TASK FORCE Illinois State Water Survey, Department of Natural Resources For more drought information please go to http://www.sws.uiuc.edu/. SUMMARY.
Flood Forecasting Tools for Ungauged Streams in Alberta: Status and Lessons from the Flood of 2013
 Flood Forecasting Tools for Ungauged Streams in Alberta: Status and Lessons from the Flood of 2013 John Pomeroy, Xing Fang, Kevin Shook, Tom Brown Centre for Hydrology, University of Saskatchewan, Saskatoon
ASO in Colorado: supporting resilient water management through research support & emerging partnerships
 ASO in Colorado: supporting resilient water management through research support & emerging partnerships Jeffrey S. Deems Airborne Snow Observatory Western Water Assessment National Snow and Ice Data Center
November 2018 Weather Summary West Central Research and Outreach Center Morris, MN
 November 2018 Weather Summary Lower than normal temperatures occurred for the second month. The mean temperature for November was 22.7 F, which is 7.2 F below the average of 29.9 F (1886-2017). This November
TABLE OF CONTENTS. 3.1 Synoptic Patterns Precipitation and Topography Precipitation Regionalization... 11
 TABLE OF CONTENTS ABSTRACT... iii 1 INTRODUCTION... 1 2 DATA SOURCES AND METHODS... 2 2.1 Data Sources... 2 2.2 Frequency Analysis... 2 2.2.1 Precipitation... 2 2.2.2 Streamflow... 2 2.3 Calculation of
NIDIS Drought and Water Assessment
 NIDIS Drought and Water Assessment PRECIPITATION The images above use daily precipitation statistics from NWS COOP, CoCoRaHS, and CoAgMet stations. From top to bottom, and left to right: most recent 7-days
Let s Talk Climate! Nolan Doesken Colorado Climate Center Colorado State University. Yampatika Seminar February 16, 2011 Steamboat Springs, Colorado
 Let s Talk Climate! Nolan Doesken Colorado Climate Center Colorado State University Yampatika Seminar February 16, 2011 Steamboat Springs, Colorado First -- A short background In 1973 the federal government
Water Supply Conditions and Outlook October 1, 2018
 Water Supply Conditions and Outlook October 1, 2018 Flow Forecasting & Operations Planning Water Security Agency Overview Water supply conditions across Saskatchewan remain near normal, with most reservoirs
Operational Hydrologic Ensemble Forecasting. Rob Hartman Hydrologist in Charge NWS / California-Nevada River Forecast Center
 Operational Hydrologic Ensemble Forecasting Rob Hartman Hydrologist in Charge NWS / California-Nevada River Forecast Center Mission of NWS Hydrologic Services Program Provide river and flood forecasts
1. The map below shows a meandering river. A A' is the location of a cross section. The arrows show the direction of the river flow.
 1. The map below shows a meandering river. A A' is the location of a cross section. The arrows show the direction of the river flow. Which cross section best represents the shape of the river bottom at
HyMet Company. Streamflow and Energy Generation Forecasting Model Columbia River Basin
 HyMet Company Streamflow and Energy Generation Forecasting Model Columbia River Basin HyMet Inc. Courthouse Square 19001 Vashon Hwy SW Suite 201 Vashon Island, WA 98070 Phone: 206-463-1610 Columbia River
RR#5 - Free Response
 Base your answers to questions 1 through 3 on the data table below and on your knowledge of Earth Science. The table shows the area, in million square kilometers, of the Arctic Ocean covered by ice from
Great Lakes Update. Volume 193: 2015 January through June Summary. Vol. 193 Great Lakes Update August 2015
 Great Lakes Update Volume 193: 2015 January through June Summary The U.S. Army Corps of Engineers (USACE) monitors the water levels of each of the Great Lakes. This report provides a summary of the Great
Real Time Snow Water Equivalent (SWE) Simulation March 29, 2015 Sierra Nevada Mountains, California
 Simulation March 29, 2015 Sierra Nevada Mountains, California") Real Time Snow Water Equivalent (SWE) Simulation March 29, 2015 Sierra Nevada Mountains, California Introduction We have developed a real-time SWE estimation scheme based on historical SWE reconstructions
Real Time Snow Water Equivalent (SWE) Simulation March 29, 2015 Sierra Nevada Mountains, California Introduction We have developed a real-time SWE estimation scheme based on historical SWE reconstructions
Effects of forest cover and environmental variables on snow accumulation and melt
 Effects of forest cover and environmental variables on snow accumulation and melt Mariana Dobre, William J. Elliot, Joan Q. Wu, Timothy E. Link, Ina S. Miller Abstract The goal of this study was to assess
P. Marsh and J. Pomeroy National Hydrology Research Institute 11 Innovation Blvd., Saskatoon, Sask. S7N 3H5
 WATER AND ENERGY FLUXES DURING THE SNOWMELT PERIOD AT AN ARCTIC TREELINE SITE P. Marsh and J. Pomeroy National Hydrology Research Institute 11 Innovation Blvd., Saskatoon, Sask. S7N 3H5 marshp@nhrisv.nhrc.skdoe.ca
Mapping the extent of temperature-sensitive snowcover and the relative frequency of warm winters in the western US
 Mapping the extent of temperature-sensitive snowcover and the relative frequency of warm winters in the western US Anne Nolin Department of Geosciences Oregon State University Acknowledgements Chris Daly,
Flooding in Western North Carolina: Some Spatial, Hydrologic, and Seasonal Characteristics CAUTION!! Outline. Basic Flood Facts.
 Flooding in Western North Carolina: Some Spatial, Hydrologic, and Seasonal Characteristics J. Greg Dobson CAUTION!! National Environmental Modeling and Analysis Center RENCI at UNC-Asheville Engagement
APPLICATION OF AN ARCTIC BLOWING SNOW MODEL
 APPLICATION OF AN ARCTIC BLOWING SNOW MODEL J.W. Pomero l, P. ~arsh' and D.M. Gray2 -Hydrology Research Institute Saskatoon, Saskatchewan, Canada S7N 3H5 '~ivision of Hydrology, University of Saskatchewan
ESTIMATING SNOWMELT CONTRIBUTION FROM THE GANGOTRI GLACIER CATCHMENT INTO THE BHAGIRATHI RIVER, INDIA ABSTRACT INTRODUCTION
 ESTIMATING SNOWMELT CONTRIBUTION FROM THE GANGOTRI GLACIER CATCHMENT INTO THE BHAGIRATHI RIVER, INDIA Rodney M. Chai 1, Leigh A. Stearns 2, C. J. van der Veen 1 ABSTRACT The Bhagirathi River emerges from
Upper Missouri River Basin December 2017 Calendar Year Runoff Forecast December 5, 2017
 Upper Missouri River Basin December 2017 Calendar Year Runoff Forecast December 5, 2017 Calendar Year Runoff Forecast Explanation and Purpose of Forecast U.S. Army Corps of Engineers, Northwestern Division
Spatial Survey of Surface Soil Moisture in a Sub-alpine Watershed
 Spatial Survey of Surface Soil Moisture in a Sub-alpine Watershed Katherine E. Williams M.S. GISc Candidate Department of Geography, University of Denver October 7, 2010 Purpose 2 Introduction to Soil
DEVELOPMENT AND APPLICATION OF A HYDROCLIMATOLOGICAL STREAM TEMPERATURE MODEL WITHIN SWAT
 DEVELOPMENT AND APPLICATION OF A HYDROCLIMATOLOGICAL STREAM TEMPERATURE MODEL WITHIN SWAT Darren L. Ficklin 1, Yuzhou Luo 2, Iris T. Stewart 1, Edwin P. Maurer 3 1 Environmental Studies Institute, Santa
Earth systems the big idea guiding questions Chapter 1 & 2 Earth and Earth Systems review notes are in purple
 Earth systems the big idea guiding questions Chapter 1 & 2 Earth and Earth Systems review notes are in purple How can you describe Earth? What are the composition and the structure of the atmosphere? How
NATIONAL WEATHER SERVICE
 January 2016 February 9, 2016 This was a dry month across the HSA despite one large and several smaller snowfalls. Most locations ended up 1-2 inches below normal for the month. The driest locations at
Land Surface Processes and Their Impact in Weather Forecasting
 Land Surface Processes and Their Impact in Weather Forecasting Andrea Hahmann NCAR/RAL with thanks to P. Dirmeyer (COLA) and R. Koster (NASA/GSFC) Forecasters Conference Summer 2005 Andrea Hahmann ATEC
Investigation IV: Seasonal Precipitation and Seasonal Surface Runoff in the US
 Investigation IV: Seasonal Precipitation and Seasonal Surface Runoff in the US Purpose Students will consider the seasonality of precipitation and surface runoff and think about how the time of year can
NIDIS Intermountain West Drought Early Warning System April 18, 2017
 1 of 11 4/18/2017 3:42 PM Precipitation NIDIS Intermountain West Drought Early Warning System April 18, 2017 The images above use daily precipitation statistics from NWS COOP, CoCoRaHS, and CoAgMet stations.
Sierra Weather and Climate Update
 Sierra Weather and Climate Update 2014-15 Kelly Redmond Western Regional Climate Center Desert Research Institute Reno Nevada Yosemite Hydroclimate Workshop Yosemite Valley, 2015 October 8-9 Percent of
Upper Missouri River Basin February 2018 Calendar Year Runoff Forecast February 6, 2018
 Upper Missouri River Basin February 2018 Calendar Year Runoff Forecast February 6, 2018 Calendar Year Runoff Forecast Explanation and Purpose of Forecast U.S. Army Corps of Engineers, Northwestern Division
NIDIS Intermountain West Drought Early Warning System May 23, 2017
 NIDIS Drought and Water Assessment NIDIS Intermountain West Drought Early Warning System May 23, 2017 Precipitation The images above use daily precipitation statistics from NWS COOP, CoCoRaHS, and CoAgMet
Looking for Recent Climatic Trends and Patterns in California s Central Sierra
 Looking for Recent Climatic Trends and Patterns in California s Central Sierra Looking for Recent Climatic Trends and Patterns in California s Central Sierra Gary J. Freeman Introduction Pacific Gas &
Earth Science Physical Setting Relationship Review Sketch all graphs in pencil For a uniform material. Density. Average Temperature
 except water Water For a uniform material Volume For a uniform material Volume (cm3) 0 4 10 Volume (cm3) ( C) 0 4 5 90 0 4 5 90 Distance Between Isolines Latitude ( N) Latitude ( N) Number of Isolines
Climate Variability and Change, and Southern California Water San Gabriel Valley Water Forum, Pomona, CA, October 2, 2014
 Climate Variability and Change, and Southern California Water San Gabriel Valley Water Forum, Pomona, CA, October 2, 2014 Dan Cayan (with Mike Dettinger, David Pierce, Suraj Polade, Mary Tyree, Alexander
PHYSICAL PROPERTIES TAHOE.UCDAVIS.EDU 8
 PHYSICAL PROPERTIES 8 Lake surface level Daily since 1900 Lake surface level varies throughout the year. Lake level rises due to high stream inflow, groundwater inflow, and precipitation directly onto
3/3/2013. The hydro cycle water returns from the sea. All "toilet to tap." Introduction to Environmental Geology, 5e
 Introduction to Environmental Geology, 5e Running Water: summary in haiku form Edward A. Keller Chapter 9 Rivers and Flooding Lecture Presentation prepared by X. Mara Chen, Salisbury University The hydro
Missouri River Flood Task Force River Management Working Group Improving Accuracy of Runoff Forecasts
 Missouri River Flood Task Force River Management Working Group Improving Accuracy of Runoff Forecasts Kevin Grode, P.E. Reservoir Regulation Team Lead Missouri River Basin Water Management Northwestern
Current Water Conditions in Massachusetts January 11, 2008
 Current Water Conditions in Massachusetts January 11, 2008 December precipitation was above normal December streamflows were below normal and normal December ground-water levels were below normal and normal
Forest Hydrology: Lect. 9. Contents. Runoff, soil water and infiltration
 Forest Hydrology: Lect. 9 Contents Runoff, soil water and infiltration Learning objectives:. - Hillslope runoff generation processes; - Dynamics of runoff generation processes; - Hortonian and Dunnian
NIDIS Intermountain West Drought Early Warning System February 12, 2019
 NIDIS Intermountain West Drought Early Warning System February 12, 2019 Precipitation The images above use daily precipitation statistics from NWS COOP, CoCoRaHS, and CoAgMet stations. From top to bottom,
Lecture 8: Snow Hydrology
 GEOG415 Lecture 8: Snow Hydrology 8-1 Snow as water resource Snowfall on the mountain ranges is an important source of water in rivers. monthly pcp (mm) 100 50 0 Calgary L. Louise 1 2 3 4 5 6 7 8 9 10
Laboratory Exercise #3 The Hydrologic Cycle and Running Water Processes
 Laboratory Exercise #3 The Hydrologic Cycle and Running Water Processes page - 1 Section A - The Hydrologic Cycle Figure 1 illustrates the hydrologic cycle which quantifies how water is cycled throughout
YACT (Yet Another Climate Tool)? The SPI Explorer
? The SPI Explorer") YACT (Yet Another Climate Tool)? The SPI Explorer Mike Crimmins Assoc. Professor/Extension Specialist Dept. of Soil, Water, & Environmental Science The University of Arizona Yes, another climate tool for
YACT (Yet Another Climate Tool)? The SPI Explorer Mike Crimmins Assoc. Professor/Extension Specialist Dept. of Soil, Water, & Environmental Science The University of Arizona Yes, another climate tool for
Which map shows the stream drainage pattern that most likely formed on the surface of this volcano? A) B)
 B)") 1. When snow cover on the land melts, the water will most likely become surface runoff if the land surface is A) frozen B) porous C) grass covered D) unconsolidated gravel Base your answers to questions
1. When snow cover on the land melts, the water will most likely become surface runoff if the land surface is A) frozen B) porous C) grass covered D) unconsolidated gravel Base your answers to questions
Real Time (RT) Snow Water Equivalent (SWE) Simulation May 11, 2014 Sierra Nevada Mountains, California
 Snow Water Equivalent (SWE) Simulation May 11, 2014 Sierra Nevada Mountains, California") Real Time (RT) Snow Water Equivalent (SWE) Simulation May 11, 2014 Sierra Nevada Mountains, California Abstract On May 11 th, percent of average SWE values for this date have shown an increase (see note
Real Time (RT) Snow Water Equivalent (SWE) Simulation May 11, 2014 Sierra Nevada Mountains, California Abstract On May 11 th, percent of average SWE values for this date have shown an increase (see note
Meteorology. Circle the letter that corresponds to the correct answer
 Chapter 3 Worksheet 1 Meteorology Name: Circle the letter that corresponds to the correct answer 1) If the maximum temperature for a particular day is 26 C and the minimum temperature is 14 C, the daily
Unit 3 Review - Surface Processes
 Unit 3 Review - Surface Processes 1. Why is the surface of Mercury covered with meteor impact craters, while Earth s surface has relatively few craters? A) Mercury is larger than Earth, so it gets hit
UK Flooding Feb 2003
 UK Flooding 2000 06 Feb 2003 Britain has taken a battering from floods in the last 5 years, with major events in 1998 and 2000, significant floods in 2001 and minor events in each of the other years. So
REDWOOD VALLEY SUBAREA
 Independent Science Review Panel Conceptual Model of Watershed Hydrology, Surface Water and Groundwater Interactions and Stream Ecology for the Russian River Watershed Appendices A-1 APPENDIX A A-2 REDWOOD
Chapter 2. Regional Landscapes and the Hydrologic Cycle
 Chapter 2. Regional Landscapes and the Hydrologic Cycle W. Lee Daniels Department of Crop and Soil Environmental Sciences, Virginia Tech Table of Contents Introduction... 23 Soils and landscapes of the
Of droughts and flooding rains cyanobacterial presence in NSW over the past 5 summers. BGA in NSW Lee Bowling EEP Branch 23 rd August 2012
 Of droughts and flooding rains cyanobacterial presence in NSW over the past 5 summers BGA in NSW Lee Bowling EEP Branch 23 rd August 212 Introduction Past 5 summers with extremes in weather conditions
2015 Fall Conditions Report
 2015 Fall Conditions Report Prepared by: Hydrologic Forecast Centre Date: December 21 st, 2015 Table of Contents Table of Figures... ii EXECUTIVE SUMMARY... 1 BACKGROUND... 2 SUMMER AND FALL PRECIPITATION...
Weather: Air Patterns
 Weather: Air Patterns Weather: Air Patterns Weather results from global patterns in the atmosphere interacting with local conditions. You have probably experienced seasonal shifts, such as winter in New
Average Weather For Coeur d'alene, Idaho, USA
 Average Weather For Coeur d'alene, Idaho, USA Information courtesy of weatherspark.com Location This report describes the typical weather at the Coeur d'alene Air Terminal (Coeur d'alene, Idaho, United
Unit 4: Landscapes Practice Problems
 Name: Date: 1. Soil with the greatest porosity has particles that are A. poorly sorted and densely packed B. poorly sorted and loosely packed C. well sorted and densely packed D. well sorted and loosely
Hydrology and Hydraulics Design Report. Background Summary
 To: National Park Services Montezuma Castle National Monument Richard Goepfrich, Facility Manager From: Multicultural Technical Engineers Date: Tuesday - February 13, 2018 Subject: 30% Hydrology and Hydraulics
Becky Bolinger Water Availability Task Force November 13, 2018
 Colorado Climate Center WATF Climate Update Becky Bolinger Water Availability Task Force November 13, 2018 COLORADO CLIMATE CENTER Water Year 2018 Colorado s Climate in Review COLORADO CLIMATE CENTER
Midwest and Great Plains Drought and Climate Summary 20 February 2014
 Midwest and Great Plains Drought and Climate Summary 20 February 2014 Wendy Ryan Assistant State Climatologist Colorado Climate Center Colorado State University wendy.ryan@colostate.edu 970-491-8506 General