Suppression of colonies of Reticulitermes spp. using the Sentricon termite colony elimination system: : A case study in Chatsworth, CA
|
|
|
- Hester Phelps
- 5 years ago
- Views:
Transcription

1 Suppression of colonies of Reticulitermes spp. using the Sentricon termite colony elimination system: : A case study in Chatsworth, CA Gail M. Getty, MS, Chris Solek, MS, Ron 1 1 Sbragia, Ph.D., Michael I. Haverty, Ph.D. 2 3, Vernard R. Lewis, Ph.D University of California, Berkeley, CA 2. Dow AgroSciences, Indianapolis, IN 3. Pacific Southwest Research Station-Forest Service, Albany, CA

2 NORTH Residential condominiums - Incorporated Feb 1969 Ten Construction phases acre property structures residential units - over 2600 people 1.5 million sq. ft. under roof 11.3 miles of perimeter linear feet
3 Commercial installation Sentricon in-ground (few above ground) Installation October-December structures initially installed stations Prolinx database maintained - Dolphin scanner Switch to ESP in September 2002
4 Data Collection and Management One technician responsible for site inspections Stations baited with active ingredient once termites observed Monthly service tickets and Prolinx summaries Manage data as GIS project
5
6 WITHIN ONE YEAR OF INSTALL Total no. buildings w/stations 134 Total no. buildings with active termites in stations 130 (95%)
7 WITHIN ONE YEAR OF INSTALL Total no. stations installed 7327 Total no. auxillaries installed 418
8 WITHIN ONE YEAR OF INSTALL Total no. stations with termites present/baited 878 (12%) Mean/median days to station first active 153/105 days
9 WITHIN ONE YEAR OF INSTALL No. Successfully Baited 727 (83%) No. Multiple Baitings (re-hits) 120 (14%) No. of Abandonments 53 (6%) Mean/Median Days to Elimination 127/102 days
10 Percent of buildings hit Building Hit Progression at the RockPointe Condominium Complex % Of buildings hit/month Cumulative % of buildings hit Months follow ing com pletion of install
11 RockPointe-New Active Stations/Month Apr-02 May-02 Jun-02 Jul-02 Aug-02 Sep-02 Oct-02 Nov-02 Dec-02 Jan-03 Feb-03 Mar-03 Apr-03 May-03 Jun-03 Jul-03 Aug-03 Sep-03 Oct-03 Nov-03 Dec-03 Jan-04 Feb-04 Mar-04 Apr-04 May-04 Jun-04 Jul-04 Aug-04 Month/Year Jan-02 Feb-02 Mar-02 # of Active Sttions

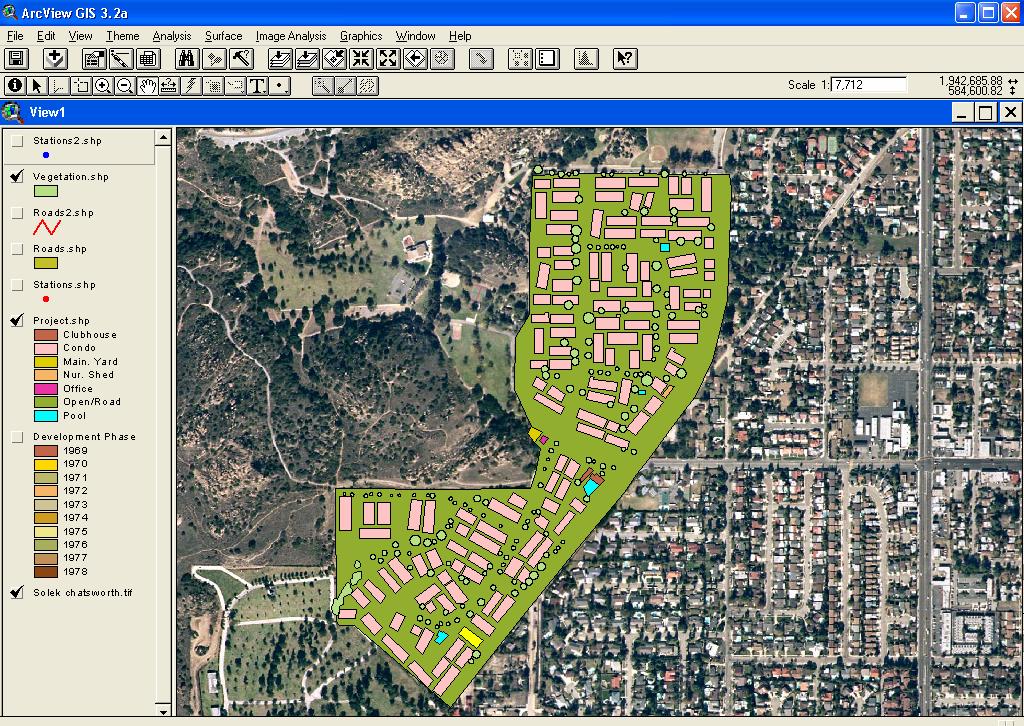
12 RockPointe Condominium Complex Chatsworth, CA Bldg. not recorded in database North Figure 1. Site overview following completion of install in December 2001
13 RockPointe Condominium Complex Chatsworth, CA Bldg. not recorded in database New hit Prior hit North Figure 3. Location of Buildings hit in January 2002
14 RockPointe Condominium Complex Chatsworth, CA Bldg. not recorded in database New hit Prior hit North Figure 3. Location of Buildings hit in January 2002
15 RockPointe Condominium Complex Chatsworth, CA Bldg. not recorded in database New hit Prior hit North Figure 4. Location of Buildings hit in February 2002
16 RockPointe Condominium Complex Chatsworth, CA Bldg. not recorded in database New hit Prior hit North Figure 5. Location of Buildings hit in March 2002
17 RockPointe Condominium Complex Chatsworth, CA Bldg. not recorded in database New hit Prior hit North Figure 6. Location of Buildings hit in April 2002
18 RockPointe Condominium Complex Chatsworth, CA Bldg. not recorded in database New hit Prior hit North Figure 7. Location of Buildings hit in May 2002
19 RockPointe Condominium Complex Chatsworth, CA Bldg. not recorded in database New hit Prior hit North Figure 8. Location of Buildings hit in June 2002
20 RockPointe Condominium Complex Chatsworth, CA Bldg. not recorded in database New hit Prior hit North Figure 9. Location of Buildings hit in July 2002
21 RockPointe Condominium Complex Chatsworth, CA Bldg. not recorded in database New hit Prior hit North Figure 10. Location of Buildings hit in October 2002
22 RockPointe Condominium Complex Chatsworth, CA Bldg. not recorded in database New hit Prior hit North Figure 11. Location of Buildings hit in April 2003
23 RockPointe Condominium Complex Chatsworth, CA Building recorded as hit but no hit date recorded Bldg. not recorded in database New hit Prior hit North Figure 12. Location of Buildings hit in August 2003
24 May-03 Jun-03 Jul-03 Aug-03 Sep-03 Oct-03 Nov-03 Dec-03 Jan-04 Feb-04 Mar-04 Apr-04 May RockPointe-New Hits/Month Apr-02 May-02 Jun-02 Jul-02 Aug-02 Sep-02 Oct-02 Nov-02 Dec-02 Jan-03 Feb-03 Mar-03 Apr-03 Month/Year Jan-02 Feb-02 Mar-02 Number of Stations Hit
25 As of May 2004 Auxillaries 888 Primary Stations active for a 12% rate 54 of 423 auxillary stations active for a 13% rate
26 Homeowner Termite Complaints Before Baiting Average of complaints per month Post Baiting Complaints mid 2003 only calls per month Current calls average less than 1 per month Alate flights are down considerably to date
27 Thank you Questions can be directed to
WHEN IS IT EVER GOING TO RAIN? Table of Average Annual Rainfall and Rainfall For Selected Arizona Cities
 WHEN IS IT EVER GOING TO RAIN? Table of Average Annual Rainfall and 2001-2002 Rainfall For Selected Arizona Cities Phoenix Tucson Flagstaff Avg. 2001-2002 Avg. 2001-2002 Avg. 2001-2002 October 0.7 0.0
GAMINGRE 8/1/ of 7
 FYE 09/30/92 JULY 92 0.00 254,550.00 0.00 0 0 0 0 0 0 0 0 0 254,550.00 0.00 0.00 0.00 0.00 254,550.00 AUG 10,616,710.31 5,299.95 845,656.83 84,565.68 61,084.86 23,480.82 339,734.73 135,893.89 67,946.95
Jackson County 2013 Weather Data
 Jackson County 2013 Weather Data 61 Years of Weather Data Recorded at the UF/IFAS Marianna North Florida Research and Education Center Doug Mayo Jackson County Extension Director 1952-2008 Rainfall Data
P7.7 A CLIMATOLOGICAL STUDY OF CLOUD TO GROUND LIGHTNING STRIKES IN THE VICINITY OF KENNEDY SPACE CENTER, FLORIDA
 P7.7 A CLIMATOLOGICAL STUDY OF CLOUD TO GROUND LIGHTNING STRIKES IN THE VICINITY OF KENNEDY SPACE CENTER, FLORIDA K. Lee Burns* Raytheon, Huntsville, Alabama Ryan K. Decker NASA, Marshall Space Flight
Jackson County 2018 Weather Data 67 Years of Weather Data Recorded at the UF/IFAS Marianna North Florida Research and Education Center
 Jackson County 2018 Weather Data 67 Years of Weather Data Recorded at the UF/IFAS Marianna North Florida Research and Education Center Doug Mayo Jackson County Extension Director 1952-2008 Rainfall Data
DAILY QUESTIONS 28 TH JUNE 18 REASONING - CALENDAR
 DAILY QUESTIONS 28 TH JUNE 18 REASONING - CALENDAR LEAP AND NON-LEAP YEAR *A non-leap year has 365 days whereas a leap year has 366 days. (as February has 29 days). *Every year which is divisible by 4
TABLE -I RAINFALL RECORDED AT PORT BLAIR (MM) FROM 1949 TO 2009
 FROM 1949 TO 2009") A. RAINFALL TABLE -I RAINFALL RECORDED AT PORT BLAIR (MM) FROM 1949 TO 2009 MONTH/YEAR 1949 1950 1951 1952 1953 1954 1955 1956 1957 1958 JANUARY 0.0 0.8 82.5 0.0 26.9 37.3 71.4 46.2 10.2 28.7 FEBRUARY
A. RAINFALL TABLE -I RAINFALL RECORDED AT PORT BLAIR (MM) FROM 1949 TO 2009 MONTH/YEAR 1949 1950 1951 1952 1953 1954 1955 1956 1957 1958 JANUARY 0.0 0.8 82.5 0.0 26.9 37.3 71.4 46.2 10.2 28.7 FEBRUARY
The Climate of Bryan County
 The Climate of Bryan County Bryan County is part of the Crosstimbers throughout most of the county. The extreme eastern portions of Bryan County are part of the Cypress Swamp and Forest. Average annual
ENGINE SERIAL NUMBERS
 ENGINE SERIAL NUMBERS The engine number was also the serial number of the car. Engines were numbered when they were completed, and for the most part went into a chassis within a day or so. However, some
FEB DASHBOARD FEB JAN FEB MAR APR MAY JUN JUL AUG SEP OCT NOV DEC
 Positive Response Compliance 215 Compliant 215 Non-Compliant 216 Compliant 216 Non-Compliant 1% 87% 96% 86% 96% 88% 89% 89% 88% 86% 92% 93% 94% 96% 94% 8% 6% 4% 2% 13% 4% 14% 4% 12% 11% 11% 12% JAN MAR
Jackson County 2014 Weather Data
 Jackson County 2014 Weather Data 62 Years of Weather Data Recorded at the UF/IFAS Marianna North Florida Research and Education Center Doug Mayo Jackson County Extension Director 1952-2008 Rainfall Data
Climate Change and Water Supply Research. Drought Response Workshop October 8, 2013
 Climate Change and Water Supply Research Drought Response Workshop October 8, 2013 DWR Photo Oroville Reservoir, 2009 Talk Overview Expectations History Atmospheric Rivers and Water Supply Current Research
Determine the trend for time series data
 Extra Online Questions Determine the trend for time series data Covers AS 90641 (Statistics and Modelling 3.1) Scholarship Statistics and Modelling Chapter 1 Essent ial exam notes Time series 1. The value
Location. Datum. Survey. information. Etrometa. Step Gauge. Description. relative to Herne Bay is -2.72m. The site new level.
 Tide Gauge Location OS: 616895E 169377N WGS84: Latitude: 51 o 22.919196 N Longitude: 01 o 6.9335907 E Instrument Type Etrometa Step Gauge Benchmarks Benchmark TGBM = 5.524m above Ordnance Datum Newlyn
Mountain View Community Shuttle Monthly Operations Report
 Mountain View Community Shuttle Monthly Operations Report December 6, 2018 Contents Passengers per Day, Table...- 3 - Passengers per Day, Chart...- 3 - Ridership Year-To-Date...- 4 - Average Daily Ridership
Location. Datum. Survey. information. Etrometa. Step Gauge. Description. relative to Herne Bay is -2.72m. The site new level.
 Tide Gauge Location OS: 616895E 169377N WGS84: Latitude: 51 o 22.919196 N Longitude: 01 o 6.9335907 E Instrument Type Etrometa Step Gauge Benchmarks Benchmark TGBM = 5.524m above Ordnance Datum Newlyn
Technical note on seasonal adjustment for M0
 Technical note on seasonal adjustment for M0 July 1, 2013 Contents 1 M0 2 2 Steps in the seasonal adjustment procedure 3 2.1 Pre-adjustment analysis............................... 3 2.2 Seasonal adjustment.................................
GTR # VLTs GTR/VLT/Day %Δ:
 MARYLAND CASINOS: MONTHLY REVENUES TOTAL REVENUE, GROSS TERMINAL REVENUE, WIN/UNIT/DAY, TABLE DATA, AND MARKET SHARE CENTER FOR GAMING RESEARCH, DECEMBER 2017 Executive Summary Since its 2010 casino debut,
Computing & Telecommunications Services Monthly Report January CaTS Help Desk. Wright State University (937)
") January 215 Monthly Report Computing & Telecommunications Services Monthly Report January 215 CaTS Help Desk (937) 775-4827 1-888-775-4827 25 Library Annex helpdesk@wright.edu www.wright.edu/cats/ Last
January 215 Monthly Report Computing & Telecommunications Services Monthly Report January 215 CaTS Help Desk (937) 775-4827 1-888-775-4827 25 Library Annex helpdesk@wright.edu www.wright.edu/cats/ Last
Changing Hydrology under a Changing Climate for a Coastal Plain Watershed
 Changing Hydrology under a Changing Climate for a Coastal Plain Watershed David Bosch USDA-ARS, Tifton, GA Jeff Arnold ARS Temple, TX and Peter Allen Baylor University, TX SEWRU Objectives 1. Project changes
Computing & Telecommunications Services
 Computing & Telecommunications Services Monthly Report September 214 CaTS Help Desk (937) 775-4827 1-888-775-4827 25 Library Annex helpdesk@wright.edu www.wright.edu/cats/ Table of Contents HEAT Ticket
Scarborough Tide Gauge
 Tide Gauge Location OS: 504898E 488622N WGS84: Latitude: 54 16' 56.990"N Longitude: 00 23' 25.0279"W Instrument Valeport 740 (Druck Pressure Transducer) Benchmarks Benchmark Description TGBM = 4.18m above
Long-term Water Quality Monitoring in Estero Bay
 Long-term Water Quality Monitoring in Estero Bay Keith Kibbey Laboratory Director Lee County Environmental Laboratory Division of Natural Resource Management Estero Bay Monitoring Programs Three significant
The Climate of Kiowa County
 The Climate of Kiowa County Kiowa County is part of the Central Great Plains, encompassing some of the best agricultural land in Oklahoma. Average annual precipitation ranges from about 24 inches in northwestern
Sierra Weather and Climate Update
 Sierra Weather and Climate Update 2014-15 Kelly Redmond Western Regional Climate Center Desert Research Institute Reno Nevada Yosemite Hydroclimate Workshop Yosemite Valley, 2015 October 8-9 Percent of
The Climate of Payne County
 The Climate of Payne County Payne County is part of the Central Great Plains in the west, encompassing some of the best agricultural land in Oklahoma. Payne County is also part of the Crosstimbers in the
Chiang Rai Province CC Threat overview AAS1109 Mekong ARCC
 Chiang Rai Province CC Threat overview AAS1109 Mekong ARCC This threat overview relies on projections of future climate change in the Mekong Basin for the period 2045-2069 compared to a baseline of 1980-2005.
2019 Settlement Calendar for ASX Cash Market Products. ASX Settlement
 2019 Settlement Calendar for ASX Cash Market Products ASX Settlement Settlement Calendar for ASX Cash Market Products 1 ASX Settlement Pty Limited (ASX Settlement) operates a trade date plus two Business
The Climate of Marshall County
 The Climate of Marshall County Marshall County is part of the Crosstimbers. This region is a transition region from the Central Great Plains to the more irregular terrain of southeastern Oklahoma. Average
The Climate of Texas County
 The Climate of Texas County Texas County is part of the Western High Plains in the north and west and the Southwestern Tablelands in the east. The Western High Plains are characterized by abundant cropland
Wind Resource Data Summary Cotal Area, Guam Data Summary and Transmittal for December 2011
 Wind Resource Data Summary Cotal Area, Guam Data Summary and Transmittal for December 2011 Prepared for: GHD Inc. 194 Hernan Cortez Avenue 2nd Floor, Ste. 203 Hagatna, Guam 96910 January 2012 DNV Renewables
The Climate of Grady County
 The Climate of Grady County Grady County is part of the Central Great Plains, encompassing some of the best agricultural land in Oklahoma. Average annual precipitation ranges from about 33 inches in northern
Salem Economic Outlook
 Salem Economic Outlook November 2012 Tim Duy, PHD Prepared for the Salem City Council November 7, 2012 Roadmap US Economic Update Slow and steady Positives: Housing/monetary policy Negatives: Rest of world/fiscal
Life Cycle of Convective Systems over Western Colombia
 Life Cycle of Convective Systems over Western Colombia Meiry Sakamoto Uiversidade de São Paulo, São Paulo, Brazil Colombia Life Cycle of Convective Systems over Western Colombia Convective System (CS)
Calculations Equation of Time. EQUATION OF TIME = apparent solar time - mean solar time
 Calculations Equation of Time APPARENT SOLAR TIME is the time that is shown on sundials. A MEAN SOLAR DAY is a constant 24 hours every day of the year. Apparent solar days are measured from noon one day
The Climate of Pontotoc County
 The Climate of Pontotoc County Pontotoc County is part of the Crosstimbers. This region is a transition region from the Central Great Plains to the more irregular terrain of southeast Oklahoma. Average
Drought Characterization. Examination of Extreme Precipitation Events
 Drought Characterization Examination of Extreme Precipitation Events Extreme Precipitation Events During the Drought For the drought years (1999-2005) daily precipitation data was analyzed to find extreme
Pre-Calc Chapter 1 Sample Test. D) slope: 3 4
 slope: 3 4") Pre-Calc Chapter 1 Sample Test 1. Use the graphs of f and g to evaluate the function. f( x) gx ( ) (f o g)(-0.5) 1 1 0 4. Plot the points and find the slope of the line passing through the pair of points.
Pre-Calc Chapter 1 Sample Test 1. Use the graphs of f and g to evaluate the function. f( x) gx ( ) (f o g)(-0.5) 1 1 0 4. Plot the points and find the slope of the line passing through the pair of points.
The Climate of Haskell County
 The Climate of Haskell County Haskell County is part of the Hardwood Forest. The Hardwood Forest is characterized by its irregular landscape and the largest lake in Oklahoma, Lake Eufaula. Average annual
Monthly Long Range Weather Commentary Issued: February 15, 2015 Steven A. Root, CCM, President/CEO
 Monthly Long Range Weather Commentary Issued: February 15, 2015 Steven A. Root, CCM, President/CEO sroot@weatherbank.com JANUARY 2015 Climate Highlights The Month in Review During January, the average
The Climate of Seminole County
 The Climate of Seminole County Seminole County is part of the Crosstimbers. This region is a transition region from the Central Great Plains to the more irregular terrain of southeastern Oklahoma. Average
2018 Annual Review of Availability Assessment Hours
 2018 Annual Review of Availability Assessment Hours Amber Motley Manager, Short Term Forecasting Clyde Loutan Principal, Renewable Energy Integration Karl Meeusen Senior Advisor, Infrastructure & Regulatory
The Climate of Murray County
 The Climate of Murray County Murray County is part of the Crosstimbers. This region is a transition between prairies and the mountains of southeastern Oklahoma. Average annual precipitation ranges from
Drought in Southeast Colorado
 Drought in Southeast Colorado Nolan Doesken and Roger Pielke, Sr. Colorado Climate Center Prepared by Tara Green and Odie Bliss http://climate.atmos.colostate.edu 1 Historical Perspective on Drought Tourism
IN-NETWORK CHLORINE RESIDUAL MANAGEMENT
 IN-NETWORK CHLORINE RESIDUAL MANAGEMENT Using GIS to assess flush point efficacy Ian Toohey, P.E. Systems Planning Austin Water TABLE OF CONTENTS 1. Background 3. Surface Creation 2. Residual Sampling
CHAPTER-11 CLIMATE AND RAINFALL
 CHAPTER-11 CLIMATE AND RAINFALL 2.1 Climate Climate in a narrow sense is usually defined as the "average weather", or more rigorously, as the statistical description in terms of the mean and variability
Jackson County 2019 Weather Data 68 Years of Weather Data Recorded at the UF/IFAS Marianna North Florida Research and Education Center
 Jackson County 2019 Weather Data 68 Years of Weather Data Recorded at the UF/IFAS Marianna North Florida Research and Education Center Doug Mayo Jackson County Extension Director 1952-2008 Rainfall Data
ISO Lead Auditor Lean Six Sigma PMP Business Process Improvement Enterprise Risk Management IT Sales Training
 Training Calendar 2014 Public s (ISO LSS PMP BPI ERM IT Sales Training) www.excelledia.com (ISO, LSS, PMP, BPI, ERM, IT, Sales Public s) 1 Schedule Registration JANUARY FEBRUARY 2 days 26 JAN 27 JAN 3
Multivariate Regression Model Results
 Updated: August, 0 Page of Multivariate Regression Model Results 4 5 6 7 8 This exhibit provides the results of the load model forecast discussed in Schedule. Included is the forecast of short term system
Public Library Use and Economic Hard Times: Analysis of Recent Data
 Public Library Use and Economic Hard Times: Analysis of Recent Data A Report Prepared for The American Library Association by The Library Research Center University of Illinois at Urbana Champaign April
Champaign-Urbana 2001 Annual Weather Summary
 Champaign-Urbana 2001 Annual Weather Summary ILLINOIS STATE WATER SURVEY 2204 Griffith Dr. Champaign, IL 61820 wxobsrvr@sws.uiuc.edu Maria Peters, Weather Observer January: After a cold and snowy December,
Monthly Long Range Weather Commentary Issued: APRIL 1, 2015 Steven A. Root, CCM, President/CEO
 Monthly Long Range Weather Commentary Issued: APRIL 1, 2015 Steven A. Root, CCM, President/CEO sroot@weatherbank.com FEBRUARY 2015 Climate Highlights The Month in Review The February contiguous U.S. temperature
SYSTEM BRIEF DAILY SUMMARY
 SYSTEM BRIEF DAILY SUMMARY * ANNUAL MaxTemp NEL (MWH) Hr Ending Hr Ending LOAD (PEAK HOURS 7:00 AM TO 10:00 PM MON-SAT) ENERGY (MWH) INCREMENTAL COST DAY DATE Civic TOTAL MAXIMUM @Max MINIMUM @Min FACTOR
Variability and trends in daily minimum and maximum temperatures and in diurnal temperature range in Lithuania, Latvia and Estonia
 Variability and trends in daily minimum and maximum temperatures and in diurnal temperature range in Lithuania, Latvia and Estonia Jaak Jaagus Dept. of Geography, University of Tartu Agrita Briede Dept.
Clark Regional Wastewater District
 2016 Clark Regional Wastewater District Infiltration and Inflow Report For Salmon Creek Treatment Plant February 13, 2017 In Compliance with the NPDES Waste Discharge Permit No. WA-002363-9 Special Condition
Monthly Magnetic Bulletin
 BRITISH GEOLOGICAL SURVEY Ascension Island Observatory Monthly Magnetic Bulletin December 2008 08/12/AS Crown copyright; Ordnance Survey ASCENSION ISLAND OBSERVATORY MAGNETIC DATA 1. Introduction Ascension
REDWOOD VALLEY SUBAREA
 Independent Science Review Panel Conceptual Model of Watershed Hydrology, Surface Water and Groundwater Interactions and Stream Ecology for the Russian River Watershed Appendices A-1 APPENDIX A A-2 REDWOOD
Effective Gross Revenue 3,335,005 3,130,591 3,320,552 3,338,276 3,467,475 3,606,962 3,509,653 3,981,103 3,984,065 4,147,197 4,300,790
 Schedule Of Prospective Cash Flow In Inflated Dollars for the Fiscal Year Beginning 1/1/2011 Potential Gross Revenue Base Rental Revenue $3,331,625 $3,318,220 $3,275,648 $3,270,394 $3,368,740 $3,482,312
Practice Test Chapter 8 Sinusoidal Functions
 FOM 12 Practice Test Chapter 8 Sinusoidal Functions Name: Multiple Choice Identify the choice that best completes the statement or answers the question. Block: _ 1. Convert 120 into radians. A. 2" 3 B.
Line Graphs. 1. Use the data in the table to make a line graph. 2. When did the amount spent on electronics increase the most?
 Practice A Line Graphs Use the table to answer the questions. U.S. Personal Spending on Selected Electronics Amount Spent Year ($billions, estimated) 1994 $71 1996 $80 1998 $90 2000 $107 1. Use the data
ISO Lead Auditor Lean Six Sigma PMP Business Process Improvement Enterprise Risk Management IT Sales Training
 Training Calendar 2014 Public s (ISO LSS PMP BPI ERM IT Sales Training) (ISO, LSS, PMP, BPI, ERM, IT, Sales Public s) 1 Schedule Registration JANUARY ) FEBRUARY 2 days 26 JAN 27 JAN 3 days 28 JAN 30 JAN
Butte County Drought Task Force December 1, :00 AM noon 202 Mira Loma Drive, Tahoe Room Oroville, CA. Agenda
 WATER AND RESOURCE CONSERVATION 308 Nelson Avenue, Oroville, CA 95965 Telephone: (530) 538-4343 Fax: (530) 538-3807 www.buttecounty.net/waterandresource bcwater@buttecounty.net Paul Gosselin, Director
YACT (Yet Another Climate Tool)? The SPI Explorer
? The SPI Explorer") YACT (Yet Another Climate Tool)? The SPI Explorer Mike Crimmins Assoc. Professor/Extension Specialist Dept. of Soil, Water, & Environmental Science The University of Arizona Yes, another climate tool for
YACT (Yet Another Climate Tool)? The SPI Explorer Mike Crimmins Assoc. Professor/Extension Specialist Dept. of Soil, Water, & Environmental Science The University of Arizona Yes, another climate tool for
HYDROLOGIC AND WATER RESOURCES EVALUATIONS FOR SG. LUI WATERSHED
 HYDROLOGIC AND WATER RESOURCES EVALUATIONS FOR SG. LUI WATERSHED 1.0 Introduction The Sg. Lui watershed is the upper part of Langat River Basin, in the state of Selangor which located approximately 20
ISO Lead Auditor Lean Six Sigma PMP Business Process Improvement Enterprise Risk Management IT Sales Training
 Training Calendar 2014 Public s (ISO LSS PMP BPI ERM IT Sales Training) (ISO, LSS, PMP, BPI, ERM, IT, Sales Public s) 1 Schedule Registration JANUARY IMS ) FEBRUARY 2 days 26 JAN 27 JAN 3 days 28 JAN 30
Published by ASX Settlement Pty Limited A.B.N Settlement Calendar for ASX Cash Market Products
 Published by Pty Limited A.B.N. 49 008 504 532 2012 Calendar for Cash Market Products Calendar for Cash Market Products¹ Pty Limited ( ) operates a trade date plus three Business (T+3) settlement discipline
PROGRESS ACCOMPLISHED THIS PERIOD
 Semi-Annual Report Period Covered: September 1, 21 through February 28, 217 Prepared By: Richard Radigan Title: Monitoring of a Constructed Oyster Reef in the St. Lucie Estuary Agency: Florida Fish & Wildlife
2017 Settlement Calendar for ASX Cash Market Products ASX SETTLEMENT
 2017 Settlement Calendar for ASX Cash Market Products ASX SETTLEMENT Settlement Calendar for ASX Cash Market Products 1 ASX Settlement Pty Limited (ASX Settlement) operates a trade date plus two Business
2003 Water Year Wrap-Up and Look Ahead
 2003 Water Year Wrap-Up and Look Ahead Nolan Doesken Colorado Climate Center Prepared by Odie Bliss http://ccc.atmos.colostate.edu Colorado Average Annual Precipitation Map South Platte Average Precipitation
Astrological Calendar. for Central Time
 2014 for Central Time January 2014 Capricorn Compliments of: Clayten Tylor Esoteric Astrologer (604)331-0251 Jan 15, 2014 Full Moon 10:53:09 PM CST Jan 1, 2014 New Moon 05:15:21 AM CST January 2014 Sun
PROJECT REPORT (ASL 720) CLOUD CLASSIFICATION
 CLOUD CLASSIFICATION") PROJECT REPORT (ASL 720) CLOUD CLASSIFICATION SUBMITTED BY- PRIYANKA GUPTA 2011CH70177 RINI KAPOOR 2011CH70179 INDIVIDUAL CONTRIBUTION- Priyanka Gupta- analysed data of region considered in India (West:80,
PROJECT REPORT (ASL 720) CLOUD CLASSIFICATION SUBMITTED BY- PRIYANKA GUPTA 2011CH70177 RINI KAPOOR 2011CH70179 INDIVIDUAL CONTRIBUTION- Priyanka Gupta- analysed data of region considered in India (West:80,
PRELIMINARY DRAFT FOR DISCUSSION PURPOSES
 Memorandum To: David Thompson From: John Haapala CC: Dan McDonald Bob Montgomery Date: February 24, 2003 File #: 1003551 Re: Lake Wenatchee Historic Water Levels, Operation Model, and Flood Operation This
National Integrated Drought Information System. Southeast US Pilot for Apalachicola- Flint-Chattahoochee River Basin 20-March-2012
 National Integrated Drought Information System Southeast US Pilot for Apalachicola- Flint-Chattahoochee River Basin 20-March-2012 Current drought status from Drought Monitor http://www.drought.unl.edu/dm/monitor.html
STATISTICAL FORECASTING and SEASONALITY (M. E. Ippolito; )
") STATISTICAL FORECASTING and SEASONALITY (M. E. Ippolito; 10-6-13) PART I OVERVIEW The following discussion expands upon exponential smoothing and seasonality as presented in Chapter 11, Forecasting, in
STATISTICAL FORECASTING and SEASONALITY (M. E. Ippolito; 10-6-13) PART I OVERVIEW The following discussion expands upon exponential smoothing and seasonality as presented in Chapter 11, Forecasting, in
July 2017 LOGISTICAL HARMONY
 Li s&staging(wpedestriansidewalkprot.) (4/18/through7/18/2017) July2017 101BelvidereEastFaçadeWorkPipeStaging (4/18/through7/18/2017) 101BelvidereEastFaçadeWork (through8/31/2017) Legend RampaccesstoTMCX
Project No India Basin Shadow Study San Francisco, California, USA
 Project No. 432301 India Basin Shadow Study San Francisco, California, USA Numerical Modelling Studies 04 th June 2018 For Build Inc. Report Title: India Basin Shadow Study San Francisco, California, USA
Memo. I. Executive Summary. II. ALERT Data Source. III. General System-Wide Reporting Summary. Date: January 26, 2009 To: From: Subject:
 Memo Date: January 26, 2009 To: From: Subject: Kevin Stewart Markus Ritsch 2010 Annual Legacy ALERT Data Analysis Summary Report I. Executive Summary The Urban Drainage and Flood Control District (District)
Climatography of the United States No
 Climate Division: CA 5 NWS Call Sign: Elevation: 6 Feet Lat: 37 Month (1) Min (2) Month(1) Extremes Lowest (2) Temperature ( F) Lowest Month(1) Degree s (1) Base Temp 65 Heating Cooling 1 Number of s (3)
Climatography of the United States No
 Climate Division: CA 4 NWS Call Sign: Elevation: 2 Feet Lat: 37 Month (1) Min (2) Month(1) Extremes Lowest (2) Temperature ( F) Lowest Month(1) Degree s (1) Base Temp 65 Heating Cooling 1 Number of s (3)
Climatography of the United States No
 Climate Division: CA 4 NWS Call Sign: Elevation: 13 Feet Lat: 36 Month (1) Min (2) Month(1) Extremes Lowest (2) Temperature ( F) Lowest Month(1) Degree s (1) Base Temp 65 Heating Cooling 1 Number of s
Climatography of the United States No
 Climate Division: CA 5 NWS Call Sign: Elevation: 1,14 Feet Lat: 36 Month (1) Min (2) Month(1) Extremes Lowest (2) Temperature ( F) Lowest Month(1) Degree s (1) Base Temp 65 Heating Cooling 1 Number of
Corn Basis Information By Tennessee Crop Reporting District
 UT EXTENSION THE UNIVERSITY OF TENNESSEE INSTITUTE OF AGRICULTURE AE 05-13 Corn Basis Information By Tennessee Crop Reporting District 1994-2003 Delton C. Gerloff, Professor The University of Tennessee
Florida Courts E-Filing Authority Board. Service Desk Report March 2019
 Florida Courts E-Filing Authority Board Service Desk Report March 219 Customer Service Incidents March 219 Status January 219 February 219 March 219 Incidents Received 3,261 3,51 3,118 Incidents Worked
Table 01A. End of Period End of Period End of Period Period Average Period Average Period Average
 SUMMARY EXCHANGE RATE DATA BANK OF ZAMBIA MID-RATES Table 01A Period K/USD K/GBP K/ZAR End of Period End of Period End of Period Period Average Period Average Period Average Monthly January 6.48 6.46 9.82
SYSTEM BRIEF DAILY SUMMARY
 SYSTEM BRIEF DAILY SUMMARY * ANNUAL MaxTemp NEL (MWH) Hr Ending Hr Ending LOAD (PEAK HOURS 7:00 AM TO 10:00 PM MON-SAT) ENERGY (MWH) INCREMENTAL COST DAY DATE Civic TOTAL MAXIMUM @Max MINIMUM @Min FACTOR
Champaign-Urbana 2000 Annual Weather Summary
 Champaign-Urbana 2000 Annual Weather Summary ILLINOIS STATE WATER SURVEY 2204 Griffith Dr. Champaign, IL 61820 wxobsrvr@sws.uiuc.edu Maria Peters, Weather Observer January: January started on a mild note,
Site Description: Tower Site
 Resource Summary for Elizabeth Site Final Report Colorado Anemometer Loan Program Monitoring Period: 7/3/06 /26/07 Report Date: January, 0 Site Description: The site is.6 miles northeast of the town of
Significant Rainfall and Peak Sustained Wind Estimates For Downtown San Francisco
 Significant Rainfall and Peak Sustained Wind Estimates For Downtown San Francisco Report Prepared by John P. Monteverdi, PhD, CCM July 30, 1998 Mayacamas Weather Consultants 1. Impact of Location The location
Climatography of the United States No
 Climate Division: CA 6 NWS Call Sign: LAX Elevation: 1 Feet Lat: 33 Month (1) Min (2) Month(1) Extremes Lowest (2) Temperature ( F) Lowest Month(1) Degree s (1) Base Temp 65 Heating Cooling 1 Number of
Climatography of the United States No
 Climate Division: CA 6 NWS Call Sign: TOA Elevation: 11 Feet Lat: 33 2W Temperature ( F) Month (1) Min (2) Month(1) Extremes Lowest (2) Lowest Month(1) Degree s (1) Base Temp 65 Heating Cooling 1 Number
ZUMWALT WEATHER AND CLIMATE ANNUAL REPORT ( )
") ZUMWALT WEATHER AND CLIMATE ANNUAL REPORT (26-29) FINAL DRAFT (9 AUGUST 21) J.D. HANSEN 1, R.V. TAYLOR 2, AND V.S. JANSEN 3 INTRODUCTION The Zumwalt Prairie in northeastern Oregon is a unique grassland
ZUMWALT WEATHER AND CLIMATE ANNUAL REPORT (26-29) FINAL DRAFT (9 AUGUST 21) J.D. HANSEN 1, R.V. TAYLOR 2, AND V.S. JANSEN 3 INTRODUCTION The Zumwalt Prairie in northeastern Oregon is a unique grassland
Local Ctimatotogical Data Summary White Hall, Illinois
 SWS Miscellaneous Publication 98-5 STATE OF ILLINOIS DEPARTMENT OF ENERGY AND NATURAL RESOURCES Local Ctimatotogical Data Summary White Hall, Illinois 1901-1990 by Audrey A. Bryan and Wayne Armstrong Illinois
2015 Fall Conditions Report
 2015 Fall Conditions Report Prepared by: Hydrologic Forecast Centre Date: December 21 st, 2015 Table of Contents Table of Figures... ii EXECUTIVE SUMMARY... 1 BACKGROUND... 2 SUMMER AND FALL PRECIPITATION...
CLIMOGRAPH UNIT: s^io
 Narrre: Block: Date: CLIMOGRAPH UNIT: s^io The climate can be defined as the average amount of rainfall, and the average temperature in a region. The climate of a region affects the type of soil that is
PRELIMINARY ASSESSMENT OF SURFACE WATER RESOURCES - A STUDY FROM DEDURU OYA BASIN OF SRI LANKA
 PRELIMINARY ASSESSMENT OF SURFACE WATER RESOURCES - A STUDY FROM DEDURU OYA BASIN OF SRI LANKA THUSHARA NAVODANI WICKRAMAARACHCHI Hydrologist, Water Resources Secretariat of Sri Lanka, Room 2-125, BMICH,
Country Presentation-Nepal
 Country Presentation-Nepal Mt.Everest, Shiva Pd. Nepal, DHM South Asia Drought Monitor Workshop Dhaka Bangladesh 2 th April 215 Overview Brief Climatology Climate activities- DHM PPCR (Pilot Program for
Clark Regional Wastewater District
 2017 Clark Regional Wastewater District Infiltration and Inflow Report For Salmon Creek Treatment Plant February 12, 2018 In Compliance with the NPDES Waste Discharge Permit No. WA-002363-9 Special Condition
Persistence of prey hot spots in southeast Alaska
 Persistence of prey hot spots in southeast Alaska Scott M. Gende National Park Service, Glacier Bay Field Station, 3100 National Park, Juneau, Alaska, USA; Scott_Gende Gende@nps.gov Michael Sigler National
Climatography of the United States No
 Month (1) Min (2) Month(1) Extremes Lowest (2) Temperature ( F) Lowest Month(1) Degree s (1) Base Temp 65 Heating Cooling 100 Number of s (3) Jan 63.9 39.3 51.6 86 1976 16 56.6 1986 20 1976 2 47.5 1973
Climatography of the United States No
 Temperature ( F) Month (1) Min (2) Month(1) Extremes Lowest (2) Lowest Month(1) Degree s (1) Base Temp 65 Heating Cooling 100 Number of s (3) Jan 32.8 21.7 27.3 62 1918 1 35.8 1983-24 1950 29 10.5 1979