Persistence of prey hot spots in southeast Alaska
|
|
|
- Molly Barton
- 6 years ago
- Views:
Transcription
1 Persistence of prey hot spots in southeast Alaska Scott M. Gende National Park Service, Glacier Bay Field Station, 3100 National Park, Juneau, Alaska, USA; Scott_Gende Michael Sigler National Marine Fisheries Service, Alaska Fisheries Science Center, Auke Bay Laboratory, Juneau, Alaska, USA; noaa.gov
2
3 Questions: 1. Are there high aggregations of pelagic fish prey in space and time? 2.Do these hot spots persist through time? 3.What is the response of predators to these aggregations?
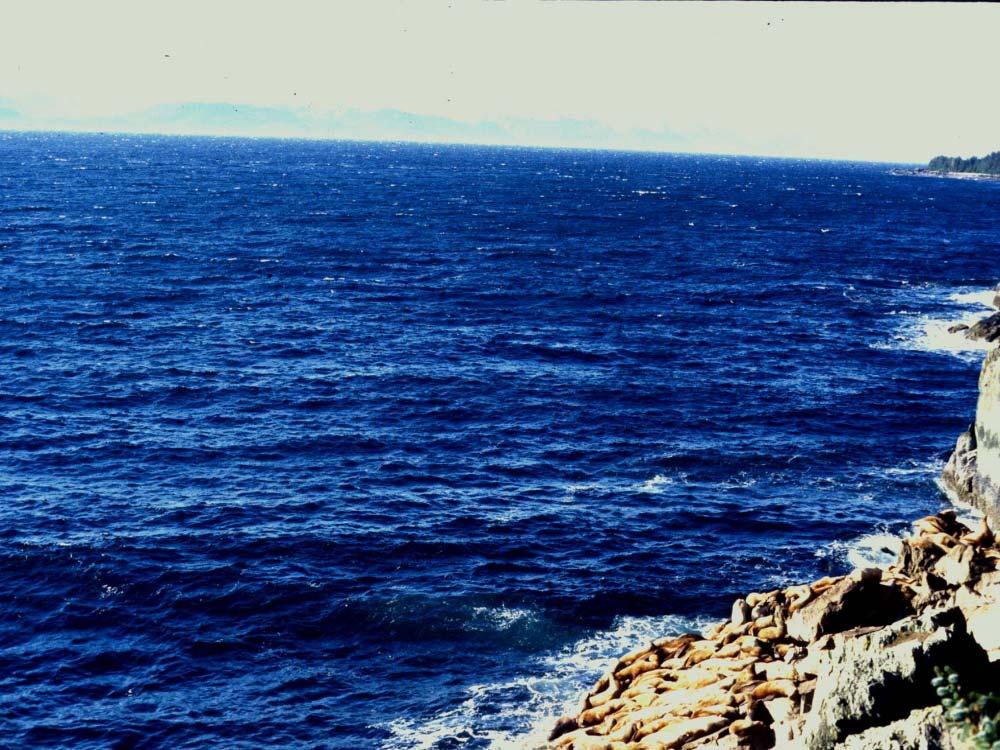
4 ~40 km study area

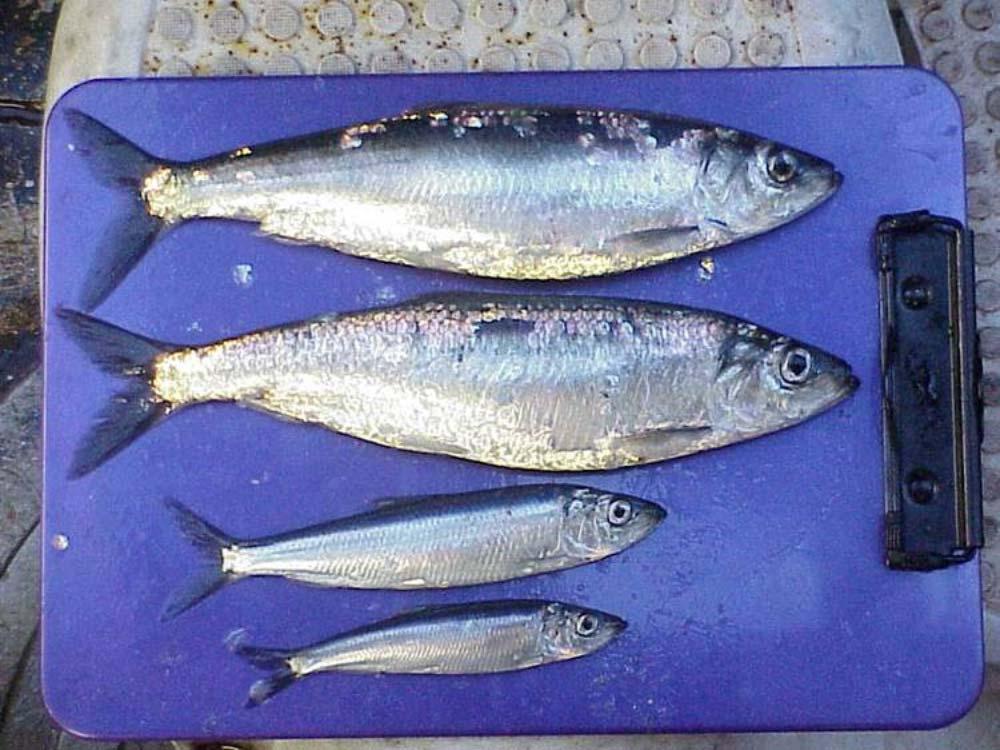
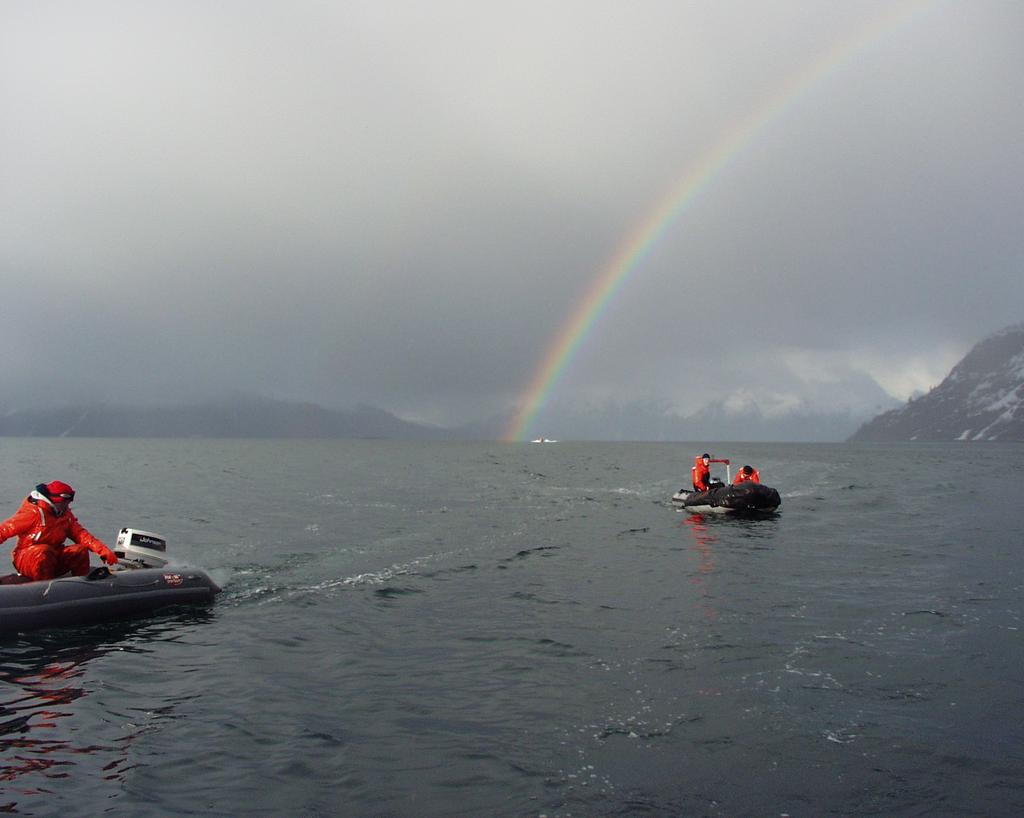
5 Methods: 1. Hydroacoustic surveys for pelagic prey conducted June 2001-May Periodic midwater trawls to sample prey energy and confirm echo sound 3. Concurrent observations of top predators including Steller sea lions and humpback whales 4. Transformed data from estimates of biomass to energy densities integrated across the water column 5. Blocked data into tenths of a latitudinal minute such that each block constituted approimately 1.83 km)

6 Methods: 1. Hydroacoustic surveys for pelagic prey conducted June 2001-May Periodic midwater trawls to sample prey energy and confirm echo sound 3. Concurrent observations of top predators including Steller sea lions and humpback whales 4. Transformed data from estimates of biomass to energy densities integrated across the water column 5. Blocked data into tenths of a latitudinal minute such that each block constituted approimately 1.83 km)

7 Methods: 1. Hydroacoustic surveys for pelagic prey conducted June 2001-May Periodic midwater trawls to sample prey energy and confirm echo sound 3. Concurrent observations of top predators including Steller sea lions and humpback whales 4. Transformed data from estimates of biomass to energy densities integrated across the water column 5. Blocked data into tenths of a latitudinal minute such that each block constituted approimately 1.83 km)
8 Methods: 1. Hydroacoustic surveys for pelagic prey conducted June 2001-May Periodic midwater trawls to sample prey energy and confirm echo sound 3. Concurrent observations of top predators including Steller sea lions and humpback whales 4. Blocked data into tenths of a latitudinal minute such that each block constituted approimately 1.83 km) 5. Transformed data from estimates of biomass to energy densities integrated across the water column
 5.")
9 Methods: 1. Hydroacoustic surveys for pelagic prey conducted June 2001-May Periodic midwater trawls to sample prey energy and confirm echo sound 3. Concurrent observations of top predators including Steller sea lions and humpback whales 4. Blocked data into tenths of a latitudinal minute such that each block constituted approimately 1.83 km) 5. Transformed data from estimates of biomass to energy densities integrated across the water column kj 10 6 /km 2
10 Results:
11 On average prey energy density is not equal across months 30,000 25,000 Millions kj/kg 2 20,000 15,000 10,000 5,000 0 JUN AUG OCT DEC FEB APR JUN AUG OCT DEC FEB APR JUN AUG OCT DEC FEB APR
12 Cold winter months (Nov-Feb) are hot 30,000 25,000 20,000 15,000 10,000 5,000 0 JUN AUG OCT DEC FEB APR JUN AUG OCT DEC FEB APR JUN AUG OCT DEC FEB APR Millions kj/kg 2
13
14 Distribution of pelagic prey energy November 2003 Seasonal haul-out >
15 Distribution of pelagic prey energy December 2003 Seasonal haul-out >
16 Distribution of pelagic prey energy January 2004 Seasonal haul-out >
17 Distribution of pelagic prey energy February 2004 Seasonal haul-out >
18 Distribution of pelagic prey energy March 2004 Seasonal haul-out >
19 Distribution of pelagic prey energy April 2004 Seasonal haul-out >
20 Distribution of pelagic prey energy May 2004 Seasonal haul-out >
21 Distribution of pelagic prey energy November 2003 Seasonal haul-out
22 Proportion of observed Steller sea lions November 2003 Seasonal haul-out % 60-80% 40-60% 20-40% 0-20%
23 Proportion of observed Steller sea lions December 2003 Seasonal haul-out % 60-80% 40-60% 20-40% 0-20%
24 Proportion of observed Steller sea lions January 2004 Seasonal haul-out % 60-80% 40-60% 20-40% 0-20%
25 Proportion of observed Steller sea lions February 2004 Seasonal haul-out % 60-80% 40-60% 20-40% 0-20%
26 Strong relationship between the average energy density of each block (winter) and the distribution of Steller sea lions % of months sea lions found foraging within that block 50% 40% 30% R 2 = % 10% 0% R 2 = ,000 10,000 15,000 20,000 25,000 Avg. energy density of each block
27 Hot spot persistence: the probability of encountering a hot spot across all winter months Seasonal haul-out >70% 60-70% 50-60%
28 Hot spots do not persist during the non-winter months Seasonal haul-out >70% 60-70% 50-60% 20-30%
29 Proportion of winter surveys when sea lions seen foraging Seasonal haul-out >40% 30-40% 20-30%
30 No relationship between hot spot location and foraging sea lions during the non-winter months % of months sea lions found foraging within that block 45% 40% 35% 30% 25% 20% 15% 10% 5% 0% R 2 = % 10% 20% 30% 40% 50% 60% 70% % of months when spot is hot Non-winter
31 Sea lions consistently utilized the prey hot spots during the winter (Nov-Feb) % of months sea lions found foraging at the spot 45% 45% 40% 40% 35% 35% 30% 30% 25% 25% 20% 20% 15% 15% 10% 10% 5% 5% R 2 = 0.02 R 2 = % 0% 0% 0% 10% 10% 20% 20% 30% 30% 40% 50% 60% 70% Winter Non-winter % of months when block is hot
32 1. Are prey aggregated in time and space? Overwintering herring schools result in high prey aggregations Nov-Feb and occur in consistent locations. 2. Do these prey hot spots persist? Some hot spot areas persisted through time; the probability of encountering a high concentration of prey eceeded 70% for some areas 3.Do predators respond to this persistence? Strong relationship (during the winter) between sea lion distribution and distribution of prey. However, it appears that sea lions response is greatest in areas with highest prey persistence rather than highest prey density
33 So what?
34 Abundance of prey j in the environment Encounter rate with prey j N j λ j Relative Encounter rate Attack λ j /N j Attack rates on prey j Capture rates on prey j Consumption rates on prey j a j c j K j probability Capture success Consumption probability a j / λ j c j /a j K j /c j Foraging Efficiency (Intake/Effort)
35 High density, low persistence of prey patches T1 T 2 T 3 T 4
36 High density, low persistence of prey patches T1 T 2 T 3 T 4
37 High density, low persistence of prey patches T1 T 2 T 3 T 4 I E = mid efficiency
38 High density, low persistence of prey patches T1 T 2 T 3 T 4 I E = mid efficiency Low density, low persistence of prey patches
39 High density, low persistence of prey patches T 1 T 2 T 3 T 4 I E = mid efficiency Low density, low persistence of prey patches
40 High density, low persistence of prey patches T 1 T 2 T 3 T 4 I E = mid efficiency Low density, low persistence of prey patches I E = low efficiency
41 High density, low persistence of prey patches T 1 T 2 T 3 T 4 I E = mid efficiency Low density, low persistence of prey patches I E = low efficiency Low density, high persistence of prey patches
42 High density, low persistence of prey patches T 1 T 2 T 3 T 4 I E = mid efficiency Low density, low persistence of prey patches I E = low efficiency Low density, high persistence of prey patches
43 High density, low persistence of prey patches T 1 T 2 T 3 T 4 I E = mid efficiency Low density, low persistence of prey patches I E = low efficiency Low density, high persistence of prey patches I E = high efficiency

44 Density may not be the only characteristic of prey aggregations that are important to predators; persistence may be just as important, particularly for those that do not have the ability to search large areas efficiently.
45
WHEN IS IT EVER GOING TO RAIN? Table of Average Annual Rainfall and Rainfall For Selected Arizona Cities
 WHEN IS IT EVER GOING TO RAIN? Table of Average Annual Rainfall and 2001-2002 Rainfall For Selected Arizona Cities Phoenix Tucson Flagstaff Avg. 2001-2002 Avg. 2001-2002 Avg. 2001-2002 October 0.7 0.0
Changing Hydrology under a Changing Climate for a Coastal Plain Watershed
 Changing Hydrology under a Changing Climate for a Coastal Plain Watershed David Bosch USDA-ARS, Tifton, GA Jeff Arnold ARS Temple, TX and Peter Allen Baylor University, TX SEWRU Objectives 1. Project changes
Changes in spatial distribution of chub mackerel under climate change: the case study using Japanese purse seine fisheries data in the East China Sea
 Changes in spatial distribution of chub mackerel under climate change: the case study using Japanese purse seine fisheries data in the East China Sea Tohya Yasuda, Ryuji Yukami, Seiji Ohshimo Seikai National
Habitat Suitability for Forage Fishes in Chesapeake Bay
 Habitat Suitability for Forage Fishes in Chesapeake Bay Aug 2017 Jul 2019 Mary C Fabrizio Troy D Tuckey Aaron J Bever Michael L MacWilliams 21 June 2018 Photo: Chesapeake Bay Program Motivation Production
Drought Characterization. Examination of Extreme Precipitation Events
 Drought Characterization Examination of Extreme Precipitation Events Extreme Precipitation Events During the Drought For the drought years (1999-2005) daily precipitation data was analyzed to find extreme
TILT, DAYLIGHT AND SEASONS WORKSHEET
 TILT, DAYLIGHT AND SEASONS WORKSHEET Activity Description: Students will use a data table to make a graph for the length of day and average high temperature in Utah. They will then answer questions based
GAMINGRE 8/1/ of 7
 FYE 09/30/92 JULY 92 0.00 254,550.00 0.00 0 0 0 0 0 0 0 0 0 254,550.00 0.00 0.00 0.00 0.00 254,550.00 AUG 10,616,710.31 5,299.95 845,656.83 84,565.68 61,084.86 23,480.82 339,734.73 135,893.89 67,946.95
Fine-scale Survey of Right and Humpback Whale Prey Abundance and Distribution
 DISTRIBUTION STATEMENT A: Approved for public release; distribution is unlimited. Fine-scale Survey of Right and Humpback Whale Prey Abundance and Distribution Joseph D. Warren School of Marine and Atmospheric
Significant Rainfall and Peak Sustained Wind Estimates For Downtown San Francisco
 Significant Rainfall and Peak Sustained Wind Estimates For Downtown San Francisco Report Prepared by John P. Monteverdi, PhD, CCM July 30, 1998 Mayacamas Weather Consultants 1. Impact of Location The location
Jackson County 2013 Weather Data
 Jackson County 2013 Weather Data 61 Years of Weather Data Recorded at the UF/IFAS Marianna North Florida Research and Education Center Doug Mayo Jackson County Extension Director 1952-2008 Rainfall Data
P7.7 A CLIMATOLOGICAL STUDY OF CLOUD TO GROUND LIGHTNING STRIKES IN THE VICINITY OF KENNEDY SPACE CENTER, FLORIDA
 P7.7 A CLIMATOLOGICAL STUDY OF CLOUD TO GROUND LIGHTNING STRIKES IN THE VICINITY OF KENNEDY SPACE CENTER, FLORIDA K. Lee Burns* Raytheon, Huntsville, Alabama Ryan K. Decker NASA, Marshall Space Flight
Scarborough Tide Gauge
 Tide Gauge Location OS: 504898E 488622N WGS84: Latitude: 54 16' 56.990"N Longitude: 00 23' 25.0279"W Instrument Valeport 740 (Druck Pressure Transducer) Benchmarks Benchmark Description TGBM = 4.18m above
Distributional changes of west coast species and impacts of climate change on species and species groups
 Distributional changes of west coast species and impacts of climate change on species and species groups Elliott Hazen 1 Ole Shelton 2 Eric Ward 2 1 NOAA Southwest Fisheries Science Center 2 NOAA Northwest
Champaign-Urbana 1999 Annual Weather Summary
 Champaign-Urbana 1999 Annual Weather Summary ILLINOIS STATE WATER SURVEY 2204 Griffith Dr. Champaign, IL 61820 wxobsrvr@sws.uiuc.edu Maria Peters, Weather Observer A major snowstorm kicked off the new
Practice Test Chapter 8 Sinusoidal Functions
 FOM 12 Practice Test Chapter 8 Sinusoidal Functions Name: Multiple Choice Identify the choice that best completes the statement or answers the question. Block: _ 1. Convert 120 into radians. A. 2" 3 B.
ALASKA REGION CLIMATE FORECAST BRIEFING. January 23, 2015 Rick Thoman ESSD Climate Services
 ALASKA REGION CLIMATE FORECAST BRIEFING January 23, 2015 Rick Thoman ESSD Climate Services Today Climate Forecast Basics Review of recent climate forecasts and conditions CPC Forecasts and observations
Winter Climate Forecast
 Winter 2018-2019 Climate Forecast 26 th Winter Weather Meeting, OMSI and Oregon AMS, Portland Kyle Dittmer Hydrologist-Meteorologist Columbia River Inter-Tribal Fish Commission Portland, Oregon Professor
Winter Climate Forecast
 Winter 2017-2018 Climate Forecast 25 th Winter Weather Meeting, OMSI and Oregon AMS, Portland Kyle Dittmer Hydrologist-Meteorologist Columbia River Inter-Tribal Fish Commission Portland, Oregon Professor
Lesson Adaptation Activity: Analyzing and Interpreting Data
 Lesson Adaptation Activity: Analyzing and Interpreting Data Related MA STE Framework Standard: 3-ESS2-1. Use graphs and tables of local weather data to describe and predict typical weather during a particular
Jackson County 2018 Weather Data 67 Years of Weather Data Recorded at the UF/IFAS Marianna North Florida Research and Education Center
 Jackson County 2018 Weather Data 67 Years of Weather Data Recorded at the UF/IFAS Marianna North Florida Research and Education Center Doug Mayo Jackson County Extension Director 1952-2008 Rainfall Data
The Climate of Murray County
 The Climate of Murray County Murray County is part of the Crosstimbers. This region is a transition between prairies and the mountains of southeastern Oklahoma. Average annual precipitation ranges from
Jackson County 2014 Weather Data
 Jackson County 2014 Weather Data 62 Years of Weather Data Recorded at the UF/IFAS Marianna North Florida Research and Education Center Doug Mayo Jackson County Extension Director 1952-2008 Rainfall Data
PRELIMINARY DRAFT FOR DISCUSSION PURPOSES
 Memorandum To: David Thompson From: John Haapala CC: Dan McDonald Bob Montgomery Date: February 24, 2003 File #: 1003551 Re: Lake Wenatchee Historic Water Levels, Operation Model, and Flood Operation This
Champaign-Urbana 2000 Annual Weather Summary
 Champaign-Urbana 2000 Annual Weather Summary ILLINOIS STATE WATER SURVEY 2204 Griffith Dr. Champaign, IL 61820 wxobsrvr@sws.uiuc.edu Maria Peters, Weather Observer January: January started on a mild note,
The Climate of Marshall County
 The Climate of Marshall County Marshall County is part of the Crosstimbers. This region is a transition region from the Central Great Plains to the more irregular terrain of southeastern Oklahoma. Average
The Climate of Bryan County
 The Climate of Bryan County Bryan County is part of the Crosstimbers throughout most of the county. The extreme eastern portions of Bryan County are part of the Cypress Swamp and Forest. Average annual
The Climate of Pontotoc County
 The Climate of Pontotoc County Pontotoc County is part of the Crosstimbers. This region is a transition region from the Central Great Plains to the more irregular terrain of southeast Oklahoma. Average
2004 State of the Ocean: Physical Oceanographic Conditions in the Newfoundland and Labrador Region
 Canadian Science Advisory Secretariat Science Advisory Report 25/18 Research vessel CCGS Teleost 24 State of the Ocean: Physical Oceanographic Conditions in the Newfoundland and Labrador Region Background
Monthly Magnetic Bulletin
 BRITISH GEOLOGICAL SURVEY Ascension Island Observatory Monthly Magnetic Bulletin December 2008 08/12/AS Crown copyright; Ordnance Survey ASCENSION ISLAND OBSERVATORY MAGNETIC DATA 1. Introduction Ascension
CWV Review London Weather Station Move
 CWV Review London Weather Station Move 6th November 26 Demand Estimation Sub-Committee Background The current composite weather variables (CWVs) for North Thames (NT), Eastern (EA) and South Eastern (SE)
The Climate of Payne County
 The Climate of Payne County Payne County is part of the Central Great Plains in the west, encompassing some of the best agricultural land in Oklahoma. Payne County is also part of the Crosstimbers in the
PROGRESS ACCOMPLISHED THIS PERIOD
 Semi-Annual Report Period Covered: September 1, 21 through February 28, 217 Prepared By: Richard Radigan Title: Monitoring of a Constructed Oyster Reef in the St. Lucie Estuary Agency: Florida Fish & Wildlife
The Climate of Kiowa County
 The Climate of Kiowa County Kiowa County is part of the Central Great Plains, encompassing some of the best agricultural land in Oklahoma. Average annual precipitation ranges from about 24 inches in northwestern
Champaign-Urbana 2001 Annual Weather Summary
 Champaign-Urbana 2001 Annual Weather Summary ILLINOIS STATE WATER SURVEY 2204 Griffith Dr. Champaign, IL 61820 wxobsrvr@sws.uiuc.edu Maria Peters, Weather Observer January: After a cold and snowy December,
CHAPTER 4 CRITICAL GROWTH SEASONS AND THE CRITICAL INFLOW PERIOD. The numbers of trawl and by bag seine samples collected by year over the study
 CHAPTER 4 CRITICAL GROWTH SEASONS AND THE CRITICAL INFLOW PERIOD The numbers of trawl and by bag seine samples collected by year over the study period are shown in table 4. Over the 18-year study period,
The Climate of Seminole County
 The Climate of Seminole County Seminole County is part of the Crosstimbers. This region is a transition region from the Central Great Plains to the more irregular terrain of southeastern Oklahoma. Average
Drought in Southeast Colorado
 Drought in Southeast Colorado Nolan Doesken and Roger Pielke, Sr. Colorado Climate Center Prepared by Tara Green and Odie Bliss http://climate.atmos.colostate.edu 1 Historical Perspective on Drought Tourism
ENGINE SERIAL NUMBERS
 ENGINE SERIAL NUMBERS The engine number was also the serial number of the car. Engines were numbered when they were completed, and for the most part went into a chassis within a day or so. However, some
Mountain View Community Shuttle Monthly Operations Report
 Mountain View Community Shuttle Monthly Operations Report December 6, 2018 Contents Passengers per Day, Table...- 3 - Passengers per Day, Chart...- 3 - Ridership Year-To-Date...- 4 - Average Daily Ridership
Interannual variation of MODIS NDVI in Lake Taihu and its relation to climate in submerged macrophyte region
 Yale-NUIST Center on Atmospheric Environment Interannual variation of MODIS NDVI in Lake Taihu and its relation to climate in submerged macrophyte region ZhangZhen 2015.07.10 1 Outline Introduction Data
Suppression of colonies of Reticulitermes spp. using the Sentricon termite colony elimination system: : A case study in Chatsworth, CA
 Suppression of colonies of Reticulitermes spp. using the Sentricon termite colony elimination system: : A case study in Chatsworth, CA Gail M. Getty, MS, Chris Solek, MS, Ron 1 1 Sbragia, Ph.D., Michael
Location. Datum. Survey. information. Etrometa. Step Gauge. Description. relative to Herne Bay is -2.72m. The site new level.
 Tide Gauge Location OS: 616895E 169377N WGS84: Latitude: 51 o 22.919196 N Longitude: 01 o 6.9335907 E Instrument Type Etrometa Step Gauge Benchmarks Benchmark TGBM = 5.524m above Ordnance Datum Newlyn
EVALUATION OF ALGORITHM PERFORMANCE 2012/13 GAS YEAR SCALING FACTOR AND WEATHER CORRECTION FACTOR
 EVALUATION OF ALGORITHM PERFORMANCE /3 GAS YEAR SCALING FACTOR AND WEATHER CORRECTION FACTOR. Background The annual gas year algorithm performance evaluation normally considers three sources of information
The Climate of Grady County
 The Climate of Grady County Grady County is part of the Central Great Plains, encompassing some of the best agricultural land in Oklahoma. Average annual precipitation ranges from about 33 inches in northern
DAILY QUESTIONS 28 TH JUNE 18 REASONING - CALENDAR
 DAILY QUESTIONS 28 TH JUNE 18 REASONING - CALENDAR LEAP AND NON-LEAP YEAR *A non-leap year has 365 days whereas a leap year has 366 days. (as February has 29 days). *Every year which is divisible by 4
Location. Datum. Survey. information. Etrometa. Step Gauge. Description. relative to Herne Bay is -2.72m. The site new level.
 Tide Gauge Location OS: 616895E 169377N WGS84: Latitude: 51 o 22.919196 N Longitude: 01 o 6.9335907 E Instrument Type Etrometa Step Gauge Benchmarks Benchmark TGBM = 5.524m above Ordnance Datum Newlyn
The Climate of Texas County
 The Climate of Texas County Texas County is part of the Western High Plains in the north and west and the Southwestern Tablelands in the east. The Western High Plains are characterized by abundant cropland
Public Library Use and Economic Hard Times: Analysis of Recent Data
 Public Library Use and Economic Hard Times: Analysis of Recent Data A Report Prepared for The American Library Association by The Library Research Center University of Illinois at Urbana Champaign April
Fire Season Prediction for Canada, Kerry Anderson Canadian Forest Service
 Fire Season Prediction for Canada, 2014 Kerry Anderson Canadian Forest Service 1 Introduction The Canadian Forest Service is now presenting monthly and seasonal forecast maps through the Canadian Wildland
8.1 Attachment 1: Ambient Weather Conditions at Jervoise Bay, Cockburn Sound
 8.1 Attachment 1: Ambient Weather Conditions at Jervoise Bay, Cockburn Sound Cockburn Sound is 20km south of the Perth-Fremantle area and has two features that are unique along Perth s metropolitan coast
Variability and trends in daily minimum and maximum temperatures and in diurnal temperature range in Lithuania, Latvia and Estonia
 Variability and trends in daily minimum and maximum temperatures and in diurnal temperature range in Lithuania, Latvia and Estonia Jaak Jaagus Dept. of Geography, University of Tartu Agrita Briede Dept.
A Report on a Statistical Model to Forecast Seasonal Inflows to Cowichan Lake
 A Report on a Statistical Model to Forecast Seasonal Inflows to Cowichan Lake Prepared by: Allan Chapman, MSc, PGeo Hydrologist, Chapman Geoscience Ltd., and Former Head, BC River Forecast Centre Victoria
Comparing walleye pollock dynamics across the Bering Sea and adjacent areas
 Comparing walleye pollock dynamics across the Bering Sea and adjacent areas Franz J. Mueter 1, Mikhail A. Stepanenko 2 Anatoly V. Smirnov 2, and Orio Yamamura 3 1 School of Fisheries and Ocean Sciences,
2015 Fall Conditions Report
 2015 Fall Conditions Report Prepared by: Hydrologic Forecast Centre Date: December 21 st, 2015 Table of Contents Table of Figures... ii EXECUTIVE SUMMARY... 1 BACKGROUND... 2 SUMMER AND FALL PRECIPITATION...
Time Series Analysis
 Time Series Analysis A time series is a sequence of observations made: 1) over a continuous time interval, 2) of successive measurements across that interval, 3) using equal spacing between consecutive
ALASKA REGION CLIMATE FORECAST BRIEFING. December 15, 2014 Rick Thoman NWS Alaska Region ESSD Climate Services
 ALASKA REGION CLIMATE FORECAST BRIEFING December 15, 2014 Rick Thoman NWS Alaska Region ESSD Climate Services Today Climate Forecast Basics Review of recent climate forecasts and conditions CPC Forecasts
2018 Annual Review of Availability Assessment Hours
 2018 Annual Review of Availability Assessment Hours Amber Motley Manager, Short Term Forecasting Clyde Loutan Principal, Renewable Energy Integration Karl Meeusen Senior Advisor, Infrastructure & Regulatory
3.0 TECHNICAL FEASIBILITY
 3.0 TECHNICAL FEASIBILITY 3.1 INTRODUCTION To enable seasonal storage and release of water from Lake Wenatchee, an impoundment structure would need to be constructed on the lake outlet channel. The structure
Life Cycle of Convective Systems over Western Colombia
 Life Cycle of Convective Systems over Western Colombia Meiry Sakamoto Uiversidade de São Paulo, São Paulo, Brazil Colombia Life Cycle of Convective Systems over Western Colombia Convective System (CS)
A Preliminary Severe Winter Storms Climatology for Missouri from
 A Preliminary Severe Winter Storms Climatology for Missouri from 1960-2010 K.L. Crandall and P.S Market University of Missouri Department of Soil, Environmental and Atmospheric Sciences Introduction The
NASA Products to Enhance Energy Utility Load Forecasting
 NASA Products to Enhance Energy Utility Load Forecasting Erica Zell, Battelle zelle@battelle.org, Arlington, VA ESIP 2010 Summer Meeting, Knoxville, TN, July 20-23 Project Overview Funded by the NASA Applied
Calculations Equation of Time. EQUATION OF TIME = apparent solar time - mean solar time
 Calculations Equation of Time APPARENT SOLAR TIME is the time that is shown on sundials. A MEAN SOLAR DAY is a constant 24 hours every day of the year. Apparent solar days are measured from noon one day
Graphing Sea Ice Extent in the Arctic and Antarctic
 Graphing Sea Ice Extent in the Arctic and Antarctic 1. Large amounts of ice form in some seasons in the oceans near the North Pole and the South Pole (the Arctic Ocean and the Southern Ocean). This ice,
2001 State of the Ocean: Chemical and Biological Oceanographic Conditions in the Newfoundland Region
 Stock Status Report G2-2 (2) 1 State of the Ocean: Chemical and Biological Oceanographic Conditions in the Background The Altantic Zone Monitoring Program (AZMP) was implemented in 1998 with the aim of
Determine the trend for time series data
 Extra Online Questions Determine the trend for time series data Covers AS 90641 (Statistics and Modelling 3.1) Scholarship Statistics and Modelling Chapter 1 Essent ial exam notes Time series 1. The value
Champaign-Urbana 1998 Annual Weather Summary
 Champaign-Urbana 1998 Annual Weather Summary ILLINOIS STATE WATER SURVEY Audrey Bryan, Weather Observer 2204 Griffith Dr. Champaign, IL 61820 wxobsrvr@sparc.sws.uiuc.edu The development of the El Nìno
Climate also has a large influence on how local ecosystems have evolved and how we interact with them.
 The Mississippi River in a Changing Climate By Paul Lehman, P.Eng., General Manager Mississippi Valley Conservation (This article originally appeared in the Mississippi Lakes Association s 212 Mississippi
Cambridge International Examinations Cambridge International Advanced Subsidiary and Advanced Level
 Cambridge International Examinations Cambridge International Advanced Subsidiary and Advanced Level *2554656732* MARINE SCIENCE 9693/01 Paper 1 AS Structured Questions October/November 2017 1 hour 30 minutes
Project No India Basin Shadow Study San Francisco, California, USA
 Project No. 432301 India Basin Shadow Study San Francisco, California, USA Numerical Modelling Studies 04 th June 2018 For Build Inc. Report Title: India Basin Shadow Study San Francisco, California, USA
JANUARY MONDAY TUESDAY WEDNESDAY THURSDAY FRIDAY SATURDAY SUNDAY
 Vocabulary (01) The Calendar (012) In context: Look at the calendar. Then, answer the questions. JANUARY MONDAY TUESDAY WEDNESDAY THURSDAY FRIDAY SATURDAY SUNDAY 1 New 2 3 4 5 6 Year s Day 7 8 9 10 11
YACT (Yet Another Climate Tool)? The SPI Explorer
? The SPI Explorer") YACT (Yet Another Climate Tool)? The SPI Explorer Mike Crimmins Assoc. Professor/Extension Specialist Dept. of Soil, Water, & Environmental Science The University of Arizona Yes, another climate tool for
YACT (Yet Another Climate Tool)? The SPI Explorer Mike Crimmins Assoc. Professor/Extension Specialist Dept. of Soil, Water, & Environmental Science The University of Arizona Yes, another climate tool for
Monthly Magnetic Bulletin
 BRITISH GEOLOGICAL SURVEY Port Stanley Observatory Monthly Magnetic Bulletin December 2007 07/12/PS Jason Islands a ar C West Falkland Kin gg eor ge B Port Salavador ay Weddell Island Mount Osborne So
Satellite-derived environmental drivers for top predator hotspots
 Satellite-derived environmental drivers for top predator hotspots Peter Miller @PeterM654 South West Marine Ecosystems 2017 21 Apr. 2017, Plymouth University Satellite environmental drivers for hotspots
Climate Change and Baleen Whale Trophic Cascades in Greenland
 Climate Change and Baleen Whale Trophic Cascades in Greenland Kristin L. Laidre Polar Science Center, Applied Physics Laboratory, University of Washington, 1013 NE 40th St. Seattle, WA 98105 USA phone:
1999 Day Precip Comments 2000 Day Precip Comments 2000 Day Precip Comments July January
 1999 Day Precip Comments 2000 Day Precip Comments 2000 Day Precip Comments July January 11 1.00 22 0.60 0.00 11.15 12 0.25 23 1.55 0.00 18.15 15 0.40 24 0.10 August 6-11 fog hvy-lite 16 0.75 26 0.05 0.00
Investigating the contribution of allochthonous subsidies to kelp forests in central California
 Investigating the contribution of allochthonous subsidies to kelp forests in central California melissa m foley UCSC Institute of Marine Science and Center for Ocean Solutions system connectivity rivers
The Climate of Haskell County
 The Climate of Haskell County Haskell County is part of the Hardwood Forest. The Hardwood Forest is characterized by its irregular landscape and the largest lake in Oklahoma, Lake Eufaula. Average annual
U.S. Outlook For October and Winter Thursday, September 19, 2013
 About This report coincides with today s release of the monthly temperature and precipitation outlooks for the U.S. from the Climate Prediction Center (CPC). U.S. CPC October and Winter Outlook The CPC
Monthly Long Range Weather Commentary Issued: APRIL 18, 2017 Steven A. Root, CCM, Chief Analytics Officer, Sr. VP,
 Monthly Long Range Weather Commentary Issued: APRIL 18, 2017 Steven A. Root, CCM, Chief Analytics Officer, Sr. VP, sroot@weatherbank.com MARCH 2017 Climate Highlights The Month in Review The average contiguous
Florida Courts E-Filing Authority Board. Service Desk Report March 2019
 Florida Courts E-Filing Authority Board Service Desk Report March 219 Customer Service Incidents March 219 Status January 219 February 219 March 219 Incidents Received 3,261 3,51 3,118 Incidents Worked
Highlights of the 2006 Water Year in Colorado
 Highlights of the 2006 Water Year in Colorado Nolan Doesken, State Climatologist Atmospheric Science Department Colorado State University http://ccc.atmos.colostate.edu Presented to 61 st Annual Meeting
Variability and trend of the heat balance in the southeast Indian Ocean
 Variability and trend of the heat balance in the southeast Indian Ocean Ming Feng, CSIRO Marine & Atmospheric Research Arne Biastoch, Claus Böning, Leibniz-Institut für Meeresforschung Nick Caputi, Department
Arctic climate change and effects on the ecosystems
 Arctic climate change and effects on the ecosystems NalânKoç Centre for Ice, Climate and Ecosystems (ICE) Norwegian Polar Institute Nalan.koc@npolar.no The Arctic Pacific Ocean Main inflow Main outflow
TABLE -I RAINFALL RECORDED AT PORT BLAIR (MM) FROM 1949 TO 2009
 FROM 1949 TO 2009") A. RAINFALL TABLE -I RAINFALL RECORDED AT PORT BLAIR (MM) FROM 1949 TO 2009 MONTH/YEAR 1949 1950 1951 1952 1953 1954 1955 1956 1957 1958 JANUARY 0.0 0.8 82.5 0.0 26.9 37.3 71.4 46.2 10.2 28.7 FEBRUARY
A. RAINFALL TABLE -I RAINFALL RECORDED AT PORT BLAIR (MM) FROM 1949 TO 2009 MONTH/YEAR 1949 1950 1951 1952 1953 1954 1955 1956 1957 1958 JANUARY 0.0 0.8 82.5 0.0 26.9 37.3 71.4 46.2 10.2 28.7 FEBRUARY
Jackson County 2019 Weather Data 68 Years of Weather Data Recorded at the UF/IFAS Marianna North Florida Research and Education Center
 Jackson County 2019 Weather Data 68 Years of Weather Data Recorded at the UF/IFAS Marianna North Florida Research and Education Center Doug Mayo Jackson County Extension Director 1952-2008 Rainfall Data
LAB 3: THE SUN AND CLIMATE NAME: LAB PARTNER(S):
:") GEOG 101L PHYSICAL GEOGRAPHY LAB SAN DIEGO CITY COLLEGE SELKIN 1 LAB 3: THE SUN AND CLIMATE NAME: LAB PARTNER(S): The main objective of today s lab is for you to be able to visualize the sun s position
GEOG 101L PHYSICAL GEOGRAPHY LAB SAN DIEGO CITY COLLEGE SELKIN 1 LAB 3: THE SUN AND CLIMATE NAME: LAB PARTNER(S): The main objective of today s lab is for you to be able to visualize the sun s position
The Climate of Oregon Climate Zone 4 Northern Cascades
 /05 E55 Unbound issue No. 9/ is Does not circulate Special Report 916 May 1993 The Climate of Oregon Climate Zone 4 Property of OREGON STATE UNIVERSITY Library Serials Corvallis, OR 97331-4503 Agricultural
Figure 1. Locations of major geographic features cited in the text. The inserted graph
 Figure 1. Locations of major geographic features cited in the text. The inserted graph shows estimated numbers of Steller sea lions (all ages) in Alaska from 1956 to 2000 (based on Trites and Larkin, 1996).
CHAPTER-11 CLIMATE AND RAINFALL
 CHAPTER-11 CLIMATE AND RAINFALL 2.1 Climate Climate in a narrow sense is usually defined as the "average weather", or more rigorously, as the statistical description in terms of the mean and variability
Monthly Magnetic Bulletin
 BRITISH GEOLOGICAL SURVEY Jim Carrigan Observatory Prudhoe Bay Monthly Magnetic Bulletin May 2014 14/05/JC JIM CARRIGAN OBSERVATORY MAGNETIC DATA 1. Introduction Jim Carrigan observatory is the fourth
Memo. I. Executive Summary. II. ALERT Data Source. III. General System-Wide Reporting Summary. Date: January 26, 2009 To: From: Subject:
 Memo Date: January 26, 2009 To: From: Subject: Kevin Stewart Markus Ritsch 2010 Annual Legacy ALERT Data Analysis Summary Report I. Executive Summary The Urban Drainage and Flood Control District (District)
2019 Settlement Calendar for ASX Cash Market Products. ASX Settlement
 2019 Settlement Calendar for ASX Cash Market Products ASX Settlement Settlement Calendar for ASX Cash Market Products 1 ASX Settlement Pty Limited (ASX Settlement) operates a trade date plus two Business
Local Ctimatotogical Data Summary White Hall, Illinois
 SWS Miscellaneous Publication 98-5 STATE OF ILLINOIS DEPARTMENT OF ENERGY AND NATURAL RESOURCES Local Ctimatotogical Data Summary White Hall, Illinois 1901-1990 by Audrey A. Bryan and Wayne Armstrong Illinois
Chiang Rai Province CC Threat overview AAS1109 Mekong ARCC
 Chiang Rai Province CC Threat overview AAS1109 Mekong ARCC This threat overview relies on projections of future climate change in the Mekong Basin for the period 2045-2069 compared to a baseline of 1980-2005.
Introduction to Part III Examining wildlife distributions and abundance using boat surveys
 Baseline Wildlife Studies in Atlantic Waters Offshore of Maryland: Final Report to the Maryland Department of Natural Resources and Maryland Energy Administration, 2015 Introduction to Part III Examining
Fairbanks, Alaska Solar & Weather Information Factsheet
 Fairbanks, Alaska Solar & Weather Information Factsheet EEM-01355 Narrative Climatological Summary Fairbanks is located in the Tanana Valley of Interior Alaska. The area has a definite continental climate.
Global Climates. Name Date
 Global Climates Name Date No investigation of the atmosphere is complete without examining the global distribution of the major atmospheric elements and the impact that humans have on weather and climate.
A Review of the 2007 Water Year in Colorado
 A Review of the 2007 Water Year in Colorado Nolan Doesken Colorado Climate Center, CSU Mike Gillespie Snow Survey Division, USDA, NRCS Presented at the 28 th Annual AGU Hydrology Days, March 26, 2008,
What Is the Relationship Between Earth s Tilt and the Seasons?
 Learning Set 2 Why Are There Differences in Temperature? Review Images and Graphics While reading about Earth s tilt and the seasons, pay particular attention to the graphics included. How do they help
KING EDWARD POINT OBSERVATORY MAGNETIC DATA
 BRITISH GEOLOGICAL SURVEY King Edward d Point Observatory Monthly Magnetic Bulletin May 2018 18/05/KE King Edward Point (UK) Maps British Antarctic Survey KING EDWARD POINT OBSERVATORY MAGNETIC DATA 1.