Challenges in Snow Measurement: Solid Precipitation and Snow Cover
|
|
|
- Patrick Summers
- 5 years ago
- Views:
Transcription

1 Challenges in Snow Measurement: Solid Precipitation and Snow Cover Barry Goodison Science and Technology Branch Environment Canada (with contributions from many colleagues)
2 Precipitation and Snow Definitions Precipitation Any product of the condensation of atmospheric water vapour which is deposited on the earth s surface is a type of precipitation. Rainfall the accumulated depth of liquid precipitation over a horizontal unit area between observing periods. Snowfall the accumulated depth of freshly fallen snow over a horizontal unit area between observing periods. Total Precipitation the sum of the accumulated depths of the water equivalent of all precipitation over a horizontal unit area between observing periods. Snow Cover The net accumulation of snow on the ground resulting from solid precipitation deposited as snowfall, ice pellets, hoar frost and glaze ice, and water from rainfall, much of which subsequently has frozen. Water Equivalent of Snow Cover (SWE) Vertical depth of a water layer which would be obtained by melting a snow cover. Snow Depth (Snow on the Ground) The total depth of solid precipitation on the ground at the time of observation. The vertical distance between the surface of a snow layer and the ground, the layer being assumed to be evenly spread over the ground which it covers. Snow survey Snow survey - The depth of snowpack, water equivalent (SWE) and snow density, averaged over a snow course.
3 In-situ Measurement of Precipitation and Snow Cover Variable Instrument Standard Rain Gauge Tipping Bucket Rain Gauge Nipher Gauge All Weather Auto Gauge Ruler Sonic Depth Sensor Snow Course Rainfall X X X Rate of Rainfall XX Fresh fallen snow X X Total Precipitation X X X X X Depth of Snow on Ground X X Snow Cover (SWE) X X=manual X=autostation
4 Application Requirements for Precipitation Data DATA APPLICATION TYPE TIMING AMOUNT AMOUNT ACCURACY SPATIAL COVERAGE TEMPORAL HOMOGENEITY AVIATION FORECASTS GENERAL PUBLIC FLOOD FORECASTING = very important 2 = important 3 = less important ENGINEERING RESEARCH MANUAL OBS AUTOSTATION Good Bad
5 THE WMO SOLID PRECIPITATION MEASUREMENT INTERCOMPARISON Study Objectives The goal of the intercomparison was to assess national methods of measuring solid precipitation against methods whose accuracy and reliability were known, including past and current procedures, automated systems and new methods of observation. The intercomparison was especially designed to: Determine wind related errors in national methods of measuring solid precipitation, including consideration of wetting and evaporative losses; Derive standard methods for adjusting solid precipitation measurements; and Introduce a reference method of solid precipitation measurement for general use to calibrate any type of precipitation gauge.
6 Sources of Measurement Errors Systematic errors for manual catchment-type gauge: WIND (temperature) wetting loss evaporation loss non-zero trace capping of gauge orifice blowing snow

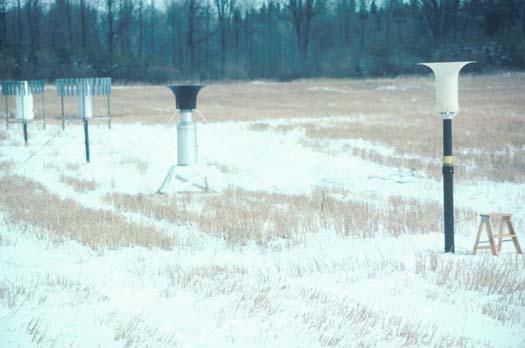


7 WMO Solid Precipitation Measurement Intercomparison


8 Measuring freshly fallen snowfall with Snow Boards Weaverboard 2000 for use as an Observer s aid Original 10cm snowfall is 10mm precipitation


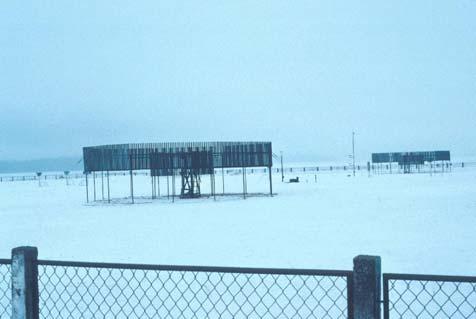
9 WMO Double Fence International Reference for Solid Precipitation

")


10 WMO Intercomparison Study Results Catch Efficiency vs Wind for the 4 most widely used gauges Ratio of gauge catch to the DFIR (% ) Canadian Nipher NWS 8" Alter NWS 8" unsh Tretyakov Hellmann unsh Wind speed at gauge height (m/s)


11 Wind flow effects on gauges Shapes of precipitation gauge body. The number 1 indicates the shape having the worst aerodynamic properties and the number 6 having the best ones. Arrows show the streamlines and the dashed lines the trajectories of precipitation particles.
12 Need for adjustments all types(r, S, X) snow only Precipitation Amount (% of adjusted DFIR) adjusted Nipher Belfort Belfort Belfort Belfort DFIR Nipher unshielded unshielded Alter shielded Nipher shielded DFIR shielded Types of Precipitation Gauges & Shields Mean annual accumulated winter precipitation > 3.0 mm, of different gauge types and shielding as a percentage of DFIR (adjusted for catch deficiency) at the Canadian Evaluation Station at Kortright Centre, Ontario from


13 Challenges for auto QA/QC
14 Accumulated Precipitation (mm) and 2m wind speed (m/s) Time (15 min intervals) 5 0 Air Temperature (deg.c) Automation of precipitation measurements Ws2 (m/s) Unsh. Belfort (mm total) Alter Belfort (mm total) Nipher Belfort (mm total) DFIR Belfort (mm total) Ta (deg.c) WMO Study: Timing and catch differences of Belfort Gauges at Kortright, Ontario Feb /
15 Hall Beach A Total Precipitation Manned vs Weighing Gauges 80 Hall Beach A Actual Total Pcpn Measured by Manned and Weighing Gauges 70 DLY04 Qced data Dly02 raw syno data millimetres Apr Nov 1996 Jan Mar Oct Dec Feb Apr Nov 1998 Jan Mar Oct Dec Feb Apr Nov 2000 Jan Nov Year Month Monique Lapalme, Environment Canada/PNR

 Bratt's Lake: Winter 2003/04 100 POSS: High resolution")
 90 80 70 60 50 40 30 20 10 0 2 3 4 5 6 7 8 9 10 11 12 2m Wind")
16 Bratt s Lake Geonor Intercomparison Project objective: develop and refine wind under-catch relationships for the Geonor all-weather precip gauge, incorporating new technologies such as the POSS Bratt s Lake, SK Alter Shielded Geonor Catch Efficiency vs. Wind Speed (>1mm precip events) Bratt's Lake: Winter 2003/ POSS: High resolution precip occurrence and typing to be used to refine wind correction relationships Ratio of gauge catch to the DFIR (%) m Wind Speed (m/s) Craig Smith
17 Development of Bias-Corrected Precipitation Database and Climatology for the Arctic Regions (NSF project, ) Daqing Yang, Douglas L. Kane Water and Environment Research Center University of Alaska Fairbanks Canada David R. Legates Department of Geography University of Delaware Greenland Mongolia China Russia Kazakhstan Research Goals Evaluate the accuracy of precipitation measurements in the Arctic regions. Implement a consistent bias-correction method over the pan-arctic, i.e. Alaska, northern Canada, Siberia, northern Europe, Greenland, and the Arctic Ocean. Develop biased-corrected and compatible precipitation database (including grid products) and climatology for the Arctic regions as a whole.
18 Summary of bias correction for Greenland, trace Application of the WMO Results Annual precipitation (mm) wetting loss wind loss measured WMO station code Precipitation correction in Alaska NWS 8" standard gauges, 1982 Annual Precipitation (mm) measured wind loss wetting loss trace Barrow Barter Kotzebue Bettles Nome Talkeenta Valdez Bethel Homer Kodiak
19 Mean Gauge-Measured (Pm) and Bias-Corrected (Pc) Precipitation, and Correction Factor (CF) for January Yang et al., 2005, GRL Pm (mm) Pc (mm) CF a) Pm (mm) b) Pc (mm) c) CF Total 4827 stations located north of 45N, with data records longer-than 15 years during Similar Pm and Pc patterns corrections did not significantly change the spatial distribution. CF pattern is different from the Pm and Pc patterns, very high CF along the coasts of the Arctic Ocean.
20 Impact of Bias-Corrections on Precip Trend Pm & Pc Trend Comparison, Selected Stations with Data > 25 Yrs during Pc trend (mm Jan y = x R 2 = Pm trend (mm) Pc trend (mm Jul. 7 6 y = x 5 R 2 = Pm trend (mm)


21 solid Probability of solid and liquid precipitation as function of air temperature and humidtity derived from SYNOP data Fuchs, T., J. Rapp, F. Rubel and B. Rudolf (2001) liquid

22

23 GPCC s data processing scheme for SYNOP reports: Separation of liquid, mixed and solid phase using www 1 W 2 or T and Td Correction using a wind speed reduced from v10m. Calculation of corrected daily precipitation totals.

24 Classical information provided on the grid: monthly precipitation total monthly precipitation anomaly number of stations High resolution gridded global precipitation normals are also Available.

25

26 Precipitation Biases: ERA-40, NCEP-1 and GPCP
")
 relative")
27 New GPCC products based on synoptic data fraction of liquid precipitation (%) fraction of solid precipitation (%) absolute measuring error (mm/mon) relative measuring error (%)
28 Mean percentual correction for all SYNOP precipitation based on GPCC s new correction method LBA area mean = ca 4% BALTEX area mean = ca 25% Comparison of monthly percentual corrections in % of observed data derived from daily corrections for the years 1996 and 1997 and long-term mean monthly corrections after Legates 1987 (Ungersböck et al. 2001)
29 Mean daily precipitation phases in Europe (31-72 N, 11 W - 44 E) from January until August 2001 based on GPCC's phase scheme. Mean precipitation corrections in Europe (31-72 N, 11 W - 44 E) January until December 2001 compared to Legates' mean monthly climatologic corrections

30 Climate Data Homogenization Homogenization Recommendations / Part 1 Climate data need to be assessed for homogeneity before being used for climate change studies. Network-wide problems should be addressed first. Adjustments should be made with caution to avoid over-adjusting the data. Detailed documentation of the homogenization procedures and adjustments should be available to all users. Metadata Existence and access to metadata by the research community is absolutely essential for proper climate data homogenization. Digitized metadata should be updated on regular basis. There is a need to provide standards, collect and archive metadata from other climate observing agencies
31 IPWG/GPM/GRP Workshop on Global Microwave Modeling and Retrieval of Snowfall October 11-13, 2005 High priority recommendations: Modelling Encourage the generation of community CRM/NWP model profile databases that represent natural variability. Intensification of data assimilation studies for the inclusion of precipitation observations in NWP analysis systems Establishment of modeling chain Development of high-latitude surface emissivity products ( GHz) New technology: The development and further refinement of inexpensive ground-based remote sensing instruments for snowfall should be encouraged (e.g. POSS) The use of combined active and passive satellite data for snowfall detection/retrieval should be further encouraged. New passive microwave instruments and new channel combinations need to be studied.
32 IPWG/GPM/GRP Workshop on Global Microwave Modeling and Retrieval of Snowfall Validation: High level coordination of international GV programs for snowfall (e.g., through GPM, GEWEX, IPWG) is urgently needed to advance the current state of snowfall retrievals. Dedicated validation Long term surface based measurements must continue to insure long term continuity for climate assessment and monitoring.
33 WCRP Workshop Fairbanks Issues, Gaps and Challenges Adjustment of measured precipitation across national boundaries, collaboratively among nations Comparison of adjustment approaches for different applications Error analysis of adjusted products Adjustment of measured precipitation on a global scale. Validation? Role for GPCC. Determining precipitation for mountainous regions and ice sheets, e.g. Antarctica. Measured and modelled? Evaluate the validity of the bias correction procedures for the polar regions. WCRP (CliC) sponsored intercomparisons? Development of on-line metadata
34 WCRP Workshop Fairbanks Issues, Gaps and Challenges Determination of precipitation amount and type in data sparse regions in a changing climate Automation of precipitation measurements (instruments, errors, adjustment, archiving, GTS data, etc) Development of gridded, regional precipitation products (scale of RCM, hydrological model) for validation of climate model simulations and for initializing distributed hydrological model Development of integrated ( fused ) precipitation products from in-situ, satellite, radar, models Human resource capacity, especially for measurement issues Ability of GPM to measure solid precipitation What can we do for determining precipitation in polar regions for the IPY (March March ) What do modellers need to validate precipitation in cold climate regions; can gauge data be confidently used in data assimilation?


 Observation at Tiksi,,")


 Verification of remote")
35 Decrease the UNCERTAINTY in Solid Precipitation: Correction for past/present data and future monitoring. Integrated study from space and land. (1) Observation at Tiksi,, Barrow and/or others GPM Precipitating snow DFIR(Double Fence) Snow Particle Counter Radar Trechakov(Russia, others) (1) Verification of remote sensing. (2) New precipitaion data-set for high altitude.


36 Snow Cover Information -- In-Situ vs Satellite SSM/I Data Coverage 1 day MSC Networks - Snow Cover

37 What is Representative?


38 Slave Geological Province: wind scour and deposition snow covered lakes The challenge of measurement and modelling Hudson Bay Lowlands: wind redistribution patchy bare ice, frozen to bed Boreal Shield: open canopy with relief plentiful lakes Northern boreal: patchy forest mosaic relatively few lakes

39


40 Snow Cover Characteristics: Snow cover structure is complex and highly variable in time and space Variability depends on many factors: The parent weather, their nature and frequency The weather conditions during the periods between storms affects metamorphism, ablation and redeposition of snowpack Surface topography, physiography, and vegetative cover

41 Automation Loss of observations Compatibility and continuity of record Collection of data in remote regions Change in standards Tº Air Tº 0cm Snow Depth Station # No. of Stations Autostations in MSC Network Year Temperature [ C] OCT OCT OCT OCT NOV NOV NOV NOV 6 DEC 14 DEC 23 DEC 31 DEC 8 JAN 16 JAN 24 JAN 1998/199 1 FEB 9 FEB 18 FEB 26 FEB MAR MAR MAR MAR APR APR APR Snow Depth [m]

42 Edmonton Snow Depth Intercomparison
 of six temporary and a fixed")
 Test Auto B Test Auto C 30 Test Auto D Test Auto E Test Auto F 20 Station Auto Station Manual")
")
43 Snow Depth Spatial Variability and Fixed-Point Measurements Edmonton International Airport open landscape see a high degree of spatial variability even over a short distance (3 to 300m) of six temporary and a fixed station SR50, and manual ruler measurements, none are statistically similar to each other Depth (cm) 40 Test Auto A (SR50) Test Auto B Test Auto C 30 Test Auto D Test Auto E Test Auto F 20 Station Auto Station Manual (ruler) 10 0 Oct Feb Jun Oct Feb Jun Challenges: to provide the best quality measurements to the research community for the research community to recognise these issues when using the data (e.g. comparisons with spaceborne data)


44 Penny Ice Cap


45 Churchill RCT1 (top) Dec 2000 Huge rocks create deep drifts, dry patches RCT2 (bottom) Mar 2003 Open tundra with small obstacles creates cm drifts Flagging of trees points away from Hudson s s Bay


46 BERMS Snow Survey
47 Snow Depth Spatial Variability and Fixed-Point Measurements Frequency Harvested Site Harvested Site Harvested Site Old Jack Pine Old Black Spruce Old Aspen Fire Site Fen Fire Site Snow Depth (cm) Snow depth surveys from a variety of landscapes in the southern boreal forest of Saskatchewan, mid- March Results are shown as frequency histograms, with depth along the x-axis. Automated, continuous, fixed-point depth measurements (e.g. SR50) are used to monitor changes in snow depth at a site, but are often restricted to installation near towers or other structures. Snow depth is a spatially heterogeneous variable, so it is important to question how well fixed-point measurements represent the spatial variability. Comparing the fixed-point depth measurements (clearing = solid blue vertical lines, subcanopy = broken blue)) with the snow survey means (red) indicates under- and over-representation of the landscape mean at various sites, and good representation at others. How can this information be used to make the best use of fixed-point depth measurements?
48 Landscape Mean Snow Depth (cm) Snow Depth Spatial Variability and Fixed-Point Measurements Fixed Point Snow Depth (cm) Where there are sufficient snow surveys available, able to find a simple linear relationship between fixed-point and landscape mean depths, allowing for correction of the point measurements. Minimum Sample Size Difference from Survey Mean (percent) 2002 Harvest 1994 Harvest 1975 Harvest Jack Pine Black Spruce Aspen Fen 1989 Fire 1998 Fire Where there are no snow surveys available or where such data collection is too labour- or time- intensive, how many fixed-point measurements would be needed to adequately represent the landscape mean? For the boreal forest sites, find that five point measurements (when appropriately installed) will represent the landscape mean within 30%.

49 Scaling of the crysophere a problem in cold climate regions Arctic snowpacks are very heterogeneous due to both micro topography (elevation, aspect and slope) and redistribution by wind coupled with larger topographic features and vegetation. The challenge is to quantify the snowpack distribution over a large watershed, a region, or a grid.

50 The development and ablation of a snow cover in the Arctic are interesting and important hydrologic processes that are difficult to quantify at the watershed scale. Both energy and mass fluxes play a role in these processes, but are also impacted by these processes. How do we get high quality, spatially distributed snowpack data for use in water balance closure and input into hydrologic models at the watershed scale (2 to 10,000 km 2 or larger)?
 2004 60 50 40 30 20 10 0 68.0 68.5 69.0 69.5 Latitude ( N) 70.")
51 Kuparuk River Basin Snow depth Snow Depth (cm) Latitude ( N)
52 Snowpack Water Equivalent (cm) IMNAVAIT WATERSHED SNOWPACK ABLATION Apr 2-May 7-May 12-May 17-May 22-May 27-May 1-Jun 6-Jun 11-Jun
 70.0 70.")
53 Kuparuk River Basin 400 Snow Density Density (kg/m ) Latitude ( N)
 1.")


54 Upper Kuparuk Basin Transect m 1.2 1m 10 m Snow Depth (m) m 1000 m Standard Deviation Mean Standard Deviation Distance (m)


55 Airborne Passive Microwave Data Feb. 25 Flight 1 Feb. 25 Flight 2

56 Boreal Forest SWE Scaling AMSR and SSM/I derived SWE retrievals (MSC coniferous algorithm) fall into center of normally distributed in situ measurements. AMSR SWE retrievals tend to be ~ 10 mm lower than SSM/I. Airborne passive microwave SWE retrievals capture the full range of in situ measurements. High level of within and between site SWE variability In Situ In (n=239) Situ (n=239) AMSR SSM/I AMSR (n=24) AMSR (n=10) (n=24) (n=24) SSM/I SSM/I (n=10) (n=10) SSM/I (n=10) Tower Tower (n=48) (n=48) Airborne Feb. 25 Flight 1 ( 10338) 100% 90% 80% 70% 60% 50% 40% 30% 20% 10% 0% Relative Frequency SWE Range (mm)
 spatial variability in snow cover characteristics no single passive microwave SWE algorithm will be applicable for all areas regional approach to algorithm development")
57 Canada - Challenges for SWE Determination large country with diverse climates and landscapes (e.g. topography, vegetation cover) lack of conventional measurements for validation in remote areas (e.g. north) spatial variability in snow cover characteristics no single passive microwave SWE algorithm will be applicable for all areas regional approach to algorithm development
58 Assessment of Spring Snow Cover Variability over Northern Canada from Satellite Datasets Dataset Period Resolution Description In situ Daily snow depth measurements at a point NOAA snow charts km Digitized weekly charts of snow cover derived from visual interpretation of visible satellite imagery NOAA IMS charts km Incorporates additional data sources but is still largely based on manual interpretation of visible imagery Passive Microwave km SWE retrieved using EC open environments algorithm (37V-19V) SWE converted to SCD* using 1 mm threshold QuikSCAT km Ku-band measurements Information on spring SCD* inferred from the melt onset signal (small amount of liquid water content in snow causes a decrease of more than 5 db in backscatter) *SCD=Spring Snow Cover Duration: number of days with snow cover from 1 April 31 July

59 Motivation Wang et al. (2005) [Rem. Sens. Env., 95, ] NOAA weekly dataset consistently overestimated snow cover extent during the spring melt period, with delays of up to 4 weeks in melt onset AVHRR NOAA Comparison of weekly snow cover maps derived from AVHRR and NOAA for weeks in the spring of 1997

60 Current Passive Microwave Capabilities in Tundra Areas SWE Snow Extent/Melt Timing Systematic underestimation in SWE magnitude Greater utility in identifying event related ΔSWE Snow Cover Fraction 1988 Snow Cover Fraction 100% 90% 80% 70% 60% 50% 40% 30% 20% 10% 0% 100% 90% 80% 70% 60% 50% 40% 30% 20% 10% 1997 Snow Cover Fraction 0% 100% 90% 80% 70% 60% 50% 40% 30% 20% 10% 0% AVHRR NOAA SSM/I Mar. Apr. May June AVHRR NOAA SSM/I Mar. Apr. May June AVHRR NOAA SSM/I Mar. Apr. May June 1998 Snow extent during melt agrees well with optical data Wang et al., Remote Sens. Environ. In press.
61 In situ Network ¾ Current observing network is sparse, and biased to the western Arctic and coastal locations ¾ 2 cm threshold selected for SCD determination: avoids discontinuity in 1975 when Canadian reporting switched from whole inches to whole centimetres ¾ Significant inter-station correlations in spring SCD over distances of several hundred kilometres. Spring SCD corelation-distance decay by region Mean Correlation ( ) Location of surface stations with at least 3 years of complete spring snow cover data, Central Canadian Arctic study area is outlined in bold. 0.7 Western Arctic Eastern Arctic Cdn Prairies Distance (km)
 presence/absence of snow based on 50%")
 presence/absence of snow based on 50% threshold daily, 25 km")
62 NOAA Visible Satellite Products Snow Chart: Jan. 29-Feb (Rutgers University Global Snow Laboratory) presence/absence of snow based on 50% coverage threshold weekly, km resolution available present IMS Product: Feb (NOAA/NESDIS) presence/absence of snow based on 50% threshold daily, 25 km resolution available present
 Scanning Multichannel Microwave Radiometer (SMMR; 1978-1987) and Special Sensor Microwave/Imager (SSM/I; 1987-2004) data combined using the brightness")
63 Passive Microwave Time Series Weekly averaged EASE-Grid brightness temperatures processed with the Environment Canada open environments SWE algorithm (Goodison and Walker, 1995) (based on brightness temperature difference between 37 and 19 GHz) Scanning Multichannel Microwave Radiometer (SMMR; ) and Special Sensor Microwave/Imager (SSM/I; ) data combined using the brightness temperature standardization coefficients of Derksen and Walker (2004) SWE algorithm not considered reliable over mountainous and dense forest; over open tundra SWE retrieval is affected by highly variable snow distribution, wind slab, and lake ice; wet snow also an issue Comparisons against AVHRR data and model simulations showed good agreement over tundra when SWE retrievals were converted to SCA; gave superior performance to the adaptive brightness temperature threshold approach of Mialon et al., 2005 (EARSeL Proceedings, )
 ¾ Constant incidence angles: 46º for Hpol, 54 º for V-pol ¾ Original Resolution: ~7 x 25 km ¾ Available from July 1999 present.")
64 SeaWinds Scatterometer on QuikSCAT ¾ Operates at Ku-band frequency (13.4GHz) ¾ Constant incidence angles: 46º for Hpol, 54 º for V-pol ¾ Original Resolution: ~7 x 25 km ¾ Available from July 1999 present. ¾ Due to wide swath and orbit geometry, QSCAT observes the polar regions multiple times each day, allowing reconstruction of surface backscatter at finer spatial resolution ¾Dynamic threshold method developed by Wang et al. (2005) for high Arctic ice caps was modified for terrestrial snowmelt signal ¾Spring SCD estimated from snowmelt onset by applying an empirically-derived constant which represents the time from melt onset to disappearance BYU Egg-based SIR product on 4.45km * 4.45 km grid Wang, L., M. Sharp, B. Rivard, S. Marshall, and D. Burgess Melt season duration on Canadian Arctic ice caps, Geophysical Research Letters, 32, doi: /2005gl
65 Comparison of in situ and satellite SCD pairs Satellite Period No. Pairs Avg Separati on (km) Bias (SATSTN) Slope rmse r2 NOAA PMW IMS QSCAT NOAA PMW ¾ For the period, all datasets have similar r2 values ¾ NOAA and IMS have similar positive bias but highest slope values (i.e. best representation of the spatial gradient in spring SCD over northern Canada) ¾3-4 week positive bias in IMS and NOAA likely related to cloud cover effects ¾ Microwave results influenced by forest cover and mountainous terrain
66 Summary ¾ A comprehensive inter-comparison of melt season SCD datasets derived from satellite data was conducted for high latitude NA for the spring seasons of ¾ NOAA, IMS and QSCAT data were successful at capturing the spatial variability in mean spring SCD over the Canadian Arctic (passive m/w affected by forest and mountains) ¾ However, the passive m/w was better than the NOAA dataset at capturing the interannual variability in spring SCD over the central Canadian Arctic ¾The NOAA dataset also exhibited weaker correlations with NCEP air temperatures than passive m/w ¾The results suggest that considerable care be exercised when using the NOAA dataset in summer months when snow cover variability is controlled by smaller high latitude regions such as the central Cdn Arctic that are subject to extensive cloud cover ¾ The high resolution QuikSCAT product showed some promise for mapping spring snow cover variability over high latitudes ¾And YES we will be including MODIS in this evaluation now that the 0.25º climate grid products have been released


67 Regional SWE Products for Research and Operational Applications Canadian Prairies -weekly C maps produced and sent to users (federal, provincial agencies, private industry) who have a requirement for regular monitoring of snow cover in western Canada - available to public on (State of Canadian Cryosphere) Manitoba Red River watershed - specialized maps sent to provincial water resource agencies focussed on priority river basins for forecasting spring runoff and flood risk Mackenzie Basin - MAGS research on snow cover variations, RCM evaluation Snare River Basin NWT - maps for hydro companies (e.g. NWT Power Corp.) in support of planning hydroelectric power operations


68 Comparison of AMSR-E E and SSM/I SWE Products (CRB SWE Algorithm) SSM/I SWE MSC SWE algorithm SWE derived from AMSR-E using MSC algorithm Spatial patterns of SWE are similar More detailed information with higher resolution AMSR-E SSM/I AMSR-E

69 Field Validation: 2005 Results SWE underestimation in the open canopy northern boreal forest is a function of retrieval saturation and is less dependant on the influence of vegetation. Conventional brightness temperature difference algorithms are accurate up to ~160 mm SWE.

70 Snow Water Equivalent from SSM/I data GTV = Tb 37v Tb 19v f 37v -f 19v (Source : IREQ, Danielle De Sève, 2003)

71
72
73 Compare current SWE with previous observations Current

74 Networks and Lessons Learned automation is a major challenge networks aren t sexy hard to attract the investment needed to keep current networks operating long term monitoring costs should not be under estimated, including decommissioning Funding is often short term data monitoring is long term Who should operate monitoring networks operational agencies who have the mandate eg WMO members don t underestimate the resources needed to maintain an effective national data archive unless data and information are easy to obtain (e.g. online free access) and have well-documented meta-data, the huge investment in observing systems is being wasted avoid custom solutions to data management; open source is the way to go. Partnerships in operating provide significant opportunities in a northern environment

75 Thank you Questions?
Remote Sensing of SWE in Canada
 Remote Sensing of SWE in Canada Anne Walker Climate Research Division, Environment Canada Polar Snowfall Hydrology Mission Workshop, June 26-28, 2007 Satellite Remote Sensing Snow Cover Optical -- Snow
Canadian Prairie Snow Cover Variability
 Canadian Prairie Snow Cover Variability Chris Derksen, Ross Brown, Murray MacKay, Anne Walker Climate Research Division Environment Canada Ongoing Activities: Snow Cover Variability and Links to Atmospheric
Validation of satellite derived snow cover data records with surface networks and m ulti-dataset inter-comparisons
 Validation of satellite derived snow cover data records with surface networks and m ulti-dataset inter-comparisons Chris Derksen Climate Research Division Environment Canada Thanks to our data providers:
Observing Snow: Conventional Measurements, Satellite and Airborne Remote Sensing. Chris Derksen Climate Research Division, ECCC
 Observing Snow: Conventional Measurements, Satellite and Airborne Remote Sensing Chris Derksen Climate Research Division, ECCC Outline Three Snow Lectures: 1. Why you should care about snow 2. How we measure
Bias correction of global daily rain gauge measurements
 Bias correction of global daily rain gauge measurements M. Ungersböck 1,F.Rubel 1,T.Fuchs 2,andB.Rudolf 2 1 Working Group Biometeorology, University of Veterinary Medicine Vienna 2 Global Precipitation
Central Asia Regional Flash Flood Guidance System 4-6 October Hydrologic Research Center A Nonprofit, Public-Benefit Corporation
 http://www.hrcwater.org Central Asia Regional Flash Flood Guidance System 4-6 October 2016 Hydrologic Research Center A Nonprofit, Public-Benefit Corporation FFGS Snow Components Snow Accumulation and
Discritnination of a wet snow cover using passive tnicrowa ve satellite data
 Annals of Glaciology 17 1993 International Glaciological Society Discritnination of a wet snow cover using passive tnicrowa ve satellite data A. E. WALKER AND B. E. GOODISON Canadian Climate Centre, 4905
NOAA Snow Map Climate Data Record Generated at Rutgers
 NOAA Snow Map Climate Data Record Generated at Rutgers David A. Robinson Rutgers University Piscataway, NJ Snow Watch 2013 Downsview, Ontario January 29, 2013 December 2012 snow extent departures Motivation
APPLICATION OF AN ARCTIC BLOWING SNOW MODEL
 APPLICATION OF AN ARCTIC BLOWING SNOW MODEL J.W. Pomero l, P. ~arsh' and D.M. Gray2 -Hydrology Research Institute Saskatoon, Saskatchewan, Canada S7N 3H5 '~ivision of Hydrology, University of Saskatchewan
Studying snow cover in European Russia with the use of remote sensing methods
 40 Remote Sensing and GIS for Hydrology and Water Resources (IAHS Publ. 368, 2015) (Proceedings RSHS14 and ICGRHWE14, Guangzhou, China, August 2014). Studying snow cover in European Russia with the use
2015 Fall Conditions Report
 2015 Fall Conditions Report Prepared by: Hydrologic Forecast Centre Date: December 21 st, 2015 Table of Contents Table of Figures... ii EXECUTIVE SUMMARY... 1 BACKGROUND... 2 SUMMER AND FALL PRECIPITATION...
Climate Models and Snow: Projections and Predictions, Decades to Days
 Climate Models and Snow: Projections and Predictions, Decades to Days Outline Three Snow Lectures: 1. Why you should care about snow 2. How we measure snow 3. Snow and climate modeling The observational
The Hydrologic Cycle
 The Hydrologic Cycle Monthly precipitation for the central Arctic Ocean based on data from the Russian North Pole manned camps with daily bias adjustments. Raw precipitation totals are shown along with
Terrestrial Snow Cover: Properties, Trends, and Feedbacks. Chris Derksen Climate Research Division, ECCC
 Terrestrial Snow Cover: Properties, Trends, and Feedbacks Chris Derksen Climate Research Division, ECCC Outline Three Snow Lectures: 1. Why you should care about snow: Snow and the cryosphere Classes of
The indicator can be used for awareness raising, evaluation of occurred droughts, forecasting future drought risks and management purposes.
 INDICATOR FACT SHEET SSPI: Standardized SnowPack Index Indicator definition The availability of water in rivers, lakes and ground is mainly related to precipitation. However, in the cold climate when precipitation
Lake ice cover and surface water temperature II: Satellite remote sensing
 Lake ice cover and surface water temperature II: Satellite remote sensing Claude Duguay University of Waterloo (Canada) Earth Observation Summer School ESA-ESRIN, Frascati, Italy (4-14 August 2014) Lecture
The elevations on the interior plateau generally vary between 300 and 650 meters with
 11 2. HYDROLOGICAL SETTING 2.1 Physical Features and Relief Labrador is bounded in the east by the Labrador Sea (Atlantic Ocean), in the west by the watershed divide, and in the south, for the most part,
Hydrologic Forecast Centre Manitoba Infrastructure, Winnipeg, Manitoba. FEBRUARY OUTLOOK REPORT FOR MANITOBA February 23, 2018
 Page 1 of 17 Hydrologic Forecast Centre Manitoba Infrastructure, Winnipeg, Manitoba FEBRUARY OUTLOOK REPORT FOR MANITOBA February 23, 2018 Overview The February Outlook Report prepared by the Hydrologic
Lecture 8: Snow Hydrology
 GEOG415 Lecture 8: Snow Hydrology 8-1 Snow as water resource Snowfall on the mountain ranges is an important source of water in rivers. monthly pcp (mm) 100 50 0 Calgary L. Louise 1 2 3 4 5 6 7 8 9 10
CLIMATE CHANGE AND REGIONAL HYDROLOGY ACROSS THE NORTHEAST US: Evidence of Changes, Model Projections, and Remote Sensing Approaches
 CLIMATE CHANGE AND REGIONAL HYDROLOGY ACROSS THE NORTHEAST US: Evidence of Changes, Model Projections, and Remote Sensing Approaches Michael A. Rawlins Dept of Geosciences University of Massachusetts OUTLINE
Land Data Assimilation at NCEP NLDAS Project Overview, ECMWF HEPEX 2004
 Dag.Lohmann@noaa.gov, Land Data Assimilation at NCEP NLDAS Project Overview, ECMWF HEPEX 2004 Land Data Assimilation at NCEP: Strategic Lessons Learned from the North American Land Data Assimilation System
Evaluation of a New Land Surface Model for JMA-GSM
 Evaluation of a New Land Surface Model for JMA-GSM using CEOP EOP-3 reference site dataset Masayuki Hirai Takuya Sakashita Takayuki Matsumura (Numerical Prediction Division, Japan Meteorological Agency)
Assimilation of Snow and Ice Data (Incomplete list)
") Assimilation of Snow and Ice Data (Incomplete list) Snow/ice Sea ice motion (sat): experimental, climate model Sea ice extent (sat): operational, U.S. Navy PIPs model; Canada; others? Sea ice concentration
Assimilation of Snow and Ice Data (Incomplete list) Snow/ice Sea ice motion (sat): experimental, climate model Sea ice extent (sat): operational, U.S. Navy PIPs model; Canada; others? Sea ice concentration
Extreme Weather and Climate Change: the big picture Alan K. Betts Atmospheric Research Pittsford, VT NESC, Saratoga, NY
 Extreme Weather and Climate Change: the big picture Alan K. Betts Atmospheric Research Pittsford, VT http://alanbetts.com NESC, Saratoga, NY March 10, 2018 Increases in Extreme Weather Last decade: lack
SIMULATION OF SPACEBORNE MICROWAVE RADIOMETER MEASUREMENTS OF SNOW COVER FROM IN-SITU DATA AND EMISSION MODELS
 SIMULATION OF SPACEBORNE MICROWAVE RADIOMETER MEASUREMENTS OF SNOW COVER FROM IN-SITU DATA AND EMISSION MODELS Anna Kontu 1 and Jouni Pulliainen 1 1. Finnish Meteorological Institute, Arctic Research,
Snowfall Detection and Rate Retrieval from ATMS
 Snowfall Detection and Rate Retrieval from ATMS Jun Dong 1, Huan Meng 2, Cezar Kongoli 1, Ralph Ferraro 2, Banghua Yan 2, Nai-Yu Wang 1, Bradley Zavodsky 3 1 University of Maryland/ESSIC/Cooperative Institute
ESA GlobSnow - project overview
 ESA GlobSnow - project overview GCW 1 st Implementation meeting Geneve, 23 Nov. 2011 K. Luojus & J. Pulliainen (FMI) + R. Solberg (NR) Finnish Meteorological Institute 1.12.2011 1 ESA GlobSnow ESA-GlobSnow
Prediction of Snow Water Equivalent in the Snake River Basin
 Hobbs et al. Seasonal Forecasting 1 Jon Hobbs Steve Guimond Nate Snook Meteorology 455 Seasonal Forecasting Prediction of Snow Water Equivalent in the Snake River Basin Abstract Mountainous regions of
Preliminary Runoff Outlook February 2018
 Preliminary Runoff Outlook February 2018 Prepared by: Flow Forecasting & Operations Planning Water Security Agency General Overview The Water Security Agency (WSA) is preparing for 2018 spring runoff including
Snowcover accumulation and soil temperature at sites in the western Canadian Arctic
 Snowcover accumulation and soil temperature at sites in the western Canadian Arctic Philip Marsh 1, C. Cuell 1, S. Endrizzi 1, M. Sturm 2, M. Russell 1, C. Onclin 1, and J. Pomeroy 3 1. National Hydrology
Assimilation of satellite derived soil moisture for weather forecasting
 Assimilation of satellite derived soil moisture for weather forecasting www.cawcr.gov.au Imtiaz Dharssi and Peter Steinle February 2011 SMOS/SMAP workshop, Monash University Summary In preparation of the
Correcting Microwave Precipitation Retrievals for near- Surface Evaporation
 Correcting Microwave Precipitation Retrievals for near- Surface Evaporation The MIT Faculty has made this article openly available. Please share how this access benefits you. Your story matters. Citation
The North American Drought Monitor - The Canadian Perspective -
 The North American Drought Monitor - The Canadian Perspective - Trevor Hadwen National Agroclimate Information Service AAFC-PFRA, Regina Canmore, Alberta March 16-18, 2008 Background The NADM is a cooperative
COUPLING A DISTRIBUTED HYDROLOGICAL MODEL TO REGIONAL CLIMATE MODEL OUTPUT: AN EVALUATION OF EXPERIMENTS FOR THE RHINE BASIN IN EUROPE
 P.1 COUPLING A DISTRIBUTED HYDROLOGICAL MODEL TO REGIONAL CLIMATE MODEL OUTPUT: AN EVALUATION OF EXPERIMENTS FOR THE RHINE BASIN IN EUROPE Jan Kleinn*, Christoph Frei, Joachim Gurtz, Pier Luigi Vidale,
Dual-Frequency Ku- Band Radar Mission Concept for Snow Mass
 Dual-Frequency Ku- Band Radar Mission Concept for Snow Mass Chris Derksen Environment and Climate Change Canada Study Team: Climate Research Division/Meteorological Research Division, ECCC Canadian Space
Hydrologic Forecast Centre Manitoba Infrastructure, Winnipeg, Manitoba. MARCH OUTLOOK REPORT FOR MANITOBA March 23, 2018
 Page 1 of 21 Hydrologic Forecast Centre Manitoba Infrastructure, Winnipeg, Manitoba MARCH OUTLOOK REPORT FOR MANITOBA March 23, 2018 Overview The March Outlook Report prepared by the Hydrologic Forecast
Climate Variability. Eric Salathé. Climate Impacts Group & Department of Atmospheric Sciences University of Washington. Thanks to Nathan Mantua
 Climate Variability Eric Salathé Climate Impacts Group & Department of Atmospheric Sciences University of Washington Thanks to Nathan Mantua Northwest Climate: the mean Factors that influence local/regional
2016 Fall Conditions Report
 2016 Fall Conditions Report Prepared by: Hydrologic Forecast Centre Date: December 13, 2016 Table of Contents TABLE OF FIGURES... ii EXECUTIVE SUMMARY... 1 BACKGROUND... 5 SUMMER AND FALL PRECIPITATION...
ESTIMATING SNOWMELT CONTRIBUTION FROM THE GANGOTRI GLACIER CATCHMENT INTO THE BHAGIRATHI RIVER, INDIA ABSTRACT INTRODUCTION
 ESTIMATING SNOWMELT CONTRIBUTION FROM THE GANGOTRI GLACIER CATCHMENT INTO THE BHAGIRATHI RIVER, INDIA Rodney M. Chai 1, Leigh A. Stearns 2, C. J. van der Veen 1 ABSTRACT The Bhagirathi River emerges from
Assimilation of ASCAT soil wetness
 EWGLAM, October 2010 Assimilation of ASCAT soil wetness Bruce Macpherson, on behalf of Imtiaz Dharssi, Keir Bovis and Clive Jones Contents This presentation covers the following areas ASCAT soil wetness
Development of Innovative Technology to Provide Low-Cost Surface Atmospheric Observations in Data-sparse Regions
 Development of Innovative Technology to Provide Low-Cost Surface Atmospheric Observations in Data-sparse Regions Paul Kucera and Martin Steinson University Corporation for Atmospheric Research/COMET 3D-Printed
2017 Fall Conditions Report
 2017 Fall Conditions Report Prepared by: Hydrologic Forecast Centre Date: November 15, 2017 Table of Contents TABLE OF FIGURES... ii EXECUTIVE SUMMARY... 1 BACKGROUND... 4 SUMMER AND FALL PRECIPITATION...
ASSESSMENT OF NORTHERN HEMISPHERE SWE DATASETS IN THE ESA SNOWPEX INITIATIVE
 ASSESSMENT OF NORTHERN HEMISPHERE SWE DATASETS IN THE ESA SNOWPEX INITIATIVE Kari Luojus 1), Jouni Pulliainen 1), Matias Takala 1), Juha Lemmetyinen 1), Chris Derksen 2), Lawrence Mudryk 2), Michael Kern
Validation of passive microwave snow algorithms
 Remote Sensing and Hydrology 2000 (Proceedings of a symposium held at Santa Fe, New Mexico, USA, April 2000). IAHS Publ. no. 267, 2001. 87 Validation of passive microwave snow algorithms RICHARD L. ARMSTRONG
Snow Cover Applications: Major Gaps in Current EO Measurement Capabilities
 Snow Cover Applications: Major Gaps in Current EO Measurement Capabilities Thomas NAGLER ENVEO Environmental Earth Observation IT GmbH INNSBRUCK, AUSTRIA Polar and Snow Cover Applications User Requirements
Passive Microwave Sea Ice Concentration Climate Data Record
 Passive Microwave Sea Ice Concentration Climate Data Record 1. Intent of This Document and POC 1a) This document is intended for users who wish to compare satellite derived observations with climate model
1 What Is Climate? TAKE A LOOK 2. Explain Why do areas near the equator tend to have high temperatures?
 CHAPTER 17 1 What Is Climate? SECTION Climate BEFORE YOU READ After you read this section, you should be able to answer these questions: What is climate? What factors affect climate? How do climates differ
Condensing Massive Satellite Datasets For Rapid Interactive Analysis
 Condensing Massive Satellite Datasets For Rapid Interactive Analysis Glenn Grant University of Colorado, Boulder With: David Gallaher 1,2, Qin Lv 1, G. Campbell 2, Cathy Fowler 2, Qi Liu 1, Chao Chen 1,
A comparison of modeled, remotely sensed, and measured snow water equivalent in the northern Great Plains
 WATER RESOURCES RESEARCH, VOL. 39, NO. 8, 1209, doi:10.1029/2002wr001782, 2003 A comparison of modeled, remotely sensed, and measured snow water equivalent in the northern Great Plains Thomas L. Mote and
Coupling Climate to Clouds, Precipitation and Snow
 Coupling Climate to Clouds, Precipitation and Snow Alan K. Betts akbetts@aol.com http://alanbetts.com Co-authors: Ray Desjardins, Devon Worth Agriculture and Agri-Food Canada Shusen Wang and Junhua Li
Remote sensing of snow at SYKE Sari Metsämäki
 Remote sensing of snow at SYKE 2011-01-21 Sari Metsämäki Activities in different projects Snow extent product in ESA DUE-project GlobSnow Long term datasets (15-30 years) on Snow Extent (SE) and Snow Water
ADVANCEMENTS IN SNOW MONITORING
 Polar Space Task Group ADVANCEMENTS IN SNOW MONITORING Thomas Nagler, ENVEO IT GmbH, Innsbruck, Austria Outline Towards a pan-european Multi-sensor Snow Product SnowPEx Summary Upcoming activities SEOM
Analysis of Antarctic Sea Ice Extent based on NIC and AMSR-E data Burcu Cicek and Penelope Wagner
 Analysis of Antarctic Sea Ice Extent based on NIC and AMSR-E data Burcu Cicek and Penelope Wagner 1. Abstract The extent of the Antarctica sea ice is not accurately defined only using low resolution microwave
Fire Season Prediction for Canada, Kerry Anderson Canadian Forest Service
 Fire Season Prediction for Canada, 2014 Kerry Anderson Canadian Forest Service 1 Introduction The Canadian Forest Service is now presenting monthly and seasonal forecast maps through the Canadian Wildland
Land Surface: Snow Emanuel Dutra
 Land Surface: Snow Emanuel Dutra emanuel.dutra@ecmwf.int Slide 1 Parameterizations training course 2015, Land-surface: Snow ECMWF Outline Snow in the climate system, an overview: Observations; Modeling;
Souris River Basin Spring Runoff Outlook As of March 1, 2019
 Souris River Basin Spring Runoff Outlook As of March 1, 2019 Prepared by: Flow Forecasting & Operations Planning Water Security Agency Basin Conditions Summer rainfall in 2018 over the Saskatchewan portion
Remote Sensing of Snow GEOG 454 / 654
 Remote Sensing of Snow GEOG 454 / 654 What crysopheric questions can RS help to answer? 2 o Where is snow lying? (Snow-covered area or extent) o How much is there? o How rapidly is it melting? (Area, depth,
Alaska Statewide Climate Summary June 2018
 Alaska Statewide Climate Summary June 2018 The following report provides an overview of temperature and precipitation for June 2018. The report is based on preliminary data from selected weather stations
Gauge Undercatch of Two Common Snowfall Gauges in a Prairie Environment
 64 th EASTERN SNOW CONFERENCE St. John s, Newfoundland, Canada 2007 Gauge Undercatch of Two Common Snowfall Gauges in a Prairie Environment JIMMY P. MACDONALD 1 AND JOHN W. POMEROY 1 ABSTRACT Accurate
Regional Climate Change: Current Impacts and Perspectives Greater Lake Nipissing Stewardship Council Annual Meeting Wednesday April 16, 2014
 Regional Climate Change: Current Impacts and Perspectives Greater Lake Nipissing Stewardship Council Annual Meeting Wednesday April 16, 2014 Speaker: Peter Bullock, Stantec Consulting Information Source:
The National Operational Hydrologic Remote Sensing Center Operational Snow Analysis
 The National Operational Hydrologic Remote Sensing Center Operational Snow Analysis World Meteorological Organization Global Cryosphere Watch Snow-Watch Workshop Session 3: Snow Analysis Products Andrew
SMAP and SMOS Integrated Soil Moisture Validation. T. J. Jackson USDA ARS
 SMAP and SMOS Integrated Soil Moisture Validation T. J. Jackson USDA ARS Perspective Linkage of SMOS and SMAP soil moisture calibration and validation will have short and long term benefits for both missions.
Regional offline land surface simulations over eastern Canada using CLASS. Diana Verseghy Climate Research Division Environment Canada
 Regional offline land surface simulations over eastern Canada using CLASS Diana Verseghy Climate Research Division Environment Canada The Canadian Land Surface Scheme (CLASS) Originally developed for the
Application of a Comprehensive Bias-Correction Model to Precipitation Measured at Russian North Pole Drifting Stations
 700 JOURNAL OF HYDROMETEOROLOGY VOLUME 3 Application of a Comprehensive Bias-Correction Model to Precipitation Measured at Russian North Pole Drifting Stations ESFIR G. BOGDANOVA, BORIS M. ILYIN, AND IRINA
A Comparison of A MSR-E/Aqua Snow Products with in situ Observations and M O DIS Snow Cover Products in the Mackenzie River Basin, Canada
 Remote Sensing 2010, 2, 2313-2322; doi:10.3390/rs2102313 Letter OPE N A C C ESS Remote Sensing ISSN 2072-4292 www.mdpi.com/journal/remotesensing A Comparison of A MSR-E/Aqua Snow Products with in situ
Lake Tahoe Watershed Model. Lessons Learned through the Model Development Process
 Lake Tahoe Watershed Model Lessons Learned through the Model Development Process Presentation Outline Discussion of Project Objectives Model Configuration/Special Considerations Data and Research Integration
Presentation of met.no s experience and expertise related to high resolution reanalysis
 Presentation of met.no s experience and expertise related to high resolution reanalysis Oyvind Saetra, Ole Einar Tveito, Harald Schyberg and Lars Anders Breivik Norwegian Meteorological Institute Daily
A Report on a Statistical Model to Forecast Seasonal Inflows to Cowichan Lake
 A Report on a Statistical Model to Forecast Seasonal Inflows to Cowichan Lake Prepared by: Allan Chapman, MSc, PGeo Hydrologist, Chapman Geoscience Ltd., and Former Head, BC River Forecast Centre Victoria
IPWG s Potential Role in a Snow Hydrology Mission
 IPWG s Potential Role in a Snow Hydrology Mission Chris Kidd The University of Birmingham Birmingham, United Kingdom International Precipitation Working Group Ralph Ferraro NOAA/NESDIS College Park, MD
Great Lakes Update. Volume 199: 2017 Annual Summary. Background
 Great Lakes Update Volume 199: 2017 Annual Summary Background The U.S. Army Corps of Engineers (USACE) tracks and forecasts the water levels of each of the Great Lakes. This report is primarily focused
Intercomparison of Snow Extent Products from Earth Observation Data
 Intercomparison of Snow Extent Products from Earth Observation Data, Elisabeth Ripper, Gabriele Bippus, Helmut Rott FMI Richard Fernandes Kari Luojus Sari Metsämäki Dorothy Hall David Robinson Bojan Bojkov
GCOM-W1 now on the A-Train
 GCOM-W1 now on the A-Train GCOM-W1 Global Change Observation Mission-Water Taikan Oki, K. Imaoka, and M. Kachi JAXA/EORC (& IIS/The University of Tokyo) Mini-Workshop on A-Train Science, March 8 th, 2013
THE ROLE OF MICROSTRUCTURE IN FORWARD MODELING AND DATA ASSIMILATION SCHEMES: A CASE STUDY IN THE KERN RIVER, SIERRA NEVADA, USA
 MICHAEL DURAND (DURAND.8@OSU.EDU), DONGYUE LI, STEVE MARGULIS Photo: Danielle Perrot THE ROLE OF MICROSTRUCTURE IN FORWARD MODELING AND DATA ASSIMILATION SCHEMES: A CASE STUDY IN THE KERN RIVER, SIERRA
Snowfall Measurement Challenges WMO SPICE Solid Precipitation Intercomparison Experiment
 WMO World Meteorological Organization Working together in weather, climate and water Snowfall Measurement Challenges WMO SPICE Solid Precipitation Intercomparison Experiment Global Cryosphere Watch Snow
Inter-linkage case study in Pakistan
 7 th GEOSS Asia Pacific Symposium GEOSS AWCI Parallel Session: 26-28 May, 2014, Tokyo, Japan Inter-linkage case study in Pakistan Snow and glaciermelt runoff modeling in Upper Indus Basin of Pakistan Maheswor
Flood Forecasting Tools for Ungauged Streams in Alberta: Status and Lessons from the Flood of 2013
 Flood Forecasting Tools for Ungauged Streams in Alberta: Status and Lessons from the Flood of 2013 John Pomeroy, Xing Fang, Kevin Shook, Tom Brown Centre for Hydrology, University of Saskatchewan, Saskatoon
ASimultaneousRadiometricand Gravimetric Framework
 Towards Multisensor Snow Assimilation: ASimultaneousRadiometricand Gravimetric Framework Assistant Professor, University of Maryland Department of Civil and Environmental Engineering September 8 th, 2014
Coupling of Diurnal Climate to Clouds, Land-use and Snow
 Coupling of Diurnal Climate to Clouds, Land-use and Snow Alan K. Betts akbetts@aol.com http://alanbetts.com Co-authors: Ray Desjardins, Devon Worth, Darrel Cerkowniak Agriculture and Agri-Food Canada Shusen
Using MODIS imagery to validate the spatial representation of snow cover extent obtained from SWAT in a data-scarce Chilean Andean watershed
 Using MODIS imagery to validate the spatial representation of snow cover extent obtained from SWAT in a data-scarce Chilean Andean watershed Alejandra Stehr 1, Oscar Link 2, Mauricio Aguayo 1 1 Centro
Will a warmer world change Queensland s rainfall?
 Will a warmer world change Queensland s rainfall? Nicholas P. Klingaman National Centre for Atmospheric Science-Climate Walker Institute for Climate System Research University of Reading The Walker-QCCCE
Remote Sensing of Precipitation
 Lecture Notes Prepared by Prof. J. Francis Spring 2003 Remote Sensing of Precipitation Primary reference: Chapter 9 of KVH I. Motivation -- why do we need to measure precipitation with remote sensing instruments?
Helsinki Testbed - a contribution to NASA's Global Precipitation Measurement (GPM) mission
 mission") Helsinki Testbed - a contribution to NASA's Global Precipitation Measurement (GPM) mission Ubicasting workshop, September 10, 2008 Jarkko Koskinen, Jarmo Koistinen, Jouni Pulliainen, Elena Saltikoff, David
Helsinki Testbed - a contribution to NASA's Global Precipitation Measurement (GPM) mission Ubicasting workshop, September 10, 2008 Jarkko Koskinen, Jarmo Koistinen, Jouni Pulliainen, Elena Saltikoff, David
Detection of external influence on Northern Hemispheric snow cover
 Detection of external influence on Northern Hemispheric snow cover Tianshu Ma 1, Xuebin Zhang 1,2 Helene Massam 1, Francis Zwiers 3 Georges Monette 1, David Robinson 4 1 Dept. of Mathematics and Statistics,
CFCAS project: Assessment of Water Resources Risk and Vulnerability to Changing Climatic Conditions. Project Report II.
 CFCAS project: Assessment of Water Resources Risk and Vulnerability to Changing Climatic Conditions Project Report II. January 2004 Prepared by and CFCAS Project Team: University of Western Ontario Slobodan
National Oceanic and Atmospheric Administration, USA (3) ABSTRACT
 ABSTRACT") EXAMINATION OF THE PERFORMANCE OF SINGLE ALTER SHIELDED AND UNSHIELDED SNOWGAUGES USING OBSERVATIONS FROM THE MARSHALL FIELD SITE DURING THE SPICE WMO FIELD PROGRAM AND NUMERICAL MODEL SIMULATIONS Roy
EXAMINATION OF THE PERFORMANCE OF SINGLE ALTER SHIELDED AND UNSHIELDED SNOWGAUGES USING OBSERVATIONS FROM THE MARSHALL FIELD SITE DURING THE SPICE WMO FIELD PROGRAM AND NUMERICAL MODEL SIMULATIONS Roy
4. THE HBV MODEL APPLICATION TO THE KASARI CATCHMENT
 Application of HBV model to the Kasari River, 1994 Page 1 of 6 Application of the HBV model to the Kasari river for flow modulation of catchments characterised by specific underlying features by R. Vedom,
Validating a Satellite Microwave Remote Sensing Based Global Record of Daily Landscape Freeze- Thaw Dynamics
 University of Montana ScholarWorks at University of Montana Numerical Terradynamic Simulation Group Publications Numerical Terradynamic Simulation Group 2012 Validating a Satellite Microwave Remote Sensing
Intercomparision of snowfall measured by weighing and tipping bucket precipitation gauges at Jumla Airport, Nepal
 Intercomparision of snowfall measured by weighing and tipping bucket precipitation gauges at Jumla Airport, Nepal Department of Hydrology and Meteorology, Nepal Ministry of Environment, Science and Technology
A two-season impact study of the Navy s WindSat surface wind retrievals in the NCEP global data assimilation system
 A two-season impact study of the Navy s WindSat surface wind retrievals in the NCEP global data assimilation system Li Bi James Jung John Le Marshall 16 April 2008 Outline WindSat overview and working
Some NOAA Products that Address PSTG Satellite Observing Requirements. Jeff Key NOAA/NESDIS Madison, Wisconsin USA
 Some NOAA Products that Address PSTG Satellite Observing Requirements Jeff Key NOAA/NESDIS Madison, Wisconsin USA WMO Polar Space Task Group, 4 th meeting, Greenbelt, 30 September 2014 Relevant Missions
Soil Moisture Prediction and Assimilation
 Soil Moisture Prediction and Assimilation Analysis and Prediction in Agricultural Landscapes Saskatoon, June 19-20, 2007 STEPHANE BELAIR Meteorological Research Division Prediction and Assimilation Atmospheric
Time-series analysis of passive-microwave-derived central North American snow water equivalent imagery
 Annals of Glaciology 34 2002 # International Glaciological Society Time-series analysis of passive-microwave-derived central North American snow water equivalent imagery C. Derksen, 1 A.Walker, 2 E. LeDrew,
Next generation of EUMETSAT microwave imagers and sounders: new opportunities for cloud and precipitation retrieval
 Next generation of EUMETSAT microwave imagers and sounders: new opportunities for cloud and precipitation retrieval Christophe Accadia, Sabatino Di Michele, Vinia Mattioli, Jörg Ackermann, Sreerekha Thonipparambil,
An Overview of Atmospheric Analyses and Reanalyses for Climate
 An Overview of Atmospheric Analyses and Reanalyses for Climate Kevin E. Trenberth NCAR Boulder CO Analysis Data Assimilation merges observations & model predictions to provide a superior state estimate.
1.6 TRENDS AND VARIABILITY OF SNOWFALL AND SNOW COVER ACROSS NORTH AMERICA AND EURASIA. PART 2: WHAT THE DATA SAY
 1.6 TRENDS AND VARIABILITY OF SNOWFALL AND SNOW COVER ACROSS NORTH AMERICA AND EURASIA. PART 2: WHAT THE DATA SAY David A. Robinson* Rutgers University, Department of Geography, Piscataway, New Jersey
NESDIS Global Automated Satellite Snow Product: Current Status and Recent Results Peter Romanov
 NESDIS Global Automated Satellite Snow Product: Current Status and Recent Results Peter Romanov NOAA-CREST, City University of New York (CUNY) Center for Satellite Applications and Research (STAR), NOAA/NESDIS
The Canadian Precipitation Analysis (CaPA) and the Canadian Land Data Assimilation System (CaLDAS)
 and the Canadian Land Data Assimilation System (CaLDAS)") The Canadian Precipitation Analysis (CaPA) and the Canadian Land Data Assimilation System (CaLDAS) Vincent Fortin (and many collaborators) Division de la recherche en météorologie Environnement en Changement
The Canadian Precipitation Analysis (CaPA) and the Canadian Land Data Assimilation System (CaLDAS) Vincent Fortin (and many collaborators) Division de la recherche en météorologie Environnement en Changement
Development of the Canadian Precipitation Analysis (CaPA) and the Canadian Land Data Assimilation System (CaLDAS)
 and the Canadian Land Data Assimilation System (CaLDAS)") Development of the Canadian Precipitation Analysis (CaPA) and the Canadian Land Data Assimilation System (CaLDAS) Marco L. Carrera, Vincent Fortin and Stéphane Bélair Meteorological Research Division Environment
Development of the Canadian Precipitation Analysis (CaPA) and the Canadian Land Data Assimilation System (CaLDAS) Marco L. Carrera, Vincent Fortin and Stéphane Bélair Meteorological Research Division Environment
ECMWF. ECMWF Land Surface Analysis: Current status and developments. P. de Rosnay M. Drusch, K. Scipal, D. Vasiljevic G. Balsamo, J.
 Land Surface Analysis: Current status and developments P. de Rosnay M. Drusch, K. Scipal, D. Vasiljevic G. Balsamo, J. Muñoz Sabater 2 nd Workshop on Remote Sensing and Modeling of Surface Properties,
Funding provided by NOAA Sectoral Applications Research Project CLIMATE. Basic Climatology Colorado Climate Center
 Funding provided by NOAA Sectoral Applications Research Project CLIMATE Basic Climatology Colorado Climate Center Remember These? Factor 1: Our Energy Source Factor 2: Revolution & Tilt Factor 3: Rotation!