Reducing Cold Injury to Grapes Through the Use of Wind Machines
|
|
|
- Melvin Webb
- 6 years ago
- Views:
Transcription
 K.")
1 Reducing Cold Injury to Grapes Through the Use of Wind Machines Final Report: CanAdvance Project # ADV 161; Nov Nov Hugh Fraser, Agricultural Engineer, OMAFRA Ken Slingerland, Tender Fruit & Grape Specialist, OMAFRA Kevin Ker, Research Associate, Brock University (CCOVI) K. Helen Fisher, Department of Plant Agriculture, University of Guelph Ryan Brewster, KCMS Applied Research and Consulting Inc. December 2009
2 ACKNOWLEDGEMENTS The Authors would like to thank the many organizations that supported this four year project. The project was sponsored by the Grape Growers of Ontario (GGO) and the Wine Council of Ontario (WCO). This project was partially funded by CanAdvance, through the Agricultural Adaptation Council of Agriculture and AgriFood Canada (AAFC), and by CRESTech through the Ontario Centres of Excellence. Other funding partners included; Vailmount Vineyards, Ontario Ltd, KCMS Applied Research and Consulting, Agricorp, Ontario Tender Fruit Producers Marketing Board (OTFPMB), and the Niagara Peninsula Fruit and Vegetable Growers Association (NPFVGA). In-kind contributions supporting the project included Ontario Ministry of Agriculture, Food and Rural Affairs (OMAFRA), Brock University (CCOVI), University of Guelph (UG), GGO, KCMS and Agricorp. Researchers heading up the project included Hugh Fraser (Agricultural Engineer) and Ken Slingerland (Tender Fruit and Grape Specialist) from OMAFRA; Kevin Ker from Brock University (CCOVI) and KCMS Consulting, Ryan Brewster from KCMS Consulting; and K. Helen Fisher from the University of Guelph Plant Agriculture. Hernder Farms in Niagara-on-the-Lake and Funk Farms in Lincoln were the cooperating growers working with the above researchers. Stakeholder Steering Committee This Committee was set up early in the project to assist in the information delivery activities. It met three times and included representatives from: GGO, WCO,OTFPMB, Town of Niagara-on-the-Lake, Agricorp, a Virgil resident living beside a wind machine, two grape growers involved in the project and two wind machine suppliers. 2
3 TABLE OF CONTENTS Introduction...1 Cold injury to plants...2 Factors affecting cold hardiness...4 Why do grape growers use wind machines?...5 How do wind machines work?...6 Temperature inversions...7 Spring, winter and fall events...9 Wind machine use during research testing period...16 Factors affecting wind machine operation...17 Measuring bud hardiness and bud survival...21 Noise from wind machines...26 Wind machines and normal farm practice...28 Best management practices...28 Additional reading
4 4
5 INTRODUCTION The trend for the grape and wine industry in recent years has been the planting of more high quality vinifera grapes. Unfortunately, many of these cultivars are sensitive to cold injury from early fall through to the last frost in the spring. The winters of 2003, 2004 and 2005 had sufficiently cold temperatures to result in vine and tender fruit bud and plant injury. There were slightly over ten million vinifera vines in the province of Ontario (approximately 66% of total commercial vines in Ontario) when winter killing temperatures occurred in January of 2005, with the direct result that overall yield of processed grapes declined 54% (56,787 tonnes in 2004 to 26,198 tonnes in 2005), mainly due to winter injury. Tender fruit crops also suffered crop reduction, especially peaches. This indicated a need for research in the grape and tender fruit industries to minimize cold temperature injury in Ontario. In November 2005, an innovative 3-year applied research project was initiated. The goals were to study: whether grape and tender fruit bud hardiness stages varied throughout the dormant season by doing systematic field sampling whether wind machines could take advantage of strong or weak air temperature inversions to prevent/reduce cold injury damage where and how best to operate wind machines by intensively studying a vineyard with one how effects of machine noise might be reduced, especially near urban encroachment areas, and to develop Best Environmental Management Practices (BEMP) information. The project was extended from October 31, 2008 to October 31,
.")

6 COLD INJURY TO PLANTS Plants may be subject to physical injury when exposed to freezing temperatures during the growing season or during the dormant (overwintering) season. Most people are familiar with frost damage when plant tissues are injured during the growing season (early or late). Visible symptoms include cessation of growth, wilting of shoot tips, the browning of leaf tissue, and in late season, cessation of fruit development and maturation (Figure 1). Figure 1. Leaves injured by early fall frost. These leaves are no longer functional and will not contribute in crop maturity or carbohydrate accumulation for overwintering. Plant injury in the dormant period is assessed though examination of the buds for any injury, observed as browning or oxidation of the buds (Figure 2). Injury may also be noticed in spring as excessive shoot growth from the base of the plant due to injury to points above on the trunk (Figure 3). Figure 2. 2 Healthy bud (end of white arrow); injured bud (end of red arrow).

7 Figure 3. Dead trunk tissue (brown, oxidized, white arrow) and vigorous shoot growth (red arrow) below the trunk injury location, as seen the spring following winter injury. Water is the key factor in plant freeze injury, causing ice crystals to form within and between the cells. Cell membranes are damaged, leading to leakage of the cell contents and eventually, cell death. If enough cells die, that portion of the plant will die, leading to significant structural and functional damage. The challenge is assessing existing cold injury during the dormant season and establishing at what critical temperature(s) more injury is likely to take place. Grapes and tree fruits transition from a cold tender to a cold hardy state beginning in the autumn, responding to seasonal changes in temperature, day length and moisture content of the plant tissues. Cold acclimation occurs in two phases, with the first occurring as temperatures decline but remain above 0 o C. During this period, chemical changes occur within the cells to enable them to withstand temperatures below 0 o C (approximately -5 o C to -10 o C). During this first phase, a waxy periderm forms and is visible as the progressive maturation and browning of shoots from the base to the tip. This waxy periderm facilitates dehydration of the internal cells, preventing rehydration of the acclimated tissues by external water. In addition, dormant buds on canes are gradually isolated from the vascular system by the development of an additional impermeable layer below the bud, the bud plate. Waxy scales and dense hairs within the buds also aid in keeping the buds dry during the winter. Throughout this period, carbohydrates are stored in canes, trunks and roots. It is important to understand that wood and cane maturation must occur in sequence, commencing well before the leaves are damaged by the first killing frost and in time to anticipate the onset of winter. The second phase of acclimation occurs as temperatures fall below 0 o C, with tissue hardiness increasing dramatically as daily temperatures continue to decrease throughout the fall and early winter. During this secondary phase, water content within and around cells decreases dramatically. Physiological changes take place within the cells to withstand low temperatures and minimize ice crystal formation. It has been observed that optimum vine hardiness is achieved in mid winter. This level of hardiness is different among grape cultivars and may be achieved at different rates and maintained for different lengths of time during the dormant season. Plants have an inherent chilling or dormancy requirement and must be exposed to specific amounts of cumulative temperatures below 5 o C before they will resume growth the following season. This is known as the chilling requirement and for most tender fruit and grapes in Ontario, this requirement is usually fulfilled by early January. 3
8 Deacclimation is the reversal of acclimation as the plant progresses from a cold hardy to a cold tender state. Deacclimation occurs more rapidly than acclimation, and is primarily dependent on increasing air and soil temperatures. Once vines or trees have achieved physiological chilling requirements to fulfil dormancy, growth could resume if external conditions are suitable for growth. However, each cultivar will resume growth at different rates, which makes it essential to assess multiple cultivars on each sampling date to establish hardiness and bud survival status. Information presented later in this document will demonstrate differences in vine hardiness levels across cultivars and differences of vine hardiness within a cultivar across years. FACTORS AFFECTING COLD HARDINESS As mentioned above, different cultivars will have different rates of acclimation and deacclimation. This is based on vine genotype. This genetic potential determines the optimum level of hardiness that a particular cultivar may achieve. Realization of the hardiness potential is strongly influenced by the environment in which the vine grows (site, soil, topography, proximity to protective geographic features, climatic conditions in season, pest incidence) and grower practices (managing the canopy, fertilization, water management, balanced crop loads, appropriate pruning levels and training systems, rootstock and clonal selection, site preparation and design). All sites have a different potential vine productivity. It is critical that crop levels and vine care are maintained to ensure vine health is optimized and full fruit maturity is achieved. It has been observed that in sites where vines are over cropped, vine balance is not achieved and greater levels of winter injury are noted. Poor air drainage, poor soil drainage and excessive fertilization also affect winter hardiness. Well managed sites nearby with similar cultivars will overwinter with minimal injury. Due to the myriad of factors affecting cold hardiness, it is impossible to predict actual hardiness without taking specific samples during the dormant period (Figure 4). Though the hardiness cycle is somewhat U-shaped from acclimation through deacclimation, data collected during this study showed that cultivar, location and yearly variability exist. Modelling using temperature indices alone is unreliable and risky. Figure 4. The generalized trend of vine acclimation and deacclimation from late season through to bud break the following spring (Zabadal et al, 2007). 4

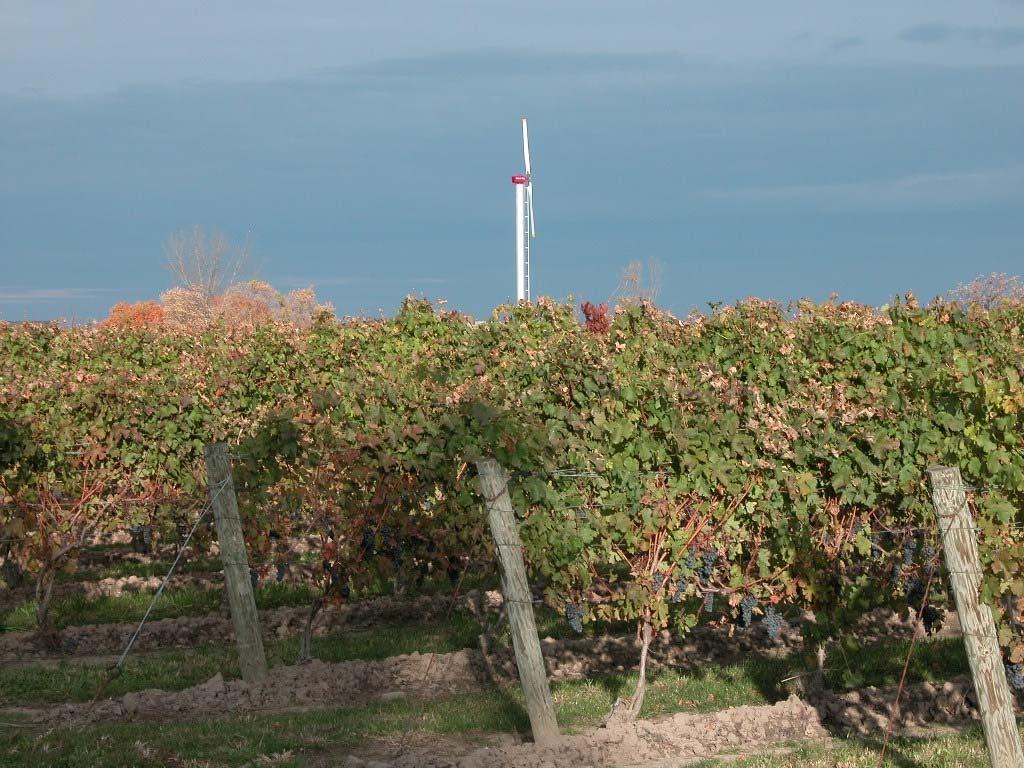
9 WHY DO GRAPE GROWERS USE WIND MACHINES? In Ontario, wind machines are primarily used to protect grapes from cold temperature injury (Figure 5). Market demands have encouraged grape growers to plant more cold sensitive vinifera grapes today than in the past, as there is little demand for cold tolerant cultivars in traditional growing areas. Figure 5. Wind machine in vineyard near Virgil monitored by authors in this research project There are three critical times growers need to protect crops against cold injury: late spring frosts (early growing season) early fall frosts (late growing season) mid winter cold (dormant season) After the significant cold temperatures of January 2005, growers with machines harvested near normal crops that season. Those growers nearby without machines experienced not only total crop failure but also significant plant loss in
10 HOW DO WIND MACHINES WORK? Wind machines are tall, fixed-in-place, engine-driven fans that pull warm air down from high above ground during strong temperature inversions, raising air temperatures around cold-sensitive perennial crops such as grapes and tender fruit trees. They are not the same machine as wind turbines which are designed to create electricity from wind energy. Wind machines help reduce cold injury which can affect the following year s crop as well as long-term plant health. Currently, there are four machine types in Ontario. All are about 10.5 m high (34 ft) from the concrete anchor pad to the blade axis. Blades are m in length (18-20 ft). Blade speeds are RPM, generating huge airflows blowing outward at least m ( ft). Three types of machines have two blades, one has four. The cost to install a wind machine, including the concrete base, is about $36,000 CDN and fuel costs are about $25-$50/h (2009) a. Most Ontario wind machines operate on propane, diesel or natural gas, but in some jurisdictions, gasoline or electricity. All machines work similarly. Fan blades angle 6 o down from vertical. During anticipated cold injury periods with a strong temperature inversion, machines pull warm air from at least 15 m (49 ft) above the field then blow it down and out, pushing away and replacing cold air near target crops (Figure 6). This breaks up microscale air boundary layers over plant surfaces, improving sensible heat transfer from the air to plants. Wind machines transfer heat by forced convection. While the blades spin, the head of the fan rotates around the tower s vertical axis. Air circulates north, east, south, west then back where it started minutes earlier, depending on machine type. The area protected covers 3-5 ha ( ac) depending on topography, field layout, strength of temperature inversion, time of year and drift due to slight winds. If the machine completes this circuit too slowly, cold air can resettle or drift in from cooler areas upstream or upwind of the machine, resulting in crop injury. Synchronizing a group of wind machines to direct air all in the same direction, all at the same time might improve effectiveness, but is not currently done for logistical reasons. Wind machines need to warm up 5-15 minutes before running full speed, and the same time to cool down. It costs about $5,000 (2009) to move a wind machine to a better location, if necessary. This includes the cost of pouring a new concrete pad, dismantling the machine, renting a crane to move it, then reinstalling it. There are extra costs to move a natural gas line. Figure 6. Wind machines pull warm air down from high above crop, blowing it downward and outward. a. Albert Brooks, Lakeview Harvesters, Niagara-on-the-Lake, ON. Personal Communication. November

11 Different machine types have different airflow rates, airflow travel distances, times to sweep around the field and sector angle coverage (Figure 7). This is the wedge of land area feeling air mixing from the fan at any one time. It is calculated by measuring the time air movement occurs at one location compared to one full rotational cycle of 360 o. For example, stand a short distance away from a machine and start a stop watch when first feeling air hit your face. Stop it when you no longer feel the air. If the time is 1 minute and total cycle time is 5 minutes, this is 20% of time, or 20% of 360 o, or 72 o sector angle coverage. Greater angles are better as this gives less time for cold air to resettle. Figure 7. Sector angle describes wedge of land feeling fan air at any time from a wind machine. TEMPERATURE INVERSIONS Temperature inversions are strong if air temperatures 20 m (66 ft) above the field are at least 3 o C (5.4 o F) warmer than at vine level m (2 ft). Strong night-time radiative temperature inversions were confirmed during periods when wind machines might be used below and above the Niagara Escarpment. This occurred when skies were clear and starlit, with minimal wind movement. Inversions are greatly affected by atmospheric wind, even if it is only a slight wind. Wind speeds less than about 7 km/h (4 mph) are necessary for inversions to form and greater than 7 km/h to break up again (Figures 4, 5). Temperature inversions just before wind machines were turned on during this project were generally in the range of 5-7 o C (9-13 o F), but inversions as great as 10 o C (18 o F) were observed. Inversions can develop, dissipate, then redevelop all in the same night as winds rise or fall. So, on rare occasions wind machines might operate for a time, then go off, then operate again in the same night. Wind machines can raise air temperatures around plants by about half the temperature inversion difference. So, in Figure 8, if at 7:15 pm the air temperature at 20 m above the vineyard was -6 o C and the air temperature at m vine level was -13 o C and a wind machine was turned on, you might expect the air temperature at vine level to rise to as high as about -9.5 o C. We also observed that strong temperature inversions occurred above the Escarpment (Figure 9). 7
12 Temperature ( C) Inversion Formation Example January 30, Wind Machine NOT Run 0.625m Temp 1.25m Temp 2.5m Temp 10m Temp 20m Temp 10m Wind Speed Wind Speed (km/h) :00 PM 1:00 PM 2:00 PM 3:00 PM 4:00 PM 5:00 PM 6:00 PM 7:00 PM 8:00 PM 9:00 PM 10:00 PM 11:00 PM Figure 8. This strong temperature inversion below Escarpment near Virgil of about 7 o C between 20 m above and m above ground started forming as winds dropped below 7 km/h at 5:30 pm. The inversion ended when wind speed rose above about 7 km/h at 8:00 pm. A date was chosen when the machine was not operated so the true impact of atmospheric wind would demonstrate its affect Inversion Formation Example January 30, Wind Machine NOT Run (Site Location Above Escarpment South of Jordan) :10:53 PM 1:25:53 PM 2:40:57 PM 3:55:57 PM 5:10:57 PM 6:25:57 PM 7:40:57 PM 8:55:57 PM 10:10:57 PM 11:25:57 PM 35 Temperature ( o C) Wind Speed (km/h) m Temp 1.25 m Temp 2.5 m Temp 10 m Temp 20 m Temp 10 m Wind Speed 7 0 Figure 9. This strong temperature inversion above Escarpment south of Jordan of 4.5 o C between 20 m above ground and m above ground, started forming as winds dropped below 7 km/h at 5 pm the same evening as in Figure 8 (about 23 km SW of other site in Virgil). The inversion at this site was not as strong as the inversion below the Escarpment south of Virgil, a trend noted on other occasions. The inversion dissipated when wind speeds again rose above about 7 km/h at 9 pm. 8
13 Vineyard or orchard air temperatures are often very different from the local or regional forecasts. They don t predict temperatures close to the ground where grape buds or fruit are located and they don t account for low areas where temperatures are often much colder. Temperatures can drop very abruptly, many degrees in just an hour, often right at sunset or sunrise, so predicting exactly if and when a wind machine might need to be operated can be difficult. See Figure 10. Recorded Extreme Air Temperature Drops Over 1 Hour Observed at Grape Vine Level; Winter, Spring and Fall Air Temperature, Vine Level ( O C) Fall: October 18, 2009 Sunset 6:30 pm Air temperature drop 8.2 o C in 1 hour Spring: April 24, 2009 Sunset 8:10 pm Air temperature drop 14.7 o C in 1 hour 4:48 PM 6:00 PM 7:12 PM 8:24 PM 9:36 PM Winter: February 13, 2008 Sunset 5:45 pm Air temperature drop 8.8 o C in 1 hour Time of Day Figure 10. Three events (spring, fall, winter) demonstrate how quickly air temperatures can drop at the m (2 ft) level in a vineyard. In the most extreme case, the air temperature dropped 14.7 o C in one hour on April 24, SPRING, WINTER AND FALL EVENTS Spring Events The effect on ground air temperatures is almost instantaneous after a wind machine is turned on, but air temperatures will vary slightly throughout the area. See Table 1. 9
14 Table 1: Air temperatures over 35 minutes at several vine level locations (0.625 m above ground) compared to 20 m above the vineyard before and after a wind machine started during potential spring frost 18 May Vineyard was below Niagara Escarpment SE of Virgil. Time of Day Wind Machine Status 20 m (66 ft) above vineyard 150 m (500 ft) South of WM (0.625 m level) 75 m (250 ft) South of WM (0.625 m level) 115 m (375 ft) North of WM (0.625 m level) 2:20 am Off 6.1 C 1.6 C 1.7 C 1.5 C 2:25 am Started 6.2 C 1.4 C 1.7 C 1.4 C 2:30 am On 6.1 C 1.2 C 1.5 C 1.5 C 2:35 am On 5.8 C 1.0 C 1.0 C 1.7 C 2:40 am On 5.8 C 0.9 C 1.0 C 2.0 C 2:45 am On 6.1 C 0.9 C 1.3 C 2.2 C 2:50 am On 6.0 C 0.8 C 1.2 C 2.5 C 2:55 am On 6.2 C 0.8 C 1.2 C 2.7 C Note the strong temperature inversion of 4.8 C just before the wind machine started ( = 4.8 C). At 2:20 am temperatures were almost equal around vineyard ( o C). From 2:30 to 2:55 am, the following observations can be made: At 150 m south of the machine temperatures continued to get colder as no warm air could reach there At 75 m south of the machine temperatures dropped, but not as much because of the machine At 115 m north of the machine temperatures were higher because of its influence Note air temperatures high above the vineyard remained almost constant, indicating what might be considered an ocean of warm air above the vineyard. The machine was set to start at 1.5 o C using a sensor 15 m (50 ft) away at 0.5 m (1.6 ft) above ground (sensors can be set in 0.5 o C intervals). The differential was set at 2 o C (3.6 o F) so the machine would turn off if the temperature rose to 3.5 o C (1.5 o + 2 o = 3.5 o C, differentials can be set at 2, 3, 4 or 5 o C). The smaller the differential, the less time the machine operates after temperatures rise. There was a slight SW wind of 4-5 km/h pushing air NE. The vineyard site was level. Figure 11 is a visual look at what happened during the 18 May 2009 spring frost event described above. The following eight maps have coloured temperature contours, showing the effects on air temperatures m above ground around the vineyard before and after the wind machine was started. Each map is 18 ha (44 ac) of land. The wind machine location is noted, but there are adjacent wind machines to west and east just off the map. Air temperatures were taken five minutes apart. View pictures left to right. Figure 11. (Following two pages). Dark blue is coldest at 1 o C at m above ground; dark red is warmest at 2.75 o C, with six variations between. For comparison, the air temperature at Virgil, 2 km away, where there was no wind machine is shown in the bottom right corner, which remained at 1 o C (dark blue) throughout the event. Note the wind direction (southwest) and speed (4-5 km/h). Before and just after the machine was turned on, the entire vineyard hovered around 1.5 o C to 2 o C. The wind machine took a few minutes to revolve around the vineyard, but after 15 minutes (2:40 am), the vineyard warmed considerably. The area of influence was recognizable as downstream of the machine to the north and east since the observed atmospheric wind direction was from the southwest, causing drift (Figure 12) 10


15 2:20 am: Before wind machine started 2:25 am: Wind machine started up warming for few minutes 2:30 am: Wind machine running full speed 2:35 am: Wind machine running full speed 11


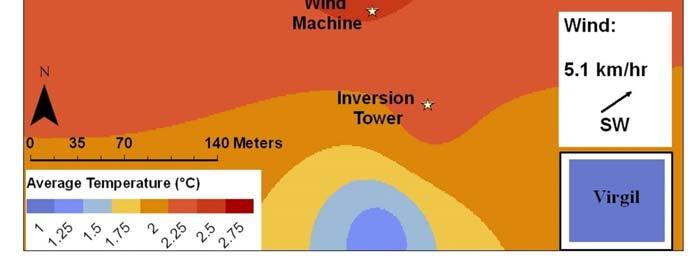

16 2:40 am: Wind machine running full speed 2:45 am: Wind machine running full speed 2:50 am: Wind machine running full speed 2:55 am: Wind machine running full speed 12

17 Even though wind machines blow air outward, mixing it in all directions, their area of influence is not circular as one might expect. The area of influence can be distorted by a combination of land slope and wind direction. Cold air flows down slope like the flow of molasses. In Niagara, below the Escarpment, there is a natural airflow from the base of the Escarpment to Lake Ontario which naturally skews a wind machine s area of influence into an elliptical shape. Even though winds are quite calm when wind machines operate, wind direction appears to also skew the area of influence. If both land slope and wind direction are in the same direction areas of influence will be take on an elliptical shape in that direction. If land slope and wind direction are in opposite directions or at right angles to each other, this again changes the shape of the area of influence. From our research, it appears most of the time when wind machines are used in Niagara winds are from the SW creating the area of influence shape as in Figure 12. Figure 12. In this 18 May 2009 spring frost event map, the area influenced by a wind machine is not always a circle but skewed by the combined effect of the slope of the land and wind direction/speed even though winds are generally very calm when a wind machine is operated. The dotted line is 4 ha (10 ac). Winter Events Similar effects on air temperatures m above ground occur in winter with wind machines as seen in this 13 February 2008 event (Figure 13). In Figure 13, dark blue is the coldest temperature -12 C at m above ground, dark red is warmest at C, with six variations of colour in between. For comparison, the temperature at another site at Virgil (2 km away) where there was no wind machine is shown in the bottom right corner, remaining at -12 C (dark blue) throughout the event. Winds at the test site were consistently from the SSW between about 4-6 km/h. Before the wind machine was turned on at 7:00 pm and just afterward, the entire vineyard hovered around -11 C to -12 C. Within about 15 minutes at 7:15 pm the vineyard had warmed up considerably and the main area of influence is recognizable as being downstream of the wind machine to the north (mainly) and east since winds were from the SSW. See Figure 14. Figure 13. (Following two pages) 13


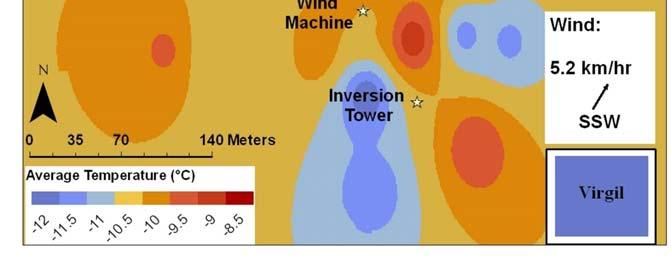
18 6:55 pm: Before wind machine started 7:00 pm: Wind machine started up; warming for a few minutes 7:05 pm: Wind machine running full speed 7:10 pm: Wind machine running full speed 14


19 7:15 pm: Wind machine running full speed 7:20 pm: Wind machine running full speed 7:25 pm: Wind machine running full speed 7:30 pm: Wind machine running full speed 15

20 Figure 14. In this 13 February 2008 winter cold event, the area of influence of the wind machine is skewed by the combined effect of the slope of land and wind direction/speed, even though winds are generally very calm when a wind machine is operated. However, because the wind direction was more from the SSW, the area of influence aligns more with the NNE direction. So, despite winds appearing quite calm, it appears its speed and direction has a great influence on what is protected. The dotted line is about 4 ha (10 ac) in size. Fall Events Wind machines may be operated to prevent early frost injury in fall to extend harvest dates. At the test site, the wind machine was not used for this purpose during the project. However, the effect of the use of a wind machine to prevent early frost injury at another site in October 2009 can be seen in Figure 15. Grape leaves were still green where protected from frost by the wind machine a few days earlier, while leaves are dead and brown just beyond reach of the wind machine, past about 120 m (394 ft). This protection allowed leaves to continue to photosynthesize for another three weeks, enhancing the quality of the crop and making it much more marketable. Another Niagara grower used his wind machine in late fall 2008 and reported three concentric rings around his machine; the first with dry grape leaves nearest the machine; the second with wet grape leaves further from the machine; the third with frosty leaves furthest from the machine. WIND MACHINE USE DURING RESEARCH TESTING PERIOD During the four year research project, the wind machine at the test site operated 29 times (Table 2). The number of hours each year was less than originally anticipated, with the range 22 to 48. However, it is likely that during the very cold previous winters of 2003, 2004 and 2005 (before this project commenced), wind machines would have operated for longer periods. Each site is different with its unique needs. With experience, growers operate wind machines more precisely with fewer hours, not more. 16

21 Figure 15. View from 6 m up wind machine ladder looking north at a St. David s vineyard. Camera zoomed to look at end of the rows about 137 m (450 ft) from the machine where leaves were frosted. Table 2: Operation of wind machine over four year period December 2005 to November 2009 Winter Spring Fall Totals Number of uses Hours used 29.5 hours 72 hours 39.5 hours 141 hours Average uses/year Average hours/year 7.5 hours 18 hours 10 hours 35.5 hours FACTORS AFFECTING WIND MACHINE OPERATION Wind Speed Wind speed is best measured with a tower and an anemometer placed at 10 m (33 ft) above ground. This is the standard height used by weather forecasters (Figures 16, 17), but they are expensive and impractical for many growers. However, there is a simple rule of thumb for measuring wind speed. In 1805, Sir Francis Beaufort, a British Admiral, created the Beaufort Wind Scale to help sailors estimate wind speeds based on visual observations. It is still used today (Table 3). 17

22 Figure 16. This 20 m tower held air temperature and wind sensors in the test vineyard. Real time air temperatures were monitored every 15 minutes for the first half of the project, every 5 minutes in the latter half, at m, 1.25 m, 2.5 m, 10 m and 20 m above ground (2 to 66 ft) and real time wind speed and direction at 10 m above ground (10 m temperature sensor on left, 10 m wind speed sensor on right). Figure 17. The location of the 20 m tower used to monitor air temperatures and wind speed/direction can be seen as a shadow in this picture and was 55 m (180 ft) southeast of the wind machine. The wind sensor was 10 m (33 ft) above ground on the tower, but because the wind machine fan hub was also at about the same height but blowing air downward, it did not appear to affect the wind sensor readings. 18
23 Table 3: The Beaufort Wind Scale can help estimate wind speeds in order to better understand when not to operate a wind machine Wind; km/h Beaufort Description Visual Observations Use Wind Machine? 2 5 Light air Wind direction is shown by smoke drift, but not by wind vanes 6 12 Light breeze Wind is felt on face; leaves rustle; ordinary wind vanes move Gentle breeze Leaves and small twigs in constant motion; wind extends light flag Moderate breeze Raises dust and loose paper; small branches are moved Yes Yes; but may not be effective No; could damage the blades Never operate machine Dew Point Temperature One tool for understanding when to turn on a wind machine is to be familiar with dew point temperature. It is defined as the temperature at which condensation of water vapour in air first condenses from a gas to a liquid. This is the general property of the air mass in the region a. Dew point temperatures occur at all air temperatures we experience from above 30 o C (86 o F) to below -30 o C (-22 o F). If the dew point occurs above 0 o C (32 o F) it is called dew point, but if it occurs below 0 o C this temperature it is called frost point. If there is a large difference between outside air temperature (called the dry bulb temperature) and the dew point, the air is dry. Conversely, if there is a small difference between outside air temperature (dry bulb temperature) and the dew point, the air is more humid. At 100% relative humidity, the dew point and outside air temperature (dry bulb temperature) are the same. See Table 4. Table 4: Dew point temperatures vs dry bulb temperatures at different relative humidity % Dry Bulb Air Temperature, o C (measured on your thermometer) Dew Point Temperature, o C 0 o C 2 o C 4 o C 6 o C -6 o C 63.9% 55.4% 48.0% 41.8% -4 o C 74.4% 64.4% 55.9% 48.6% -2 o C 86.4% 74.8% 64.9% 56.5% 0 o C 100% 86.6% 75.1% 65.4% 2 o C 100% 86.6% 75.5% 4 o C 100% 87.0% 6 o C 100% For example, using Table 4, if a temperature sensor reads 6 o C and the relative humidity is quite dry at 41.8%, dew point (or frost point) temperature is below freezing at -6 o C. However, if the same air is more humid at 75.5% relative humidity, the dew point temperature is above freezing at 2 o C. During a radiative freeze, infrared radiation is constantly exchanged between the earth and the atmosphere. When the sun sets, objects on the earth s surface, such as grape vines, emit infrared radiation to the atmosphere. This is known as radiational cooling. If the skies are cloudy, the water vapour in the air absorbs and re-emits the infrared radiation back to the earth s surface. However, if overnight skies are clear, and winds are calm, more infrared radiation is emitted from the vines than back from the atmosphere. As a result, the vine surfaces become cooler than the air surrounding it. a. Dr. Robert Evans, USDA, Agricultural Research Service, Sidney, MT. Personal communication on dew point. 17 Dec
24 It is important to understand that when water condenses on a surface (such as a grape bud), it releases a lot of heat and this is helpful in protecting your crop from cold temperature injury. This heat is called the latent heat of condensation and the air is literally filled with a reservoir of this heat that can potentially provide great quantities of free heat to a crop. When water condenses, 2510 kj/l at 0 o C (9000 BTU/US Gal at 32 o F) is directly released on the object or into the air where that condensation occurs. This heat is often more than enough to sufficiently replace the heat lost through radiation to the dark night time sky, and averting further temperature decreases, at least temporarily. Exposed plant tissues only have to be very slightly below the dew point temperature in order for water to condense on these tissues. If these tissues are exposed to the dark, night time clear sky during a radiative freeze, they can be 1 o C to 2 o C colder than the surrounding ambient air and so will reach the dew point before the air surrounding them. So, water condenses on these tissues, releasing heat and keeping the tissues at, or very near, the dew point temperature. This condensation of water/release of heat from that water continues to occur throughout the night and heat continues to radiate out to the clear sky. You might consider this condensation/release of heat energy on the tissue surfaces as Mother Nature s spontaneous assistance to plants in fighting frost. If the dew point is only a few degrees above the critical crop damaging temperatures, there is little likelihood of damage to that crop. The dew point basically establishes the minimum expected air temperature for the night period because once you reach the dew point, it drops very slowly as more water is condensed and releases heat to the air and anything else it is in contact with, such as a grape bud. However, if the dew point is at, or a few degrees below the critical crop damaging temperatures, this is different. Some intervention method to protect the crop through the use of wind machines, or even adding heat to make up the difference between dew point and critical temperatures may be needed. You do not always reach the dew point temperatures during these events, but you need to be ready to intervene if necessary. Fortunately, most radiation frosts in spring and fall have fairly high dew points near the critical crop damaging temperatures, so heat released through condensation may be all that s needed. Wind mixes the colder air mass near the crop caused by radiation cooling with the warmer air mass high above the crop. It evens out the air temperature profile so air is warmer near the crop, even as the crop continues to radiate heat to the night time sky. Water vapour content of air between the ground and 30 m (100 ft) above ground does not vary much, even with natural wind or air movement by a wind machine. Low, damaging dew points occur more often in drier climates where grapes are grown in California or Washington because the air is very dry, but they can also occur in Ontario. If the dewpoint is below the critical crop damaging temperature, you may want to turn on a wind machine sooner to keep the plant as warm as possible to reduce the 1 to 2 o C cooler temperatures of plant surfaces compared to air around it as described above. Hopefully, this will keep the plant as close to the air ambient temperature as possible, and allow you to outlast the rate of temperature drop throughout the night until the sun comes up. Measuring dew point temperature accurately is not easy and expensive. It can be calculated knowing the relative humidity (RH) and dry bulb temperature, but RH is also not easy to measure accurately especially at low dry bulb temperatures. If dew point temperature was predicted on a site specific or regional basis, this would assist growers in better knowing if and when they might operate their machines. If forecasted dew point was below critical air temperatures, wind machines might need to be operated. If forecasted dew point was above critical air temperatures, wind machines might not need to be operated. An alternative is to measure wet bulb temperature, the lowest temperature reached by evaporation of water only. It s the temperature you feel when your skin is wet and exposed to moving air and is between dry bulb and dew point. In Table 3, at -2 o C dew point, 0 o C dry bulb and 86.4% RH, the wet bulb temperature is -0.8 o C. This is about 40% of the difference between dry bulb and dew point, lower than dry bulb. That is, the difference between dry bulb and dew point is 2 o C, so the wet bulb at -0.8 o C is 40% of this less 20


25 than dry bulb. At temperatures around 0 o C and at typical RH values, wet bulb temperature is consistently about 35% to 45% of this difference less than dry bulb. Wet bulb temperature is easier and less costly to measure than dew point, using sophisticated but available equipment, so this might be a viable alternative. MEASURING BUD HARDINESS AND BUD SURVIVAL Thermal Analysis/Freezing Studies A system for differential thermal analysis (DTA) was constructed to assess cold hardiness of grapevine buds (Figure 18). The system was based upon one developed and used at Washington State University, Prosser, WA, with similar systems being used at other research facilities in the US and Canada. This unit incorporates a specially designed sample chamber with a commercially available programmable freezer and a data acquisition system (DAS). Grapevine buds avoid cold temperature damage by avoiding ice crystal formation. Damage quickly occurs when ice crystals form. The conversion of supercooled water to ice (latent heat of condensation) is being measured using this system. When water freezes, heat is released in an exothermic reaction. By using sensitive thermoelectric modules (TEM), we are able to identify these heat loss or freezing episodes during a controlled freezing test. A high-temperature exotherm (HTE) is when the inter-cellular (between cells) water freezes. This freezing event often occurs at temperatures between -2 o C and -8 o C and does not cause bud injury (Figure 19). As the temperature declines, a low temperature exotherm (LTE) occurs and indicates the freezing of intracellular water (within cells). These LTEs contain much smaller exotherm spikes (less water freezing), but typically result in bud death (Figure 20). Figure 18. Differential thermal analysis (DTA) system programmable freezing chamber and loaded sample tray. Note the freezer is holding the maximum six sample trays per cycle. Cooling started at 4 o C, then air temperatures were dropped slowly (4 o C/h) over 12 hours to -40 o C. Signals from the sample trays are transmitted to a multimeter (located on the top of the chamber), automatically converted to temperatures and loaded into an Excel spreadsheet. 21
26 Figure 19. High Temperature Exotherms (HTE) from a Chardonnay sample on December 4, Graph represents five sensors (TEMs) containing five buds. The height of the spikes is relative to the amount of water freezing. Buds are placed on a moist membrane which contributes to the HTE. Figure 20. Low Temperature Exotherms (LTE) from a Chardonnay sample collected on December 4, Much smaller spikes with each spike indicate a bud killing event. Data from this sample resulted in a LTE50 of o C. This DTA system was designed to test up to 54 samples of five buds simultaneously (6 sample trays with 9 wells available per tray) in the programmable freezer. For this study one cultivar sample was analysed per tray. Therefore, with one DTA system, we had capacity to analyse 6 cultivars per sequence. The data was analysed and recorded as LTE 50 which is the temperature at which 50% of the buds are killed. 22
27 Cultivar and Annual Differences in Hardiness Grapevine genetics play an important role in the level of cold hardiness a particular cultivar can achieve (Figure 21). The lineage of a particular cultivar can give clues to its potential cold hardiness, however several environmental factors are also involved in determining their eventual mid-winter hardiness. Furthermore, management decisions can significantly impact cold hardiness. Environmental conditions can range dramatically year to year in Ontario and many of the critical management decisions are based heavily on the environmental conditions experienced during each growing season. Since these two factors fluctuate each year, it is not surprising to see annual differences in bud hardiness (Figures 22 and 23). Figure 21. LTE50 values of three cultivars sampled from the same vineyard in 2008/09. Trend lines were generated from 16 sample dates. Note that Pinot Noir is the hardiest cultivar of the three displayed and the rates of acclimation are all similar. Figure 22. LTE50 values of the same cultivar (Merlot) and vineyard location. Graph representing annual hardiness difference between 2007/08 and 2008/09. Trend lines were generated from 19 sample dates. Similar acclimation and deacclimation rates were achieved however maximum hardiness differed between years. 23
28 Figure 23. LTE50 values of the same cultivar (Riesling) and vineyard location. Trend lines were generated from 19 sample dates. Very different rates of acclimation occurred, however similar mid-winter hardiness levels and deacclimation rates were achieved. When reviewing multi-year data in the tested cultivars, it appears buds were generally capable of withstanding lower absolute winter temperatures in 2007/08 compared to 2008/09. The 2007 growing year was hot and dry with drought-like conditions in most areas. Many vineyards and vines had below average crop levels, but the grapes were high in quality. The lower crop load may have enabled the vines to store more reserves in shoots, trunks and roots and resulted in good hardiness for the winter of 2007/08. The 2008 growing season was cooler than average with precipitation levels for the entire year being 15% above normal levels. This resulted in greater disease problems and barely adequate fruit quality. In addition, the 2008 yields per vine were higher than average. High crop yields and adverse weather patterns in 2008 appeared to have a negative impact on bud hardiness (less tolerant of low temperatures) when measured during the winter of 2008/09 (Table 5). Table 5: Grapevine cultivar bud hardiness ratings based on LTE50 data collected using differential thermal analysis from Jan. 1 to Feb. 15, Dates were selected to indicate maximum bud hardiness. Cold Hardiness Class Range of Critical Low Temperatures C Cultivars Very Tender C to C Sauvignon Blanc, Syrah, Merlot Tender Hardy C to C C to C Cabernet Franc, Cabernet Sauvignon, Gewurztraminer, Chardonnay Gamay, Pinot Blanc, Pinot Gris, Pinot Noir, Vidal, Riesling Very Hardy C to C Baco, Foch 24
.")
 of bud meristems (growing points) that occurs after low temperature injury.")
29 Assessment of Wind Machine Effectiveness (Bud Sampling) Grape bud survival was estimated by cutting buds sampled at frequent intervals throughout the dormant season. During this period, we collected 112 samples every two weeks at 31 vineyards across 8 identified growing regions in Niagara (Figures 24 and 25). This was also an opportunity to collect samples from a number of vineyard locations to assess the effects that wind machines may have had after cold events. This method is very commonly used and is based on discolouration (browning or oxidation of injured cells) of bud meristems (growing points) that occurs after low temperature injury. Healthy bud meristems maintain their green colour, while injured cells rupture from ice crystal formation and turn brown after being exposed to above freezing temperatures. Samples were collected in the field then placed at room temperature for hours to allow the oxidative browning process to take place. Results were posted on various industry websites for anyone to review (Table 6). Figure 24. Niagara regional sampling zones used for bud survival sampling. Figure 25. Every two weeks, representative grape canes were harvested and their buds were prepared for freezing. 25
30 Table 6: Vinifera bud survival results (% live primary buds) from samples collected during the week of April 13, NS means no samples taken from that area. Some results are displayed as a range since more than one sample was analysed from that sampling zone. Cultivar Location East of Canal West of Canal Cabernet Franc Bench 70-92% 33-56% Central Lakeshore Parkway NS Vinemount NS 46 Cabernet Sauvignon Central NS 87 Lakeshore NS 77 Parkway 80 NS Chardonnay Bench Central Lakeshore 81 NS Parkway NS Vinemount NS 62 Merlot Bench Central Lakeshore Parkway 66 NS Vinemount NS 83 Pinot Noir Bench Central Lakeshore Parkway 94 NS Vinemount NS 62 Riesling Bench Central Lakeshore Parkway NS Vinemount NS 82 Sauvignon Blanc Central Lakeshore 80 NS Syrah Lakeshore NS 43 NOISE FROM WIND MACHINES Many neighbours do not like the noise of wind machines. They describe it like a helicopter, whining, or thumping sound, or that their windows or dishes vibrate. Wind machines need large engines operating at high RPM and long pitched blades to blow air a long distance. It is difficult to make wind machines quieter. Sound comes from the engine and blades as they rotate. Slower blade speed reduces noise, but reduces airflow, meaning more machines are needed to cover the same area. It takes 4.5 to 6.5 minutes for a wind machine to make a full 360 o sweep around the tower, so sound oscillates in intensity in a sinusoidal fashion (Figure 26). Some find this irritating, since it makes them wait in anticipation for the sound to grow louder. Wind machines are upstream machines as they operate with blades upstream of the tower. So, air blows past the tower which also affects the spread of sound waves. 26
31 Generalized Sound Pressure Levels (dba) vs. Time for One Cycle of a Wind Machine With Respect to Receiver Blades Tower Airflow direction Rotation around vineyard 3-5 dba variance Airflow away from receiver dba Airflow at receiver Airflow 90 to receiver 8-11 dba variance Airflow 90 to receiver Time (4.5 to 6.5 minutes, depends on machine) Figure 26. Tests show neighbours hear wind machine sound as varying sinusoidally over time as the blades sweep around the field. Sound levels are greatest when the blades blow air away from the receiver, next greatest when they blow at the receiver. When air is blown perpendicular to the receiver, the sound is greatly reduced. When sound rises by 10 db it is subjectively perceived by people to have doubled in loudness. Conversely, if sound drops 10 db it is subjectively perceived to be half as loud. Conditions outside a house complicate and affect sound movement from wind machines: natural quiet of a cold, rural winter night absence of normal wind sound lack of leafy vegetation on grapes, grass on the ground or leaves in woodlots to muffle sounds bouncing of sound waves off the warmer temperature inversion layer high above ground hard, non-absorbing ground surfaces in winter for sound waves to travel across source of sound being very high above ground simultaneous operation of multiple machines low relative humidity of the cold air Conditions inside homes that complicate and allow external sound waves to penetrate, or be amplified include; large rooms, large windows, hard floors and light construction. Wind machine sound is generally less offensive in small carpeted rooms with heavy thick walls and in areas of the house on the opposite side to the wind machine(s) or in basements. The sound is sometimes partially masked inside a house if there is white noise present such as a radio, television, or ventilation fan operating. Wind machine blades also produce low frequency sound and very low frequency infrasound waves. These travel long distances and may penetrate, or excite, building components of residential structures. Low frequency sound is like the low bass music sounds you might hear in your home when someone next door is playing their stereo, even though you cannot hear the rest of the music. Other familiar examples of low frequency sound occur when waves strike a shore or there are high speed winds. Sound from wind machines manifests itself as sound energy perceived as a nuisance to some people. 27
32 WIND MACHINES AND NORMAL FARM PRACTICE Farmers are protected from nuisance complaints, such as noise, by neighbours provided they are following normal farm practice. The Farming and Food Production Protection Act (FFPPA) 1998 defines normal farm practice as one which: (a) is conducted in a manner consistent with proper and acceptable customs and standards, as established and followed by similar agricultural operations under similar circumstances, or (b) makes use of innovative technology in a manner consistent with proper advanced farm management practices Whether or not a farm practice is considered normal is determined by the Normal Farm Practices Protection Board, a quasi-judicial administrative board appointed by the Provincial Government, but comprised of non-government members. For more information on the Act and the Board, see website: BEST MANAGEMENT PRACTICES The objective of this on-farm research project was to provide the Ontario grape and tender fruit industry with best management practices for operation of wind machines to use them more effectively and minimize nuisance noise for neighbours. Crop hardiness Plants should be managed to maintain optimum health to ensure they are as healthy as possible going into winter The most up-to-date plant hardiness information and critical temperatures should be taken into account when decisions are made to operate a wind machine Wind machines should only operate when there is the possibility of cold injury to crops within the area of influence of the machines Placement Wind machines should be located to take into account the expected skewing effects on their areas of influence by topography and wind direction Wind machines should be located to take into account the location of other adjacent wind machines and other features which might provide some additional cold injury protection such as roads, warm buildings, streams, bush Growers should consider planting crops that are more sensitive to cold injury as far as practical from neighbours, so wind machines can be located further from homes Monitoring Growers should use best local weather available such as Growers should continually monitor for a strong temperature inversion, greater than 3 o C (5.5 o F), as close as practical on or near their farm, so they know if operating their wind machine(s) might provide some plant protection from cold injury. This would include a tower at least 10 m (33 ft) high to monitor temperatures high above the crop Growers should set start-up temperatures for their wind machines based on sensors located within 15 m (50 ft) of each machine, and below the fruiting wire height 28
33 Growers should monitor and automate the start up/operation/shut down of their wind machines using a combination of real-time remote temperature/wind speed/wind machine operation sensing devices and monitoring via cell phones/computers/pagers, etc. Growers should set start-up temperatures as close as practical to expected critical air temperatures: o Spring frost: 2 to 3 o C (36 to 37.5 o F) o Fall frost: 1 to 2 o C (34 to 36 o F) o Winter: Variable based on latest bud hardiness data from freezing trials Growers should set the differential (wind machine stop) temperature 2 o C - 3 o C (3.5 o F 5.4 o F) on their wind machines higher than start temperatures Wind Growers should monitor wind speeds before and during expected cold injury events Growers should not operate wind machines if wind speeds are much higher than 7 km/h (4 mph) as there is unlikely to be a strong temperature inversion or heat above the field to pull down anyway Growers should not operate wind machines if wind speeds are 13 km/h (8 mph), or higher, as this can damage their long, thin blades Growers should never operate wind machines if wind speeds are 21 km/h (13mph), or higher, as this can seriously damage their wind machines Maintenance Growers should maintain machines in good condition with checkups at least annually by; o changing gearbox oil (at tower base and top) o lubricating drive lines and inspecting seals o checking tension of all bolts on tower o inspecting blades and attaching hardware o performing regular engine maintenance; and o keeping booster cables handy for quick use Noise Wind machines should be located as far as practical from the edge of neighbouring homes within agricultural areas, but not closer than 125 m unless best management practices are in use For neighbours living within 125 m of a machine, growers should: o discuss the need for wind machines and how and why they operate o consider creating an early warning system about possible machine on certain nights o give them a 24-hour cell phone number to call o use a Last On, First Off principle for machine(s) Growers should be more diligent in operating wind machines on farms where they do not live, as they are not always there to hear if and how their machines are operating All wind machine engines should have mufflers On-going learning Growers should train and educate all employees who will operate wind machines on the latest best management practices to minimize machine operation 29
34 ADDITIONAL READING Food and Agriculture Organization of the United Nations (FAO), Frost Protection: Fundamentals, Practice and Economics. pp. 2, Volume 1. Fraser, H.W., Gambino, V., and Gambino, T Field Study of the Movement of Sound Produced by Wind Machines in Vineyards in Niagara, ON, Canada. American Society of Agricultural and Biological Engineers, Paper Number Fraser, H.W., Slingerland, K., Ker, K., Fisher, H.K., Brewser, R. Wind Machines for Minimizing Cold Injury. Infosheet. Ontario Ministry of Agriculture, Food and Rural Affairs. February Gambino, V., and Fraser, H.W Characterization of Sound Emitted by Wind Machines Used for Frost Control. Alberta Energy and Utilities Board Noise Conference, May Howell, G Grape cold hardiness: Mechanisms of cold acclimation, mid-winter hardiness maintenance, and spring deacclimation. pp Proceedings of ASEV 50 th, Annual Meeting, June 19-23, Seattle: WA Ker, K.W., Slingerland, K., Fraser, H., and Fisher, K.H Ontario s Experience with Wind Machines for Winter Injury Protection of Grapevines and Tender Fruit. pp Proceedings Understanding & Preventing Freeze Damage in Vineyards Columbia, MO. December 5-6, pp. Mills, L., Ferguson, J., and Keller, M Cold hardiness evaluation of grapevine buds and cane tissues. American Journal of Enology and Viticulture. 57(2): Moran, J. and M. Morgan Meteorology: The Atmosphere and Science of Weather. Prentice Hall Inc., Upper Saddle River, NJ. p Shaw, A.B., A Climatic Assessment of the Niagara Peninsula Viticulture Area of Ontario for the Application of Wind Machines. Journal of Wine Research, Volume 13, Number 2, 1 August 2002, pp (22) Wample, R. And Wolf, T Practical considerations that impact vine cold hardiness. pp in: T. Henick-Kling et al. (Eds), Proceedings of 4 th International Symposium on Cool Climate Enology and Viticulture. July Rochester, NY Zabadal, T., Dami, I., Goffinet, M., Martinson, T., and Chien, M Winter Injury to Grapevines and Methods of Protection. Extension Bulletin E pages. Michigan State University. 30
35 31
36 32
Using Sprinklers to Reduce Freeze Injury to Blueberries
 Using Sprinklers to Reduce Freeze Injury to Blueberries Mark Longstroth Extension Small Fruit Educator Paw Paw, Michigan Cold Front Coming Types of Frost Radiation Clear skies Calm Winds Advective Cold
Cold hardiness in peach floral buds using differential thermal analysis
 THE COLLEGE of AGRICULTURAL SCIENCES Cold hardiness in peach floral buds using differential thermal analysis Ioannis Minas*, David Sterle, Horst Caspari USDA-Plant Hardiness Zones Map Grand Junction, CO
SEASONAL AND DAILY TEMPERATURES
 1 2 3 4 5 6 7 8 9 10 11 12 SEASONAL AND DAILY TEMPERATURES Chapter 3 Earth revolves in elliptical path around sun every 365 days. Earth rotates counterclockwise or eastward every 24 hours. Earth closest
Why the Earth has seasons. Why the Earth has seasons 1/20/11
 Chapter 3 Earth revolves in elliptical path around sun every 365 days. Earth rotates counterclockwise or eastward every 24 hours. Earth closest to Sun (147 million km) in January, farthest from Sun (152
Cold and freeze protection of blueberries in Florida. Dr. Dorota Z. Haman Agricultural and Biological Dept. University of Florida
 Cold and freeze protection of blueberries in Florida Dr. Dorota Z. Haman Agricultural and Biological Dept. University of Florida Frost versus Freeze Frost is a local condition which occurs in your area
Sunlight and Temperature
 Sunlight and Temperature Name Purpose: Study microclimate differences due to sunlight exposure, location, and surface; practice environmental measurements; study natural energy flows; compare measurements;
3 Severe Weather. Critical Thinking
 CHAPTER 2 3 Severe Weather SECTION Understanding Weather BEFORE YOU READ After you read this section, you should be able to answer these questions: What are some types of severe weather? How can you stay
Seasonal & Daily Temperatures
 Seasonal & Daily Temperatures Photo MER Variations in energy input control seasonal and daily temperature fluctuations 1 Cause of the Seasons The tilt of the Earth s axis relative to the plane of its orbit
Science Chapter 13,14,15
 Science 1206 Chapter 13,14,15 1 Weather dynamics is the study of how the motion of water and air causes weather patterns. Energy from the Sun drives the motion of clouds, air, and water. Earth s tilt at
Frost Management. Recommended Practices
 Frost Management Cranberries, like many other temperate crops, are sensitive to below-freezing temperatures during the active growing season. This sensitivity is an important factor in cranberry management.
Guided Notes Weather. Part 1: Weather Factors Temperature Humidity Air Pressure Winds Station Models
 Guided Notes Weather Part 1: Weather Factors Temperature Humidity Air Pressure Winds Station Models. 1. What is weather? Weather: short-term atmospheric conditions in a specific area at a specific time
Road Weather: The Science Behind What You Know
 The Weather Road Weather: The Science Behind What You Know Jon Tarleton Global Roads Marketing Manager Meteorologist Jon.tarleton@vaisala.com Page 2 / date / name / Internal use / Vaisala Weather and Our
3 Weather and Climate
 CHAPTER 22 3 Weather and Climate SECTION The Atmosphere KEY IDEAS As you read this section, keep these questions in mind: What are fronts? What are some types of severe weather? How is climate different
1. Base your answer to the following question on the weather map below, which shows a weather system that is affecting part of the United States.
 1. Base your answer to the following question on the weather map below, which shows a weather system that is affecting part of the United States. Which sequence of events forms the clouds associated with
Three things necessary for weather are Heat, Air, Moisture (HAM) Weather takes place in the Troposphere (The lower part of the atmosphere).
 Weather takes place in the Troposphere (The lower part of the atmosphere).") Grade 5 SCIENCE WEATHER WATCH Name: STUDY NOTES Weather - The condition of the atmosphere with respect to heat/cold, wetness/dryness, clearness/ cloudiness for a period of time. Weather changes over time
Grade 5 SCIENCE WEATHER WATCH Name: STUDY NOTES Weather - The condition of the atmosphere with respect to heat/cold, wetness/dryness, clearness/ cloudiness for a period of time. Weather changes over time
Clouds and Rain Unit (3 pts)
") Name: Section: Clouds and Rain Unit (Topic 8A-2) page 1 Clouds and Rain Unit (3 pts) As air rises, it cools due to the reduction in atmospheric pressure Air mainly consists of oxygen molecules and nitrogen
Name: Section: Clouds and Rain Unit (Topic 8A-2) page 1 Clouds and Rain Unit (3 pts) As air rises, it cools due to the reduction in atmospheric pressure Air mainly consists of oxygen molecules and nitrogen
Ocean s Influence on Weather and Climate
 Earth is often called the Blue Planet because so much of its surface (about 71%) is covered by water. Of all the water on Earth, about 96.5%, is held in the world s oceans. As you can imagine, these oceans
Science 1206 Chapter 1 - Inquiring about Weather
 Science 1206 Chapter 1 - Inquiring about Weather 1.1 - The Atmosphere: Energy Transfer and Properties (pp. 10-25) Weather and the Atmosphere weather the physical conditions of the atmosphere at a specific
Key Concept Weather results from the movement of air masses that differ in temperature and humidity.
 Section 2 Fronts and Weather Key Concept Weather results from the movement of air masses that differ in temperature and humidity. What You Will Learn Differences in pressure, temperature, air movement,
Plant Growth and Development Part I I
 Plant Growth and Development Part I I 1 Simply defined as: making with light Chlorophyll is needed (in the cells) to trap light energy to make sugars and starches Optimum temperature: 65 o F to 85 o F
Understanding Cranberry Frost Hardiness
 40 Understanding Cranberry Frost Hardiness Beth Ann A. Workmaster and Jiwan P. Palta Department of Horticulture University of Wisconsin, Madison, WI 53706 phone: (608) 262-5782 or 262-5350 email: palta@calshp.cals.wisc.edu
Climate versus Weather
 Climate versus Weather What is climate? Climate is the average weather usually taken over a 30-year time period for a particular region and time period. Climate is not the same as weather, but rather,
Name Period 4 th Six Weeks Notes 2013 Weather
 Name Period 4 th Six Weeks Notes 2013 Weather Radiation Convection Currents Winds Jet Streams Energy from the Sun reaches Earth as electromagnetic waves This energy fuels all life on Earth including the
III. Section 3.3 Vertical air motion can cause severe storms
 III. Section 3.3 Vertical air motion can cause severe storms http://www.youtube.com/watch?v=nxwbr60tflg&feature=relmfu A. Thunderstorms form from rising moist air Electrical charges build up near the tops
UNIT 12: THE HYDROLOGIC CYCLE
 UNIT 12: THE HYDROLOGIC CYCLE After Unit 12 you should be able to: o Effectively use the charts Average Chemical Composition of Earth s Crust, Hydrosphere and Troposphere, Selected Properties of Earth
Weather and Climate of the Rogue Valley By Gregory V. Jones, Ph.D., Southern Oregon University
 Weather and Climate of the Rogue Valley By Gregory V. Jones, Ph.D., Southern Oregon University The Rogue Valley region is one of many intermountain valley areas along the west coast of the United States.
Infrared Experiments of Thermal Energy and Heat Transfer
 Infrared Experiments of Thermal Energy and Heat Transfer You will explore thermal energy, thermal equilibrium, heat transfer, and latent heat in a series of hands-on activities augmented by the thermal
4 Forecasting Weather
 CHAPTER 2 4 Forecasting Weather SECTION Understanding Weather BEFORE YOU READ After you read this section, you should be able to answer these questions: What instruments are used to forecast weather? How
1 What Is Climate? TAKE A LOOK 2. Explain Why do areas near the equator tend to have high temperatures?
 CHAPTER 3 1 What Is Climate? SECTION Climate BEFORE YOU READ After you read this section, you should be able to answer these questions: What is climate? What factors affect climate? How do climates differ
ELEMENTARY SCIENCE PROGRAM MATH, SCIENCE & TECHNOLOGY EDUCATION. A Collection of Learning Experiences WEATHER Weather Student Activity Book
 ELEMENTARY SCIENCE PROGRAM MATH, SCIENCE & TECHNOLOGY EDUCATION A Collection of Learning Experiences WEATHER Weather Student Activity Book Name This learning experience activity book is yours to keep.
The Climate of Payne County
 The Climate of Payne County Payne County is part of the Central Great Plains in the west, encompassing some of the best agricultural land in Oklahoma. Payne County is also part of the Crosstimbers in the
2012 Growing Season. Niagara Report. Wayne Heinen
 2012 Growing Season Niagara Report Wayne Heinen Overview The 2012 growing season was a phenomenal one for grapes. Vines entered bud break in good shape following a mild winter. The spring of 2012 was similar
but 2012 was dry Most farmers pulled in a crop
 After a winter that wasn t, conditions late in the year pointed to a return to normal snow and cold conditions Most farmers pulled in a crop but 2012 was dry b y M i k e Wr o b l e w s k i, w e a t h e
2012 will likely be remembered for the significant cold injury damage that occurred to fruit during the spring season. Our scheduled first speaker
 2012 will likely be remembered for the significant cold injury damage that occurred to fruit during the spring season. Our scheduled first speaker this afternoon was unable to attend today. Unable to secure
2008 Growing Season. Niagara Region
 28 Growing Season Niagara Region Weather INnovations Staff November 14, 28 Overview The start of the 28 growing season looked promising. After an extremely dry 27 growing season, soil moisture levels had
Average Weather For Coeur d'alene, Idaho, USA
 Average Weather For Coeur d'alene, Idaho, USA Information courtesy of weatherspark.com Location This report describes the typical weather at the Coeur d'alene Air Terminal (Coeur d'alene, Idaho, United
Section 13-1: Thunderstorms
 Section 13-1: Thunderstorms Chapter 13 Main Idea: The intensity and duration of thunderstorms depend on the local conditions that create them. Air-mass thunderstorm Mountain thunderstorm Sea-breeze thunderstorm
Condensation is the process by which water vapor changes from a gas to a liquid. Clouds form by this process.
 CHAPTER 16 1 Water in the Air SECTION Understanding Weather BEFORE YOU READ After you read this section, you should be able to answer these questions: What is weather? How does water in the air affect
Weather and Climate 1. Elements of the weather
 Weather and Climate 1 affect = to have an effect on, influence, change altitude = the height of a place above the sea axis = the line around which an object rotates certain = special consist of = to be
The Climate of Grady County
 The Climate of Grady County Grady County is part of the Central Great Plains, encompassing some of the best agricultural land in Oklahoma. Average annual precipitation ranges from about 33 inches in northern
merta share with your facility.
 merta share with your facility. Damage to plants during a frost occurs inside the plant - not on the exterior. Annual plants' inner tissue can be irreparably damaged from expanding freezing water. GeM
Section 12. Winter Storms
 Section 12. Winter Storms Contents Why Winter Storms are a Threat...12-1 Hazard Profile...12-1 History of Winter Storms...12-4 People and Property at Risk...12-7 Potential Damages and Losses...12-7 Why
student pretest Stewardship Project middle school (Grades 7-8)
") student pretest Stewardship Project middle school (Grades 7-8) 1. True or False. Solar energy is radiant energy carried through the sun s heat and light. 2. Yes or No. Does solar energy dissipate as it
student pretest Stewardship Project middle school (Grades 7-8) 1. True or False. Solar energy is radiant energy carried through the sun s heat and light. 2. Yes or No. Does solar energy dissipate as it
1 What Is Climate? TAKE A LOOK 2. Explain Why do areas near the equator tend to have high temperatures?
 CHAPTER 17 1 What Is Climate? SECTION Climate BEFORE YOU READ After you read this section, you should be able to answer these questions: What is climate? What factors affect climate? How do climates differ
Science - 4th grade practice test
 Name: Instructions: Bubble the correct answer. Read each choice before marking your answer. Copyright 2000-2002 Measured Progress, All Rights Reserved : Use the picture below to answer question 1. 1. A
What Is Air Temperature?
 2.2 Read What Is Air Temperature? In Learning Set 1, you used a thermometer to measure air temperature. But what exactly was the thermometer measuring? What is different about cold air and warm air that
Warming Earth and its Atmosphere The Diurnal and Seasonal Cycles
 Warming Earth and its Atmosphere The Diurnal and Seasonal Cycles Or, what happens to the energy received from the sun? First We Need to Understand The Ways in Which Heat Can be Transferred in the Atmosphere
2011 Year in Review TORNADOES
 2011 Year in Review The year 2011 had weather events that will be remembered for a long time. Two significant tornado outbreaks in April, widespread damage and power outages from Hurricane Irene in August
Weather 101 Brad Jakubowski Doane College Water
 Weather 101 Fundamental Meteorology for Turf Managers Brad Jakubowski Doane College Do Baseballs Really Fly Farther at Coors Field? In theory, A well struck baseball should travel 10 percent farther at
Multiple Choice Identify the choice that best completes the statement or answers the question.
 CH.15 practice TEST Multiple Choice Identify the choice that best completes the statement or answers the question. 1) The short-term state of the atmosphere is called a) climate. c) water cycle. b) weather.
4 Changes in Climate. TAKE A LOOK 2. Explain Why is more land exposed during glacial periods than at other times?
 Name Class CHAPTER 3 Date Climate 4 Changes in Climate SECTION National Science Education Standards BEFORE YOU READ After you read this section, you should be able to answer these questions: ES 1k, 2a
The Climate of Kiowa County
 The Climate of Kiowa County Kiowa County is part of the Central Great Plains, encompassing some of the best agricultural land in Oklahoma. Average annual precipitation ranges from about 24 inches in northwestern
For most crops, 30% risk is probably too much, but this is for you decide.
 Frost Probabilities Compiled by Dustin Blakey Farm Advisor, Inyo and Mono Counties Frost and Freeze Dates Every year frost will occur at a different date. It is impossible to know exactly when the last
10.1 TEMPERATURE, THERMAL ENERGY AND HEAT Name: Date: Block: (Reference: pp of BC Science 10)
") 10.1 TEMPERATURE, THERMAL ENERGY AND HEAT Name: Date: Block: (Reference: pp. 424-435 of BC Science 10) kinetic molecular theory: explains that matter is made up of tiny that are constantly. These atoms
10.1 TEMPERATURE, THERMAL ENERGY AND HEAT Name: Date: Block: (Reference: pp. 424-435 of BC Science 10) kinetic molecular theory: explains that matter is made up of tiny that are constantly. These atoms
The inputs and outputs of energy within the earth-atmosphere system that determines the net energy available for surface processes is the Energy
 Energy Balance The inputs and outputs of energy within the earth-atmosphere system that determines the net energy available for surface processes is the Energy Balance Electromagnetic Radiation Electromagnetic
Irrigation For Frost Protection Of Strawberries Pam Fisher and Rebecca Shortt Ontario Ministry of Agriculture Food and Rural Affairs
 Irrigation For Frost Protection Of Strawberries Pam Fisher and Rebecca Shortt Ontario Ministry of Agriculture Food and Rural Affairs Summary Frost injury can cause significant damage to strawberry plants,
Climate Change Impact on Air Temperature, Daily Temperature Range, Growing Degree Days, and Spring and Fall Frost Dates In Nebraska
 EXTENSION Know how. Know now. Climate Change Impact on Air Temperature, Daily Temperature Range, Growing Degree Days, and Spring and Fall Frost Dates In Nebraska EC715 Kari E. Skaggs, Research Associate
Weather Notes. Chapter 16, 17, & 18
 Weather Notes Chapter 16, 17, & 18 Weather Weather is the condition of the Earth s atmosphere at a particular place and time Weather It is the movement of energy through the atmosphere Energy comes from
Climate of Columbus. Aaron Wilson. Byrd Polar & Climate Research Center State Climate Office of Ohio.
 Climate of Columbus Aaron Wilson Byrd Polar & Climate Research Center http://bpcrc.osu.edu/greenteam Overview Historical Climatology Climate Change & Impacts Projected Changes Summary 2 Historical Climatology
Plethodontid Monitoring Protocol
 Plethodontid Monitoring Protocol Terrestrial Long-term Fixed Plot Monitoring Program Regional Watershed Monitoring and Reporting November 2011 Report prepared by: Sue Hayes, Project Manager, Terrestrial
according to and water. High atmospheric pressure - Cold dry air is other air so it remains close to the earth, giving weather.
 EARTH'S ATMOSPHERE Composition of the atmosphere - Earth's atmosphere consists of nitrogen ( %), oxygen ( %), small amounts of carbon dioxide, methane, argon, krypton, ozone, neon and other gases such
Where is the tropical zone? What are three biomes found in the tropical zone?
 Name CHAPTER 17 Class Date SECTION 2 The Tropics BEFORE YOU READ After you read this section, you should be able to answer these questions: Where is the tropical zone? What are three biomes found in the
WEATHER. Review Note Cards
 WEATHER Review Note Cards Thermometer Weather instrument that measures air temperature Units include F, C, and K ESRT 13 Sling Psychrometer Weather instrument that measures relative humidity and dewpoint
also known as barometric pressure; weight of the air above the surface of the earth; measured by a barometer air pressure, high
 Weather Vocabulary Vocabulary Term Meaning/Definition air mass * large bodies of air that have the similar properties throughout such as temperature, humidity, and air pressure; causes most of the weather
Lecture 07 February 10, 2010 Water in the Atmosphere: Part 1
 Lecture 07 February 10, 2010 Water in the Atmosphere: Part 1 About Water on the Earth: The Hydrological Cycle Review 3-states of water, phase change and Latent Heat Indices of Water Vapor Content in the
Road Weather: Pavement Forecasting
 Road Weather: Pavement Forecasting By Jon Tarleton Marketing Development Manager Meteorologist Surface Systems, Inc. (SSI ) QTT Quixote Transportation Technologies 314-872-0509 jdt@surface.com 2006 APWA
4 Forecasting Weather
 CHAPTER 16 4 Forecasting Weather SECTION Understanding Weather BEFORE YOU READ After you read this section, you should be able to answer these questions: What instruments are used to forecast weather?
TREES. Functions, structure, physiology
 TREES Functions, structure, physiology Trees in Agroecosystems - 1 Microclimate effects lower soil temperature alter soil moisture reduce temperature fluctuations Maintain or increase soil fertility biological
Tuesday, September 13, 16
 Weather Weather State Objectives 4.c, 4.d, 4.h. Discussion What are some ways in which weather affects your everyday life? Discussion What are some ways in which weather affects your everyday life? What
Which graph best shows the relationship between intensity of insolation and position on the Earth's surface? A) B) C) D)
 B) C) D)") 1. The hottest climates on Earth are located near the Equator because this region A) is usually closest to the Sun B) reflects the greatest amount of insolation C) receives the most hours of daylight D)
1. The hottest climates on Earth are located near the Equator because this region A) is usually closest to the Sun B) reflects the greatest amount of insolation C) receives the most hours of daylight D)
Lesson Overview. Climate. Lesson Overview. 4.1 Climate
 Lesson Overview 4.1 THINK ABOUT IT When you think about climate, you might think of dramatic headlines: Hurricane Katrina floods New Orleans! or Drought parches the Southeast! But big storms and seasonal
Weather is the of the Earth s atmosphere at a place and time. It is the movement of through the atmosphere o Energy comes from the
 Weather Notes Weather Weather is the of the Earth s atmosphere at a place and time It is the movement of through the atmosphere o Energy comes from the The sun is the force that weather The sun s energy
Temperature of body can be increased by doing work on it. Here W = E mgh = E internal
 Heat (C19.1-6, 10) Temperature (T) is measure of average KE of all molecules Internal energy (or Thermal Energy) is sum of total energy of all molecules. Heat is transfer of IE from one body to another.
Forecasting Local Weather
 Forecasting Local Weather Sea/Land Breeze Temperature Dew Fog Frost Snow Thunderstorms Tropical Cyclones Temperatures: Radiation Balance Typical Diurnal Variation of Temperature Min soon after dawn Temp
Meteorology Study Guide
 Name: Date: Meteorology Study Guide 1. Label the following steps in the water cycle diagram. Be sure to include arrows to show the flow of water through the cycle. - Transpiration - Precipitation -Evaporation
Weather: Air Patterns
 Weather: Air Patterns Weather: Air Patterns Weather results from global patterns in the atmosphere interacting with local conditions. You have probably experienced seasonal shifts, such as winter in New
The Climate of Pontotoc County
 The Climate of Pontotoc County Pontotoc County is part of the Crosstimbers. This region is a transition region from the Central Great Plains to the more irregular terrain of southeast Oklahoma. Average
Sixth Grade Science BLOCK 3 ASSESSMENT Heat, Light, and Sound
 Sixth Grade Science BLOCK 3 ASSESSMENT Heat, Light, and Sound 2008-09 Directions: Choose the best answer for each question. Then mark your choice on your answer sheet. 1. Which is the best activity to
A) usually less B) dark colored and rough D) light colored with a smooth surface A) transparency of the atmosphere D) rough, black surface
 usually less B) dark colored and rough D) light colored with a smooth surface A) transparency of the atmosphere D) rough, black surface") 1. Base your answer to the following question on the diagram below which shows two identical houses, A and B, in a city in North Carolina. One house was built on the east side of a factory, and the other
1. Base your answer to the following question on the diagram below which shows two identical houses, A and B, in a city in North Carolina. One house was built on the east side of a factory, and the other
Average Weather In March For Fukuoka, Japan
 Average Weather In March For Fukuoka, Japan Location This report describes the typical weather at the Fukuoka Airport (Fukuoka, Japan) weather station over the course of an average March. It is based on
The Climate of Bryan County
 The Climate of Bryan County Bryan County is part of the Crosstimbers throughout most of the county. The extreme eastern portions of Bryan County are part of the Cypress Swamp and Forest. Average annual
Weather. Weather Patterns
 Weather Weather Patterns What do you think? Read the two statements below and decide whether you agree or disagree with them. Place an A in the Before column if you agree with the statement or a D if you
The Atmosphere of Earth
 The Atmosphere of Earth The probability of a storm can be predicted, but nothing can be done to stop or slow a storm. Understanding the atmosphere may help in predicting weather changes, but it is doubtful
ATMOSPHERE PACKET CHAPTER 22 PAGES Section 1 page 546
 Name: Period: ATMOSPHERE PACKET CHAPTER 22 PAGES 546-564 Section 1 page 546 1. Identify five main components of the atmosphere 2. Explain the cause of atmospheric pressure. 3. Why is atmospheric pressure
Climate change in the U.S. Northeast
 Climate change in the U.S. Northeast By U.S. Environmental Protection Agency, adapted by Newsela staff on 04.10.17 Word Count 1,109 Killington Ski Resort is located in Vermont. As temperatures increase
Using Temperature and Dew Point to Aid Forecasting Springtime Radiational Frost and/or Freezing Temperatures in the NWS La Crosse Service Area
 Using Temperature and Dew Point to Aid Forecasting Springtime Radiational Frost and/or Freezing Temperatures in the NWS La Crosse Service Area WFO La Crosse Climatology Series #21 The formation of radiational
above the land to be warmer, causing convection currents because of the difference in air pressure.
 Name Date Period Earth Science Unit Test Review Sheet Directions: Use my web site and/or your lab book to help to answer the following questions. 1. What type of weather does a low pressure system bring?
Weather and Climate. An Introduction
 Weather and Climate An Introduction Basic Plant Anatomy Leaves Absorbs sunlight to produce glucose for food Roots Supports the plant, absorbs water & minerals Flower Attracting pollinators to help with
Your Task: Read each slide then use the underlined red or underlined information to fill in your organizer.
 Severe Weather: Tornadoes and Hurricanes Thunderstorms and Lightning S6E4 d. Construct an explanation of the relationship between air pressure, weather fronts, and air masses and meteorological events
Definitions Weather and Climate Climates of NYS Weather Climate 2012 Characteristics of Climate Regions of NYS NYS s Climates 1.
 Definitions Climates of NYS Prof. Anthony Grande 2012 Weather and Climate Weather the state of the atmosphere at one point in time. The elements of weather are temperature, t air pressure, wind and moisture.
Page 1. Name:
 Name: 1) As the difference between the dewpoint temperature and the air temperature decreases, the probability of precipitation increases remains the same decreases 2) Which statement best explains why
Chapter 15: Weather and Climate
 Chapter 15: Weather and Climate Multiple Choice Identify the choice that best completes the statement or answers the question. 1. The short-term state of the atmosphere is called a. climate. c. water cycle.
Understanding how vines deal with heat and water deficit
 Understanding how vines deal with heat and water deficit Everard Edwards CSIRO AGRICULTURE & FOOD How hot is too hot? Cell death will occur in any vine tissue beyond a threshold (lethal) temperature cell
The Climate of Seminole County
 The Climate of Seminole County Seminole County is part of the Crosstimbers. This region is a transition region from the Central Great Plains to the more irregular terrain of southeastern Oklahoma. Average
Atmosphere L AY E RS O F T H E AT MOSPHERE
 Atmosphere L AY E RS O F T H E AT MOSPHERE Why is the atmosphere divided into 5 different layers? The atmosphere is divided into five different layers because the atmosphere is not uniform, its properties
Chapter 14 Temperature and Heat
 Nicholas J. Giordano www.cengage.com/physics/giordano Chapter 14 Temperature and Heat Thermodynamics Starting a different area of physics called thermodynamics Thermodynamics focuses on energy rather than
HURRICANES AND TORNADOES
 HURRICANES AND TORNADOES The most severe weather systems are hurricanes and tornadoes. They occur in extremely low pressure systems, or cyclones, when the air spirals rapidly into the center of a low.
Meteorology. Circle the letter that corresponds to the correct answer
 Chapter 3 Worksheet 1 Meteorology Name: Circle the letter that corresponds to the correct answer 1) If the maximum temperature for a particular day is 26 C and the minimum temperature is 14 C, the daily
How strong does wind have to be to topple a garbage can?
 How strong does wind have to be to topple a garbage can? Imagine winds powerful enough to pick up a truck and toss it the length of a football field. Winds of this extreme sometimes happen in a tornado.
Where is the tropical zone? What are three biomes found in the tropical zone?
 Name CHAPTER 3 Class Date Climate 2 The Tropics SECTION BEFORE YOU READ After you read this section, you should be able to answer these questions: Where is the tropical zone? What are three biomes found