The Arctic Climate System GEOG 4271/5271. Mark C. Serreze Department of Geography University of Colorado, Boulder CO
|
|
|
- George Little
- 6 years ago
- Views:
Transcription
1 The Arctic Climate System GEOG 4271/5271 Mark C. Serreze Department of Geography University of Colorado, Boulder CO
2 Why study the Arctic climate system? The fascinating processes that occur in a cold environment with a highly varied landscape and an extreme seasonal cycle in solar radiation The Arctic s role in the global climate system the Arctic as the Northern Hemisphere heat sink A system now in the midst of rapid change that may have climate impacts extending into middle latitudes The growing economic and strategic importance of the Arctic region (increased shipping, natural resource extraction)


3 Annual temperature trends, strongest warming in the Arctic Based on the NASA GISS analysis

4 End-of-summer sea ice extent is declining at a faster rate than expected from climate model simulations From Stroeve et al., 2012


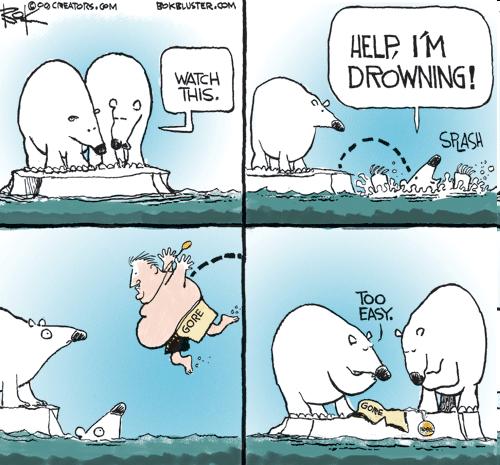
5 Emerging impacts Polar bears and other marine mammals Coastal erosion Access to shipping and oil resources (Beaufort and Chukchi seas)

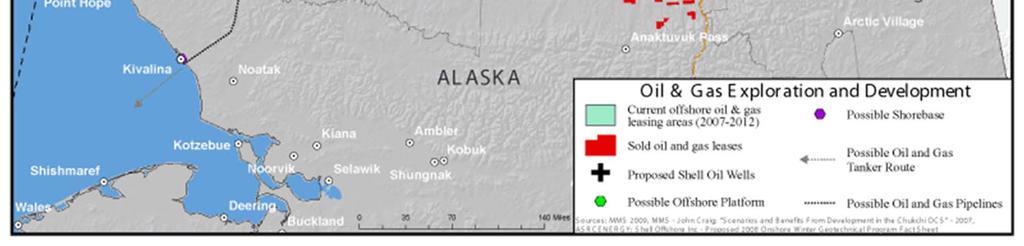
6 Oil and gas development
7
8
9 1) Historical explorations Human migrations by land bridge (Asia to North America) Ship expeditions (1500s onward) -- search for Europe-China trade route; whaling, fishing -- coastal areas mapped in 1700s Late 1700s: earliest scientific observations -- air/ocean temperature -- sea ice from ships -- permafrost temperature Mid-late 1800s: exploration of Greenland, attempts to reach N. Pole (ships stranded in ice; first icebreakers)
10 2) Systematic observations International Polar Years (IPYs) -- First IPY, : 12 Arctic stations established -- Nansen s Fram expedition; ship drifted across Arctic Ocean Iceberg and sea ice monitoring (some regions) began after s, 1920s: Start of aircraft expeditions over Arctic 1930s: Manned stations on Greenland Second IPY, : Northern Sea Route navigated 1930s: Rawinsondes first used for routine profiles above land First Russian drifting ice station in 1937: North Pole 1
11 3) The Modern Era, 1940s onward Network of North American stations (Distant Early Warning line) Russian NP stations 2-31, 1950s-1991 (1-3 always on the ice) -- U.S. has had occasional stations : International Geophysical Year -- Antarctic stations established 1979: International Arctic Buoy Network established 1970s: Satellite remote sensing of sea ice became routine 1990s: Deep ice cores (100,000+ years) from Greenland 1990s-present: the era of programmed science (many field programs with acronyms) : Third International Polar Year -- included cruises, 6-8 multidisciplinary monitoring stations ( intensive observatories )


12 Some famous names and ships Robert Peary The Gjoa The Fram Roald Amundsen Photos courtesy NSIDC


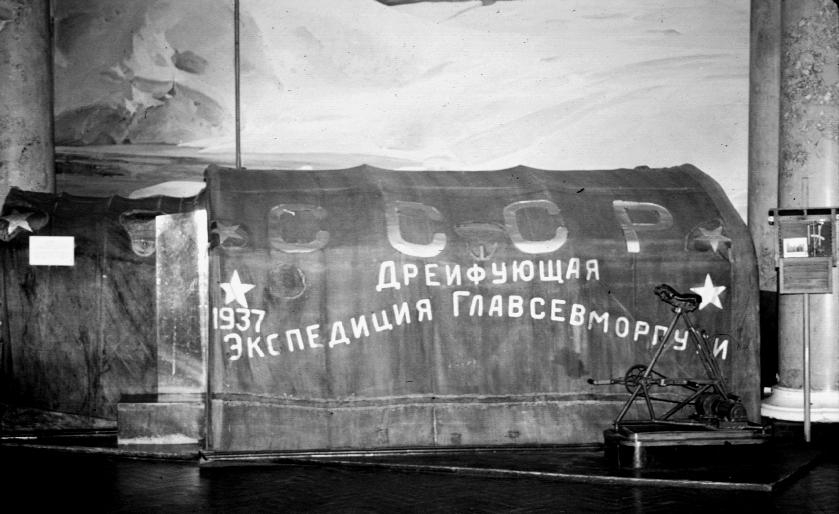
13 Russian ice station NP-1:

14 Arctic Ocean buoy (2000)

15 Arctic buoy locations: October

16 IPY legacy: Network of intensive atmospheric observatories International Arctic System for Observing the Atmosphere (IASOA)
17 Physical Characteristics and Basic Climate Features

18 Antarctic: An ice sheet surrounded by ocean askjdhf Arctic: Ocean surrounded by land NASA

19 Physiography of the Arctic lands, showing topography and major river systems [courtesy of R. Lammers, University of New Hampshire, Durham, NH].

 [from Steffen and Box,")
20 Greenland and its ice sheet. The location of GC-Net automatic weather stations in Greenland (+), expedition stations (x), and coastal settlements (o) [from Steffen and Box, 2001, by permission of AGU].
 and one day of polar darkness (at the winter solstice). http://en.wikipedia.")
21 Duration of daylight by day of year and latitude. At the North Pole there is six months of 24-hour daylight and six months of polar darkness. At the Arctic circle there is one day of 24-hour daylight (at the summer solstice) and one day of polar darkness (at the winter solstice).

22 Sunset, Toolik Lake Alaska, April Photograph by M. Serreze

23 Bathymetry of the Arctic Ocean and major geographic features. The deepest depth is over 4000 m. Note the extensive, shallow continental shelves along the Eurasian side. The Arctic Ocean has only limited connection to the world ocean and is sometimes referred to as a Mediterranean type sea. cience/04benthon/arcocean.htm


 and")
24 The Arctic sea ice cover Typical seasonal range in Arctic sea ice extent, based on AMSR-E data, plots by Univ. Bremen. There is about a factor of two difference between maximum (March) and minimum (September) extent.


25 Sea ice field for the central Arctic Ocean for 6 July 2001, based on visible-band Moderate Resolution Imaging Spectroradiometer (MODIS) imagery. The horizontal resolution is about 250 m. The image is about 376 km by 226 km. The strip in the middle of the image shows a typical configuration of leads in the sea ice cover. At the top and bottom of the image, cloud cover masks the surface, a pervasive problem in the Arctic with respect to visible and infrared-band systems. Passive microwave sensors like SSM/I have all-weather capability and can monitor sea ice conditions during polar darkness, but at a relatively coarse spatial resolution [courtesy of T. Haran, NSIDC, Boulder, CO].


26 Sea ice field in the Barents Sea near Franz Josef Land for 6 July 2001, based on visible-band MODIS imagery. The horizontal resolution is about 250 m. The image is about 526 km by 376 km. The scene shows the transition from high ice concentration to open ocean waters (the marginal ice zone). Note the large individual ice floes and polynyas on the righthand side of the image and the ice caps on the islands of Franz Josef Land [courtesy of T. Haran, NSIDC, Boulder, CO].

27 A view from the ground, near Barrow Alaska, April Note the fresh snow cover atop the sea ice and the pressure ridges in the background. The level ice is about 1.5 m thick, the ridged ice up to perhaps 5 m [photograph by M. Serreze].
28 Mean surface salinity (psu) for summer [from Arctic Climatology Project,1998, NSIDC, Boulder CO]. Note the low salinities along coastal areas due to river runoff. Salinities increase towards the Atlantic side.

29 Mean surface salinity (psu) for winter [from Arctic Climatology Project, 1997, NSIDC, Boulder, CO]. The river runoff signal is not as apparent.
30 Temperature and salinity profiles for the Beaufort Sea and near the pole. The y-axis is depth in decibars (dbar), which closely approximates depth in meters [courtesy of J. Morison, Polar Science Center, University of Washington, Seattle, WA]. Note the low salinity very near the surface (the fresh surface layer), and the rapid increase in salinity from the surface downwards. This makes the water column stable, which allows sea ice to readily form. Temperatures are highest not at the surface, but at m depth. This warm, salty layer at depth represents water imported from the Atlantic Ocean.

31 Changes in ocean circulation have played a role Major surface (blue) and deep currents (red and orange) of the Arctic Ocean, along with the approximate summer limit if sea ice. Courtesy Woods Hole Oceanographic Institution
32 Distribution of Arctic polar desert (dark shading) and approximate southern limit of tundra (bold line) [adapted from Charlier, 1969, also see Webber, 1974, courtesy of N. Saliman, NSIDC, Boulder, CO].


33 Polar Desert, Ellesmere Island Photograph by C. Allen

 and may or may not contain significant ground ice. http://nsidc.")
34 Northern Hemisphere permafrost distribution, from the International Permafrost Association Circum-Arctic Map of Permafrost and Ice Conditions. Permafrost can be continuous, discontinuous, sporadic or isolated. The existence of permafrost is defined on the basis of temperature only (ground where the temperature is below freezing for at least two years) and may or may not contain significant ground ice.


35 Average number of weeks of snow cover over the Northern Hemisphere, based on the NSIDC blended weekly product [courtesy of M.J. Brodzik, NSIDC, Boulder, CO].


36 Maximum snow depth (mm) over Eurasia compiled from Russian sources [courtesy of H. Ye, California State University, Los Angeles, CA]. Snow depths are in general quite modest.

37 Distribution of snow depth (mm) over the central Arctic Ocean for April from NP data [from Colony et al., 1998, by permission of Cambridge University Press]. Note the long tail of the distribution associated with snow drifts and hollows.

38 An extreme outlier Photograph by M. Serreze

39 Sastrugi Photograph by K. Elder

 [by the authors].")
40 Mean annual precipitation (mm) based on available biasadjusted data sources. Contour intervals are 100 mm (solid, for amounts up to 600 mm) and 200 mm (dotted, for amounts 800 mm and greater) [by the authors]. Parts of the Arctic qualify as desert. Other parts are rather moist.

![, 2000, by permission of AMS].](/docs-images/74/70602257/images/41-1.jpg "Due to melting ice, July temperature over the Arctic")
41 Mean surface air temperature ( C) for January, April, July and October [adapted and updated from Rigor et al., 2000, by permission of AMS]. Due to melting ice, July temperature over the Arctic Ocean hovers about the freezing point.


42 MODIS Composite for 11 July 2010 The Arctic is a cloudy place!

43 Typical steel grey Arctic sky - Svalbard Photograph by M. Serreze
44 Mean annual cycle of cloud cover (total cloud and low cloud, in %) for the central Arctic Ocean based on COADS data through 1995 [by the authors]. Note the sharp rise between April and May, linked to increase in low-level stratus. The central Arctic Ocean is a very cloudy place in summer.
45 Mean annual cycle of cloud cover (total cloud and low cloud, in %) for the Atlantic sector of the Arctic Ocean based on COADS data through 1995 [by the authors]. Cloud amount over the Atlantic sector is more even through the year.

46 Mean cloud cover (%) from the APP-x data set ( ) for: January; April; July; and October [courtesy of J. Key, NOAA, Madison, WI].
Climate Regimes of the Arctic
 Climate Regimes of the Arctic The climate of Greenland Map of Greenland, showing elevation and the location of GC- Net automatic weather stations (+), expedition stations (x), and coastal settlements (o)
The Hydrologic Cycle
 The Hydrologic Cycle Monthly precipitation for the central Arctic Ocean based on data from the Russian North Pole manned camps with daily bias adjustments. Raw precipitation totals are shown along with
Arctic Ocean-Sea Ice-Climate Interactions
 Arctic Ocean-Sea Ice-Climate Interactions Sea Ice Ice extent waxes and wanes with the seasons. Ice extent is at a maximum in March (typically 14 million square km, about twice the area of the contiguous
Climate Regimes of the Arctic
 Climate Regimes of the Arctic The climate of Greenland, recent changes and the ice sheet mass balance Map of Greenland, showing elevation and the location of GC- Net automatic weather stations (+), expedition
What makes the Arctic hot?
 1/3 total USA UN Environ Prog What makes the Arctic hot? Local communities subsistence Arctic Shipping Routes? Decreasing Ice cover Sept 2007 -ice extent (Pink=1979-2000 mean min) Source: NSIDC Oil/Gas
The Arctic Energy Budget
 The Arctic Energy Budget The global heat engine [courtesy Kevin Trenberth, NCAR]. Differential solar heating between low and high latitudes gives rise to a circulation of the atmosphere and ocean that
Regional Outlook for the Bering-Chukchi-Beaufort Seas Contribution to the 2018 Sea Ice Outlook
 Regional Outlook for the Bering-Chukchi-Beaufort Seas Contribution to the 2018 Sea Ice Outlook 25 July 2018 Matthew Druckenmiller (National Snow and Ice Data Center, Univ. Colorado Boulder) & Hajo Eicken
IMPACTS OF A WARMING ARCTIC
 The Earth s Greenhouse Effect Most of the heat energy emitted from the surface is absorbed by greenhouse gases which radiate heat back down to warm the lower atmosphere and the surface. Increasing the
Arctic sea ice falls below 4 million square kilometers
 SOURCE : http://nsidc.org/arcticseaicenews/ Arctic sea ice falls below 4 million square kilometers September 5, 2012 The National Snow and Ice Data Center : Advancing knowledge of Earth's frozen regions
Canadian Ice Service
 Canadian Ice Service Key Points and Details concerning the 2009 Arctic Minimum Summer Sea Ice Extent October 1 st, 2009 http://ice-glaces.ec.gc.ca 1 Key Points of Interest Arctic-wide The Arctic-wide minimum
The Northern Hemisphere Sea ice Trends: Regional Features and the Late 1990s Change. Renguang Wu
 The Northern Hemisphere Sea ice Trends: Regional Features and the Late 1990s Change Renguang Wu Institute of Atmospheric Physics, Chinese Academy of Sciences, Beijing World Conference on Climate Change
The State of the cryosphere
 The State of the cryosphere Course outline Introduction The cryosphere; what is it? The Earth; a unique planet Cryospheric components Classifications Lecture outlines The State of the cryosphere The State
Spectral Albedos. a: dry snow. b: wet new snow. c: melting old snow. a: cold MY ice. b: melting MY ice. d: frozen pond. c: melting FY white ice
 Spectral Albedos a: dry snow b: wet new snow a: cold MY ice c: melting old snow b: melting MY ice d: frozen pond c: melting FY white ice d: melting FY blue ice e: early MY pond e: ageing ponds Extinction
Deke Arndt, Chief, Climate Monitoring Branch, NOAA s National Climatic Data Center
 Thomas R. Karl, L.H.D., Director, NOAA s National Climatic Data Center, and Chair of the Subcommittee on Global Change Research Peter Thorne, PhD, Senior Scientist, Cooperative Institute for Climate and
1 IntroductIon to the cryosphere
 1 IntroductIon to the cryosphere in this place, nostalgia roams, patient as slow hands on skin, transparent as melt-water. nights are light and long. Shadows settle on the shoulders of air. time steps
Interannual Variations of Arctic Cloud Types:
 Interannual Variations of Arctic Cloud Types: Relationships with Sea Ice and Surface Temperature Ryan Eastman Stephen Warren University of Washington Department of Atmospheric Sciences Changes in Arctic
We greatly appreciate the thoughtful comments from the reviewers. According to the reviewer s comments, we revised the original manuscript.
 Response to the reviews of TC-2018-108 The potential of sea ice leads as a predictor for seasonal Arctic sea ice extent prediction by Yuanyuan Zhang, Xiao Cheng, Jiping Liu, and Fengming Hui We greatly
 Page 1 of 10 Search NSIDC... Search Education Center Photo Gallery Home Data Programs & Projects Science Publications News & Events About Overview Global Temperatures Northern Hemisphere Snow Glaciers
Modeling the Arctic Climate System
 Modeling the Arctic Climate System General model types Single-column models: Processes in a single column Land Surface Models (LSMs): Interactions between the land surface, atmosphere and underlying surface
1 What Is Climate? TAKE A LOOK 2. Explain Why do areas near the equator tend to have high temperatures?
 CHAPTER 17 1 What Is Climate? SECTION Climate BEFORE YOU READ After you read this section, you should be able to answer these questions: What is climate? What factors affect climate? How do climates differ
6. What has been the most effective erosive agent in the climate system? a. Water b. Ice c. Wind
 Multiple Choice. 1. Heinrich Events a. Show increased abundance of warm-water species of planktic foraminifera b. Show greater intensity since the last deglaciation c. Show increased accumulation of ice-rafted
Special blog on winter 2016/2017 retrospective can be found here -
 March 4, 2019 Special blog on winter 2016/2017 retrospective can be found here - http://www.aer.com/winter2017 Special blog on winter 2015/2016 retrospective can be found here - http://www.aer.com/winter2016
Accelerated decline in the Arctic sea ice cover
 Click Here for Full Article GEOPHYSICAL RESEARCH LETTERS, VOL. 35, L01703, doi:10.1029/2007gl031972, 2008 Accelerated decline in the Arctic sea ice cover Josefino C. Comiso, 1 Claire L. Parkinson, 1 Robert
Tropical Moist Rainforest
 Tropical or Lowlatitude Climates: Controlled by equatorial tropical air masses Tropical Moist Rainforest Rainfall is heavy in all months - more than 250 cm. (100 in.). Common temperatures of 27 C (80 F)
Today s Lecture: Land, biosphere, cryosphere (All that stuff we don t have equations for... )
") Today s Lecture: Land, biosphere, cryosphere (All that stuff we don t have equations for... ) 4 Land, biosphere, cryosphere 1. Introduction 2. Atmosphere 3. Ocean 4. Land, biosphere, cryosphere 4.1 Land
Today s Lecture: Land, biosphere, cryosphere (All that stuff we don t have equations for... ) 4 Land, biosphere, cryosphere 1. Introduction 2. Atmosphere 3. Ocean 4. Land, biosphere, cryosphere 4.1 Land
Figure 1: Two schematic views of the global overturning circulation. The Southern Ocean plays two key roles in the global overturning: (1) the
 the") Figure 1: Two schematic views of the global overturning circulation. The Southern Ocean plays two key roles in the global overturning: (1) the Antarctic Circumpolar Current connects the ocean basins, establishing
Figure 1: Two schematic views of the global overturning circulation. The Southern Ocean plays two key roles in the global overturning: (1) the Antarctic Circumpolar Current connects the ocean basins, establishing
Nancy N. Soreide NOAA/PMEL, Seattle, WA. J. E. Overland, J. A. Richter-Menge, H. Eicken, H. Wiggins and and J. Calder
 Nancy N. Soreide NOAA/PMEL, Seattle, WA J. E. Overland, J. A. Richter-Menge, H. Eicken, H. Wiggins and and J. Calder ARCUS State of the Arctic Meeting, March 16-19, 2010 Communicating Changes in Arctic
Terrestrial Snow Cover: Properties, Trends, and Feedbacks. Chris Derksen Climate Research Division, ECCC
 Terrestrial Snow Cover: Properties, Trends, and Feedbacks Chris Derksen Climate Research Division, ECCC Outline Three Snow Lectures: 1. Why you should care about snow: Snow and the cryosphere Classes of
ARCTIC SEA ICE ALBEDO VARIABILITY AND TRENDS,
 ARCTIC SEA ICE ALBEDO VARIABILITY AND TRENDS, 1982-1998 Vesa Laine Finnish Meteorological Institute (FMI), Helsinki, Finland Abstract Whole-summer and monthly sea ice regional albedo averages, variations
Observed Climate Variability and Change: Evidence and Issues Related to Uncertainty
 Observed Climate Variability and Change: Evidence and Issues Related to Uncertainty David R. Easterling National Climatic Data Center Asheville, North Carolina Overview Some examples of observed climate
Korean Arctic Research 2015 update
 FARO Annual Meeting, ASSW 2016 Fairbanks, Alaska, 12 March 2016 Korean Arctic Research 2015 update International Cooperation Department Korea Polar Research Institute Outline KOPRI and Korean Arctic research;
World Geography Chapter 3
 World Geography Chapter 3 Section 1 A. Introduction a. Weather b. Climate c. Both weather and climate are influenced by i. direct sunlight. ii. iii. iv. the features of the earth s surface. B. The Greenhouse
1 What Is Climate? TAKE A LOOK 2. Explain Why do areas near the equator tend to have high temperatures?
 CHAPTER 17 1 What Is Climate? SECTION Climate BEFORE YOU READ After you read this section, you should be able to answer these questions: What is climate? What factors affect climate? How do climates differ
On Modeling the Oceanic Heat Fluxes from the North Pacific / Atlantic into the Arctic Ocean
 On Modeling the Oceanic Heat Fluxes from the North Pacific / Atlantic into the Arctic Ocean Wieslaw Maslowski Naval Postgraduate School Collaborators: Jaclyn Clement Kinney Terry McNamara, John Whelan
The World Ocean. Pacific Ocean 181 x 10 6 km 2. Indian Ocean 74 x 10 6 km 2. Atlantic Ocean 106 x 10 6 km 2
 The World Ocean The ocean and adjacent seas cover 70.8% of the surface of Earth, an area of 361,254,000 km 2 Pacific Ocean 181 x 10 6 km 2 Indian Ocean 74 x 10 6 km 2 Atlantic Ocean 106 x 10 6 km 2 Oceanic
The North Atlantic Oscillation: Climatic Significance and Environmental Impact
 1 The North Atlantic Oscillation: Climatic Significance and Environmental Impact James W. Hurrell National Center for Atmospheric Research Climate and Global Dynamics Division, Climate Analysis Section
Chapter outline. Reference 12/13/2016
 Chapter 2. observation CC EST 5103 Climate Change Science Rezaul Karim Environmental Science & Technology Jessore University of science & Technology Chapter outline Temperature in the instrumental record
Brita Horlings
 Knut Christianson Brita Horlings brita2@uw.edu https://courses.washington.edu/ess431/ Natural Occurrences of Ice: Distribution and environmental factors of seasonal snow, sea ice, glaciers and permafrost
Global Atmospheric Circulation
 Global Atmospheric Circulation Polar Climatology & Climate Variability Lecture 11 Nov. 22, 2010 Global Atmospheric Circulation Global Atmospheric Circulation Global Atmospheric Circulation The Polar Vortex
The Atmospheric Circulation
 The Atmospheric Circulation Vertical structure of the Atmosphere http://www.uwsp.edu/geo/faculty/ritter/geog101/textbook/atmosphere/atmospheric_structure.html The global heat engine [courtesy Kevin Trenberth,
Changes in seasonal cloud cover over the Arctic seas from satellite and surface observations
 GEOPHYSICAL RESEARCH LETTERS, VOL. 31, L12207, doi:10.1029/2004gl020067, 2004 Changes in seasonal cloud cover over the Arctic seas from satellite and surface observations Axel J. Schweiger Applied Physics
Don't let your PBL scheme be rejected by brine: Parameterization of salt plumes under sea ice in climate models
 Don't let your PBL scheme be rejected by brine: Parameterization of salt plumes under sea ice in climate models Dimitris Menemenlis California Institute of Technology, Jet Propulsion Laboratory Frontiers
Polar Portal Season Report 2013
 Polar Portal Season Report 2013 All in all, 2013 has been a year with large melting from both the Greenland Ice Sheet and the Arctic sea ice but not nearly as large as the record-setting year of 2012.
'ATM'493/693'Applied'Arc/c'Climate'Problems'' Spring'2017'University'of'Alaska'Fairbanks'='Don t'be'leo'out!''
 'ATM'493/693'Applied'Arc/c'Climate'Problems'' Spring'2017'University'of'Alaska'Fairbanks'='Don t'be'leo'out!'' Calling'undergraduates'and'graduate'students'interested' in'understanding'and'par/cipa/ng'in'the'process'of'taking'
1. The frequency of an electromagnetic wave is proportional to its wavelength. a. directly *b. inversely
 CHAPTER 3 SOLAR AND TERRESTRIAL RADIATION MULTIPLE CHOICE QUESTIONS 1. The frequency of an electromagnetic wave is proportional to its wavelength. a. directly *b. inversely 2. is the distance between successive
Which graph best shows the relationship between intensity of insolation and position on the Earth's surface? A) B) C) D)
 B) C) D)") 1. The hottest climates on Earth are located near the Equator because this region A) is usually closest to the Sun B) reflects the greatest amount of insolation C) receives the most hours of daylight D)
1. The hottest climates on Earth are located near the Equator because this region A) is usually closest to the Sun B) reflects the greatest amount of insolation C) receives the most hours of daylight D)
NASA Images of Antarctica and the Arctic covered in both land and sea ice
 ICE SHELVES ACTIVITY 1: DECODING THE ROLE OF ANTARCTIC ICE IN GLOBAL CLIMATE Ice Shelves play a critical role in Antarctica, serving as a buffer between the ocean and the continental ice sheet covering
The Arctic Crossroads
 The Arctic Crossroads The Influence of the Mendeleev Ridge and the Chukchi Borderland on the Large-scale Circulation of the Arctic Ocean Rebecca Woodgate and Knut Aagaard, University of Washington Jim
Climate Change and Arctic Ecosystems
 itletitle Climate Change and Arctic Ecosystems Climate Change and Arctic Ecosystems Key Concepts: Greenhouse Gas Albedo Ecosystem Sea ice Vegetative zone WHAT YOU WILL LEARN 1. You will analyze Arctic
Visible and Thermal Imaging of Sea Ice and Open Water from Coast Guard Arctic Domain Awareness Flights
 DISTRIBUTION STATEMENT A. Approved for public release; distribution is unlimited. Visible and Thermal Imaging of Sea Ice and Open Water from Coast Guard Arctic Domain Awareness Flights Ronald Lindsay Applied
EC-PORS III Research. Sodankylä, February Developing a Polar Prediction System
 EC-PORS III Research Sodankylä, February 2012 Developing a Polar Prediction System Polar Prediction System - Status 1. EC-PORS I (Oct. 2009) -> initial discussions 2. WWRP/THORPEX Polar Prediction Workshop,
Welcome to ATMS 111 Global Warming.
 Welcome to ATMS 111 Global Warming http://www.atmos.washington.edu/2010q1/111 http://cgz.e2bn.net/e2bn/leas/c99/schools/cgz/accounts/staff/rchambers/geobytes/gcse/case%20studies/causes_of_flooding_in_bangladesh.jpg
An Assessment of Contemporary Global Reanalyses in the Polar Regions
 An Assessment of Contemporary Global Reanalyses in the Polar Regions David H. Bromwich Polar Meteorology Group, Byrd Polar Research Center and Atmospheric Sciences Program, Department of Geography The
Whither Arctic Sea Ice?
 Cooperative Institute for Research in Environmental Sciences University of Colorado Whither Arctic Sea Ice? Walt Meier http://nsidc.org Climate Literacy and Energy Awareness Network May 9, 2011 1 The Cryosphere
Future Climate Change
 Future Climate Change How do you know whether to trust a prediction about the future? All predictions are based on global circulation models (GCMs, AOGCMs) - model accuracy is verified by its ability to
The importance of long-term Arctic weather station data for setting the research stage for climate change studies
 The importance of long-term Arctic weather station data for setting the research stage for climate change studies Taneil Uttal NOAA/Earth Systems Research Laboratory Boulder, Colorado Things to get out
1. Greenland Flow Distortion experiment (GFDex)
") 1. Greenland Flow Distortion experiment (GFDex) (GFDex) is an international fieldwork and modelling-based project to investigate the role that Greenland plays in distorting atmospheric flow over and around
1. Greenland Flow Distortion experiment (GFDex) (GFDex) is an international fieldwork and modelling-based project to investigate the role that Greenland plays in distorting atmospheric flow over and around
The known requirements for Arctic climate services
 The known requirements for Arctic climate services based on findings described in STT White paper 8/2015 Johanna Ekman / EC PHORS STT Regional drivers The Arctic region is home to almost four million people
Global Climate Change
 Global Climate Change Overview: Students will learn about global climate change, what causes global warming, and scientific projections about climate change in the near future. Levels V-VI Grades 9-12
Radiative Climatology of the North Slope of Alaska and the Adjacent Arctic Ocean
 Radiative Climatology of the North Slope of Alaska and the Adjacent Arctic Ocean C. Marty, R. Storvold, and X. Xiong Geophysical Institute University of Alaska Fairbanks, Alaska K. H. Stamnes Stevens Institute
Northern Hemisphere Snow and Ice Data Records
 Northern Hemisphere Snow and Ice Data Records Making Earth Science Data Records for Use in Research Environments (MEaSUREs) PoDAG XXX Oct 12-13 th, NSIDC MEaSUREs Snow Team David A. Robinson Gina Henderson
Changes in Frequency of Extreme Wind Events in the Arctic
 Changes in Frequency of Extreme Wind Events in the Arctic John E. Walsh Department of Atmospheric Sciences University of Illinois 105 S. Gregory Avenue Urbana, IL 61801 phone: (217) 333-7521 fax: (217)
Bell Work. REVIEW: Our Planet Earth Page 29 Document A & B Questions
 9.12.16 Bell Work REVIEW: Our Planet Earth Page 29 Document A & B Questions Intro to Climate & Weather https://www.youtube.com/watch?v=vhgyoa70q7y Weather vs. Climate Video Climate & Weather 3.1 Weather
Extent of Periglacial = Global Permafrost Permafrost: Soil and/or rock where temperatures remain below 0 degrees C for 2 or more years.
 Geog 1000 - Lecture 34 Periglacial Environments and Paleoclimatology http://scholar.ulethbridge.ca/chasmer/classes/ Today s Lecture (Pgs 422-434) 1. Exam questions from last week, and today 2. Extent of
Oceans I Notes. Oceanography
 Oceans I Notes Outlines on the front table Oceanography the science of our oceans that mixes biology, geology, chemistry, and physics (among other sciences) to unravel the mysteries of our seas. Divisions
Climate Change 2007: The Physical Science Basis
 Climate Change 2007: The Physical Science Basis Working Group I Contribution to the IPCC Fourth Assessment Report Presented by R.K. Pachauri, IPCC Chair and Bubu Jallow, WG 1 Vice Chair Nairobi, 6 February
BEAUFORT SEA ICE CONCENTRATION AND THE CLIMATE OF THE ALASKAN NORTH SLOPE
 Ice in the Environment: Proceedings of the 16th IAHR International Symposium on Ice Dunedin, New Zealand, 2nd 6th December 2002 International Association of Hydraulic Engineering and Research BEAUFORT
The Oceans in a Warming World
 The Oceans in a Warming World John Marshall Earth, Atmospheric and Planetary Sciences 1. Review global observations of warming trends. Ocean temperature trends key part of the puzzle. 2. Discuss timing
Chapter 1 Section 2. Land, Water, and Climate
 Chapter 1 Section 2 Land, Water, and Climate Vocabulary 1. Landforms- natural features of the Earth s land surface 2. Elevation- height above sea level 3. Relief- changes in height 4. Core- most inner
Homework 5: Background Ocean Water Properties & Stratification
 14 August 2008 MAR 110 HW5: Ocean Properties 1 Homework 5: Background Ocean Water Properties & Stratification The ocean is a heterogeneous mixture of water types - each with its own temperature, salinity,
Polar Portal Season Report 2016
 Polar Portal Season Report 2016 Less ice both on land and at sea This year s report is the fourth since the Polar Portal was launched, and as an introduction, we have chosen to take a look at the trends
What is the IPCC? Intergovernmental Panel on Climate Change
 IPCC WG1 FAQ What is the IPCC? Intergovernmental Panel on Climate Change The IPCC is a scientific intergovernmental body set up by the World Meteorological Organization (WMO) and by the United Nations
Keys to Climate Climate Classification Low Latitude Climates Midlatitude Climates High Latitude Climates Highland Climates Our Changing Climate
 Climate Global Climates Keys to Climate Climate Classification Low Latitude Climates Midlatitude Climates High Latitude Climates Highland Climates Our Changing Climate Keys to Climate Climate the average
New perspectives of climate change impacts on marine anthropogenic radioactivity in Arctic regions
 New perspectives of climate change impacts on marine anthropogenic radioactivity in Arctic regions M. Karcher 1,3, I. Harms 2, R. Gerdes 3, W.J.F. Standring 4, M. Dowdall 4, P. Strand 4 1 O.A.Sys Ocean
Observed State of the Global Climate
 WMO Observed State of the Global Climate Jerry Lengoasa WMO June 2013 WMO Observations of Changes of the physical state of the climate ESSENTIAL CLIMATE VARIABLES OCEANIC ATMOSPHERIC TERRESTRIAL Surface
APPENDIX B PHYSICAL BASELINE STUDY: NORTHEAST BAFFIN BAY 1
 APPENDIX B PHYSICAL BASELINE STUDY: NORTHEAST BAFFIN BAY 1 1 By David B. Fissel, Mar Martínez de Saavedra Álvarez, and Randy C. Kerr, ASL Environmental Sciences Inc. (Feb. 2012) West Greenland Seismic
General Circulation. Nili Harnik DEES, Lamont-Doherty Earth Observatory
 General Circulation Nili Harnik DEES, Lamont-Doherty Earth Observatory nili@ldeo.columbia.edu Latitudinal Radiation Imbalance The annual mean, averaged around latitude circles, of the balance between the
Activity 2.2: Recognizing Change (Observation vs. Inference)
") Activity 2.2: Recognizing Change (Observation vs. Inference) Teacher Notes: Evidence for Climate Change PowerPoint Slide 1 Slide 2 Introduction Image 1 (Namib Desert, Namibia) The sun is on the horizon
Activity 2.2: Recognizing Change (Observation vs. Inference) Teacher Notes: Evidence for Climate Change PowerPoint Slide 1 Slide 2 Introduction Image 1 (Namib Desert, Namibia) The sun is on the horizon
Trends in Climate Teleconnections and Effects on the Midwest
 Trends in Climate Teleconnections and Effects on the Midwest Don Wuebbles Zachary Zobel Department of Atmospheric Sciences University of Illinois, Urbana November 11, 2015 Date Name of Meeting 1 Arctic
Advancements and Limitations in Understanding and Predicting Arctic Climate Change
 Advancements and Limitations in Understanding and Predicting Arctic Climate Change Wieslaw Maslowski Naval Postgraduate School Collaborators: Jaclyn Clement Kinney, Rose Tseng, Timothy McGeehan - NPS Jaromir
Observed changes in climate and their effects
 1 1.1 Observations of climate change Since the TAR, progress in understanding how climate is changing in space and time has been gained through improvements and extensions of numerous datasets and data
Origins of the SHEBA freshwater anomaly in the Mackenzie River delta
 GEOPHYSICAL RESEARCH LETTERS, VOL. 33, L09601, doi:10.1029/2005gl024813, 2006 Origins of the SHEBA freshwater anomaly in the Mackenzie River delta M. Steele, 1 A. Porcelli, 1 and J. Zhang 1 Received 29
3. Which color of the visible light has the shortest wavelength? A) violet B) green C) yellow D) red
 violet B) green C) yellow D) red") Name: Topic 6 Test 1. Which process is responsible for the greatest loss of energy from Earth's surface into space on a clear night? A) condensation B) conduction C) radiation D) convection 2. Base your
Name: Topic 6 Test 1. Which process is responsible for the greatest loss of energy from Earth's surface into space on a clear night? A) condensation B) conduction C) radiation D) convection 2. Base your
Some NOAA Products that Address PSTG Satellite Observing Requirements. Jeff Key NOAA/NESDIS Madison, Wisconsin USA
 Some NOAA Products that Address PSTG Satellite Observing Requirements Jeff Key NOAA/NESDIS Madison, Wisconsin USA WMO Polar Space Task Group, 4 th meeting, Greenbelt, 30 September 2014 Relevant Missions
Understanding the Polar Regions in Climate Change
 AWG Glenwood Sprs, Oct 2007 Understanding the Polar Regions in Climate Change STEM Polar Connections Outline -- What are the Polar Regions Important to Everyone? Geography of the Poles Oceans, land, sea
ATOC OUR CHANGING ENVIRONMENT Class 19 (Chp 6) Objectives of Today s Class: The Cryosphere [1] Components, time scales; [2] Seasonal snow
![ATOC OUR CHANGING ENVIRONMENT Class 19 (Chp 6) Objectives of Today s Class: The Cryosphere [1] Components, time scales; [2] Seasonal snow](/thumbs/95/126309683.jpg "ATOC OUR CHANGING ENVIRONMENT Class 19 (Chp 6) Objectives of Today s Class: The Cryosphere [1] Components, time scales; [2] Seasonal snow") ATOC 1060-002 OUR CHANGING ENVIRONMENT Class 19 (Chp 6) Objectives of Today s Class: The Cryosphere [1] Components, time scales; [2] Seasonal snow cover, permafrost, river and lake ice, ; [3]Glaciers and
ATOC 1060-002 OUR CHANGING ENVIRONMENT Class 19 (Chp 6) Objectives of Today s Class: The Cryosphere [1] Components, time scales; [2] Seasonal snow cover, permafrost, river and lake ice, ; [3]Glaciers and
NSIDC Sea Ice Outlook Contribution, 31 May 2012
 Summary NSIDC Sea Ice Outlook Contribution, 31 May 2012 Julienne Stroeve, Walt Meier, Mark Serreze, Ted Scambos, Mark Tschudi NSIDC is using the same approach as the last 2 years: survival of ice of different
ARCH 1250 APPLIED ENVIRONMENTAL STUDIES. CLASS TWO - CLIMATE Macroclimate and Microclimate
 APPLIED ENVIRONMENTAL STUDIES CLASS TWO - Macroclimate and Microclimate Part 1: Climate Overview John Seitz, RA, LEED AP Assistant Adjunct Professor Professor Paul C. King, RA, AIA, ARA Assistant Professor
The Arctic Ocean Climate a balance between local radiation, advected heat and freshwater
 The Arctic Ocean Climate a balance between local radiation, advected heat and freshwater Bert Rudels Finnish Meteorological Institute, Helsinki, Finland French Arctic Initiative, Collège de France, Paris,
Arctic Ocean simulation in the CCSM4
 Arctic Ocean simulation in the CCSM4 Alexandra Jahn National Center for Atmospheric Sciences, Boulder, USA Collaborators: K. Sterling, M.M. Holland, J. Kay, J.A. Maslanik, C.M. Bitz, D.A. Bailey, J. Stroeve,
THIN ICE AREA EXTRACTION IN THE SEASONAL SEA ICE ZONES OF THE NORTHERN HEMISPHERE USING MODIS DATA
 THIN ICE AREA EXTRACTION IN THE SEASONAL SEA ICE ZONES OF THE NORTHERN HEMISPHERE USING MODIS DATA K. Hayashi 1, K. Naoki 1, K. Cho 1 *, 1 Tokai University, 2-28-4, Tomigaya, Shibuya-ku, Tokyo, Japan,
Influence of changes in sea ice concentration and cloud cover on recent Arctic surface temperature trends
 Click Here for Full Article GEOPHYSICAL RESEARCH LETTERS, VOL. 36, L20710, doi:10.1029/2009gl040708, 2009 Influence of changes in sea ice concentration and cloud cover on recent Arctic surface temperature
All objects emit radiation. Radiation Energy that travels in the form of waves Waves release energy when absorbed by an object. Earth s energy budget
 Radiation Energy that travels in the form of waves Waves release energy when absorbed by an object Example: Sunlight warms your face without necessarily heating the air Shorter waves carry more energy
THE ATMOSPHERE IN MOTION
 Funding provided by NOAA Sectoral Applications Research Project THE ATMOSPHERE IN MOTION Basic Climatology Oklahoma Climatological Survey Factor 1: Our Energy Source Hi, I m the Sun! I provide 99.9999+
NOAA Arctic Priorities and Potential Contributions to PPP/YOPP. Randall Dole NOAA Earth System Research Laboratory Physical Sciences Division
 NOAA Arctic Priorities and Potential Contributions to PPP/YOPP Randall Dole NOAA Earth System Research Laboratory Physical Sciences Division 1 NOAA s Arctic Goals Forecast Sea Ice Strengthen Foundational
Chapter PRECIPITATION AND EVAPOTRANSPIRATION
 Chapter 5 5.1 PRECIPITATION AND EVAPOTRANSPIRATION Fig. 5.1.1 Mean monthly precipitation (P), precipitation minus evapotranspiration (P-E) and evapotranspiration (E) for the four major Arctic watersheds,
Seasonal & Diurnal Temp Variations. Earth-Sun Distance. Eccentricity 2/2/2010. ATS351 Lecture 3
 Seasonal & Diurnal Temp Variations ATS351 Lecture 3 Earth-Sun Distance Change in distance has only a minimal effect on seasonal temperature. Note that during the N. hemisphere winter, we are CLOSER to
Exam II: Water, Winds, Deserts, Oceans
 Montclair State University, College of Science and Mathematics Department of Earth and Environmental Studies EAES101 Planet Earth Semester: SAMPLE Dr. Mark Chopping Exam II: Water, Winds, Deserts, Oceans
NSIDC/Univ. of Colorado Sea Ice Motion and Age Products
 NSIDC/Univ. of Colorado Sea Ice Motion and Age Products Polar Pathfinder Daily 25 km EASE-Grid Sea Ice Motion Vectors, http://nsidc.org/data/nsidc-0116.html Passive microwave, AVHRR, and buoy motions Individual
Lesson 3 Latitude is Everything
 Latitude is Everything Essential Question: How does latitude affect the Amount of Solar Energy an Area Receives and that Area s Climate? Objective: Students will be able to explain how the sun s energy