NOAA Operational Ocean Surface. Vector Winds Requirements Workshop. National Hurricane Center Miami, FL June 5 7, 2006
|
|
|
- Cora Murphy
- 6 years ago
- Views:
Transcription


1 NOAA Operational Ocean Surface Vector Winds Requirements Workshop National Hurricane Center Miami, FL June 5 7, 2006
2 NOAA Operational Satellite Ocean Surface Vector Winds Requirements Workshop Report Convened at the Tropical Prediction Center/ National Hurricane Center Miami, Florida June 5-7,
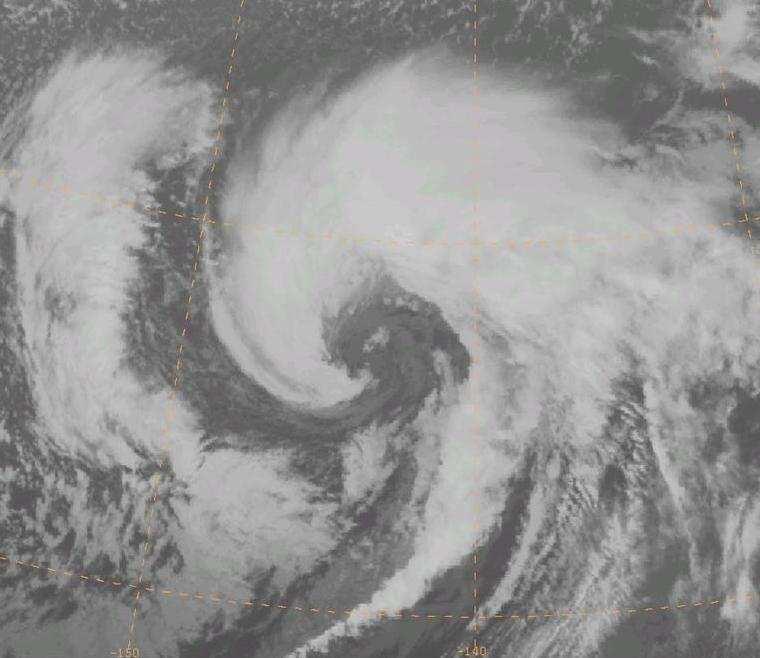
3 Acknowledgments We thank Max Mayfield and Ed Rappaport for graciously inviting us to convene this workshop at Tropical Prediction Center/National Hurricane Center. We also thank Richard Knabb and Michael Brennan for assisting with the workshop coordination and logistics. The following individuals provided invaluable assistance in the preparation and editing of this report: Joseph Sienkiewicz Michael Brennan Ed Rappaport Michael Freilich Dudley Chelton Joan Von Ahn Ernesto Rodriguez Mark DeMaria Support for this workshop and preparation of this report was largely supported by the National Oceanic and Atmospheric Administration. Editors: Paul Chang Zorana Jelenak Cover: Background picture: The ocean surface under hurricane force winds as seen from an altitude of 200 feet aboard the NOAA WP-3D N43F Miss Piggy during a flight in Hurricane Isabel, Pictures starting from top row from left to right: Visible image from GOES of Hurricane Katrina, QuikSCAT ultra-hires ocean wind speed image of Hurricane Katrina, view from inside the eye of Hurricane Isabel from the NOAA WP-3D N42RF Kermit, a GOES infra-red image of a Pacific Ocean extra-tropical cyclone with hurricane force winds, the ice-ocean interface in the Ross Sea, damage sustained by the container ship APL China (over $100 million) in a hurricane force extra-tropical storm that began as Typhoon Babs, highway 90 in Biloxi, MS after Hurricane Katrina. 2
4 NOAA Operational Ocean Surface Vector Winds (OSVW) Workshop NOAA OPERATIONAL OSVW WORKSHOP PARTICIPANTS LIST EXECUTIVE SUMMARY INTRODUCTION WORKSHOP OBJECTIVES AND GOAL NEAR REAL-TIME OCEAN SURFACE WIND VECTOR MEASUREMENTS UTILIZATION AND IMPACT OF AVAILABLE SATELLITE OSVW DATA IN THE OPERATIONAL WEATHER COMMUNITY IMPORTANCE OF SATELLITE OSVW UTILIZATION OF SATELLITE OSVW Marine warnings and forecasts Tropical Cyclone Analysis and Forecasting Identification and warning of coastal gap and jet winds Public forecasts and warnings Numerical Weather Prediction WORKSHOP PARTICIPANTS STATEMENTS LIMITATIONS OF CURRENT SYSTEMS THE REQUIREMENTS AND THE REQUIREMENTS GAP NPOESS INTEGRATED OPERATIONAL REQUIREMENTS NOAA S OPERATIONAL OSVW REQUIREMENTS COMPARISON OF CURRENT AND NEW REQUIREMENTS WITH AVAILABLE OSVW MEASUREMENTS MEETING THE NEXT GENERATION OCEAN SURFACE VECTOR WIND REQUIREMENTS METEOROLOGICAL SATELLITES JPL NEXT-GENERATION OCEAN VECTOR WIND MISSION STUDY EXECUTIVE SUMMARY ERROR! BOOKMARK NOT DEFINED. 7 SUMMARY APPENDIX A SCATTEROMETER WIND VECTOR MEASUREMENTS RADIOMETER WIND MEASUREMENTS REFERENCES LIST OF ACRONYMS
5 NOAA Operational OSVW Workshop Participants List: Paul Chang Joseph Sienkiewicz Richard Knabb Ed Rappaport Mark DeMaria Michael Freilich Dudley Chelton Bob Atlas Joan Von Ahn Michael Brennan Zorana Jelenak Ernesto Rodriguez Rob Gaston Simon Yueh Daniel Esteban-Fernandez Peter Gaiser Aimee Fish Melinda Hinojosa John Lovegrove Roger Edson Wes Browning Caroline Bower NOAA/NESDIS/StAR NOAA/NCEP/OPC NOAA/NCEP/TPC/NHC NOAA/NCEP/TPC/NHC NOAA/NESDIS/StAR OSU/ College of Oceanic and Atmospheric Sciences OSU/ College of Oceanic and Atmospheric Sciences NOAA/AOML NOAA/NCEP/OPC-QSS NOAA/NCEP/TPC/HNC-UCAR NOAA/NESDIS/StAR-UCAR NASA/JPL NASA/JPL NASA/JPL NASA/JPL NRL NOAA/NWS/Alaska Region NOAA/NWS/Southern Region/WFO NOAA/NWS/Western Region/WFO Medford NOAA/NWS WFO Guam NOAA/NWS/WASC NPMOC/JTWC 4
6 James Carswell Mark Freeberg David Long Linwood Jones Ralph Milliff Peter Stamus Pete Black Naomi Surgi Stephen Lord Hugh Cobb Kevin Schrab Scott Kiser Amanda Bittenger Remote Sensing Solutions OCENS Inc Brigham Young University/Center for Remote Sensing University of Central Florida NWRA NWRA NOAA/NESDIS/OAR/MASC NOAA/NWS/HQTR NOAA/NCEP/EMC NOAA/NCEP/TPC/TAFB NOAA/NWS/HQTR NOAA/NWS/HQTR NOAA/NESDIS/StAR 5
7 1 EXECUTIVE SUMMARY Although satellite ocean surface vector wind (OSVW) data are revolutionizing operational marine weather warnings, analyses, and forecasts, critical, but solvable gaps in OSVW capability remain leaving life and property at risk. This report from a workshop held June 5-7, 2006 at the Tropical Prediction Center (TPC)/National Hurricane Center (NHC) in Miami, FL documents (1) the utilization and impact of presently available satellite OSVW data in the production and use of operational marine weather analyses, forecasts and warnings at NOAA, (2) the OSVW operational requirements within NOAA based on actual experience and phenomena observed, and (3) a preliminary exploration of sensor/mission concepts that would be capable of meeting the requirements. Seven years after NOAA first began routinely utilizing satellite OSVW data, the Nation still has no plans for an operational OSVW data stream that addresses the present and future satellite OSVW requirements of NOAA. Near-real-time measurements of ocean surface vector winds (OSVW) including both wind speed and direction from non-noaa research satellites are being widely used in critical operational NOAA forecasting and warning activities. Wind observations in near all-weather conditions from the NASA QuikSCAT mission (launched in June 1999) have been incorporated into daily operations at NOAA s Ocean Prediction Center (OPC) and Tropical Prediction Center/ National Hurricane Center (TPC/NHC) since QuikSCAT data have been assimilated routinely for numerical weather prediction modeling at the National Centers for Environmental Prediction (NCEP) as well as numerous international weather centers such as the European Center for Medium-Range Weather Forecasting (ECMWF) since January 15, Also, the satellite vector winds have been provided through AWIPS to coastal NWS Weather Forecast Offices (WFOs) in Western Region since 2000 and in the baseline AWIPS since April, Within the past few months, preliminary wind speed and direction measurements from the Naval Research Laboratory s (NRL) research WindSat instrument (launched in January 2003) are being provided to NOAA and to DoD through the Fleet Numerical Meteorology and Oceanography Center (FNMOC). WindSat data is currently under evaluation and being compared to near-real-time QuikSCAT measurements in NOAA, DoD, and interagency (e.g., Joint Typhoon Warning Center (JTWC)) operational activities. This NOAA-sponsored workshop was held to: Document the operational utilization and impact of satellite surface wind speed and direction measurements; and Consider measurement accuracy, resolution, and coverage requirements for future NOAA operational ocean vector wind products in light of present experience from research missions, and planned future advances in the areas of numerical weather models, analytical techniques, and NOAA global, regional, and storm warning and forecast requirements. In addition, the workshop briefly examined OSVW measurement requirements of the research community, and surveyed mature and developing technologies that could form the basis for nearfuture operational NOAA OSVW observing systems. The workshop participation included a broad range of experts (35) representing NOAA (21), NASA (4), DoD (2), academia (4) and the private sector (4); the agenda and all presentations are available at the website ( 6
8 The workshop findings are summarized below: 1) QuikSCAT vector wind measurements are fully integrated, and heavily used, in the routine workflow of the national centers (OPC, TPC/NHC), JTWC and coastal NWS WFOs. As wellvalidated WindSat products become available through NAWIPS (National centers AWIPS) and AWIPS, it is expected that these wind data will also be exploited by forecasters. In addition to their previously documented utility in global and regional numerical weather prediction, the QuikSCAT data have had major operational impact in the areas of: a) determination of wind warning areas for mid-latitude systems (Gale, Storm, Hurricane Force (HF)); Specifically, the availability of reliable, spatially extensive QuikSCAT measurements allowed the introduction of mid-latitude Hurricane Force wind warnings starting in late b) determination of tropical cyclone (TC) 34-knot and 50-knot wind radii; c) tracking of TC center location, including the initial identification of TC formation; d) identification and warning of extreme gap and jet wind events at all latitudes; e) current location of frontal systems and high and low pressure centers; f) improved coastal surf and swell forecasts 2) Nearly seven years of operational experience with the satellite vector wind data has highlighted the need for product improvements in the following areas to support the present needs of NOAA operational forecasters and centers: a) Measurement accuracy and quality Rain contamination, leading to inaccurate retrievals in rainy conditions and an inability to measure maximum winds near the centers of tropical and extratropical (i.e., mid-latitude) cyclones. Ambiguity removal (wind directional uncertainty) degrading the analysis of cyclone center locations. Arbitrary limitations in retrieval algorithms, leading to maximum reported speeds of 50 m/s (100 knots). b) Measurement spatial and temporal ( revisit ) resolution, and latency and 25-km resolution products cannot resolve important specific small-scale, high wind speed features near the centers of storms and cyclones, or small-scale gap winds near islands such as the Aleutians. The present 30-km land mask (designed to avoid land contamination of wind measurements) eliminates data within the critical near shore areas of responsibility of most coastal WFOs. Insufficient revisit frequency from a single (albeit broad-swath) polar orbiting instrument, leads to the unavailability of timely (within 3-6 hour) wind data during some forecast cycles. Inadequate data timeliness during rapidly changing meteorological conditions (the QuikSCAT near-real-time requirement of 180 minutes from data acquisition to product availability, developed prior to launch, has been found through operational experience to be too long). c) Data product provisioning and training QuikSCAT data are essentially unavailable in the operational gridded analysis products heavily used at WFOs such as Local Analysis and Prediction System (LAPS), Mesoscale Surface Assimilation System (MSAS), Advanced Regional Prediction System (ARPS) Data Analysis System (ADAS), hindering their even 7
9 wider use in support of WFO and center operations (Prior to April, 2005, QuikSCAT data products were not yet available within the baseline AWIPS and WindSat measurements are presently unavailable in AWIPS but are now available in NAWIPS workstations) Lack of user documentation for NOAA operational satellite wind products Limited training materials available for NOAA operational forecasters. 3) After much discussion, the workshop participants focused on the essential vector wind product requirements All-weather retrievals (i.e. accurate retrievals in rain) Accuracy levied upon the selected 10-meter 1-minute sustained wind as defined by operational requirements o 0 165kt wind speed range kt: speed +/- 2kt and direction +/- 10 degrees (2 sigma) 4 10kt: speed +/- 2 kt and direction +/- 20 degrees (2 sigma) 0 4kt: speed +/- 2kt Revisit time interval (defined as the time interval between measurements at a particular point on the ocean surface): every 6 hours (1 3 hour goal) Reduced product latency: minutes from measurement to product availability (15 min goal) 2.5 km x 2.5 km grid spacing which is defined as the spacing between unique wind vector retrievals (1 km x 1 km goal) Unique wind vector grid cells to within 2.5 km of the coast (1 km goal) Wind fields must be delivered into the operational environment, i.e., NAWIPS, AWIPS, and data assimilation systems Product documentation / tutorial / training These refined requirements: a) ensure accurate measurements in the presence of extreme wind conditions such as those found in intense storms and cyclones by extending the upper wind speed limit to 165 kt, (in the category 5 hurricane range), and requiring accurate measurements in the presence of rain; b) increase the spatial resolution (decrease the characteristic dimensions) of individual measurements to allow definition of small-scale features in synoptic and mesoscale systems, provide accurate vector wind measurements closer to the coast, and allow estimation of the required 1 minute sustained wind speed from the instantaneous spatially averaged wind measured by the spaceborne instruments; and c) emphasize the overall operational requirement for an observing system (likely multiplatform) that satisfies revisit frequency requirements for measurements at every openocean location. Workshop participants from the research community noted that the above refined operational requirements would result in data products that would significantly enhance the present research applications of the oceanographic, meteorological, and climate research communities. Establishing an operational satellite OSVW data stream and closing the OSVW capability gaps will result in more accurate warnings, watches and short-term forecasts; improved analyses, model initializations, and atmospheric forcing of ocean models; and a better understanding of coastal and oceanic phenomena. This will yield significant improvements in NOAA s operational weather forecasting, warning and analyses capabilities. 8
10 2 Introduction The operational use of satellite ocean surface vector wind (OSVW) observations has advanced considerably over the past 10 years. OSVW are now depended upon and utilized daily by operational weather centers around the world. Within the NOAA s National Weather Service (NWS) the use of OSVW encompasses the warning, analysis and forecasting missions associated with tropical cyclones, extra-tropical cyclones, fronts, localized coastal wind events (i.e., gap winds), surf, and swell. Much has been learned about the importance and utility of satellite OSVW data in operational weather forecasting and warning by exploiting OSVW research satellites in near real-time. With oceans comprising over 70% of the earth s surface, the impacts of these data have been tremendous in serving society s needs for weather and water information and in supporting the Nation s commerce with information for safe, efficient and environmentally sound transportation and coastal preparedness. The satellite OSVW experience that has been gained over the past decade by users in the operational weather community allows for realistic operational OSVW requirements to be properly stated and justified for the first time. 2.1 Workshop Objectives and Goal The Workshop objectives were to define and justify NOAA s operational ocean surface vector wind requirements and to investigate options and conceptual designs for a spacebased sensor capable of addressing the unmet operational requirements of the NOAA community. The NOAA operational OSVW workshop that this report summarizes was a first step toward this objective: The goals of this document are to: summarize the utilization and impact of current satellite ocean surface vector wind data in operational weather forecasting, define the actual operational ocean surface vector wind requirements within NOAA and explore sensor/mission concept using presently mature remote sensing technologies, that would be able to meet these requirements 2.2 Near Real-Time Ocean Surface Wind Vector Measurements Two research SVW missions are currently operating and providing timely data products for operational utilization at NOAA. QuikSCAT/SeaWinds (hereafter QuikSCAT ) (Spencer et al. 1997) and Coriolis/WindSat ( WindSat ) (Gaiser, 2004) employ different microwave remote-sensing techniques to retrieve the SVW. However their distinctions are not pertinent in defining NOAA s present operational SVW requirements. QuikSCAT features most prominently in the following examples and experiences due in 9
11 part to the near real-time availability of QuikSCAT products since February 2000 (Hoffman and Liedner, 2005). WindSat near real-time SVW data only become available in the beginning of A more detailed discussion of QuikSCAT and WindSat and the techniques by which SVW information can be extracted from active and passive microwave instruments can be found in Appendix A. QuikSCAT and WindSat data are being processed and distributed operationally at the Navy s Fleet Numerical Meteorological and Oceanographic Center (FNMOC) and at NOAA s National Environmental Satellite, Data, and Information Service (NESDIS). Near-real time data can be found at and Science level QuikSCAT products and additional documentation can be found at 3 Utilization and Impact of Available Satellite OSVW data in the Operational Weather Community This workshop gathered meteorologists from the U.S. public and military operational weather forecasting community. The NWS was represented by NCEP (OPC, TPC (NHC/ TAFB), the Environmental Modeling Center (EMC)) and the regional headquarters (Alaska, Pacific, Western and Southern Regions). The DoD had representation via the JTWC (Smith, 1995). The combined areas of responsibility of the workshop participants cover a vast area that extends from the east coast of Africa, across the Indian, Pacific and Atlantic Oceans to the European coastline. This includes the North Atlantic and North and South Pacific Oceans as well as the coastal waters of the contiguous United States, Alaska, Hawaii, and Pacific Island Nations (Fig 1) (OFCM, 2006). The NCEP EMC produces the atmospheric models used by the U.S. public and private weather enterprise as the primary source of forecast guidance. These models include the Global Forecast System (GFS), Global Ensemble Forecast System (GEFS), North American Mesoscale (NAM) model, the NOAA Wavewatch III ocean wave model and the recently introduced Real Time Ocean Forecast System-Atlantic (RTOFS_ATL) ocean model (based on the University Miami HYbrid Coordinate Ocean Model (HYCOM). OSVW are one of the important data sources assimilated into the NCEP Global and mesoscale modeling systems (GFS and GEFS). The mission of the National Weather Service (NWS) is to provide weather, water, and climate forecasts and warnings for the United States, its territories, adjacent waters, and ocean areas for the protection of life and property and the enhancement of the national economy. 10
, TPC/TAFB (purple) and Honolulu Weather Forecast Office (HFO) (yellow) share the United States High Seas forecast responsibility as defined in the International Safety of")
12 Fig 1. Map showing the combined areas of responsibility of meeting participants. Three centers, the OPC (red), TPC/TAFB (purple) and Honolulu Weather Forecast Office (HFO) (yellow) share the United States High Seas forecast responsibility as defined in the International Safety of Life At Sea (SOLAS) convention. The DoD Joint Typhoon Warning Center (JTWC) (orange), TPC/NHC (blue) and Central Pacific Hurricane Center (CPHC)(green) share the warning responsibility for tropical cyclones. Weather Forecast Office (WFO) Guam (white) issues Tropical Cyclone Public Advisories for Micronesia. 3.1 Importance of Satellite OSVW Remotely-sensed OSVW from satellites are used by forecasters to help make wind warning and forecast decisions related to tropical and extratropical cyclones and other hazardous phenomena. NWS marine wind warnings and forecasts are used directly by mariners engaged in commerce, transportation and recreation to make safe and economically efficient passages. Additionally, tropical cyclone warnings are utilized by emergency managers, government officials, and the general public to prepare for potential impacts from these systems. Remotely-sensed OSVW help to fill the immense gaps inherent in the conventional ocean surface-based observation network. Remotely sensed OSVW often reveal small-scale characteristics of the wind field which are used as 11

13 a diagnostic tool in determining the development of potentially severe conditions, aid greatly in the determination of wind warning categories (severity), and help determine the radius of tropical storm force winds associated with tropical cyclones. Fig 2. The near surface wind vector field as shown by the morning ascending QuikSCAT passes over the North Atlantic from 30 June 2006 as displayed on the NWS N-AWIPS workstations available at the OPC, TPC/NHC, and the Honolulu WFO. Wind speeds in knots are color coded according to legend. 12

14 Fig 3. OPC forecaster Jim Clark using 12.5 km resolution QuikSCAT wind vectors to upgrade wind warnings for the Pacific Offshore waters for Cape Flattery, Washington to Cape Lookout, Oregon. The QuikSCAT pass shows the wind field of an entire ocean cyclone. 3.2 Utilization of Satellite OSVW Remotely-sensed OSVW are a critical tool for the issuance of marine forecasts and warnings, tropical cyclone analysis, location, and warnings, identification and warning of coastal gap and jet winds, and public forecasts and warnings. These applications of satellite OSVW data are expanded upon in the following section Marine warnings and forecasts Short-term warnings and forecasts for high seas and offshore waters Observational source for surface analyses The use of scatterometer data for the daily surface analysis is crucial. One of our most important graphical products is the 6-hourly synoptic chart over our extensive area of responsibility. (Edson, 2006) 1. QuikSCAT OSVW help to: o locate fronts and troughs o locate centers of high and low pressure o determine the category and extent of wind warning areas Gale (34-47 kt) Storm (48-63 kt) Hurricane Force (64 kt or greater) 13
 2.")
15 QuikSCAT is the first remote sensing instrument that can consistently distinguish extreme Hurricane Force conditions from less dangerous Storm Force conditions in extratropical cyclones. Due to the availability of QuikSCAT, OPC forecasters are now more likely to anticipate the onset of Hurricane Force conditions. (Sienkiewicz et al, 2006) 2. The availability of satellite OSVW measurements greatly reduces the data void over the open oceans The 1800-km wide swath of the QuikSCAT scatterometer makes it possible for forecasters to view the entire circulation of tropical and extratropical cyclones within a single pass. Since QuikSCAT OSVW have been available in near real-time in opertational NAWIPS workstations, the number of short term wind warnings issued by OPC forecasters for the high seas waters have dramatically increased. Figure 4 shows the percent increase in the number of wind warnings by category issued by the OPC during the late fall of Available OSVW from QuikSCAT resulted in an increase in all warning categories issued. The greatest increase was observed for the stronger and more dangerous hurricane force warning categories (Von Ahn et al. 2004). Fig 4. Percent increase in the number of wind warning issued by OPC (from 15 November to 15 December 2002) as a function of warning type. Atlantic results are shown as a solid blue line and Pacific results as a dashed red line. Hurricane Force (HF) extratropical cyclones are a significant threat to safety at sea. Dangerous winds and waves associated with these extreme cyclones can cover vast ocean areas and result in the loss of lives and property. The economic impact is far reaching and can consist of loss or damage to cargo or a vessel, increased transit times, increased fuel usage, lost time due to vessel damage, and late delivery of perishable goods. Prior to 14

16 QuikSCAT, there was no data source available to ocean forecasters that consistently observed HF winds in extratropical cyclones. Merchant ships do occasionally report extreme conditions but not routinely enough for forecasters to be able to consistently differentiate the extreme HF cyclone from the more common Storm Force cyclone. QuikSCAT has given OPC forecasters this consistency (Von Ahn et al. 2004). Fig. 5 Von Ahn et al provides an excellent example of the use of QuikSCAT OSVW in observing HF extratropical cyclones. The left panel of Fig. 5 shows a GOES infrared (IR) satellite image overlaid with conventional ship and buoy observations, and the corresponding OPC surface analyses (with fronts and isobars) of an intense North Pacific winter ocean storm from 1800 UTC 01 Dec The right panel of Fig. 5 shows a 12.5 km QuikSCAT OSVW field of the same cyclone at approximately the same time. Wind speeds are color coded with red wind barbs depicting winds of Hurricane Force intensity. The conventional ship and buoy observations failed to suggest a cyclone of this intensity. The OPC forecaster upgraded the warning to Hurricane Force based solely on the QuikSCAT winds. Fig. 5. Two panel figure showing (left) the OPC surface analysis for 1800 UTC 1 Dec 2004 for an intense North Pacific cyclone. Also shown are the GOES IR imagery and available ocean surface observations from ships of opportunity. The right panel displays the QuikSCAT 12.5 km resolution OSVW available to the OPC High Seas forecaster as displayed on the operational N-AWIPS workstations. Winds speed in knots is color coded according to the color bar shown in the lower right hand side of the image. Red wind barbs indicate wind speeds of Hurricane Force intensity. The forecaster upgraded the warning category to Hurricane Force for this cyclone based solely on the strength of QuikSCAT winds. QuikSCAT OSVW have given OPC forecasters the ability to consistently observe winter ocean storms of Hurricane Force (HF) intensity. Figure 6 shows a five year history of HF ocean storm activity in the North Atlantic and Pacific Oceans for the months of September through May from 2001 to

17 Fig. 6 The number of Hurricane Force (wind speed 64kt or greater) observed using QuikSCAT OSVW for five winter seasons, where the Atlantic is shown in blue, and the Pacific is in purple. For the first three seasons, only 25km QuikSCAT OSVW were used. When the 12.5 km resolution QuikSCAT OSVW were introduced into the N-AWIPS workstations, the total number of HF storms observed by OPC increased, whih can be attributed to the ability of the finer spatial resolution to capture the higher winds For the first three years of the study, on average 20 HF extratropical cyclones were observed in each ocean basin (21 in the Atlantic and 20 in the Pacific.) During the last two years the average number of HF storms increased dramatically (33 Atlantic, 34 Pacific). During the first three years only the standard 25 km resolution QuikSCAT OSVW were available to OPC forecasters. The final two years forecasters had both the 25 and 12.5 km QuikSCAT OSVW available to aid in the wind warning process. The 12.5 km QuikSCAT winds have less horizontal averaging thus are able to detect smaller scale areas of stronger winds. This example illustrates that high resolution OSVW result directly in more accurate warnings. Complex sea surface temperature gradients associated with the Gulf Stream and shelf break front exist across the OPC mid-atlantic and New England Offshore Zones. OSVW from QuikSCAT reveal significant wind speed gradients in the vicinity of these strong SST gradients. These wind gradients are most evident in the southerly flow in advance of an approaching frontal system. The wind speed pattern (of higher winds) tends to match the underlying SST pattern of warmer waters. Figure 7 is a four panel from March 8, 16
, (b) the difference in wind speed between 25 km QuikSCAT and the NCEP GFS 3 hr forecast 10 m winds, (c) three day GOES SST")
 matches the SST pattern in (c) with Gale (yellow) and near Gale (dark green) conditions over the Gulf Stream waters and winds of 15 to")
 and (d) show the differences between the NCEP GFS near surface wind speeds used as guidance by forecasters and the QuikSCAT winds.")
 show an underforecast of winds by the GFS of as much as 8 to 10 kt.")
18 2005 showing (a) QuikSCAT 12.5 km wind vectors color coded by wind speed according to the scale below (a), (b) the difference in wind speed between 25 km QuikSCAT and the NCEP GFS 3 hr forecast 10 m winds, (c) three day GOES SST composite valid 8 March, and (d) the difference between the.9950 sigma layer wind speed (approximately 30 m above the ocean surface) from the 3 hr GFS and QuikSCAT 25 km wind speed. In this example clearly the QuikSCAT wind field pattern in (a) matches the SST pattern in (c) with Gale (yellow) and near Gale (dark green) conditions over the Gulf Stream waters and winds of 15 to 20 kt over the cooler waters. In (a), a patch of higher wind speeds coincide with a warm Gulf Stream ring in the upper left. Both (b) and (d) show the differences between the NCEP GFS near surface wind speeds used as guidance by forecasters and the QuikSCAT winds. The difference fields show predominantly yellow and orange contours over the cooler waters representing an overforecast by as much as 6 to 8 kt by the GFS. Over the Gulf Stream and warm ring the difference in 10m wind speeds in (b) show an underforecast of winds by the GFS of as much as 8 to 10 kt. The GFS 30m wind speed difference in (d) agrees more closely with the winds over the warmer waters but grossly overestimates the wind speeds over the cooler waters. OPC forecasters have a variety of tools available to them to anticipate the impact of the underlying SST on the wind field and adjust the forecast accordingly. (a) (b) (c) (d) Fig. 7. Four panel from 8 March 2005 showing (a) QuikSCAT 12.5 km resolution wind field for the waters southeast of New England and Long Island, (c) 3 day GOES SST composite, and (b) and (d) differences in wind speed (kt) between QuikSCAT 25 km and 3 hr forecast GFS 10m winds and (d) 3 hr forecast GFS 30m winds. In (b) and (d) differences are displayed according to the color scale above (d). 17
19 3.2.2 Tropical Cyclone Analysis and Forecasting Remotely-sensed OSVW from QuikSCAT have also become an important tool for analysis and forecasting at the Tropical Prediction Center/National Hurricane Center (TPC/NHC), Central Pacific Hurricane Center (CPHC), the WFO Guam and JTWC. QuikSCAT wind speed and direction retrievals are utilized by the Hurricane Specialists Unit (publicly known as the NHC) in the analysis and forecasting of tropical cyclones (TCs) in the North Atlantic and eastern North Pacific basins. The data are also used by TPC s Tropical Analysis and Forecast Branch (TAFB) in the issuance of marine forecasts, warnings, and analyses for large portions of the tropical North Atlantic and eastern Pacific oceans. The mission of TPC/NHC is to save lives, mitigate property loss, and improve economic efficiency by issuing the best watches, warnings, forecasts, and analyses of hazardous tropical weather, and by increasing understanding of these hazards. One of the most significant challenges in accomplishing this mission is the scarcity of data over the oceans. Winds from the QuikSCAT scatterometer have filled in some of these gaps since the data have been available in near real-time and have been integrated into the daily operations of both the NHC and TAFB since (Brennan, 2006) QuikSCAT data have had a major impact in TC forecasting by providing estimates of: TC wind radii (maximum extent of 34 and 50 kt winds) The wide swath of retrieved winds from QuikSCAT is useful in determining the extent of 34-kt and occasionally 50-kt winds in tropical storms or hurricanes. NHC provides analyses and three-day forecasts of the maximum extent of the 34-kt and 50-kt winds in each full advisory package (nominally issued every 6 h); 36-h forecasts of the maximum extent of 64-kt winds are also provided, but QuikSCAT is typically not useful for determining 64-kt radii, because of its spatial resolution limitations and the presence of significant precipitation that generally exists under these conditions. The information on wind radii from QuikSCAT is especially useful for TCs outside the range of aircraft reconnaissance and in the eastern North Pacific basin where reconnaissance missions are flown relatively infrequently. Accurate wind radii are critical to the both TPC/NHC, CPHC, and WFO Guam watch and warning process, since they affect the size of tropical storm and hurricane watch and warning areas. Also, the timing of these watches and warnings is based in part on when 34-kt winds are expected to arrive at the coast. Wind radii analyses and forecasts are also important to the marine community, as the current and expected size and location of the 34-kt and 50-kt wind areas provide guidance to mariners seeking to avoid these hazardous wind conditions around a TC (Brennan 2006, Knabb 2006, Edson and Browning 2006).(Fig. 8) 18
 Maximum wind speed in tropical storms and marginal hurricanes QuikSCAT data can be helpful in determining the")
20 35kt 65kt+ X 50kt 35kt Fig 8. Hurricane Felix Determination of outer wind radii using QuikSCAT wind vectors (Edson) Maximum wind speed in tropical storms and marginal hurricanes QuikSCAT data can be helpful in determining the intensity of tropical depressions, tropical storms, and some Category 1 or 2 hurricanes, although careful interpretation of the data by the forecaster is imperative. In TCs of tropical storm or marginal hurricane intensity, QuikSCAT winds have shown some utility for estimating maximum sustained winds and compare favorably with reconnaissance flight level wind data in some cases (Fig 9). 19
 80 70 60 50 40 30 20 10 0 59 60 58 56 57 55 54 49 73 69 65 70 64 60 51 13 13 9 7 5 4 4 4 2 2 9/9/2005 11:16 9/9/2005 23:38 9/10/2005 10:52 65 62 63 60 59 60 60 55 55 49 51 8 4")

21 Ophelia QSCAT vs. Recon/SFMR 90 Wind (kt) /9/ :16 9/9/ :38 9/10/ : /11/2005 9/13/2005 9/13/ :26 0:00 11:14 Date/Time (UTC) /13/ : /14/ : /14/ : QSCAT- SMFR/Recon 25 QSCAT- SFMR/Recon 25km QSCAT 12.5km QSCAT Recon FL Max * 0.9 SFMR Best Track Intensity Fig 9. Time series of QuikSCAT wind maxima, maximum winds from Stepped Frequency Microwave Radiometer (SFMR), and maximum reconnaissance flight-level winds reduced by a factor of 0.9 in Hurricane Ophelia per standard practice. Bar graphs indicate the absolute difference between the 12.5 and 25 km QuikSCAT wind maxima and the SFMR/aircraft maxima at that time. Tropical cyclone center identification and location. o Identification of a closed surface wind circulation system is necessary to initiate advisories on a new tropical cyclone and to locate the center of mature tropical cyclones. Experience has shown that while automated wind direction solution from QuikSCAT is sometimes misleading, manual analysis of QuikSCAT ambiguities (alternative wind solutions) can often be used to identify early-stage closed circulations (Fig. 10) and to locate the centers of mature cyclones to precisions of a few tens of kilometres (Fig. 11) No closed circulation evident in automated solution Manual analysis supports surface circulation centered near 12.9 N, 52.4 W Several northerly and northwesterly ambiguities to W and SW of apparent center 0937 UTC 3 August 2004 Advisories initiated on TD#2 (later Bonnie) partly based on this analysis. TC Discussion: IT IS DIFFICULT TO ASCERTAIN IF THE SYSTEM...AN ESPECIALLY FAST MOVING ONE...HAS A CLOSED CIRCULATION WITHOUT DATA FROM A RECONNAISSANCE PLANE. YOU COULD MAKE THE CASE THAT A SMALL CIRCULATION EXISTS USING QUICKSAT AMBIGUITY ANALYSIS. Fig. 10 Early identification of a tropical depression using QuikSCAT ambiguity analysis 20


.")
 3.2.3 Identification and warning of coastal gap and jet winds")
22 Positioning of tropical cyclones Automated solution depicts closed circulation centered near 25.3 N Manual analysis supports center location further north near 25.9 N, Westerly ambiguities north of QSCAT solution center QuikSCAT wind vector solution for Hurricane QuikSCAT ambiguities for Hurricane Lisa at Lisa at 2115 UTC 29 September The yellow 2115 UTC 29 September The small yellow dot indicates the approximate location of the dot indicates the approximate location of the center from the automated wind solution. center determined from manual ambiguity analysis shown in red lines. Fig.11 Identification of storm center using all the retrieved ambiguities from QuikSCAT Extratropical transition QuikSCAT winds can help identify the expansion of the TC wind field during the extratropical transition process (Fig. 12). Extratropical transition 31/21Z Tropical 28/09Z 115kts Extratropical 04/08Z 50kts Fig. 12 Hurricane Cindy Extr atropical transition observed in QuikSCAT winds (Edson) Identification and warning of coastal gap and jet winds Identification and warning of gap wind events in the Eastern Pacific QuikSCAT winds have greatly improved the monitoring and forecasting of gap wind events, particularly in the Gulf of Tehuantepec (Fig 13). As noted by Cobb et al. (2003), prior to the availability of QuikSCAT data, forecasters had to rely on occasional ship observations to verify gale or 21
 (Hugh")
23 storm warnings in this region. Based on a study from 1999 through the present, 128 gale force wind events have been documented in the Gulf of Tehuantepec, with 29 of those events reaching storm-force magnitude (>=48 kt) (Hugh Cobb, personal communication). On average, gale-force winds occur 17 times during a cold season in the Gulf of Tehuantepec, with four storm-force events per season. Prior to the advent of QuikSCAT, the extent and magnitude of many of these high wind events was unknown due to a lack of observations. (Brennan, 2006) Since gap wind events are dominated by low-level cold advection and subsidence, rain contamination of QuikSCAT wind vectors is not a problem. The wide QuikSCAT swath is ideal for identifying the extent of winds of 20 kt, gale force, and storm force, and for comparison to numerical model forecasts of wind distribution.(brennan, 2006) Fig. 13 Gale force winds in Gulf of Tehuanatepec revealed in hi-resolution (12. 5km) QuikSCAT retrievals Public forecasts and warnings Remotely-sensed ocean surface winds used as a diagnostic tool Improved knowledge of upstream conditions over the oceans (lows, highs, wind maxima, fronts) gives both coastal and inland forecasters the ability to diagnose numerical model analyses and forecast fields for both coastal and land falling events. This often results in changes of warning criteria and the forecast timing of the onset of hazardous conditions. Coastal jets in the lee of caps and points Prior to QuikSCAT, the extent and impact of orographically induced jets and lee wakes were not well known. (Fig 14) 22

24 Low Level coastal jet QuikSCAT shows a large area of gale force winds (33 to 47 kt) strongest winds around 42kt QuikSCAT helps to identify the location and strength of coastal low level jets that typically form off the coast of Oregon and N. California during the summer months. These winds can exceed 35kt. These stong winds often produce : (UCAR, 2005) high seas that adversely affect marine interests and Wind shear that could impact aviation interests. ships and buoys are located just offshore and west of 130W. The low level jet falls between these two areas. QuikSCAT has given the marine forecaster the ability to determine the extent and strength of these winds enabling them to issue wind warnings and to forecast wave and swell Fig. 14 Example of Coastal Low Level Jet off the California coast as observed using the 12.5 km QuikSCAT pass from 1400 UTC 19 June 2006 Improved surf/swell forecasts Detailed ocean surface winds give forecasters a detailed view of swell generation areas and the ability to better diagnose the quality of numerical wave model guidance. This supports the NWS s increased focus on rip current forecasting Numerical Weather Prediction Satellite surface wind data improve numerical weather prediction (NWP) model forecasts in several ways. OSVW data contribute to the improved analyses of the surface wind field, and, through the data assimilation process, of the atmospheric mass and motion fields in the free atmosphere above the surface. provide important verification data for NWP model forecasts drive ocean models and surface wave models, to calculate surface fluxes of heat, moisture and momentum, and to construct surface climatology. The use of scatterometer observations in data assimilation systems can extend their usefulness substantially and lead to improved sea level pressure analyses, improved upper air analyses of both wind and geopotential, and improved short and extended-range numerical weather forecasts. (Atlas et al (2), 2006) Results from experiments in which QuikSCAT and/or WindSat OSVW data are assimilated also show a substantial increase in the ability to forecast storms over the oceans. Satellite OSVW data often provides indications of the formation of tropical cyclones earlier than other observing systems. (Fig.15) 23

25 Fig. 15 Relative impact of WindSat and QuikSCAT data on 5-day GEOS-4 forecasts of cyclones. This figure shows a positive impact of OSVW data on cyclones. The impact of QuikSCAT is slightly larger than WindSat for cyclone position, and significantly larger for cyclone magnitude. In the Northern Hemisphere (not shown), the impact is smaller and less consistent than for the Southern Hemisphere, and the impact of QuikSCAT is substantially better than for WindSat. (Atlas et al (1), 2006) The assimilation of QuikSCAT data results in a substantial reduction of both magnitude and displacement errors with respect to the control run (Fig.16). The 60 h forecast with QuikSCAT data is more accurate than the 24 h forecast without QuikSCAT data. Following these initial experiments QuikSCAT data began to be assimilated operationally in real time at NCEP and has been contributing substantially to the current accuracy of hurricane forecasting. (Atlas et al (2), 2006) Fig. 16 The impact of QuikSCAT data in a test version of the NCEP operational data assimilation system. The magnitude and displacement errors of Hurricane Cindy from 1999 over a 60 hour period. (Atlas et al (2), 2006) 24
26 Chelton et al 2006 illustrated the impact that the assimilation of QuikSCAT OSVW had on operational numerical weather prediction (NWP) models. NCEP and ECMWF began assimilating QuikSCAT winds operationally on 13 and 22 January 2002, respectively. The resulting improvements in the accuracies of these NWP models during the first year of QuikSCAT data assimilation are evident from the statistics presented by Chelton and Freilich These accuracy improvements occurred abruptly after implementation of the QuikSCAT assimilation procedure in each model. This is evident, for example, from the time series of the global percentage of wind direction differences less than 20 between QuikSCAT and the two NWP models shown in Fig.17. Significant improvements in this measure of agreement between the different wind estimates occurred immediately after 13 January 2002 in the NCEP model and immediately after 22 January 2002 in the ECMWF model. Fig. 17 (from Chelton et al 2006) Daily time series of the percentages of collocated winds with directional differences less than 20 between 15 Nov 2001 and 1 Mar The NCEP and ECMWF models began assimilating QuikSCAT winds on 13 Jan 2002 and 22 Jan 2002, respectively. Comparisons of (top) QuikSCAT vs NCEP winds, (middle) QuikSCAT vs ECMWF winds, and (bottom) NCEP vs ECMWF winds. The statistics were computed over the middle 1600 km of the QuikSCAT measurement swath, excluding the near nadir measurements within ±125 km of the QuikSCAT ground track. Each time series was smoothed with a 4-day running average. 25
27 3.3 Workshop Participants Statements The following quotes from several of the workshop presenters highlight the importance of a reliable and routine source of satellite ocean surface vector winds data in the operational environment. Rick Knabb Senior Hurricane Specialist, Tropical Prediction Center/National Hurricane Center, NOAA/NWS/NCEP, Miami, FL QuikSCAT has been a tremendous benefit to the Tropical Prediction Center. When QuikSCAT is gone, it will be like going back 7 years in tropical cyclone analysis. Losing QuikSCAT would be like losing a limb especially for Tropical Analysis and Forecasting Branch. Hugh Cobb Tropical Prediction Center/National Hurricane Center, NOAA/NWS/NCEP, Miami, FL QuikSCAT is our bread and butter. Capt. Caroline Bower Science Officer, Naval Pacific Meteorology and Oceanography Center (NPMOC)/ Joint Typhoon Warning Center (JTWC), Pearl Harbor, HI QuikSCAT plays a critical role in our tropical cyclone analysis and forecasting operations. Roger Edson Science and Operations Officer, NOAA/ National Service Forecast Office in Guam QuikSCAT has been absolutely vital for understanding the structure of tropical cyclones. Joe Sienkiewicz Chief (Acting), Ocean Application Branch W/NP42, Science Officer, NOAA/NWS/NCEP/OPC, Camp Springs, MD Because of QuikSCAT, our ability to assess current conditions has never been better and our warnings never more accurate. John Lovegrove Meteorologist-in-charge (MIC), NOAA/ National Service Forecast Office, in Medford, Oregon QuikSCAT has been instrumental in forecasting coastal jets. We didn't know they were out there before QuikSCAT. Mark Freeberg President of OCENS, OCENS, Inc., Seattle, WA We have thousands of users and QuikSCAT accounts for 15% of download of all wind products downloaded by these users. 26
28 4 Limitations of Current Systems The experience acquired utilizing QuikSCAT measurements for almost seven years has clearly demonstrated the positive impacts of these data in the operational weather analysis, forecasting and warning environment. The real-world experiences gained from exploiting the currently available research satellite missions has also revealed the limitations of the current satellite OSVW systems to the operational community. Understanding these limitations is just as important as understanding the positive impacts in identifying the present and future OSVW requirements of the operational weather community. Drawing upon the operational experiences to-date, limitations of current OSVW missions and requirements for future missions are listed bellow: The inability to resolve maximum winds in the inner core of most hurricanes It is necessary to have the capability to accurately measure all sustained wind speeds encountered in tropical cyclones, from zero up to 165 kts (Knabb,2006) The inability to resolve maximum winds in extra-tropical storms We do not know how strong the maximum winds that occur in winter ocean storms are. We only know that hurricane force conditions exist. Ocean waves respond to the square of the wind speed, therefore knowledge of the maximum wind speed (and direction) is needed for accurate wave predictions. (Sienkiewicz, 2006) Rain contamination and the resulting biases in retrieved wind speeds Co-located rain rate measurements are necessary to determine the influence of rain on the retrieved wind solution, A greatly reduced or even non-existent sensitivity to rain, and a resulting in the ability to provide reliable wind speed and direction retrievals regardless of rain rate (no rain, light rain, or heavy rain)(brennan, 2006, Sienkiewicz et al, 2006) Ambiguity removal errors make QuikSCAT-derived TC center locations unreliable and make the determination of whether a circulation center exists in incipient systems difficult, Elimination of the directional ambiguity errors, is necessary for more accurate position fixing of the center of a tropical cyclone, and/or for determining if a closed circulation center exists at all (a key factor in determining whether or not cyclogenesis has occurred)(brennan 2006,Edson 2006,Bower 2006) The long intervals between repeat passes of any single satellite even the broad swath QuikSCAT - over any given region; Scatterometer instruments have been shown to increase forecasting accuracy by providing spatially extensive surface wind measurements that can be assimilated into numerical weather prediction (NWP) models, by providing researchers with the necessary data to establish more precise physical concepts of behavior, and by providing tropical cyclone forecasters with increased knowledge in the data poor regions of the globe of position, outer wind structure, an approximate maximum intensity, genesis and early stage development, and the evolution of the outer winds during extratropical transition. An increase in global scatterometer coverage will provide more thorough input to the NWP assimilation process, fill in the remaining 10% gaps in daily satellite coverage over the tropical oceans, support the daily METWATCH and warning criteria of most tropical cyclone warning centers, thus providing 27
29 opportunity for early detection, motion and positioning and increase the data base for the research community (Edson,2006) The time lag between the satellite overpass and data receipt Reduce time of data receipt to at most a few minutes following the time of data collection by the satellite; The data are limited by their spatial resolution The unavailability of data near shore Coastal regions that are the responsibilities of many WFO s are the - area where most lives are lost (Lovegrove, 2006) With greater temporal/spatial resolution and more accurate wind speed and direction information, advisory or near-advisory conditions would be forecast with greater certainty and provide greater safety for boaters. (Lovegrove, 2006) The slow implementation of data delivery in the operational environment such as NAWIPS, AWIPS and data assimilation Offices across the country are equipped with surface analysis tools such as LAPS, MSAS, and ADAS, etc. These tools should be improved to have capability to ingest OSVW measurements from satellites. This would improve substantially the quality of the analysis over water and the usefulness of these tools when using them as part of the forecast and warning process and for populating grids. (Hinojosa, 2006, Stamus and Milliff, 2006) The lack of documentation and training limits the use of data and their impact on operations The training investment has been slim to none when the OSVW data are first made available. Initiatives/technologies like this appear on the Internet first and then only much later are products available in AWIPS. Even when available, only some forecasters use them. Satellite OSVW should be made part of the daily briefing procedure, but this has not yet been done, in part because of the lack of training. (Hinojosa, 2006, Stamus and Milliff, 2006) 5 The Requirements and the Requirements Gap 5.1 NPOESS Integrated Operational Requirements Current operational requirements for satellite ocean surface vector wind measurements are defined in Integrated Operational Requirements Document II (IORD-II, 2001). These requirements represent the basis on which the National Polar - orbiting Operational Environmental Satellite Systems (NPOESS) architecture is to be designed. The NPOESS Program is required to provide, for a period of at least 10 years, a remote sensing capability to acquire and receive in real time at field terminals and to acquire, store and disseminate to processing centers, global and regional environmental imagery and specialized meteorological, climatic, terrestrial, oceanographic, solar-geophysical and other data in support of Department of Commerce (DoC) mission requirements and Department of Defense (DoD) peacetime and wartime missions. The notional NPOESS architecture is based on a Cost and Operational Benefits Requirements Analysis of original IORD requirements conducted in (IORD II, 2001) 28
30 The IORD II document defines two levels of operational requirements: threshold and objectives. The objective requirements represent the desired measurement performance. The threshold requirements, listed in the IORD II, refer to the minimum requirements to be achieved at any point where measurements are sensed and EDR s are retrieved. These requirements were defined with the goal that the final output products for both DoD and DoC Centers are accurate forecasts and analyses of environmental conditions to enhance various military and civilian operations. These forecasts are prepared using data from multiple systems, including NPOESS. DoC and DoD operational requirements are data values to be used as inputs to computer algorithms in order to create final forecast products for customers. 5.2 NOAA s Operational OSVW Requirements The operational needs and experience with the currently available satellite OSVW measurements presented during the workshop culminated in the formulation of new operational OSVW requirements. These requirements reflect the observational needs of NWS and JTWC forecasters to prepare warnings and forecasts for a variety of meteorological and oceanographic phenomena observed over the oceans including: tropical cyclones, extratropical ocean storms, areas of convection, gap flows, upwelling areas, topographically induced or enhanced jets, and island and mountain wakes. The spatial grid spacing reflects both the phenomena observed and the horizontal resolution of gridded forecasts now produced in operations by coastal NWS Weather Forecast Offices. All-weather retrievals (i.e. accurate retrievals in rain) Accuracy levied upon the selected 10-meter 1-minute sustained wind as defined by operational requirements kts wind speed range kts: speed +/- 2 kt and direction+/- 10 degrees (2 sigma) 4-10kts: speed +/- 2 kt and direction +/- 20 degrees (2 sigma) 0-4kts: speed +/- 2kts Revisit time interval (defined as the time interval between measurements at a particular point on the ocean surface): every 6 hours (1-3 hour goal) Reduced product latency: minutes from measurement to product availability (15 min goal) 2.5 km x 2.5 km grid spacing which is defined as the spacing between unique wind vector retrievals (1 km x 1 km goal) Unique wind vector grid cells to within 2.5 km of the coast (1km goal) Wind fields must be delivered into the operational environment, i.e., NAWIPS, AWIPS and data assimilation systems Product documentation / tutorial / training 5.3 Comparison of Current and New Requirements with Available OSVW Measurements The IORD II threshold and objective requirements for OSVW EDR s were compared with: 29
31 performances of currently operating sensors: QuikSCAT and WindSat, projected performance from JPL study of a next generation satellite instrument for measuring OSVW. This study is elaborated upon in Section (6) of this document, and new NOAA operational OSVW requirements as defined during the workshop and listed in Section 5.2. The comparison is summarized in Table 1. It is important to note that the stated accuracies of the current satellite instruments QuikSCAT and WindSat are based on the current sensor performances, not their respective mission requirements. The comparison clearly shows that: Neither of the currently operational OSVW sensors satisfies the new operational OSVW requirements. New operational requirements: o exceed IORD II threshold values in all categories and o are close to IORD II objectives for most of the categories and o exceed even the IORD II objectives for the wind speed measurements range OSVW measurements produced by QuikSCAT o exceed IORD II thresholds in the requirement categories of measurement range, wind speed accuracy, resolution, and swath width o fail to meet IORD II threshold requirements for satellite revisit time and measurement latency. OSVW measurements produced by WindSat instrument: o exceed the IORD II threshold for wind speed accuracy within IORD II the limited IORD II measurement range and o match the threshold level for directional accuracy for wind speeds higher than 6m/s and o fail to meet the IORD II threshold level for spatial resolution and wind direction at wind speeds below 6m/s o since WindSat was the CMIS risk reduction mission this instrument was not designed to meet time revisit and latency requirements. However even a single CMIS instrument in polar orbit will not meet the IORD II revisit/coverage requirements The new operational OSVW requirements are compared to current and future OSVW missions in the Tables and
32 Table Comparison of IORD II requirements and QuikSCAT and WindSat performance IORD-II Threshold QuikSCAT WindSat IORD-II Objective NEW OSVW Requirements Horizontal Cell Size 20km 25km 12km operational 5km experimental 50km operational 35km experimental 1km 2.5km x2.5km unique grid spacing 1kmx1km goal Mapping Uncertainty 5km 1km Measurement Range 3-25m/s 0-360º 3-40m/s 0-360º 3-25m/s 0-360º 3-50m/s 0-360º m/s 0-360º Measurement Accuracy Speed Direction Greater of 2m/s or 10% Greater of 1m/s or 10% All wspd +/-1m/s Wspd>5m/s ~20º Wspd<3m/s >20º Wspd>7m/s <20º ~10º Wspd >5m/s ~10º Wspd<5m/s ~ 25º Wspd >3m/s <20º Wspd<7m/s <30º ~10º Wspd<5m/s ~20º Latency 90min 3h 5h 15min 45-60min 15min goal Revisit Time 6h 18h 34h 1h 6h (1-3h goal) Swath Width 1700km 1800km 1000km Coastal Winds 30/20km of the coast 75km of the coast 2.5km of the coast Worse than the IORD-II Threshold Worse than the IORD-II Objective IORD-II Threshold IORD-II Objective Better than the IORD-II Threshold Better than the IORD-II Objective 31
33 Table Comparison of IORD II requirements and CMIS, ASCAT and JPL proposed next generation measurements (*Accuracies of next generation OVW Measurements are based on simulations) IORD-II Threshold CMIS (Canceled) ASCAT Next Generation OVWM NEW OSVW Requirements 50km operational Horizontal Cell Size 20km 20km operational 25km operational 1km-5km Ku-band 12.5km C-band <20km radiometer 2.5km x2.5km unique grid spacing 1kmx1km goal 12.5km experimental Mapping Uncertainty 5km Measurement Range 3-25m/s 0-360º 3-25m/s 0-360º 3-30m/s 0-360º 2-55m/s or greater m/s 0-360º Measurement Accuracy Speed Direction Greater of 2m/s or 10% Greater of 2m/s or 10% Greater of 2m/s or 10% Wspd>5m/s ~20º ~20º <20º Wspd<7m/s <1m/s at 2km or <0.3m/s at 12.5km Wspd<15m/s <1.6m/s at 2km or <0.4m/s at 12.5km wspd~50m/s ~10m/s at 12.5km <74º at 2km <28º at 12.5km All wspd +/-1m/s wspd >5m/s ~10º Wspd<5m/s ~ 25º ~ 25º <25º <24º at 2km <6º at 12.5km Wspd<5m/s ~20º Latency 90min 90min 45min 15min 45-60min 15min goal Revisit Time 6h 19h 32h 18h 6h (1-3h goal) Swath Width 1700km 1700km 2x500km 768km nadir hole 1800km Worse than the IORD-II Threshold Worse than the IORD-II Objective IORD-II Threshold IORD-II Objective Better than the IORD-II Threshold Better than the IORD-II Objective 32
34 6 Meeting the Next Generation Ocean Surface Vector Wind Requirements As previously noted, the main objectives of this workshop were to: Assess the operational utilization and impact of satellite OSVW measurements in weather forecasting, warning, and analysis; and Consider measurement accuracy, resolution, and coverage requirements for future NOAA operational ocean surface vector wind products in light of present experience from research missions, and planned future advances in the areas of numerical weather models, analytical techniques, and NOAA global, regional, and storm forecast requirements. The workshop briefly surveyed mature and developing technologies that could form the basis for near-future operational NOAA ocean surface vector winds observing systems. Concepts for a next generation ocean vector winds instrument are being studied by JPL, and the performance characteristics of one promising approach are described below in section Meteorological Satellites There are generally two classes of meteorological satellites being used today: geostationary and sun-synchronous near-polar orbiting satellites. Geostationary satellites follow a circular orbit that is orientated in the plane of the Earth's equator. These satellites are placed at a very high altitude (35,786 km) where the satellite s orbital period exactly matches the orbital period of the Earth, so the satellite is always positioned over the same point on the equator. This makes geostationary satellites ideal for making repeated observations of a fixed geographical area centered on the equator. They can only view the whole earth disk below them, rather than a small subsection, and scan the same area very frequently (typically every minutes), which makes them ideal for certain meteorological applications such as the cloud imagery seen on the television weather. However geostationary satellites are unable to observe the Polar regions and a network of 5-6 satellites is needed to provide global coverage. The geostationary orbit is ideal for images at the shorter wavelength (higher frequencies) found in the visible and infra-red spectrum. The power and antenna size requirements for a microwave system to measure the Earth s surface from geostationary orbit is totally inadequate. Polar-orbiting satellites operate in lower Earth orbits, where a typical polar-orbiting meteorological satellite is at an altitude of about 850km. The lower altitude makes a polar-orbiting platform more suitable for the microwave frequencies needed to return OSVW. The antenna size and power requirements are realistically achievable for the moving platform with respect to the ocean surface supports the OSVW measurement technique. For reasons such as those mentioned above the instruments for measuring 33
35 OSVW are placed on polar-orbiting satellites. Therefore, we limit our consideration of next generation instruments for measuring OSVW data to ones that will be placed on polar orbiting satellites. 6.2 Current and Potential Future Ocean Vector Wind Measurement Systems: Status on Meeting the Next Generation NOAA Requirements The measurement of OSVW from space using microwaves has a long heritage and includes multiple measurement techniques, which can be broadly classified as active microwave scatterometry or passive polarimetric radiometry. Active scatterometers have a longer history, starting with the NASA NSCAT Ku-band scatterometer (Freilich and Dunbar, 1999), the NASA SeaWinds Ku-band scatterometer flown in the ADEOS-II and QuikSCAT missions, the ESA ERS-1 and ERS-2 C-band scatterometers (Quilfen et al., 1999), and the forthcoming ESA ASCAT C-band scatterometer (Gelsthorpe et al., 2000). Recently, high-resolution wind speed estimates have been demonstrated using C-band synthetic aperture radar (SAR), although wind direction determination using SAR is still experimental (Beal et al., 2003). Passive polarimetric radiometry measurements of OSVW have been demonstrated by the WindSat mission (Gaiser et al., 2004), which was a precursor to the now cancelled NPOESS CMIS instrument ( The result of the NOAA requirements workshop is that remotely sensed OSVW are highly desirable to both the operational and research communities. However, the capabilities of current instruments do not match the ultimate desires of the user community. A result of the workshop was the generation of a consensus set of desired measurement requirements which should become the goals for the design of future operational OSVW measurement systems. These requirements are summarized in Table below. The requirements in Table are more stringent than the measurement characteristics of present or currently planned ocean vector wind measurement (OVWM) instruments. Table summarizes some of the key measurement characteristics of present and planned OVWM systems, together with a summary of the advantages and disadvantages of each technique. 34
36 Parameter NOAA Requirements Next-Generation Performance All-weather capabilities Wind Speed Range Accurate retrievals in cloudy or rainy conditions 2m/s m/s Retrievals under cloudy and rainy conditions 2 m/s - 55m/s (or greater?) Wind Speed Accuracy (10 m/ 1 minute) Wind Direction Accuracy (2m/s - 5m/s) Wind Direction Accuracy (5m/s - 83m/s) Grid Horizontal Resolution Coastal Coverage 1m/s (2σ) 20 o (2σ) 10 o (2σ) 2.5 km (1 km goal) 2.5 km (1 km goal) Wind speed <7m/s: <1m/s (2σ) at 2km resolution; <0.3 m/s (2s) at 12.5 km resolution. Wind speed <15m/s: <1.6m/s (2σ) at 2km resolution; <0.4 m/s (2σ) at 12.5 km resolution. Wind Speed ~50 m/s: ~10 m/s (2σ) at 12.5 km resolution (Cband) 74 o (2σ) at 2km resolution. 28 o (2σ) at 12.5 km resolution <24 o (2σ) at 2km resolution. <6 o (2σ) at 12.5 km resolution 1 km - 5km horizontal resolution. Grid spacing 2km 1 km - 5km horizontal resolution. Grid spacing 2km Revisit Time 6 hours (1-3 hour goal) 1 Platform: ~18 hours. 2Platforms: ~9 hours Data Latency minutes from measurement product availability (15 minute goal) 1 Polar Ground Station: ~90 minutes for data download, 15 minute latency. 2 Polar Nort/South Ground Stations: ~45 minutes for data download, 15 minutes latency. Table 6.1.1: NOAA OSVW measurement requirements and expected JPL proposed (Rodrigez at al, 2006) next-generation Ocean Vector Wind Mission Performance. 35
37 System Measurement Method Swath/Average time between measurements Spatial Resolution Measurement Advantages Measurement Limitations QuikSCAT Ku-Band Scatterometer 1800km/ ~18hours 12.5 km/ ~5km experimental High resolution, long heritage, well calibrated and validated Limited coverage in rain, saturation for wind speeds ~40 m/s WindSat Multi-frequency polarimetric radiometry 950 km (Common Swath)/ ~34hours 30 km Able to detect rain, SST, good ambiguity resolution Low spatial resolution, unproven performance at low wind speeds and high wind speeds CMIS ASCAT Multi-frequency polarimetric radiometry C-band scatterometer 1700 km/ ~19hours 2 x 500 km swaths (768 km nadir hole)/ ~32 hours 20 km 50 km Low spatial resolution, unproven Able to detect performance at rain, SST, good low wind speeds ambiguity and high wind resolution speeds Good performance at higher wind speeds and under rainy conditions Low spatial resolution, worse performance at low wind speeds SAR Winds C-band scatterometer with SAR processing 500km achieved with single satellite ScanSAR/ ~64hours ~300 m Very high Wind direction spatial estimation still resolution, good experimental, performance at swath limited to high winds ~500 km MeoScat Ku-Band Scatterometer 2900km/ ~11hours >10 km Better temporal sampling Limited spatial resolution, limited coverage during rain, saturation at high wind speeds Next Generation OVWM Ku-Band Scatterometer, C- band Scatterometer, Multi-frequency polarimetric radiometer 1800km/ ~18hours 1km-5km Ku- Band, 12.5 km C-band, <20 kmradiometry Combines advantages from other techniques Higher data rate than real aperture scatterometer or radiometers Table 6.1.2: Comparison among different OSVW measurement systems and the next generation OVWM. A comparison of Tables and shows that existing OVWM concepts fail to meet the next-generation NOAA operational requirements for measurement revisit time and 36
 level, but may not meet the NOAA 2σ (95%) requirement, especially for very high wind speeds.")
38 measurement spatial resolution by almost one order of magnitude. The measurement accuracy goal is currently being met up to moderate wind speeds at the 1σ (68%) level, but may not meet the NOAA 2σ (95%) requirement, especially for very high wind speeds. Meeting the temporal sampling requirements is not feasible using a single spaceborne platform, due to Earth curvature limitations. As an illustration of the typical revisit time limitations of different OVWM concepts, we present in Fig.18 the spatial revisit characteristics of various platforms and platform combinations. It is clear from Fig.18 that meeting the NOAA requirement for six hour revisit times will require at least two, and probably three, independent platforms. Since meeting the measurement requirement is impossible with a single platform, we concentrate on meeting the other NOAA requirements and assume that in order to satisfy the needs of its user community, the next-generation OVWM system will ultimately consist of multiple platforms, suitably coordinated to minimize the measurement repeat interval. Fig 18: Measurement revisit time for NSCAT (purple), ERS-1 and ERS-2 (orange), ASCAT (red), SeaWinds on ADEOS-II and QuikSCAT (SWS, green), and the MEOScat concept (black). Also shown are revisit times for combinations of two platforms. In order to best meet the requirements set out in Table 6.1.1, while maintaining the high level of heritage and validation required for an operational mission with a moderate cost, we have decided to combine the best parts of the concepts shown in Table into a single instrument, which we call the next-generation OVWM. This combination is feasible and cost effective due to the fact that all of the measurements can be made with a 37
39 pencil-beam single antenna reflector. This reduces the instrument cost significantly, while providing complementary measurements that are co-located (albeit with different spatial resolutions). The instrument concept includes both active and passive measurements. The components and the rationale for their inclusion are: Ku-Band SAR Scatterometer: Ku-band SAR scatterometry presents the only method for achieving high resolution (1 km 5 km) spatial resolution with a moderate size antenna (2.5 m reflector). C-band Real Aperture Scatterometer: C-band is required for minimizing rain effects, while providing accurate wind speed measurements at high wind speeds Multi-Frequency Polarimetric Radiometer Channels: The inclusion of multiple radiometer channels is required for providing rain corrections and improving wind speed estimation and rain correction. Simulated results of such a platform are compared to reality and the performance of the 12.5-km QuikSCAT output in Fig. 19. Finally, we conclude that the system proposed here, while not meeting all of the NOAA next generation requirements, is a cost effective system for meeting many of them and providing a significant enhancement over current capabilities for those requirements which are not fully met. This combination of instrument and measurement heritage, moderate instrument cost, and a quantum increase in instrument performance make the next-generation concept presented here an attractive candidate for providing the first step towards an operational mission which will meet NOAA s requirements. 38

40 Fig 19: Ocean vector winds from a front produced by a squall. The top panel is the truth, the middle panel represents simulated results for the 2km resolution OVWM system, while the bottom panel shows the capability of the present QuikSCAT system at 12.5 km resolution. 39
J16.1 PRELIMINARY ASSESSMENT OF ASCAT OCEAN SURFACE VECTOR WIND (OSVW) RETRIEVALS AT NOAA OCEAN PREDICTION CENTER
 RETRIEVALS AT NOAA OCEAN PREDICTION CENTER") J16.1 PRELIMINARY ASSESSMENT OF ASCAT OCEAN SURFACE VECTOR WIND (OSVW) RETRIEVALS AT NOAA OCEAN PREDICTION CENTER Khalil. A. Ahmad* PSGS/NOAA/NESDIS/StAR, Camp Springs, MD Joseph Sienkiewicz NOAA/NWS/NCEP/OPC,
J16.1 PRELIMINARY ASSESSMENT OF ASCAT OCEAN SURFACE VECTOR WIND (OSVW) RETRIEVALS AT NOAA OCEAN PREDICTION CENTER Khalil. A. Ahmad* PSGS/NOAA/NESDIS/StAR, Camp Springs, MD Joseph Sienkiewicz NOAA/NWS/NCEP/OPC,
An Update Usage of ASCAT and OSCAT Winds at the NOAA Ocean Prediction Center (OPC), National Hurricane Center (NHC)
, National Hurricane Center (NHC)") An Update Usage of ASCAT and OSCAT Winds at the NOAA Ocean Prediction Center (OPC), National Hurricane Center (NHC) Joseph Sienkiewicz (OPC), Michael Brennan (NHC), Gregory McFadden (IMSG), Hugh D. Cobb
An Update Usage of ASCAT and OSCAT Winds at the NOAA Ocean Prediction Center (OPC), National Hurricane Center (NHC) Joseph Sienkiewicz (OPC), Michael Brennan (NHC), Gregory McFadden (IMSG), Hugh D. Cobb
Impact of the Loss of QuikSCAT on NOAA NWS Marine Warning and
 Impact of the Loss of QuikSCAT on NOAA NWS Marine Warning and Forecast Operations Joseph Sienkiewicz 1 Michael J. Brennan 2, Richard Knabb 3, Paul S. Chang 4, Hugh Cobb 2, Zorana J. Jelenak 5, Khalil A.
QuikSCAT Analysis of Hurricane Force Extratropical Cyclones in the Pacific Ocean
 University of Rhode Island DigitalCommons@URI Senior Honors Projects Honors Program at the University of Rhode Island 2010 QuikSCAT Analysis of Hurricane Force Extratropical Cyclones in the Pacific Ocean
Joan M. Von Ahn, Joseph M. Sienkiewicz and Gregory M. McFadden NOAA Ocean Prediction Center 5200 Auth Road Camp Springs, MD USA
 The Application of Sea Level Pressure and Vorticity Fields derived from the University of Washington Planetary Boundary Layer Model in the NOAA Ocean Prediction Center Joan M. Von Ahn, Joseph M. Sienkiewicz
Zorana Jelenak Paul S. Chang Khalil Ahmed (OPC) Seubson Soisuvarn Qi Zhu NOAA/NESDIS/STAR-UCAR
 Seubson Soisuvarn Qi Zhu NOAA/NESDIS/STAR-UCAR") Near Real Time ASCAT Wind Vectors at NOAA and High Wind Issue Zorana Jelenak Paul S. Chang Khalil Ahmed (OPC) Seubson Soisuvarn Qi Zhu NOAA/NESDIS/STAR-UCAR ASCAT Wind Processing Implemented at NOAA Feb
Near Real Time ASCAT Wind Vectors at NOAA and High Wind Issue Zorana Jelenak Paul S. Chang Khalil Ahmed (OPC) Seubson Soisuvarn Qi Zhu NOAA/NESDIS/STAR-UCAR ASCAT Wind Processing Implemented at NOAA Feb
The Operational Use of QuikSCAT Ocean Surface Vector Winds at the National Hurricane Center
 VOLUME 24 W E A T H E R A N D F O R E C A S T I N G JUNE 2009 The Operational Use of QuikSCAT Ocean Surface Vector Winds at the National Hurricane Center MICHAEL J. BRENNAN NOAA/NWS/NCEP/National Hurricane
Operational Utilization of High Resolution Ocean Surface Wind Vectors (25km or better) in the Marine Forecasting Environment
 in the Marine Forecasting Environment") Operational Utilization of High Resolution Ocean Surface Wind Vectors (25km or better) in the Marine Forecasting Environment Paul S. Chang, PI NOAA/NESDIS/Office of Research and Applications NOAA Science
Operational Utilization of High Resolution Ocean Surface Wind Vectors (25km or better) in the Marine Forecasting Environment Paul S. Chang, PI NOAA/NESDIS/Office of Research and Applications NOAA Science
NWS Operational Marine and Ocean Forecasting. Overview. Ming Ji. Ocean Prediction Center National Weather Service/NCEP. CIOSS/CoRP
 NWS Operational Marine and Ocean Forecasting Overview Ming Ji Ocean Prediction Center National Weather Service/NCEP CIOSS/CoRP CoRP Symposium Corvallis, OR Aug. 12-13, 13, 2008 Titanic Telegram Marine
P1.6 Simulation of the impact of new aircraft and satellite-based ocean surface wind measurements on H*Wind analyses
 P1.6 Simulation of the impact of new aircraft and satellite-based ocean surface wind measurements on H*Wind analyses Timothy L. Miller 1, R. Atlas 2, P. G. Black 3, J. L. Case 4, S. S. Chen 5, R. E. Hood
EVALUATION OF WINDSAT SURFACE WIND DATA AND ITS IMPACT ON OCEAN SURFACE WIND ANALYSES AND NUMERICAL WEATHER PREDICTION
 5.8 EVALUATION OF WINDSAT SURFACE WIND DATA AND ITS IMPACT ON OCEAN SURFACE WIND ANALYSES AND NUMERICAL WEATHER PREDICTION Robert Atlas* NOAA/Atlantic Oceanographic and Meteorological Laboratory, Miami,
NHC Ocean Vector Winds Update
 NHC Ocean Vector Winds Update Michael J. Brennan NOAA/NWS/NCEP National Hurricane Center International Ocean Vector Winds Science Team Meeting Portland, Oregon, 20 May 2015 Current Status NHC is currently
A Preliminary Climatology of Extratropical Transitions in the Southwest Indian Ocean
 A Preliminary Climatology of Extratropical Transitions in the Southwest Indian Ocean Kyle S. Griffin Department of Atmospheric and Environmental Sciences, University at Albany, State University of New
WEATHER FORECASTING Acquisition of Weather Information WFO Regions Weather Forecasting Tools Weather Forecasting Tools Weather Forecasting Methods
 1 2 3 4 5 6 7 8 WEATHER FORECASTING Chapter 13 Acquisition of Weather Information 10,000 land-based stations, hundreds of ships and buoys; four times a day, airports hourly Upper level: radiosonde, aircraft,
Ch. 11: Hurricanes. Be able to. Define what hurricane is. Identify the life and death of a hurricane. Identify the ways we track hurricanes.
 Ch. 11: Hurricanes Be able to Define what hurricane is. Identify the life and death of a hurricane. Identify the ways we track hurricanes. What are Hurricanes? Smaller than mid-latitude cyclones. Don t
John Steffen and Mark A. Bourassa
 John Steffen and Mark A. Bourassa Funding by NASA Climate Data Records and NASA Ocean Vector Winds Science Team Florida State University Changes in surface winds due to SST gradients are poorly modeled
CHAPTER 13 WEATHER ANALYSIS AND FORECASTING MULTIPLE CHOICE QUESTIONS
 CHAPTER 13 WEATHER ANALYSIS AND FORECASTING MULTIPLE CHOICE QUESTIONS 1. The atmosphere is a continuous fluid that envelops the globe, so that weather observation, analysis, and forecasting require international
Northeastern United States Snowstorm of 9 February 2017
 Northeastern United States Snowstorm of 9 February 2017 By Richard H. Grumm and Charles Ross National Weather Service State College, PA 1. Overview A strong shortwave produced a stripe of precipitation
Hurricane Structure: Theory and Diagnosis
 Hurricane Structure: Theory and Diagnosis 7 March, 2016 World Meteorological Organization Workshop Chris Landsea Chris.Landsea@noaa.gov National Hurricane Center, Miami Outline Structure of Hurricanes
Ensemble Prediction Systems
 Ensemble Prediction Systems Eric Blake National Hurricane Center 7 March 2017 Acknowledgements to Michael Brennan 1 Question 1 What are some current advantages of using single-model ensembles? A. Estimates
CASE STUDY OF THE NOVEMBER WINDSTORM IN SOUTH CENTRAL COLORADO
 32 CASE STUDY OF THE 12-13 NOVEMBER WINDSTORM IN SOUTH CENTRAL COLORADO Paul Wolyn * NOAA/NWS Pueblo, CO 1. INTRODUCTION During the evening and early morning of 12-13 November 2011, a damaging downslope
SMAP Winds. Hurricane Irma Sep 5, AMS 33rd Conference on Hurricanes and Tropical Meteorology Ponte Vedra, Florida, 4/16 4/20, 2018
 Intensity and Size of Strong Tropical Cyclones in 2017 from NASA's SMAP L-Band Radiometer Thomas Meissner, Lucrezia Ricciardulli, Frank Wentz, Remote Sensing Systems, Santa Rosa, USA Charles Sampson, Naval
Storm Summary for Hurricane Jose
 Storm Summary for Hurricane Jose Tuesday, September 19, 2017 at 11 AM EDT (Output from Hurrevac, based on National Hurricane Center Forecast Advisory #57) Jose is currently a Category 1 hurricane on the
A two-season impact study of the Navy s WindSat surface wind retrievals in the NCEP global data assimilation system
 A two-season impact study of the Navy s WindSat surface wind retrievals in the NCEP global data assimilation system Li Bi James Jung John Le Marshall 16 April 2008 Outline WindSat overview and working
11/19/14. Chapter 11: Hurricanes. The Atmosphere: An Introduction to Meteorology, 12 th. Lutgens Tarbuck
 Chapter 11: Hurricanes The Atmosphere: An Introduction to Meteorology, 12 th Lutgens Tarbuck Lectures by: Heather Gallacher, Cleveland State University! Hurricanes: " Hurricanes are intense centers of
2) What general circulation wind belt is the place of origin for hurricanes? A) westerlies B) trade winds C) doldrums D) horse latitudes
 What general circulation wind belt is the place of origin for hurricanes? A) westerlies B) trade winds C) doldrums D) horse latitudes") Meteo 1010 Homework 6 1) What is the difference between a typhoon and a hurricane? A) A hurricane is a true tropical cyclone, but a typhoon is not. B) A hurricane is stronger than a typhoon. C) They represent
Meteo 1010 Homework 6 1) What is the difference between a typhoon and a hurricane? A) A hurricane is a true tropical cyclone, but a typhoon is not. B) A hurricane is stronger than a typhoon. C) They represent
Q-Winds satellite hurricane wind retrievals and H*Wind comparisons
 Q-Winds satellite hurricane wind retrievals and H*Wind comparisons Pet Laupattarakasem and W. Linwood Jones Central Florida Remote Sensing Laboratory University of Central Florida Orlando, Florida 3816-
The Transition of Atmospheric Infrared Sounder Total Ozone Products to Operations
 The Transition of Atmospheric Infrared Sounder Total Ozone Products to Operations Emily Berndt 1, Bradley Zavodsky 2, Gary Jedlovec 2 1 NASA Postdoctoral Program Marshall Space Flight Center, Huntsville,
PRMS WHITE PAPER 2014 NORTH ATLANTIC HURRICANE SEASON OUTLOOK. June RMS Event Response
 PRMS WHITE PAPER 2014 NORTH ATLANTIC HURRICANE SEASON OUTLOOK June 2014 - RMS Event Response 2014 SEASON OUTLOOK The 2013 North Atlantic hurricane season saw the fewest hurricanes in the Atlantic Basin
Weather and Climate Summary and Forecast October 2017 Report
 Weather and Climate Summary and Forecast October 2017 Report Gregory V. Jones Linfield College October 4, 2017 Summary: Typical variability in September temperatures with the onset of fall conditions evident
Analysis of Fall Transition Season (Sept-Early Dec) Why has the weather been so violent?
 Why has the weather been so violent?") WEATHER TOPICS Analysis of Fall Transition Season (Sept-Early Dec) 2009 Why has the weather been so violent? As can be seen by the following forecast map, the Fall Transition and early Winter Season of
WEATHER TOPICS Analysis of Fall Transition Season (Sept-Early Dec) 2009 Why has the weather been so violent? As can be seen by the following forecast map, the Fall Transition and early Winter Season of
IMPACT OF GROUND-BASED GPS PRECIPITABLE WATER VAPOR AND COSMIC GPS REFRACTIVITY PROFILE ON HURRICANE DEAN FORECAST. (a) (b) (c)
 (b) (c)") 9B.3 IMPACT OF GROUND-BASED GPS PRECIPITABLE WATER VAPOR AND COSMIC GPS REFRACTIVITY PROFILE ON HURRICANE DEAN FORECAST Tetsuya Iwabuchi *, J. J. Braun, and T. Van Hove UCAR, Boulder, Colorado 1. INTRODUCTION
9B.3 IMPACT OF GROUND-BASED GPS PRECIPITABLE WATER VAPOR AND COSMIC GPS REFRACTIVITY PROFILE ON HURRICANE DEAN FORECAST Tetsuya Iwabuchi *, J. J. Braun, and T. Van Hove UCAR, Boulder, Colorado 1. INTRODUCTION
ATMOSPHERIC MODELLING. GEOG/ENST 3331 Lecture 9 Ahrens: Chapter 13; A&B: Chapters 12 and 13
 ATMOSPHERIC MODELLING GEOG/ENST 3331 Lecture 9 Ahrens: Chapter 13; A&B: Chapters 12 and 13 Agenda for February 3 Assignment 3: Due on Friday Lecture Outline Numerical modelling Long-range forecasts Oscillations
Weather Analysis and Forecasting
 Weather Analysis and Forecasting An Information Statement of the American Meteorological Society (Adopted by AMS Council on 25 March 2015) Bull. Amer. Meteor. Soc., 88 This Information Statement describes
Weather and Climate Summary and Forecast Summer 2017
 Weather and Climate Summary and Forecast Summer 2017 Gregory V. Jones Southern Oregon University August 4, 2017 July largely held true to forecast, although it ended with the start of one of the most extreme
Operational Impact of QuikSCAT Winds at the NOAA Ocean Prediction Center
 AUGUST 2006 V O N A H N E T A L. 523 Operational Impact of QuikSCAT Winds at the NOAA Ocean Prediction Center JOAN M. VON AHN STG, Inc., and NOAA/NESDIS/ORA, Camp Springs, Maryland JOSEPH M. SIENKIEWICZ
High Resolution Vector Wind Retrieval from SeaWinds Scatterometer Data
 High Resolution Vector Wind Retrieval from SeaWinds Scatterometer Data David G. Long Brigham Young University, 459 Clyde Building, Provo, UT 84602 long@ee.byu.edu http://www.scp.byu.edu Abstract The SeaWinds
Careful, Cyclones Can Blow You Away!
 Title: Careful, Cyclones Can Blow You Away! (Meteorology) Grade(s): 6-8 Introduction: Most people associate twisters with tornadoes, but in fact tropical twisters come from hurricanes. Hurricanes are what
Weather and Climate Summary and Forecast November 2017 Report
 Weather and Climate Summary and Forecast November 2017 Report Gregory V. Jones Linfield College November 7, 2017 Summary: October was relatively cool and wet north, while warm and very dry south. Dry conditions
NHC Ensemble/Probabilistic Guidance Products
 NHC Ensemble/Probabilistic Guidance Products Michael Brennan NOAA/NWS/NCEP/NHC Mark DeMaria NESDIS/STAR HFIP Ensemble Product Development Workshop 21 April 2010 Boulder, CO 1 Current Ensemble/Probability
P2.9 Use of the NOAA ARL HYSPLIT Trajectory Model For the Short Range Prediction of Stratus and Fog
 Ellrod, G. P., 2013: Use of the NOAA ARL HYSPLIT Trajectory Model for the Short Range Prediction of Stratus and Fog. Extended Abstract, 38 th National Weather Association Annual Meeting, Charleston, SC,
Impact of METOP ASCAT Ocean Surface Winds in the NCEP GDAS/GFS and NRL NAVDAS
 Impact of METOP ASCAT Ocean Surface Winds in the NCEP GDAS/GFS and NRL NAVDAS COAMPS @ Li Bi 1,2 James Jung 3,4 Michael Morgan 5 John F. Le Marshall 6 Nancy Baker 2 Dave Santek 3 1 University Corporation
Predicting Tropical Cyclone Formation and Structure Change
 Predicting Tropical Cyclone Formation and Structure Change Patrick A. Harr Department of Meteorology Naval Postgraduate School Monterey, CA 93943-5114 phone: (831)656-3787 fax: (831)656-3061 email: paharr@nps.navy.mil
Hurricane Season 2010 & NOAA s Deepwater Response
 Hurricane Season 2010 & NOAA s Deepwater Response What s Happened? What Will 2010 Bring? Possible Shoreline Effects Darin Figurskey Meteorologist-in-Charge NOAA s NWS Raleigh, NC NOAA s National Weather
Enhancing Weather Information with Probability Forecasts. An Information Statement of the American Meteorological Society
 Enhancing Weather Information with Probability Forecasts An Information Statement of the American Meteorological Society (Adopted by AMS Council on 12 May 2008) Bull. Amer. Meteor. Soc., 89 Summary This
A Tropical Cyclone with a Very Large Eye
 JANUARY 1999 PICTURES OF THE MONTH 137 A Tropical Cyclone with a Very Large Eye MARK A. LANDER University of Guam, Mangilao, Guam 9 September 1997 and 2 March 1998 1. Introduction The well-defined eye
Maritime Weather Information: Automatic Reporting, A New Paradigm
 Maritime Weather Information: Automatic Reporting, A New Paradigm Joe Sienkiewicz, NOAA/NWS Ocean Prediction Center Responsibilities under SOLAS Met Services Contracting governments Observations Limited
Outlook 2008 Atlantic Hurricane Season. Kevin Lipton, Ingrid Amberger National Weather Service Albany, New York
 Outlook 2008 Atlantic Hurricane Season Kevin Lipton, Ingrid Amberger National Weather Service Albany, New York Summary 2007 Hurricane Season Two hurricanes made landfall in the Atlantic Basin at category-5
Tropical Update. 5 PM EDT Tuesday, September 5, 2017 Hurricane Irma, Tropical Storm Jose, and Tropical Depression Thirteen
 Tropical Update 5 PM EDT Tuesday, September 5, 2017 Hurricane Irma, Tropical Storm Jose, and Tropical Depression Thirteen This update is intended for government and emergency response officials, and is
The North Atlantic Oscillation: Climatic Significance and Environmental Impact
 1 The North Atlantic Oscillation: Climatic Significance and Environmental Impact James W. Hurrell National Center for Atmospheric Research Climate and Global Dynamics Division, Climate Analysis Section
APPENDIX B PHYSICAL BASELINE STUDY: NORTHEAST BAFFIN BAY 1
 APPENDIX B PHYSICAL BASELINE STUDY: NORTHEAST BAFFIN BAY 1 1 By David B. Fissel, Mar Martínez de Saavedra Álvarez, and Randy C. Kerr, ASL Environmental Sciences Inc. (Feb. 2012) West Greenland Seismic
Weather Forecasting. March 26, 2009
 Weather Forecasting Chapter 13 March 26, 2009 Forecasting The process of inferring weather from a blend of data, understanding, climatology, and solutions of the governing equations Requires an analysis
5E's. View the video clip:
 5E's TEKS 8.10 (C) identify the role of the oceans in the formation of weather systems such as hurricanes Engage View the video clip: http://www.youtube.com/watch?v=h9vpwmtnozc What is a hurricane? How
Frank Revitte National Weather Service. Weather Forecast Office New Orleans/Baton Rouge
 Frank Revitte National Weather Service Weather Forecast Office New Orleans/Baton Rouge Above normal activity 17 Total Named Storms 7 Tropical Storms 4 Hurricanes 6 Major Hurricanes Not the most active,
Eastern Shore Weather and Climate. Bill Sammler Warning Coordination Meteorologist National Weather Service Wakefield, VA
 Eastern Shore Weather and Climate Bill Sammler Warning Coordination Meteorologist National Weather Service Wakefield, VA About The NWS The National Weather Service is: A Federal Government Agency Part
Why There Is Weather?
 Lecture 6: Weather, Music Of Our Sphere Weather and Climate WEATHER The daily fluctuations in atmospheric conditions. The atmosphere on its own can produce weather. (From Understanding Weather & Climate)
Myung-Sook Park, Russell L. Elsberry and Michael M. Bell. Department of Meteorology, Naval Postgraduate School, Monterey, California, USA
 Latent heating rate profiles at different tropical cyclone stages during 2008 Tropical Cyclone Structure experiment: Comparison of ELDORA and TRMM PR retrievals Myung-Sook Park, Russell L. Elsberry and
Introduction forecast Procedure of National Typhoon Center / KMA
 The 6 th China-Korea Joint Workshop on Tropical Cyclones (26 May-1 June, 2013) Introduction forecast Procedure of National Typhoon Center / KMA Lee, Jae-shin(jaeshin_l@yahoo.com) National Typhoon Center(NTC)
Tropical Update. 5 AM EDT Thursday, September 7, 2017 Hurricane Irma, Hurricane Jose, and Hurricane Katia
 Tropical Update 5 AM EDT Thursday, September 7, 2017 Hurricane Irma, Hurricane Jose, and Hurricane Katia This update is intended for government and emergency response officials, and is provided for informational
Using satellite-based remotely-sensed data to determine tropical cyclone size and structure characteristics
 DISTRIBUTION STATEMENT A. Approved for public release; distribution is unlimited. Using satellite-based remotely-sensed data to determine tropical cyclone size and structure characteristics PI: Elizabeth
WELCOME TO THE 2018 RA-IV WORKSHOP ON HURRICANE FORECASTING AND WARNING
 WELCOME TO THE 2018 RA-IV WORKSHOP ON HURRICANE FORECASTING AND WARNING Richard J. Pasch and Daniel P. Brown Senior Hurricane Specialists National Hurricane Center ORIENTATION Use of PCs NHC Facility Workshop
2013 ATLANTIC HURRICANE SEASON OUTLOOK. June RMS Cat Response
 2013 ATLANTIC HURRICANE SEASON OUTLOOK June 2013 - RMS Cat Response Season Outlook At the start of the 2013 Atlantic hurricane season, which officially runs from June 1 to November 30, seasonal forecasts
Hurricane Basics and Preparedness. Jim Weyman Director, Central Pacific Hurricane Center Phone Office:
 Hurricane Basics and Preparedness Jim Weyman Director, Central Pacific Hurricane Center Phone Office: 973-5270 james.weyman@noaa.gov United States Hurricane/Typhoon Centers National Hurricane Center, Miami
South Asian Climate Outlook Forum (SASCOF-6)
") Sixth Session of South Asian Climate Outlook Forum (SASCOF-6) Dhaka, Bangladesh, 19-22 April 2015 Consensus Statement Summary Below normal rainfall is most likely during the 2015 southwest monsoon season
Sixth Session of South Asian Climate Outlook Forum (SASCOF-6) Dhaka, Bangladesh, 19-22 April 2015 Consensus Statement Summary Below normal rainfall is most likely during the 2015 southwest monsoon season
The Mid Latitude Low trends Check the clouds: Check the barometer: Check the wind: Check the temperature:
 The Mid Latitude Low Mid Latitude lows tend to develop along stationary fronts. In particular, they tend to develop along a boundary between a cold, polar air mass and a warm, tropical air mass. As they
NOAA Direct Broadcast Data Initiative to Meet NWP Latency Requirements
 Prepared by M. Goldberg Agenda Item: II/2 Discussed in WG-II NOAA Direct Broadcast Data Initiative to Meet NWP Latency Requirements Summary of the Working Paper Action 40.18: CGMS Agencies to support fast
Operational Monsoon Monitoring at NCEP
 Operational Monsoon Monitoring at NCEP Wassila M. Thiaw Climate Prediction Center National Centers for Environmental Predictions Operational Monsoon Monitoring at NCEP Wassila M. Thiaw Climate Prediction
The National Weather Service of the Future: Building a Weather-Ready Nation
 The of the Future: Building a Weather-Ready Nation Dr. Louis W. Uccellini Director, NOAA Assistant Administrator for Weather Services NCEP Production Suite Review December 2, 2014 Outline Building a Weather-Ready
Tropical Cyclone Formation/Structure/Motion Studies
 Tropical Cyclone Formation/Structure/Motion Studies Patrick A. Harr Department of Meteorology Naval Postgraduate School Monterey, CA 93943-5114 phone: (831) 656-3787 fax: (831) 656-3061 email: paharr@nps.edu
Feel free to ask for help also, we will try our best to answer your question or at least direct you to where you can find the answer.
 Page 1 Objectives: Become familiar with online resources and image searching tools Interpret different types of satellite imagery Learn about the variety of different types of TCs Part 1: Browse available
Tropical Storms & Hurricanes Part 1. August 1992
 Lecture #16 (April 5, 2010, Monday) Tropical Storms & Hurricanes Part 1 August 1992 Tracks of rain accumulation & clouds from Hurricane Rita September 2005 Tropical Cyclones Around the Globe Why none here?
Chapter 24 Tropical Cyclones
 Chapter 24 Tropical Cyclones Tropical Weather Systems Tropical disturbance a cluster of thunderstorms about 250 to 600 km in diameter, originating in the tropics or sub-tropics Tropical depression a cluster
1C.4 TROPICAL CYCLONE TORNADOES: SYNOPTIC SCALE INFLUENCES AND FORECASTING APPLICATIONS
 1C.4 TROPICAL CYCLONE TORNADOES: SYNOPTIC SCALE INFLUENCES AND FORECASTING APPLICATIONS Daniel J. Cecil and Lori A. Schultz University of Alabama in Huntsville, Huntsville, AL, 35805 1. INTRODUCTION Several
Tropical Update. 5 PM EDT Thursday, September 7, 2017 Hurricane Irma, Hurricane Jose, and Hurricane Katia
 Tropical Update 5 PM EDT Thursday, September 7, 2017 Hurricane Irma, Hurricane Jose, and Hurricane Katia This update is intended for government and emergency response officials, and is provided for informational
NDIA System Engineering Conference 26 October Benjie Spencer Chief Engineer, NOAA/National Weather Service
 NDIA System Engineering Conference 26 October 2015 Benjie Spencer Chief Engineer, NOAA/National Weather Service The National Weather Service of the Future: Building a Weather-Ready Nation Previous NWS
Surface Wind/Stress Structure under Hurricane
 Surface Wind/Stress Structure under Hurricane W. Timothy Liu and Wenqing Tang, JPL Asymmetry Relating wind to stress 2008 NASA Ocean Vector Wind Science Team Meeting, 19-21 November 2008, Seattle, WA Asymmetry
Cold air outbreak over the Kuroshio Extension Region
 Cold air outbreak over the Kuroshio Extension Region Jensen, T. G. 1, T. Campbell 1, T. A. Smith 1, R. J. Small 2 and R. Allard 1 1 Naval Research Laboratory, 2 Jacobs Engineering NRL, Code 7320, Stennis
North Pacific Climate Overview N. Bond (UW/JISAO), J. Overland (NOAA/PMEL) Contact: Last updated: August 2009
, J. Overland (NOAA/PMEL) Contact: Last updated: August 2009") North Pacific Climate Overview N. Bond (UW/JISAO), J. Overland (NOAA/PMEL) Contact: Nicholas.Bond@noaa.gov Last updated: August 2009 Summary. The North Pacific atmosphere-ocean system from fall 2008 through
North Pacific Climate Overview N. Bond (UW/JISAO), J. Overland (NOAA/PMEL) Contact: Nicholas.Bond@noaa.gov Last updated: August 2009 Summary. The North Pacific atmosphere-ocean system from fall 2008 through
Evaluating a Genesis Potential Index with Community Climate System Model Version 3 (CCSM3) By: Kieran Bhatia
 By: Kieran Bhatia") Evaluating a Genesis Potential Index with Community Climate System Model Version 3 (CCSM3) By: Kieran Bhatia I. Introduction To assess the impact of large-scale environmental conditions on tropical cyclone
Evaluating a Genesis Potential Index with Community Climate System Model Version 3 (CCSM3) By: Kieran Bhatia I. Introduction To assess the impact of large-scale environmental conditions on tropical cyclone
16D.3 EYEWALL LIGHTNING OUTBREAKS AND TROPICAL CYCLONE INTENSITY CHANGE
 16D.3 EYEWALL LIGHTNING OUTBREAKS AND TROPICAL CYCLONE INTENSITY CHANGE Nicholas W. S. Demetriades and Ronald L. Holle Vaisala Inc., Tucson, Arizona, USA Steven Businger University of Hawaii Richard D.
NUMERICAL EXPERIMENTS USING CLOUD MOTION WINDS AT ECMWF GRAEME KELLY. ECMWF, Shinfield Park, Reading ABSTRACT
 NUMERICAL EXPERIMENTS USING CLOUD MOTION WINDS AT ECMWF GRAEME KELLY ECMWF, Shinfield Park, Reading ABSTRACT Recent monitoring of cloud motion winds (SATOBs) at ECMWF has shown an improvement in quality.
28th Conference on Hurricanes and Tropical Meteorology, 28 April 2 May 2008, Orlando, Florida.
 P2B. TROPICAL INTENSITY FORECASTING USING A SATELLITE-BASED TOTAL PRECIPITABLE WATER PRODUCT Mark DeMaria* NOAA/NESDIS/StAR, Fort Collins, CO Jeffery D. Hawkins Naval Research Laboratory, Monterey, CA
Foundations of Earth Science, 6e Lutgens, Tarbuck, & Tasa
 Foundations of Earth Science, 6e Lutgens, Tarbuck, & Tasa Weather Patterns and Severe Weather Foundations, 6e - Chapter 14 Stan Hatfield Southwestern Illinois College Air masses Characteristics Large body
Storm Summary for Hurricane Joaquin
 Storm Summary for Hurricane Joaquin Wednesday, September 30, 2015 at 5 PM EDT (Output from Hurrevac, based on National Hurricane Center Forecast Advisory #12) Joaquin is currently a Category 1 hurricane
Overview of the Tropical Cyclone Guidance Project
 Overview of the Tropical Cyclone Guidance Project Dr. Jonathan L. Vigh With thanks to Mahsa Mirzargar (Univ. of Miami) Shanghai Typhoon Institute 09 July 2018 NCAR is sponsored by the National Science
Hurricane Structure: Theory and Application. John Cangialosi National Hurricane Center
 Hurricane Structure: Theory and Application John Cangialosi National Hurricane Center World Meteorological Organization Workshop Is this Tropical, Subtropical, or Extratropical? Subtropical Tropical Extratropical
How does NASA study hurricanes? 17 August 2015, by Max Gleber
 How does NASA study hurricanes? 17 August 2015, by Max Gleber Hurricanes are the most powerful weather event on Earth. NASA's expertise in space and scientific exploration contributes to essential services
AnuMS 2018 Atlantic Hurricane Season Forecast
 AnuMS 2018 Atlantic Hurricane Season Forecast Issued: April 10, 2018 by Dale C. S. Destin (follow @anumetservice) Director (Ag), Antigua and Barbuda Meteorological Service (ABMS) The *AnuMS (Antigua Met
WindSat Ocean Surface Emissivity Dependence on Wind Speed in Tropical Cyclones. Amanda Mims University of Michigan, Ann Arbor, MI
 WindSat Ocean Surface Emissivity Dependence on Wind Speed in Tropical Cyclones Amanda Mims University of Michigan, Ann Arbor, MI Abstract Radiometers are adept at retrieving near surface ocean wind vectors.
APPLICATIONS OF SEA-LEVEL PRESSURE
 APPLICATIONS OF SEA-LEVEL PRESSURE RETRIEVAL FROM SCATTEROMETER WINDS Jérôme Patoux, Ralph C. Foster and Robert A. Brown OVWST meeting Seattle, November 20, 2008 Pressure retrieval: how does it work? model
PICTURE OF THE MONTH. Satellite Imagery of Sea Surface Temperature Cooling in the Wake of Hurricane Edouard (1996)
") 2716 MONTHLY WEATHER REVIEW VOLUME 125 PICTURE OF THE MONTH Satellite Imagery of Sea Surface Temperature Cooling in the Wake of Hurricane Edouard (1996) FRANK M. MONALDO Applied Physics Laboratory, The
2716 MONTHLY WEATHER REVIEW VOLUME 125 PICTURE OF THE MONTH Satellite Imagery of Sea Surface Temperature Cooling in the Wake of Hurricane Edouard (1996) FRANK M. MONALDO Applied Physics Laboratory, The
NWS and Navy Plans for the ATCF and AWIPS2
 NWS and Navy Plans for the ATCF and AWIPS2 Mark DeMaria, Craig A. Mattocks, Christopher Mello, Michael Brennan and Monica Bozeman NOAA/NWS National Hurricane Center, Miami, FL Charles R. Sampson and Michael
Current and Upcoming NASA Hurricane Measurement Missions National Hurricane Conference
 NASA Science Mission Directorate Earth Science Division Applied Sciences Program Current and Upcoming NASA Hurricane Measurement Missions National Hurricane Conference April 18, 2017 Formulation Implementation
Weather and Climate Summary and Forecast Fall/Winter 2016
 Weather and Climate Summary and Forecast Fall/Winter 2016 Gregory V. Jones Southern Oregon University November 5, 2016 After a year where we were seemingly off by a month in terms of temperatures (March
Weather and Climate Summary and Forecast October 2018 Report
 Weather and Climate Summary and Forecast October 2018 Report Gregory V. Jones Linfield College October 4, 2018 Summary: Much of Washington, Oregon, coastal California and the Bay Area and delta region
Tropical Cyclones. Objectives
 Tropical Cyclones FIU Undergraduate Hurricane Internship Lecture 2 8/8/2012 Objectives From this lecture you should understand: Global tracks of TCs and the seasons when they are most common General circulation
IMPACT EXPERIMENTS ON GMAO DATA ASSIMILATION AND FORECAST SYSTEMS WITH MODIS WINDS DURING MOWSAP. Lars Peter Riishojgaard and Yanqiu Zhu
 IMPACT EXPERIMENTS ON GMAO DATA ASSIMILATION AND FORECAST SYSTEMS WITH MODIS WINDS DURING MOWSAP Lars Peter Riishojgaard and Yanqiu Zhu Global Modeling and Assimilation Office, NASA/GSFC, Greenbelt, Maryland
Weather and Climate Summary and Forecast Summer 2016
 Weather and Climate Summary and Forecast Summer 2016 Gregory V. Jones Southern Oregon University June 6, 2016 May 2016 continued the warm trend for portions of the west, while providing some relief for
1. Introduction. 2. Verification of the 2010 forecasts. Research Brief 2011/ February 2011
 Research Brief 2011/01 Verification of Forecasts of Tropical Cyclone Activity over the Western North Pacific and Number of Tropical Cyclones Making Landfall in South China and the Korea and Japan region
Bringing Consistency into High Wind Measurements with Spaceborne Microwave Radiometers and Scatterometers
 International Ocean Vector Wind Science Team Meeting May 2-4, 2017, Scripps Bringing Consistency into High Wind Measurements with Spaceborne Microwave Radiometers and Scatterometers Thomas Meissner, Lucrezia