Terminal Ceiling & Visibility PDT
|
|
|
- Stewart Mills
- 6 years ago
- Views:
Transcription
1 Terminal Ceiling & Visibility PDT AWRP Program Management Review 19 November 2002 Dave Clark PMR_Nov_02-1
2 Terminal C&V Project Areas SFO Marine Stratus Forecast System Activities - Continued development NYC Winter Weather C&V - Scope - Initial Efforts PMR_Nov_02-2


3 Stratus Impact on SFO Approach Mt. Diablo Golden Gate Bridge Hunters Pt. Almeda NAS 6000 Oakland Intl. Hayward 3500 Cedes Intl AM San Francisco Intl. San Mateo Bridge Briny Intl. Halfmoon Bay San Carlos Porte Intl Palo Alto 4000 Moffett NAS San Jose Intl. Reid Hillview 9 AM Offshore to So. California Pesca Intl. San Francisco Bay Area Bay Approach Major Jet Arrival and Departure Routes PMR_Nov_02-3 Arrivals Departures 11 AM
")
4 System Sensing Network SODAR Sensor Suite Fort Funston S. F. Bay Oakland SFO Pacific Ocean Half Moon Bay San Carlos ARTCC Surface Weather Observation SODAR (Acoustic Sounder) Pyranometer (SW Radiation) Sonic Anemometer Radiosonde (Weather Balloon) San Jose PMR_Nov_02-4
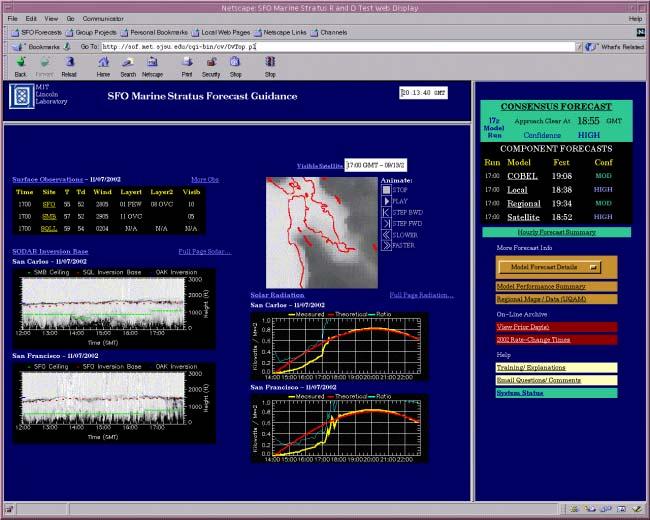
5 PMR_Nov_02-5
6 2002 Highlights Major effort over winter to automate model development process - Allows testing of many more predictors and paths - Facilitates development at other airports (e.g. NYC) Upgraded SODARs prior to start of demonstration 2002 Demonstration June through October - Excellent SODAR performance - Two versions of models were implemented PMR_Nov_02-6

7 2002 SODAR Upgrade Issue: Control of audio signal based on aging technology; longterm maintainability problem. Poor signal quality at SFO Solution: Replace with PC sound card technology SFO SODAR 2001 SFO SODAR 2002 PMR_Nov_02-7
8 Forecast Model Development COBEL Physical Column Model Key Inputs: High resolution temp, humidity, wind, solar radiation Consensus Forecast Local Statistical Forecast Model Key Inputs: Local measurements of cloud base and inversion height, wind, pressure Regional Statistical Forecast Model Key Inputs: Regional hourly surface observations, 12Z Oakland sounding Satellite Statistical Forecast Model Key Input: GOES visible satellite PMR_Nov_02-8
9 Statistical Model Development Process Data Re-scale Predictors Select potential predictors (up to several hundred). Re-scale nonlinearly based on correlation with predictand (side-by time). Predictor Nulling Examine correlations and redundancies to reduce establish pool of best candidate predictors. (20 predictors) All-Paths Testing Fit all combinations of 20 best predictors (~ 1 million forecast equations). For each models size (# of predictors, 1-20), order by best fit. Select best 200 of each size. (4000 equations) Crossvalidation Cross-validate (10 samples). Sort, eliminate all fits worse than 1-minute error from best fit. Rank remaining equations by error and stability. ( equations) Final Selection Select from candidates based on preferred predictors (e.g. based on predictor availability, etc.) PMR_Nov_02-9
10 2002 Forecast Models A 2001B A 2002B Apr May Jun Jul Aug Sep Oct Nov Dec Jan Feb Mar Apr May Jun Jul Aug Sep Oct Nov Dec Operational Demo Automation Process Developed Operational Demo Version 2002A models implemented in June -Prototype version from automated processing -Some inadequecies were revealed New models (2002B) implemented mid-august - Improvements to correct model over fitting - Case selection during development process - Reduction in overestimate of forecast confidence (impacts model weighting) -1 st overnight forecasts (RSFM at 09z &11z) PMR_Nov_02-10
11 Model Development Historical Performance Consensus Forecast, 2002 Data Median Absolute Error (hours) 13z 14z 15z 16z 17z 18z 2001B A B PMR_Nov_02-11
12 Intermodel Comparison 2002 Data, Model Version 2002B Median Absolute Error (hours) 09z 11z 13z 14z 15z 16z 17z 18z Consensus COBEL Local SFM Regional SFM Satellite SFM PMR_Nov_02-12
13 Objectives for Forecast Upgrades Extension of some products to overnight hours -Zi algorithm - COBEL and Local SFM Investigate improvements to Satellite & Regional SFMs Objective Identification of pro-active decision opportunities CONSENSUS FORECAST 16z Approach Clear at 17:25 GMT Run Confidence MOD Probability of Clearing By: 17Z 18Z 19Z 20Z 65% 90% 93% 95% COMPONENT FORECASTS Run Model Fcst Conf 16z COBEL 18:00 MOD 16z Local 17:50 MOD 16z Regional 17:45 MOD 16z Satellite 16:55 MOD CWSU - REPORT RATE CHANGE Display Modification Concept PMR_Nov_02-13

 - Airlines: forecasting and dispatch - Researchers")
14 Northeast Winter C&V Prediction Joint effort with National C&V and Winter Wx PDTs NYC area to act as testbed Initial user meeting held on Long Island in March - Air Traffic Managers - NWS Forecasters (CWSU, FO, and Region) - Airlines: forecasting and dispatch - Researchers PMR_Nov_02-14
15 Northeast C&V Initial efforts Winter to survey needs to steer development - Web-based Discussion Board: Air traffic managers, forecasters, product developers - Investigate application of NCEP model data Sensor testbed deployments at Brookhaven & Rutgers Initial product development - Precipitation visibility nowcast based on WSSDM technology - Regional SFM based on SFO technology PMR_Nov_02-15
16 Summary Completion of 2002 Demonstration at SFO SODAR upgrades Statistical model development automation Two versions of models tested Continuing work at SFO Final model changes Extension of products to overnight hours Development of proactive decision aid Initial efforts beginning on Winter Weather C&V (NYC) PMR_Nov_02-16
Terminal Domain Decision Support. Jim Evans MIT Lincoln Lab. Tom Davis
 Terminal Domain Decision Support Jim Evans MIT Lincoln Lab on behalf of Tom Davis NASA Ames Outline Review of Center-TRACON Advisory System (CTAS) Winds information to support trajectory calculations Convective
An Operational Evaluation of the Ground Delay Program (GDP) Parameters Selection Model (GPSM)
 Parameters Selection Model (GPSM)") An Operational Evaluation of the Ground Delay Program (GDP) Parameters Selection Model (GPSM) Lara Shisler, Christopher Provan Mosaic ATM Dave Clark MIT Lincoln Lab William Chan, Shon Grabbe NASA Ames
An Operational Evaluation of the Ground Delay Program (GDP) Parameters Selection Model (GPSM) Lara Shisler, Christopher Provan Mosaic ATM Dave Clark MIT Lincoln Lab William Chan, Shon Grabbe NASA Ames
GAMINGRE 8/1/ of 7
 FYE 09/30/92 JULY 92 0.00 254,550.00 0.00 0 0 0 0 0 0 0 0 0 254,550.00 0.00 0.00 0.00 0.00 254,550.00 AUG 10,616,710.31 5,299.95 845,656.83 84,565.68 61,084.86 23,480.82 339,734.73 135,893.89 67,946.95
Citation. As Published Publisher. Version. Accessed Tue Oct 02 18:42:30 EDT 2018 Citable Link Terms of Use. Detailed Terms
 Forecast-Based Decision Support for San Francisco International Airport: A NextGen Prototype System That Improves Operations during Summer Stratus Season The MIT Faculty has made this article openly available.
Corridor Integrated Weather System (CIWS) MIT Lincoln Laboratory. CIWS D. Meyer 10/21/05
 MIT Lincoln Laboratory. CIWS D. Meyer 10/21/05") Corridor Integrated Weather System () Outline Example of Weather Impacting Air traffic Impacts on worst delay day Ways to reduce delay Improve forecasts Aid traffic flow management Aviation Delay Problem
Corridor Integrated Weather System () Outline Example of Weather Impacting Air traffic Impacts on worst delay day Ways to reduce delay Improve forecasts Aid traffic flow management Aviation Delay Problem
Colorado s 2003 Moisture Outlook
 Colorado s 2003 Moisture Outlook Nolan Doesken and Roger Pielke, Sr. Colorado Climate Center Prepared by Tara Green and Odie Bliss http://climate.atmos.colostate.edu How we got into this drought! Fort
WIND DATA REPORT FOR THE YAKUTAT JULY 2004 APRIL 2005
 WIND DATA REPORT FOR THE YAKUTAT JULY 2004 APRIL 2005 Prepared on July 12, 2005 For Bob Lynette 212 Jamestown Beach Lane Sequim WA 98382 By John Wade Wind Consultant LLC 2575 NE 32 nd Ave Portland OR 97212
Finding Aid for the Collection of Material about the Southern Pacific Railway,
 http://oac.cdlib.org/findaid/ark:/13030/kt0779p30k No online items Pacific Railway, 1900-1950 Processed by UCLA Library Special Collections staff; machine-readable finding aid created by Caroline Cubé.
2003 Water Year Wrap-Up and Look Ahead
 2003 Water Year Wrap-Up and Look Ahead Nolan Doesken Colorado Climate Center Prepared by Odie Bliss http://ccc.atmos.colostate.edu Colorado Average Annual Precipitation Map South Platte Average Precipitation
2003 Moisture Outlook
 2003 Moisture Outlook Nolan Doesken and Roger Pielke, Sr. Colorado Climate Center Prepared by Tara Green and Odie Bliss http://climate.atmos.colostate.edu Through 1999 Through 1999 Fort Collins Total Water
IMPROVING THE ACCURACY OF RUNWAY ALLOCATION IN AIRCRAFT NOISE PREDICTION
 IMPROVING THE ACCURACY OF RUNWAY ALLOCATION IN AIRCRAFT NOISE PREDICTION David G. Southgate and Jonathan P. Firth Aviation Operations, Dept of Transport and Regional Services (DOTARS), Canberra, Australia
Drought in Southeast Colorado
 Drought in Southeast Colorado Nolan Doesken and Roger Pielke, Sr. Colorado Climate Center Prepared by Tara Green and Odie Bliss http://climate.atmos.colostate.edu 1 Historical Perspective on Drought Tourism
Weather Products for Decision Support Tools Joe Sherry April 10, 2001
 Weather Products for Decision Support Tools Joe Sherry National Convective Weather Forecast (NCWF) Computer generated graphical forecast extending 0-1 hours, updated every 5 minutes Conservative forecast
FPAW October Pat Murphy & David Bright NWS Aviation Weather Center
 FPAW October 2014 Pat Murphy & David Bright NWS Aviation Weather Center Overview Ensemble & Probabilistic Forecasts What AWC Is Doing Now Ensemble Processor What s In Development (NOAA Aviation Weather
Methodology for the creation of meteorological datasets for Local Air Quality modelling at airports
 Methodology for the creation of meteorological datasets for Local Air Quality modelling at airports Nicolas DUCHENE, James SMITH (ENVISA) Ian FULLER (EUROCONTROL Experimental Centre) About ENVISA Noise
Monthly Long Range Weather Commentary Issued: February 15, 2015 Steven A. Root, CCM, President/CEO
 Monthly Long Range Weather Commentary Issued: February 15, 2015 Steven A. Root, CCM, President/CEO sroot@weatherbank.com JANUARY 2015 Climate Highlights The Month in Review During January, the average
Jackson County 2013 Weather Data
 Jackson County 2013 Weather Data 61 Years of Weather Data Recorded at the UF/IFAS Marianna North Florida Research and Education Center Doug Mayo Jackson County Extension Director 1952-2008 Rainfall Data
Memo. I. Executive Summary. II. ALERT Data Source. III. General System-Wide Reporting Summary. Date: January 26, 2009 To: From: Subject:
 Memo Date: January 26, 2009 To: From: Subject: Kevin Stewart Markus Ritsch 2010 Annual Legacy ALERT Data Analysis Summary Report I. Executive Summary The Urban Drainage and Flood Control District (District)
A Report on a Statistical Model to Forecast Seasonal Inflows to Cowichan Lake
 A Report on a Statistical Model to Forecast Seasonal Inflows to Cowichan Lake Prepared by: Allan Chapman, MSc, PGeo Hydrologist, Chapman Geoscience Ltd., and Former Head, BC River Forecast Centre Victoria
Champaign-Urbana 2001 Annual Weather Summary
 Champaign-Urbana 2001 Annual Weather Summary ILLINOIS STATE WATER SURVEY 2204 Griffith Dr. Champaign, IL 61820 wxobsrvr@sws.uiuc.edu Maria Peters, Weather Observer January: After a cold and snowy December,
Responsive Traffic Management Through Short-Term Weather and Collision Prediction
 Responsive Traffic Management Through Short-Term Weather and Collision Prediction Presenter: Stevanus A. Tjandra, Ph.D. City of Edmonton Office of Traffic Safety (OTS) Co-authors: Yongsheng Chen, Ph.D.,
Development of Innovative Technology to Provide Low-Cost Surface Atmospheric Observations in Data-sparse Regions
 Development of Innovative Technology to Provide Low-Cost Surface Atmospheric Observations in Data-sparse Regions Paul Kucera and Martin Steinson University Corporation for Atmospheric Research/COMET 3D-Printed
Weather Evaluation Team (WET)
") Weather Evaluation Team (WET) Presented to: Friends and Partners in Aviation Weather Kevin Johnston ATCSCC Tom Fahey Delta Air Lines 1 WET Membership FAA Denver ARTCC Atlanta ARTCC ATCSCC Minneapolis TRACON
Weather Evaluation Team (WET) Presented to: Friends and Partners in Aviation Weather Kevin Johnston ATCSCC Tom Fahey Delta Air Lines 1 WET Membership FAA Denver ARTCC Atlanta ARTCC ATCSCC Minneapolis TRACON
Life Cycle of Convective Systems over Western Colombia
 Life Cycle of Convective Systems over Western Colombia Meiry Sakamoto Uiversidade de São Paulo, São Paulo, Brazil Colombia Life Cycle of Convective Systems over Western Colombia Convective System (CS)
United States Climate
 25-1 Alabama Annual Average Temperature Data Source: http://www.wrcc.dri.edu/cgi-bin/divplot1_form.pl?0106 25-2 How does climate vary as we traverse the U.S. along 40 N? 25-3 Average Temperature Along
Significant Rainfall and Peak Sustained Wind Estimates For Downtown San Francisco
 Significant Rainfall and Peak Sustained Wind Estimates For Downtown San Francisco Report Prepared by John P. Monteverdi, PhD, CCM July 30, 1998 Mayacamas Weather Consultants 1. Impact of Location The location
Visibility in Low Clouds And Its Impact on FSO Links
 Visibility in Low Clouds And Its Impact on FSO Links M. Ammar Al-Habash, Janae Nash, Jeff Baars, Michael Witiw, Ken Fischer, Ken Desmet Terabeam Corporation, 14833 NE 87th St., Building C, Redmond, WA
Chiang Rai Province CC Threat overview AAS1109 Mekong ARCC
 Chiang Rai Province CC Threat overview AAS1109 Mekong ARCC This threat overview relies on projections of future climate change in the Mekong Basin for the period 2045-2069 compared to a baseline of 1980-2005.
Highlights of the 2006 Water Year in Colorado
 Highlights of the 2006 Water Year in Colorado Nolan Doesken, State Climatologist Atmospheric Science Department Colorado State University http://ccc.atmos.colostate.edu Presented to 61 st Annual Meeting
SYSTEM BRIEF DAILY SUMMARY
 SYSTEM BRIEF DAILY SUMMARY * ANNUAL MaxTemp NEL (MWH) Hr Ending Hr Ending LOAD (PEAK HOURS 7:00 AM TO 10:00 PM MON-SAT) ENERGY (MWH) INCREMENTAL COST DAY DATE Civic TOTAL MAXIMUM @Max MINIMUM @Min FACTOR
Mountain View Community Shuttle Monthly Operations Report
 Mountain View Community Shuttle Monthly Operations Report December 6, 2018 Contents Passengers per Day, Table...- 3 - Passengers per Day, Chart...- 3 - Ridership Year-To-Date...- 4 - Average Daily Ridership
Jackson County 2018 Weather Data 67 Years of Weather Data Recorded at the UF/IFAS Marianna North Florida Research and Education Center
 Jackson County 2018 Weather Data 67 Years of Weather Data Recorded at the UF/IFAS Marianna North Florida Research and Education Center Doug Mayo Jackson County Extension Director 1952-2008 Rainfall Data
The WMO Aviation Research & Demonstration Project (AvRDP) at Paris-CDG airport. Pauline Jaunet Météo-France
 at Paris-CDG airport. Pauline Jaunet Météo-France") The WMO Aviation Research & Demonstration Project (AvRDP) at Paris-CDG airport Pauline Jaunet Météo-France AvRDP focus points Aviation Research Demonstration Project Joint effort between CAS/WWRP and CaeM
The WMO Aviation Research & Demonstration Project (AvRDP) at Paris-CDG airport Pauline Jaunet Météo-France AvRDP focus points Aviation Research Demonstration Project Joint effort between CAS/WWRP and CaeM
Towards a Bankable Solar Resource
 Towards a Bankable Solar Resource Adam Kankiewicz WindLogics Inc. SOLAR 2010 Phoenix, Arizona May 20, 2010 Outline NextEra/WindLogics Solar Development Lessons learned TMY - Caveat Emptor Discussion 2
SYSTEM BRIEF DAILY SUMMARY
 SYSTEM BRIEF DAILY SUMMARY * ANNUAL MaxTemp NEL (MWH) Hr Ending Hr Ending LOAD (PEAK HOURS 7:00 AM TO 10:00 PM MON-SAT) ENERGY (MWH) INCREMENTAL COST DAY DATE Civic TOTAL MAXIMUM @Max MINIMUM @Min FACTOR
Calculations Equation of Time. EQUATION OF TIME = apparent solar time - mean solar time
 Calculations Equation of Time APPARENT SOLAR TIME is the time that is shown on sundials. A MEAN SOLAR DAY is a constant 24 hours every day of the year. Apparent solar days are measured from noon one day
Weather and Climate of the Rogue Valley By Gregory V. Jones, Ph.D., Southern Oregon University
 Weather and Climate of the Rogue Valley By Gregory V. Jones, Ph.D., Southern Oregon University The Rogue Valley region is one of many intermountain valley areas along the west coast of the United States.
HAIDA GWAII CLIMATE ASSESSMENT 2010 Special Report for MIEDS Franc Pridoehl
 HAIDA GWAII CLIMATE ASSESSMENT 2010 Special Report for MIEDS Franc Pridoehl INTRODUCTION Climatic conditions have varied considerably on Haida Gwaii over the past centuries and millennia (Hebda 2007).
A Traffic Density Analysis of Proposed Ferry Service Expansions in San Francisco Bay Utilizing Maritime Simulation
 A Traffic Density Analysis of Proposed Ferry Service Expansions in San Francisco Bay Utilizing Maritime Simulation Dr. J. Rene van Dorp (GWU),Dr. Jason R. W. Merrick (VCU) Dr. J. R. Harrald (GWU),Dr. T.
Progress in Aviation Weather Forecasting for ATM Decision Making FPAW 2010
 Progress in Aviation Weather Forecasting for ATM Decision Making FPAW 2010 Jim Evans Marilyn Wolfson 21 October 2010-1 Overview (1) Integration with storm avoidance models and ATC route usage models (2)
Climate Change and Arizona s Rangelands: Management Challenges and Opportunities
 Climate Change and Arizona s Rangelands: Management Challenges and Opportunities Mike Crimmins Climate Science Extension Specialist Dept. of Soil, Water, & Env. Science & Arizona Cooperative Extension
CoCoRaHS Monitoring Colorado s s Water Resources through Community Collaborations
 CoCoRaHS Monitoring Colorado s s Water Resources through Community Collaborations Nolan Doesken Colorado Climate Center Atmospheric Science Department Colorado State University Presented at Sustaining
Champaign-Urbana 2000 Annual Weather Summary
 Champaign-Urbana 2000 Annual Weather Summary ILLINOIS STATE WATER SURVEY 2204 Griffith Dr. Champaign, IL 61820 wxobsrvr@sws.uiuc.edu Maria Peters, Weather Observer January: January started on a mild note,
Multivariate Regression Model Results
 Updated: August, 0 Page of Multivariate Regression Model Results 4 5 6 7 8 This exhibit provides the results of the load model forecast discussed in Schedule. Included is the forecast of short term system
Updated 12 Sep 2002 Talking Points for VISITview Lesson Fog Detection and Analysis With Satellite Data Gary Ellrod (NOAA/NESDIS) 1.
 1.") Updated 12 Sep 2002 Talking Points for VISITview Lesson Fog Detection and Analysis With Satellite Data Gary Ellrod (NOAA/NESDIS) 1. Title 2. Fog has a major impact on air safety and efficiency, and may
Updated 12 Sep 2002 Talking Points for VISITview Lesson Fog Detection and Analysis With Satellite Data Gary Ellrod (NOAA/NESDIS) 1. Title 2. Fog has a major impact on air safety and efficiency, and may
ACCUMULATED PRECIPITATION IN INCHES
 CUMULATIVE PRECIPITATION WATER YEAR 9 COLUMBIA BASIN ABOVE GRAND COULEE 87% of Normal 1971- Average ACCUMULATED PRECIPITATION IN INCHES 8 6 97% of Normal 94% of Normal 77% of Normal SNAKE RIVER BASIN ABOVE
Champaign-Urbana 1999 Annual Weather Summary
 Champaign-Urbana 1999 Annual Weather Summary ILLINOIS STATE WATER SURVEY 2204 Griffith Dr. Champaign, IL 61820 wxobsrvr@sws.uiuc.edu Maria Peters, Weather Observer A major snowstorm kicked off the new
Wind Resource Data Summary Cotal Area, Guam Data Summary and Transmittal for December 2011
 Wind Resource Data Summary Cotal Area, Guam Data Summary and Transmittal for December 2011 Prepared for: GHD Inc. 194 Hernan Cortez Avenue 2nd Floor, Ste. 203 Hagatna, Guam 96910 January 2012 DNV Renewables
Global Climates. Name Date
 Global Climates Name Date No investigation of the atmosphere is complete without examining the global distribution of the major atmospheric elements and the impact that humans have on weather and climate.
Climatography of the United States No
 Climate Division: AK 5 NWS Call Sign: ANC Month (1) Min (2) Month(1) Extremes Lowest (2) Temperature ( F) Lowest Month(1) Degree s (1) Base Temp 65 Heating Cooling 90 Number of s (3) Jan 22.2 9.3 15.8
Increasing Transmission Capacities with Dynamic Monitoring Systems
 INL/MIS-11-22167 Increasing Transmission Capacities with Dynamic Monitoring Systems Kurt S. Myers Jake P. Gentle www.inl.gov March 22, 2012 Concurrent Cooling Background Project supported with funding
Interpretation of Polar-orbiting Satellite Observations. Atmospheric Instrumentation
 Interpretation of Polar-orbiting Satellite Observations Outline Polar-Orbiting Observations: Review of Polar-Orbiting Satellite Systems Overview of Currently Active Satellites / Sensors Overview of Sensor
The Climate of Seminole County
 The Climate of Seminole County Seminole County is part of the Crosstimbers. This region is a transition region from the Central Great Plains to the more irregular terrain of southeastern Oklahoma. Average
The Climate of Murray County
 The Climate of Murray County Murray County is part of the Crosstimbers. This region is a transition between prairies and the mountains of southeastern Oklahoma. Average annual precipitation ranges from
Localized Aviation Model Output Statistics Program (LAMP): Improvements to convective forecasts in response to user feedback
: Improvements to convective forecasts in response to user feedback") Localized Aviation Model Output Statistics Program (LAMP): Improvements to convective forecasts in response to user feedback Judy E. Ghirardelli National Weather Service Meteorological Development Laboratory
Localized Aviation Model Output Statistics Program (LAMP): Improvements to convective forecasts in response to user feedback Judy E. Ghirardelli National Weather Service Meteorological Development Laboratory
Climate Change and Water Supply Research. Drought Response Workshop October 8, 2013
 Climate Change and Water Supply Research Drought Response Workshop October 8, 2013 DWR Photo Oroville Reservoir, 2009 Talk Overview Expectations History Atmospheric Rivers and Water Supply Current Research
What Does It Take to Get Out of Drought?
 What Does It Take to Get Out of Drought? Nolan J. Doesken Colorado Climate Center Colorado State University http://ccc.atmos.colostate.edu Presented at the Insects, Diseases and Drought Workshop, May 19,
The Coupled Earth Reanalysis system [CERA]
![The Coupled Earth Reanalysis system [CERA]](/thumbs/95/122770734.jpg "The Coupled Earth Reanalysis system [CERA]") The Coupled Earth Reanalysis system [CERA] Patrick Laloyaux Acknowledgments: Eric de Boisséson, Magdalena Balmaseda, Dick Dee, Peter Janssen, Kristian Mogensen, Jean-Noël Thépaut and Reanalysis Section
The Coupled Earth Reanalysis system [CERA] Patrick Laloyaux Acknowledgments: Eric de Boisséson, Magdalena Balmaseda, Dick Dee, Peter Janssen, Kristian Mogensen, Jean-Noël Thépaut and Reanalysis Section
APPENDIX G-7 METEROLOGICAL DATA
 APPENDIX G-7 METEROLOGICAL DATA METEOROLOGICAL DATA FOR AIR AND NOISE SAMPLING DAYS AT MMR Monthly Normals and Extremes for Honolulu International Airport Table G7-1 MMR RAWS Station Hourly Data Tables
VISITING OUR OFFICE IN MINDEN.
 MINDEN Hotel recommendations Flight Information Time Zones Airport Information Landmarks and driving distance Car Rentals Weather Climate GOOD TO KNOW VISITING OUR OFFICE IN MINDEN. 2243 Park Place Suite
The Climate of Bryan County
 The Climate of Bryan County Bryan County is part of the Crosstimbers throughout most of the county. The extreme eastern portions of Bryan County are part of the Cypress Swamp and Forest. Average annual
The Climate of Marshall County
 The Climate of Marshall County Marshall County is part of the Crosstimbers. This region is a transition region from the Central Great Plains to the more irregular terrain of southeastern Oklahoma. Average
8.1 Attachment 1: Ambient Weather Conditions at Jervoise Bay, Cockburn Sound
 8.1 Attachment 1: Ambient Weather Conditions at Jervoise Bay, Cockburn Sound Cockburn Sound is 20km south of the Perth-Fremantle area and has two features that are unique along Perth s metropolitan coast
Supplementary appendix
 Supplementary appendix This appendix formed part of the original submission and has been peer reviewed. We post it as supplied by the authors. Supplement to: Lowe R, Stewart-Ibarra AM, Petrova D, et al.
Jackson County 2014 Weather Data
 Jackson County 2014 Weather Data 62 Years of Weather Data Recorded at the UF/IFAS Marianna North Florida Research and Education Center Doug Mayo Jackson County Extension Director 1952-2008 Rainfall Data
Sierra Weather and Climate Update
 Sierra Weather and Climate Update 2014-15 Kelly Redmond Western Regional Climate Center Desert Research Institute Reno Nevada Yosemite Hydroclimate Workshop Yosemite Valley, 2015 October 8-9 Percent of
A High Elevation Climate Monitoring Network
 A High Elevation Climate Monitoring Network Kelly T. Redmond Western Regional Climate Center Desert Research Institute Reno Nevada AGU San Francisco WRCC / OSU Nevada Precip-Elevation Distribution 100%
GOES-16 AMV data evaluation and algorithm assessment
 GOES-16 AMV data evaluation and algorithm assessment Katie Lean and Niels Bormann IWW14, Jeju Island, South Korea, 23-27 th April 2018 katie.lean@ecmwf.int ECMWF May 3, 2018 Outline Introduction Changes
Interannual variation of MODIS NDVI in Lake Taihu and its relation to climate in submerged macrophyte region
 Yale-NUIST Center on Atmospheric Environment Interannual variation of MODIS NDVI in Lake Taihu and its relation to climate in submerged macrophyte region ZhangZhen 2015.07.10 1 Outline Introduction Data
2018 Annual Review of Availability Assessment Hours
 2018 Annual Review of Availability Assessment Hours Amber Motley Manager, Short Term Forecasting Clyde Loutan Principal, Renewable Energy Integration Karl Meeusen Senior Advisor, Infrastructure & Regulatory
Agricultural Science Climatology Semester 2, Anne Green / Richard Thompson
 Agricultural Science Climatology Semester 2, 2006 Anne Green / Richard Thompson http://www.physics.usyd.edu.au/ag/agschome.htm Course Coordinator: Mike Wheatland Course Goals Evaluate & interpret information,
The Climate of Pontotoc County
 The Climate of Pontotoc County Pontotoc County is part of the Crosstimbers. This region is a transition region from the Central Great Plains to the more irregular terrain of southeast Oklahoma. Average
Use of the NOAA ARL HYSPLIT Trajectory Model For the Short Range Prediction of Coastal Stratus and Fog
 Ellrod, G. P., 2013: Use of the NOAA ARL HYSPLIT Trajectory Model for the Short Range Prediction of Coastal Stratus and Fog. Extended Abstract, 17 th AMS Aviation, Range, and Aerospace Meteor., 4-8 Jan
YACT (Yet Another Climate Tool)? The SPI Explorer
? The SPI Explorer") YACT (Yet Another Climate Tool)? The SPI Explorer Mike Crimmins Assoc. Professor/Extension Specialist Dept. of Soil, Water, & Environmental Science The University of Arizona Yes, another climate tool for
YACT (Yet Another Climate Tool)? The SPI Explorer Mike Crimmins Assoc. Professor/Extension Specialist Dept. of Soil, Water, & Environmental Science The University of Arizona Yes, another climate tool for
CAVE CLIMATE COMPARISON ACTIVITY BETWEEN THE SURFACE AND THE CAVERN
 CAVE CLIMATE COMPARISON ACTIVITY BETWEEN THE SURFACE AND THE CAVERN Created by Ray Bowers For the Virtual Center for the Environment (VCE) A part of the Institute of Natural Resources Analysis and Management
ACCUMULATED PRECIPITATION IN INCHES
 40 30 CUMULATIVE PRECIPITATION WATER YEAR 2010 COLUMBIA BASIN ABOVE GRAND COULEE 164% of Normal 1971-2000 Average ACCUMULATED PRECIPITATION IN INCHES 20 10 0 30 20 10 0 40 30 20 10 0 80 60 40 154% of Normal
Assimilation of GNSS Radio Occultation Data at JMA. Hiromi Owada, Yoichi Hirahara and Masami Moriya Japan Meteorological Agency
 Assimilation of GNSS Radio Occultation Data at JMA Hiromi Owada, Yoichi Hirahara and Masami Moriya Japan Meteorological Agency COSMIC-IROWG 2017, 21-27 September 2017 1 Outline Current RO data utilization
The Climate of Payne County
 The Climate of Payne County Payne County is part of the Central Great Plains in the west, encompassing some of the best agricultural land in Oklahoma. Payne County is also part of the Crosstimbers in the
TMC Monthly Operational Summary
 TMC Monthly Operational Summary July 1 Bureau of Transportation Systems Management & Operations (TSMO) NH Department of Transportation s Mission Transportation excellence enhancing the quality of life
Variability of Reference Evapotranspiration Across Nebraska
 Know how. Know now. EC733 Variability of Reference Evapotranspiration Across Nebraska Suat Irmak, Extension Soil and Water Resources and Irrigation Specialist Kari E. Skaggs, Research Associate, Biological
The Climate of Kiowa County
 The Climate of Kiowa County Kiowa County is part of the Central Great Plains, encompassing some of the best agricultural land in Oklahoma. Average annual precipitation ranges from about 24 inches in northwestern
Applications of Meteorological Tower Data at Kennedy Space Center
 1st AIAA Atmospheric and Space Environments Conference 22-25 June 2009, San Antonio, Texas AIAA 2009-3533 Applications of Meteorological Tower Data at Kennedy Space Center Karen M. Altino 1 NASA/Marshall
ALASKA REGION CLIMATE OUTLOOK BRIEFING. November 16, 2018 Rick Thoman Alaska Center for Climate Assessment and Policy
 ALASKA REGION CLIMATE OUTLOOK BRIEFING November 16, 2018 Rick Thoman Alaska Center for Climate Assessment and Policy Today s Outline Feature of the month: Southeast Drought Update Climate Forecast Basics
Proposed Performance Metrics Block Time & Predictability
 Proposed Performance Metrics Block Time & Predictability Marc Rose, MCR/SETA-II Gabriela Rohlck, MCR/SETA-II 15 March, 2006 Presented at NEXTOR - Asilomar F E D E R A L A V I A T I O N A D M I N I S T
Time Series Analysis
 Time Series Analysis A time series is a sequence of observations made: 1) over a continuous time interval, 2) of successive measurements across that interval, 3) using equal spacing between consecutive
Monthly Long Range Weather Commentary Issued: APRIL 1, 2015 Steven A. Root, CCM, President/CEO
 Monthly Long Range Weather Commentary Issued: APRIL 1, 2015 Steven A. Root, CCM, President/CEO sroot@weatherbank.com FEBRUARY 2015 Climate Highlights The Month in Review The February contiguous U.S. temperature
CGE TRAINING MATERIALS ON VULNERABILITY AND ADAPTATION ASSESSMENT. Climate change scenarios
 CGE TRAINING MATERIALS ON VULNERABILITY AND ADAPTATION ASSESSMENT Climate change scenarios Outline Climate change overview Observed climate data Why we use scenarios? Approach to scenario development Climate
The Effects of Weather on Urban Trail Use: A National Study
 The Effects of Weather on Urban Trail Use: A National Study Alireza Ermagun, Tracy Haden-Loh, Greg Lindsey May 3, 2016 Rails to Trails Conservancy Trail Modeling and Assessment Platform Objectives Monitor
What is happening to the Jamaican climate?
 What is happening to the Jamaican climate? Climate Change and Jamaica: Why worry? Climate Studies Group, Mona (CSGM) Department of Physics University of the West Indies, Mona Part 1 RAIN A FALL, BUT DUTTY
NASA Products to Enhance Energy Utility Load Forecasting
 NASA Products to Enhance Energy Utility Load Forecasting Erica Zell, Battelle zelle@battelle.org, Arlington, VA ESIP 2010 Summer Meeting, Knoxville, TN, July 20-23 Project Overview Funded by the NASA Applied
WHEN IS IT EVER GOING TO RAIN? Table of Average Annual Rainfall and Rainfall For Selected Arizona Cities
 WHEN IS IT EVER GOING TO RAIN? Table of Average Annual Rainfall and 2001-2002 Rainfall For Selected Arizona Cities Phoenix Tucson Flagstaff Avg. 2001-2002 Avg. 2001-2002 Avg. 2001-2002 October 0.7 0.0
Tracking the Climate Of Northern Colorado Nolan Doesken State Climatologist Colorado Climate Center Colorado State University
 Tracking the Climate Of Northern Colorado Nolan Doesken State Climatologist Colorado Climate Center Colorado State University Northern Colorado Business Innovations November 20, 2013 Loveland, Colorado
The Climate of Texas County
 The Climate of Texas County Texas County is part of the Western High Plains in the north and west and the Southwestern Tablelands in the east. The Western High Plains are characterized by abundant cropland
Long Range Forecasts of 2015 SW and NE Monsoons and its Verification D. S. Pai Climate Division, IMD, Pune
 Long Range Forecasts of 2015 SW and NE Monsoons and its Verification D. S. Pai Climate Division, IMD, Pune Other Contributors: Soma Sen Roy, O. P. Sreejith, Kailas, Madhuri, Pallavi, Mahendra and Jasmine
Winter-Weather Forecast Research
 Winter-Weather Forecast Research Dr. Jennifer Bewley 23 April 2014 AvMet Applications, Inc. 1800 Alexander Bell Dr., Ste. 130 Reston, 1 VA 20191 Number of Hours with Wintry Precipitation November 2013
Climatography of the United States No
 Climate Division: CA 4 NWS Call Sign: Month (1) Min (2) Month(1) Extremes Lowest (2) Temperature ( F) Lowest Month(1) Degree s (1) Base Temp 65 Heating Cooling 100 Number of s (3) Jan 55.6 39.3 47.5 77
Climatography of the United States No
 Climate Division: CA 1 NWS Call Sign: Month (1) Min (2) Month(1) Extremes Lowest (2) Temperature ( F) Lowest Month(1) Degree s (1) Base Temp 65 Heating Cooling 100 Number of s (3) Jan 57.9 38.9 48.4 85
Climatography of the United States No
 Climate Division: CA 5 NWS Call Sign: Month (1) Min (2) Month(1) Extremes Lowest (2) Temperature ( F) Lowest Month(1) Degree s (1) Base Temp 65 Heating Cooling 100 Number of s (3) Jan 56.6 36.5 46.6 81
Climatography of the United States No
 Climate Division: CA 5 NWS Call Sign: Month (1) Min (2) Month(1) Extremes Lowest (2) Temperature ( F) Lowest Month(1) Degree s (1) Base Temp 65 Heating Cooling 100 Number of s (3) Jan 44.8 25.4 35.1 72
Climatography of the United States No
 Climate Division: CA 4 NWS Call Sign: Month (1) Min (2) Month(1) Extremes Lowest (2) Temperature ( F) Lowest Month(1) Degree s (1) Base Temp 65 Heating Cooling 100 Number of s (3) Jan 49.4 37.5 43.5 73