Mobile District River System Status for November 17, 2017
|
|
|
- Emil Johns
- 6 years ago
- Views:
Transcription


1 Mobile District River System Status for November 17, 2017 Weather Update The Quantitative Precipitation Forecast (QPF) in Figure 1 shows forecasted precipitation for the next 7 days. Figure 2 shows the precipitation that occurred for the 7 day period ending on November 17, Figure 3 shows the 30 year normal precipitation for the month of November. Figure 4 shows the 6 to 10 day precipitation probability outlook, made November 16, with below normal rainfall expected throughout the District except the extreme southeast District where normal rainfall is expected. Figure 5 provides the proportion of total annual stream flow normally seen in November. The US Drought Monitor map for November 14, 2017, in Figure 6, shows moderate drought conditions expanding in east central Mississippi and developing in extreme southwestern Georgia. Figure 1: 1-7 Day Precipitation Outlook Figure 2: Observed Precipitation 11/10/2017 to 11/17/2017


2 Figure 3: 30-yr Normal Precipitation for November Figure 4: Precipitation Probability 6 to 10 Day Outlook


3 Figure 5: November Streamflow as a Proportion of the Total Annual Flow Figure 6: U.S. Drought Monitor 11/14/2017

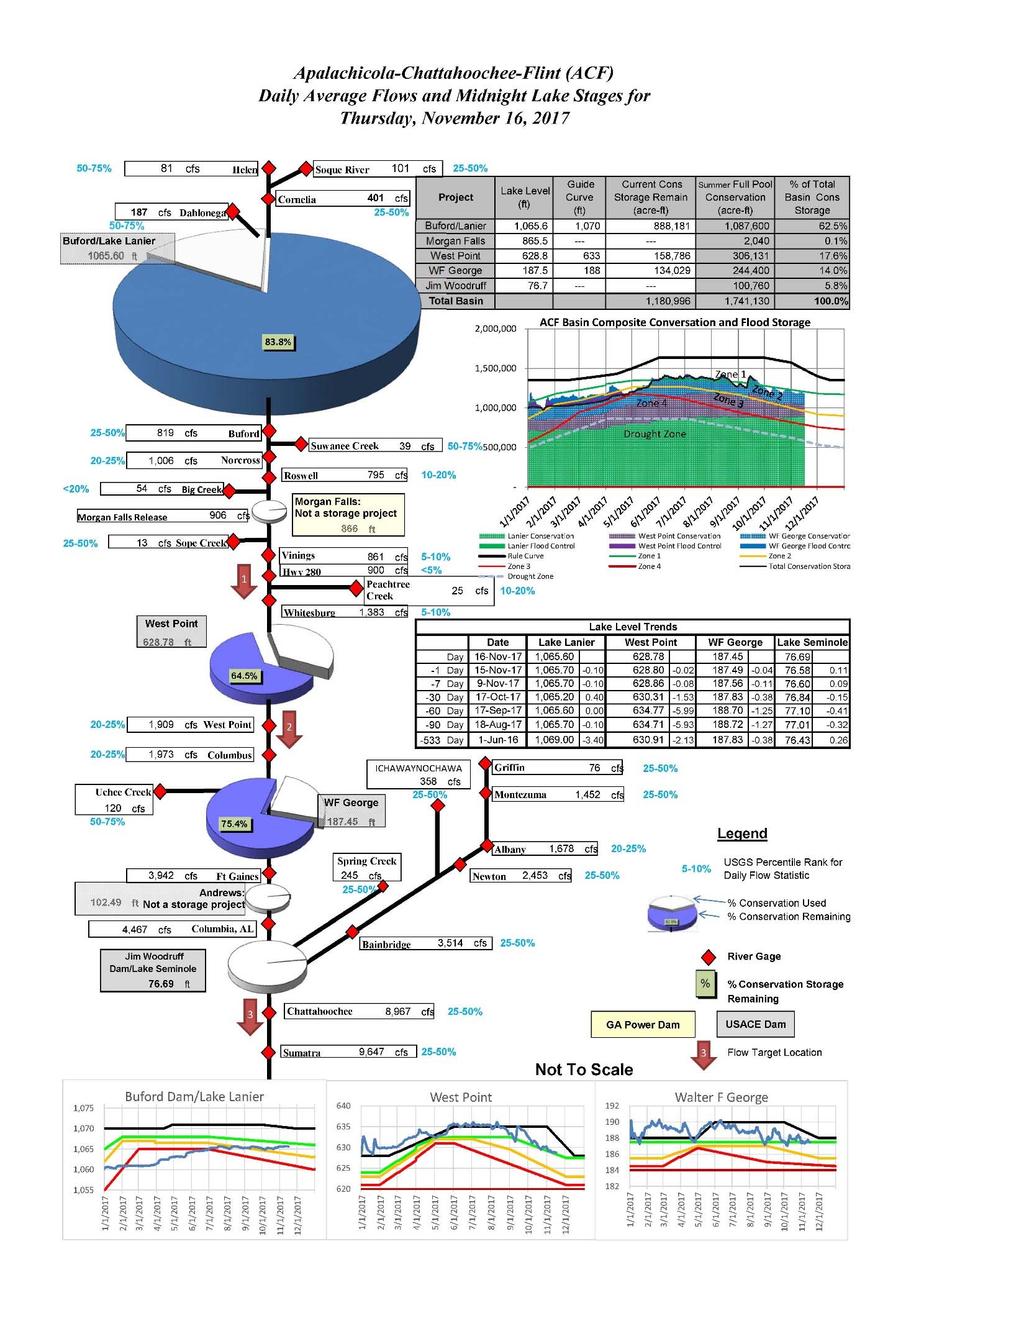
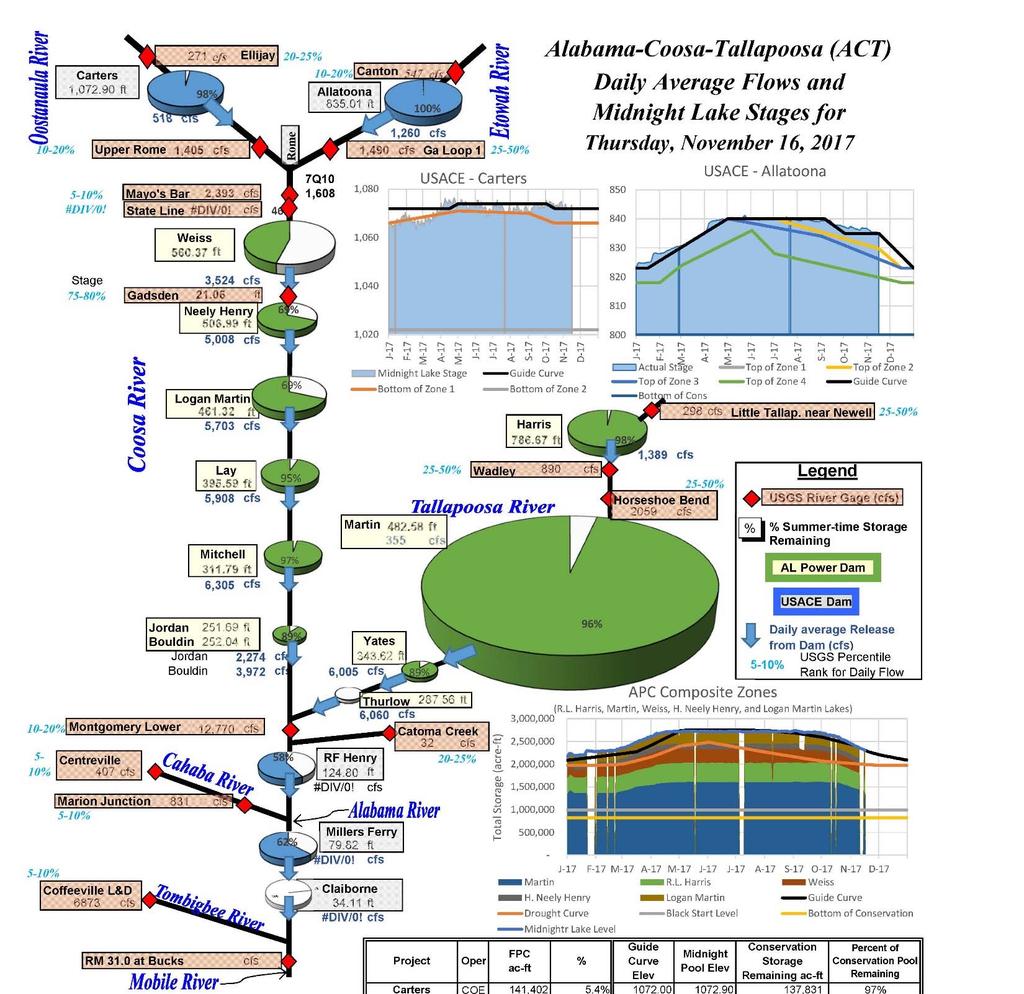
4 Projects Update The upper Alabama Coosa Tallapoosa (ACT) Basin experienced generally drier conditions this past week. Allatoona pool, at elevation feet, is slightly above the top of conservation pool. Carters pool is at elevation feet. No threshold indicators have been triggered under the drought regulation guidelines for the Coosa, Tallapoosa and Alabama Rivers for the APC projects. The Apalachicola-Chattahoochee-Flint (ACF) Basin also experienced generally drier conditions this past week. The composite conservation storage is currently in Zone 2, as can be seen in Figure 7. Normal operations, which resumed on June 1 st, remain in force. Lake Lanier pool storage has been unchanged over the past week, and top of pool elevation is at feet. West Point pool, at feet, is below the top of conservation elevation. W F George pool, at approximately feet, is also below the top of conservation elevation. Current release to the Apalachicola from Jim Woodruff Lock and Dam is based on normal operations provisions and is approximately 8,030 cfs. Figure 7: ACF Composite Storage Chart 11/13/2017 Cumulative 2017 calendar year daily inflow charts for Buford (Lake Lanier), Allatoona, and Carters, are provided in Figures 8 through 10, respectively. These charts provide cumulative inflow comparisons between the current year and the wettest year(s) on record, the driest year(s) and the median. The project cumulative 2017 calendar year inflow volumes for Buford, Allatoona and Carters, as a percentage of the median cumulative calendar year inflow volumes, are approximately 55%, 62% and 69%, respectively. For Lake Lanier, 1986 is the driest calendar year on record. The 2007 calendar year is provided as a recent dry reference year as shown on Figure 8. The 2017 calendar year is the tenth driest year to date, with 60 years of record. The 1964 calendar year is the wettest year. For Allatoona, the 2017 calendar year is the ninth driest year to date. Figure 9 provides several reference years. The wettest calendar year with 66 years of record is The third wettest calendar year is 2013 and provides a recent wetyear reference. The driest calendar year is 1986 with 2007 total inflow volume near the 1986 record low. For Carters, 1990 is the wettest calendar year. The 2013 calendar year is the second wettest and provides a recent wetyear reference. The driest calendar year is 2008 and provides a recent dry-year reference as shown in Figure 10. The 2017 calendar year is the eleventh driest year to date.


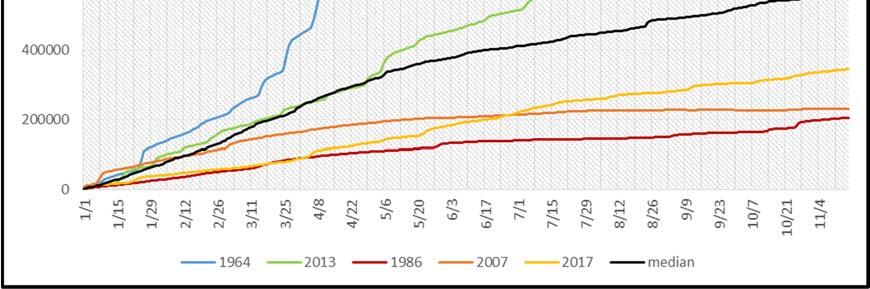
5 Figure 8: Lake Lanier 2017 Calendar Year Cumulative Average Daily Inflows To Date Figure 9: Allatoona 2017 Calendar Year Cumulative Average Daily Inflows To Date
 Projected One Week Elevation")
 Inflows (% of Average)* Allatoona 754 64% Carters 472 87% *Current Daily Average Inflows as compared to Historical Daily Average Inflows by month.")
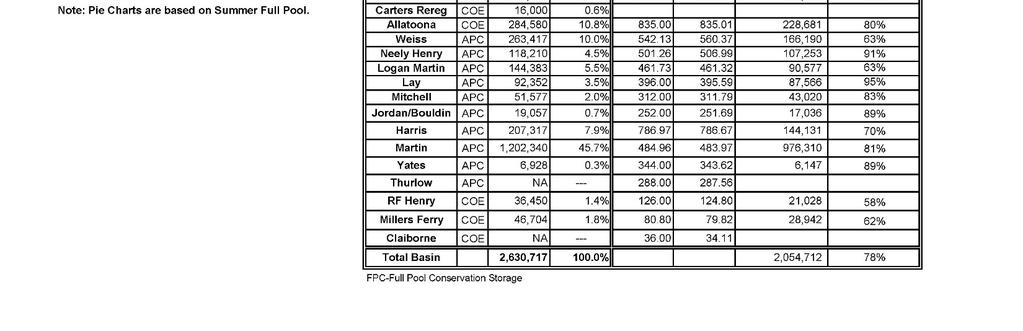
6 Figure 10: Carters 2017 Calendar Year Cumulative Average Daily Inflows To Date The status of the Mobile District U.S. Army Corps of Engineers projects for the week of 11/16/2017 through 11/24/2017 is shown below: Alabama-Coosa-Tallapoosa Basin Table 1 ACT Projects Current Elevation (ft) Projected One Week Elevation (ft) Allatoona Carters R.F. Henry Millers Ferry Table 2 ACT Projects Inflow (cfs) Inflows (% of Average)* Allatoona % Carters % *Current Daily Average Inflows as compared to Historical Daily Average Inflows by month. Table 3 ACT Projects Allatoona Carters (Rereg) Expected 7 day Average Releases (cfs) 1,420 (1,420 wkdy/ 1,420 wknd) 500 (500 wkdy/ 500 wknd) Links to forecasts: Allatoona:
7 Carters: River Stages: The current Claiborne TW reading is 13.8 ft. Navigators should contact the Navigation Section at (251) for the latest update on dredging operations, controlling depths and river conditions. Entities wishing to move cargo on the Alabama River system should contact the Coosa-Alabama River Improvement Association (CARIA) to coordinate your shipping schedule during the low water conditions. The phone number is (334) Apalachicola-Chattahoochee-Flint Basin Table 4 ACF Projects Current Elevation (ft) Projected One Week Elevation (ft) Lanier West Point Walter F. George Woodruff Table 5 ACF Projects Inflow (cfs) Inflows (% of Average)* Lanier % West Point % Walter F. George 1,165 47% Woodruff 4,110 60% *Current Daily Average Inflows as compared to Historical Daily Average Inflows by month. Table 6 ACF Projects Expected 7 day Average Releases (cfs) Lanier 950 ( 950 wkdy /950 wknd) West Point 1,310 ( 1,310 wkdy / 1,310 wknd) Walter F. George 3,300 ( 3,580 wkdy / 2,600 wknd) Woodruff 8,800 6,900 (range) Links to forecasts: ACF: Lake Lanier: West Point: George: Lake Seminole: Blountstown: Navigation interests should contact the Corps of Engineers Navigation Section at for the latest update on controlling depths and river conditions. Pascagoula River Basin Table 7 Pascagoula Projects Current Elevation (ft) Projected One Week Elevation (ft) Okatibbee
8 Black Warrior Tombigbee & Tenn-Tom Basins Below Coffeeville Dam tailwater elevation is near 2.9 ft. Links to forecasts: Alabama: BWT & Tenn-Tom Rivers: Other Information and Links All reservoir levels mentioned above are in feet above NGVD and flows are in cubic feet per second (cfs). USGS Real-Time Reservoir and Stream Levels can be accessed at this link, by selecting a specific state or geographic area: The National Weather Service River Forecast Center provides forecasts and impact levels which can be accessed at this link: The latest weekly U.S. Drought Monitor can be accessed at: The latest navigation bulletin can be accessed via this link: Additional information and graphs can be accessed on the Water Management web page at:
9
10
Mobile District River System Status for October 25, 2018
 Mobile District River System Status for October 25, 2018 Weather Update The Quantitative Precipitation Forecast (QPF) in Figure 1 shows 0.4 to 2.5 inches of precipitation forecasted for the next 7 days.
National Integrated Drought Information System. Southeast US Pilot for Apalachicola- Flint-Chattahoochee River Basin 20-March-2012
 National Integrated Drought Information System Southeast US Pilot for Apalachicola- Flint-Chattahoochee River Basin 20-March-2012 Current drought status from Drought Monitor http://www.drought.unl.edu/dm/monitor.html
Drought Early Warning for the Apalachicola- Chattahoochee-Flint River Basin 20 December 2016
 National Integrated Drought Information System Drought Early Warning for the Apalachicola- Chattahoochee-Flint River Basin 20 December 2016 If you are new to the webinar: For audio: Dial in: 877-922-7940
National Integrated Drought Information System Southeast US Pilot for Apalachicola- Flint-Chattahoochee River Basin. 22 May 2012
 National Integrated Drought Information System Southeast US Pilot for Apalachicola- Flint-Chattahoochee River Basin 22 May 2012 Outline Welcome Keith Ingram, UF, Southeast Climate Consortium Current drought
2012 USACE Drought Actions
 2012 USACE Drought Actions for Inland Waterway Users Board 68 Jim Walker Navigation Branch Chief 19 December 2012 US US Army Corps of of Engineers US Drought Monitor 1 2 3 4 6 5 Impacts: 1. The area in
Southeast US Pilot for Apalachicola- Flint-Chattahoochee River Basin
 National Integrated Drought Information System Southeast US Pilot for Apalachicola- Flint-Chattahoochee River Basin 11 February 2014 Outline Welcome Keith Ingram, Southeast Climate Consortium Current drought
Kootenai Basin Water Supply Update and Sturgeon Flow Augmentation Kootenai Valley Resource Initiative
 Kootenai Basin Water Supply Update and Sturgeon Flow Augmentation Kootenai Valley Resource Initiative Greg Hoffman Fishery Biologist / Kootenai River Basin Flood Engineer Libby Dam 15 May 2017 US Army
Appendix C. Apalachicola-Chattahoochee-Flint (ACF) Basin Detailed Analysis
 Basin Detailed Analysis") Appendix C Apalachicola-Chattahoochee-Flint (ACF) Basin Detailed Analysis Appendix C - Apalachicola-Chattahoochee-Flint Basin Detailed Analysis 1 ACF BASIN 1.1 DESCRIPTION OF BASIN Streams of the Apalachicola-Chattahoochee-Flint
Appendix C Apalachicola-Chattahoochee-Flint (ACF) Basin Detailed Analysis Appendix C - Apalachicola-Chattahoochee-Flint Basin Detailed Analysis 1 ACF BASIN 1.1 DESCRIPTION OF BASIN Streams of the Apalachicola-Chattahoochee-Flint
Appendix B - Alabama-Coosa-Tallapoosa (ACT) Basin
 Basin") Appendix B - Alabama-Coosa-Tallapoosa (ACT) Basin 1 ACT BASIN 1.1 DESCRIPTION OF BASIN The headwater streams of the Alabama-Coosa-Tallapoosa (ACT) System rise in the Blue Ridge Mountains of Georgia and
Appendix B - Alabama-Coosa-Tallapoosa (ACT) Basin 1 ACT BASIN 1.1 DESCRIPTION OF BASIN The headwater streams of the Alabama-Coosa-Tallapoosa (ACT) System rise in the Blue Ridge Mountains of Georgia and
Illinois Drought Update, December 1, 2005 DROUGHT RESPONSE TASK FORCE Illinois State Water Survey, Department of Natural Resources
 Illinois Drought Update, December 1, 2005 DROUGHT RESPONSE TASK FORCE Illinois State Water Survey, Department of Natural Resources For more drought information please go to http://www.sws.uiuc.edu/. SUMMARY.
Great Lakes Update. Volume 188: 2012 Annual Summary
 Great Lakes Update Volume 188: 2012 Annual Summary Background The U.S. Army Corps of Engineers (USACE) tracks the water levels of each of the Great Lakes. This report highlights hydrologic conditions of
-Assessment of current water conditions. - Precipitation Forecast. - Recommendations for Drought Monitor
 June 1, 2010 -Assessment of current water conditions - Precipitation Forecast - Recommendations for Drought Monitor Snotel WYTD Precipitation as Percentage of Average Upper Colorado Headwaters 88% of
NWS SERFC Hydrologic Vulnerability Assessment. Monday, March 9 th, 2015 NOAA, National Weather Service Southeast River Forecast Center
 NWS SERFC Hydrologic Vulnerability Assessment Monday, March 9 th, 2015 NOAA, National Weather Service Southeast River Forecast Center Current Weather Map Today s weather map shows a blossoming system in
Water Supply Outlook. Interstate Commission on the Potomac River Basin (ICPRB) 30 W. Gude Drive, Suite 450 Rockville, MD Tel: (301)
 30 W. Gude Drive, Suite 450 Rockville, MD Tel: (301)") Water Supply Outlook June 2, 2016 To subscribe: please email aseck@icprb.org Interstate Commission on the Potomac River Basin (ICPRB) 30 W. Gude Drive, Suite 450 Rockville, MD 20850 Tel: (301) 274-8120
Water Supply Outlook June 2, 2016 To subscribe: please email aseck@icprb.org Interstate Commission on the Potomac River Basin (ICPRB) 30 W. Gude Drive, Suite 450 Rockville, MD 20850 Tel: (301) 274-8120
Water Supply Conditions and Outlook October 1, 2018
 Water Supply Conditions and Outlook October 1, 2018 Flow Forecasting & Operations Planning Water Security Agency Overview Water supply conditions across Saskatchewan remain near normal, with most reservoirs
January 25, Summary
 January 25, 2013 Summary Precipitation since the December 17, 2012, Drought Update has been slightly below average in parts of central and northern Illinois and above average in southern Illinois. Soil
Oregon Water Conditions Report May 1, 2017
 Oregon Water Conditions Report May 1, 2017 Mountain snowpack in the higher elevations has continued to increase over the last two weeks. Statewide, most low and mid elevation snow has melted so the basin
NIDIS Intermountain West Regional Drought Early Warning System February 7, 2017
 NIDIS Drought and Water Assessment NIDIS Intermountain West Regional Drought Early Warning System February 7, 2017 Precipitation The images above use daily precipitation statistics from NWS COOP, CoCoRaHS,
Climate Outlook through 2100 South Florida Ecological Services Office Vero Beach, FL September 9, 2014
 Climate Outlook through 2100 South Florida Ecological Services Office Vero Beach, FL September 9, 2014 Short Term Drought Map: Short-term (
Guide to Hydrologic Information on the Web
 NOAA s National Weather Service Guide to Hydrologic Information on the Web Colorado River at Lees Ferry Photo: courtesy Tim Helble Your gateway to web resources provided through NOAA s Advanced Hydrologic
Current Water Conditions in Massachusetts January 11, 2008
 Current Water Conditions in Massachusetts January 11, 2008 December precipitation was above normal December streamflows were below normal and normal December ground-water levels were below normal and normal
Great Lakes Update. Volume 199: 2017 Annual Summary. Background
 Great Lakes Update Volume 199: 2017 Annual Summary Background The U.S. Army Corps of Engineers (USACE) tracks and forecasts the water levels of each of the Great Lakes. This report is primarily focused
Upper Missouri River Basin December 2017 Calendar Year Runoff Forecast December 5, 2017
 Upper Missouri River Basin December 2017 Calendar Year Runoff Forecast December 5, 2017 Calendar Year Runoff Forecast Explanation and Purpose of Forecast U.S. Army Corps of Engineers, Northwestern Division
NIDIS Weekly Climate, Water and Drought Assessment Summary. Upper Colorado River Basin June 21, 2011
 NIDIS Weekly Climate, Water and Drought Assessment Summary Upper Colorado River Basin June 21, 2011 PrecipitaEon and Snowpack Fig. 1: June month to date precipitaeon in inches. Fig. 2: 24 hour accumulated
Thursday, March 19, 2015 Issued: 1:00pm CDT
 Thursday, March 19, 2015 Issued: 1:00pm CDT Prepared by: Kurt Van Speybroeck/Victor Murphy/David Brown 817-978-1100 x 147 National Weather Service Southern Region Headquarters Regional Operations Center
Great Lakes Update. Volume 193: 2015 January through June Summary. Vol. 193 Great Lakes Update August 2015
 Great Lakes Update Volume 193: 2015 January through June Summary The U.S. Army Corps of Engineers (USACE) monitors the water levels of each of the Great Lakes. This report provides a summary of the Great
SEPTEMBER 2013 REVIEW
 Monthly Long Range Weather Commentary Issued: October 21, 2013 Steven A. Root, CCM, President/CEO sroot@weatherbank.com SEPTEMBER 2013 REVIEW Climate Highlights The Month in Review The average temperature
Folsom Dam Water Control Manual Update
 Folsom Dam Water Control Manual Update Public Workshop April 3, 2014 Location: Sterling Hotel Ballroom 1300 H Street, Sacramento US Army Corps of Engineers BUILDING STRONG WELCOME & INTRODUCTIONS 2 BUILDING
Folsom Dam Water Control Manual Update Joint Federal Project, Folsom Dam
 Folsom Dam Water Control Manual Update Joint Federal Project, Folsom Dam Public Workshop May 28, 2015 Library Galleria 828 I Street, Sacramento, CA US Army Corps of Engineers BUILDING STRONG WELCOME &
NIDIS Weekly Climate, Water and Drought Assessment Summary. Upper Colorado River Basin
 NIDIS Weekly Climate, Water and Drought Assessment Summary Upper Colorado River Basin August 3, 2010 Precipitation and Snowpack Fig. 1: July precipitation in inches Fig. 2: July precip as percent of average
Missouri River Basin Water Management Monthly Update
 Missouri River Basin Water Management Monthly Update Participating Agencies 255 255 255 237 237 237 0 0 0 217 217 217 163 163 163 200 200 200 131 132 122 239 65 53 80 119 27 National Oceanic and Atmospheric
2017 Fall Conditions Report
 2017 Fall Conditions Report Prepared by: Hydrologic Forecast Centre Date: November 15, 2017 Table of Contents TABLE OF FIGURES... ii EXECUTIVE SUMMARY... 1 BACKGROUND... 4 SUMMER AND FALL PRECIPITATION...
Great Lakes Update. Great Lakes Winter and Spring Summary January June Vol. 187 Great Lakes Update August 2012
 Great Lakes Update Great Lakes Winter and Spring Summary January June 2012 The US Army Corps of Engineers (USACE) Detroit District monitors hydraulic and hydrologic conditions of the Great Lakes. This
Missouri River Basin Water Management
 Missouri River Basin Water Management US Army Corps of Engineers Missouri River Navigator s Meeting February 12, 2014 Bill Doan, P.E. Missouri River Basin Water Management US Army Corps of Engineers BUILDING
The hydrologic service area (HSA) for this office covers Central Kentucky and South Central Indiana.
 for this office covers Central Kentucky and South Central Indiana.") MONTH YEAR January 2011 February 15, 2011 X An X inside this box indicates that no flooding occurred within this hydrologic service area. January 2011 was drier than normal in all locations in the area.
MONTH YEAR January 2011 February 15, 2011 X An X inside this box indicates that no flooding occurred within this hydrologic service area. January 2011 was drier than normal in all locations in the area.
The data presented in this graph are provisional and are intended to provide an estimate of Libby Dam forebay elevation (Lake Koocanusa).
.") Elevation (ft) 2470 2460 2450 2440 2430 2420 2410 2400 2390 2380 2370 2360 2350 2340 2330 2320 2310 2300 2290 Lake Koocanusa Elevation - Probability Chart 2280 2270 The data presented in this graph are
Elevation (ft) 2470 2460 2450 2440 2430 2420 2410 2400 2390 2380 2370 2360 2350 2340 2330 2320 2310 2300 2290 Lake Koocanusa Elevation - Probability Chart 2280 2270 The data presented in this graph are
Elevation (ft) 50th to 75th Percentile 25th to 50th Percentile Median Observed
 50th to 75th Percentile 25th to 50th Percentile Median Observed") 2470 Lake Koocanusa Elevation - Probability Chart Elevation (ft) 2460 2450 2440 2430 2420 2410 2400 2390 2380 2370 2360 2350 2340 2330 2320 2310 2300 The data presented in this graph are provisional and
2470 Lake Koocanusa Elevation - Probability Chart Elevation (ft) 2460 2450 2440 2430 2420 2410 2400 2390 2380 2370 2360 2350 2340 2330 2320 2310 2300 The data presented in this graph are provisional and
Missouri River Basin Water Management Monthly Update
 Missouri River Basin Water Management Monthly Update Participating Agencies 255 255 255 237 237 237 0 0 0 217 217 217 163 163 163 200 200 200 131 132 122 239 65 53 80 119 27 National Oceanic and Atmospheric
Great Lakes Update. Volume 194: 2015 Annual Summary
 Great Lakes Update Volume 194: 2015 Annual Summary Background The U.S. Army Corps of Engineers (USACE) tracks and forecasts the water levels of each of the Great Lakes. This report summarizes the hydrologic
Upper Missouri River Basin February 2018 Calendar Year Runoff Forecast February 6, 2018
 Upper Missouri River Basin February 2018 Calendar Year Runoff Forecast February 6, 2018 Calendar Year Runoff Forecast Explanation and Purpose of Forecast U.S. Army Corps of Engineers, Northwestern Division
Colorado State University, Fort Collins, CO Weather Station Monthly Summary Report
 Colorado State University, Fort Collins, CO Weather Station Monthly Summary Report Month: December Year: 2016 Temperature: Mean T max was 39.7 F which is 3.1 below the 1981-2010 normal for the month. This
Red River Levee Panel
 Red River Levee Panel Mississippi River Commission Monday, August 9, 2017 Red River Levees in LA & AR NONE along TX & OK Boarder Red River Levee Issues Caddo Levee Cherokee Park Authorization Bossier Levee
NIDIS Intermountain West Drought Early Warning System April 18, 2017
 1 of 11 4/18/2017 3:42 PM Precipitation NIDIS Intermountain West Drought Early Warning System April 18, 2017 The images above use daily precipitation statistics from NWS COOP, CoCoRaHS, and CoAgMet stations.
NIDIS Weekly Climate, Water and Drought Assessment Summary. Upper Colorado River Basin July 31, 2012
 NIDIS Weekly Climate, Water and Drought Assessment Summary Upper Colorado River Basin July 31, 2012 Fig. 1: July month-to-date precipitation in inches. Fig. 2: SNOTEL WYTD precipitation percentiles (50%
Upper Missouri River Basin January 2018 Calendar Year Runoff Forecast January 3, 2018
 Calendar Year Runoff Forecast Upper Missouri River Basin January 2018 Calendar Year Runoff Forecast January 3, 2018 Explanation and Purpose of Forecast U.S. Army Corps of Engineers, Northwestern Division
Oregon Water Conditions Report April 17, 2017
 Oregon Water Conditions Report April 17, 2017 Mountain snowpack continues to maintain significant levels for mid-april. By late March, statewide snowpack had declined to 118 percent of normal after starting
Climate Outlook through 2100 South Florida Ecological Services Office Vero Beach, FL January 13, 2015
 Climate Outlook through 2100 South Florida Ecological Services Office Vero Beach, FL January 13, 2015 Short Term Drought Map: Short-term (
ALABAMA-COOSA-TALLAPOOSA RIVER BASIN WATER CONTROL MANUAL
 ALABAMA-COOSA-TALLAPOOSA RIVER BASIN WATER CONTROL MANUAL APPENDIX F CLAIBORNE LOCK AND DAM AND LAKE ALABAMA RIVER, ALABAMA U.S. ARMY CORPS OF ENGINEERS SOUTH ATLANTIC DIVISION MOBILE DISTRICT MOBILE,
USING GIS TO MODEL AND ANALYZE HISTORICAL FLOODING OF THE GUADALUPE RIVER NEAR NEW BRAUNFELS, TEXAS
 USING GIS TO MODEL AND ANALYZE HISTORICAL FLOODING OF THE GUADALUPE RIVER NEAR NEW BRAUNFELS, TEXAS ASHLEY EVANS While the state of Texas is well-known for flooding, the Guadalupe River Basin is one of
Upper Missouri River Basin May 2018 Calendar Year Runoff Forecast May 4, 2018
 Calendar Year Runoff Forecast Explanation and Purpose of Forecast Upper Missouri River Basin May 2018 Calendar Year Runoff Forecast May 4, 2018 U.S. Army Corps of Engineers, Northwestern Division Missouri
Missouri River Basin Water Management Monthly Update
 Missouri River Basin Water Management Monthly Update Participating Agencies 255 255 255 237 237 237 0 0 0 217 217 217 163 163 163 200 200 200 131 132 122 239 65 53 80 119 27 National Oceanic and Atmospheric
NATIONAL HYDROPOWER ASSOCIATION MEETING. December 3, 2008 Birmingham Alabama. Roger McNeil Service Hydrologist NWS Birmingham Alabama
 NATIONAL HYDROPOWER ASSOCIATION MEETING December 3, 2008 Birmingham Alabama Roger McNeil Service Hydrologist NWS Birmingham Alabama There are three commonly described types of Drought: Meteorological drought
Elevation (ft) 50th to 75th Percentile 25th to 50th Percentile Median Observed /1 11/1 12/1 1/1 2/1 3/1 4/1 5/1 6/1 7/1 8/1 9/1 Date
 50th to 75th Percentile 25th to 50th Percentile Median Observed /1 11/1 12/1 1/1 2/1 3/1 4/1 5/1 6/1 7/1 8/1 9/1 Date") Elevation (ft) 2470 2460 2450 2440 2430 2420 2410 2400 2390 2380 2370 2360 2350 2340 2330 2320 2310 2300 2290 2280 2270 2260 2250 2240 2230 2220 Bars Indicate 5th and 95th percentiles Lake Koocanusa Elevation
Elevation (ft) 2470 2460 2450 2440 2430 2420 2410 2400 2390 2380 2370 2360 2350 2340 2330 2320 2310 2300 2290 2280 2270 2260 2250 2240 2230 2220 Bars Indicate 5th and 95th percentiles Lake Koocanusa Elevation
Weather and Climate Summary and Forecast Summer into Harvest 2016
 Weather and Climate Summary and Forecast Summer into Harvest 2016 Gregory V. Jones Southern Oregon University September 3, 2016 With school and football season starting a hint of fall is right on time
NATIONAL WEATHER SERVICE
 January 2016 February 9, 2016 This was a dry month across the HSA despite one large and several smaller snowfalls. Most locations ended up 1-2 inches below normal for the month. The driest locations at
There was a big difference in rainfall patterns during the month of May across the ACF basin. The image to the left indicates either a surplus or
 There was a big difference in rainfall patterns during the month of May across the ACF basin. The image to the left indicates either a surplus or deficit of rainfall for the month. Note that northern reaches
Reclamation Perspective on Operational Snow Data and Needs. Snowpack Monitoring for Streamflow Forecasting and Drought Planning August 11, 2015
 Reclamation Perspective on Operational Snow Data and Needs Snowpack Monitoring for Streamflow Forecasting and Drought Planning August 11, 2015 2 Reclamation Operational Modeling 3 Colorado Basin-wide Models
Thursday, February 20th Issued: 2:30pm CST
 Thursday, February 20th Issued: 2:30pm CST Prepared by: Victor Murphy/Brian Hoeth 817-978-1100 x 147 National Weather Service Southern Region Headquarters Regional Operations Center Fort Worth, TX Current
-Assessment of current water conditions. - Precipitation Forecast. - Recommendations for Drought Monitor
 2 May 8 th, 2012 -Assessment of current water conditions - Precipitation Forecast - Recommendations for Drought Monitor AHPS Analysis 5/7/12 7-day average discharge compared to historical
-Assessment of current water conditions. - Precipitation Forecast. - Recommendations for Drought Monitor
 April 27, 2010 -Assessment of current water conditions - Precipitation Forecast - Recommendations for Drought Monitor 7 Day Precipitation 19-25 April 2010 Month-to-Date Precipitation 1-25 April 2010
Hydrologic Forecast Centre. Manitoba Infrastructure. Winnipeg, Manitoba FEBRUARY FLOOD OUTLOOK REPORT FOR MANITOBA.
 Page 1 of 20 Hydrologic Forecast Centre Manitoba Infrastructure Winnipeg, Manitoba FEBRUARY FLOOD OUTLOOK REPORT FOR MANITOBA February 28, 2019 Overview The February Outlook Report prepared by the Hydrologic
Flood Risk Assessment
 Flood Risk Assessment February 14, 2008 Larry Schick Army Corps of Engineers Seattle District Meteorologist General Assessment As promised, La Nina caused an active winter with above to much above normal
Hydrologic Conditions in the Delaware River Basin
 2017 Hydrologic Conditions in the Delaware River Basin Prepared by Operations Staff June 2018 Hydrologic Highlights Hydrologic Conditions in the Delaware River Basin Annual Report 2017 At the start of
PRECIPITATION. Last Week Precipitation:
 12/3/2014 NIDIS Drought and Water Assessment PRECIPITATION The images above use daily precipitation statistics from NWS COOP, CoCoRaHS, and CoAgMet stations. From top to bottom, and left to right: most
Souris River Basin Spring Runoff Outlook As of March 15, 2018
 Souris River Basin Spring Runoff Outlook As of March 15, 2018 Prepared by: Flow Forecasting & Operations Planning Water Security Agency Basin Conditions Summer rainfall in 2017 in the Saskatchewan portion
NIDIS Weekly Climate, Water and Drought Assessment Summary. Upper Colorado River Basin November 22, 2011
 NIDIS Weekly Climate, Water and Drought Assessment Summary Upper Colorado River Basin November 22, 2011 PrecipitaEon and Snowpack Fig. 1: November month to date precipitaeon in inches. Fig. 2: November
Precipitation. Standardized Precipitation Index. NIDIS Intermountain West Regional Drought Early Warning System January 3, 2017
 1/3/2017 NIDIS Drought and Water Assessment NIDIS Intermountain West Regional Drought Early Warning System January 3, 2017 Precipitation The images above use daily precipitation statistics from NWS COOP,
PRELIMINARY DRAFT FOR DISCUSSION PURPOSES
 Memorandum To: David Thompson From: John Haapala CC: Dan McDonald Bob Montgomery Date: February 24, 2003 File #: 1003551 Re: Lake Wenatchee Historic Water Levels, Operation Model, and Flood Operation This
NIDIS Intermountain West Drought Early Warning System November 14, 2017
 NIDIS Intermountain West Drought Early Warning System November 14, 2017 Precipitation The images above use daily precipitation statistics from NWS COOP, CoCoRaHS, and CoAgMet stations. From top to bottom,
The hydrologic service area (HSA) for this office covers Central Kentucky and South Central Indiana.
 for this office covers Central Kentucky and South Central Indiana.") January 2012 February 13, 2012 An X inside this box indicates that no flooding occurred within this hydrologic service area. January 2012 continued the string of wet months this winter. Rainfall was generally
January 2012 February 13, 2012 An X inside this box indicates that no flooding occurred within this hydrologic service area. January 2012 continued the string of wet months this winter. Rainfall was generally
Colorado State University, Fort Collins, CO Weather Station Monthly Summary Report
 Colorado State University, Fort Collins, CO Weather Station Monthly Summary Report Month: December Year: 2017 Temperature: Mean T max was 47.2 F which is 4.4 above the 1981-2010 normal for the month. This
 Red River Flooding June 2015 Caddo and Bossier Parishes Presented by: Flood Technical Committee Where the Rain Falls Matters I-30 versus I-20 I-20 Backwater and Tributary Floods (Localized) 2016 Flood
2017 January Conditions Report Manitoba Hydrologic Forecasting and Coordination Branch Manitoba Infrastructure
 2017 January Conditions Report Manitoba Hydrologic Forecasting and Coordination Branch Manitoba Infrastructure 1/30/2017 Page 1 of 22 Hydrologic Forecast Centre Manitoba Infrastructure and Transportation
Water Supply Conditions and Outlook June 4, 2018
 Water Supply Conditions and Outlook June 4, 2018 Flow Forecasting & Operations Planning Water Security Agency Overview Water supply conditions across Saskatchewan are generally good with most reservoir
-Assessment of current water conditions. - Precipitation Forecast. - Recommendations for Drought Monitor
 2 May 1 st, 2012 -Assessment of current water conditions - Precipitation Forecast - Recommendations for Drought Monitor AHPS Water Year Precipitation as Percentage of Normal 7-day average
NIDIS Intermountain West Drought Early Warning System May 23, 2017
 NIDIS Drought and Water Assessment NIDIS Intermountain West Drought Early Warning System May 23, 2017 Precipitation The images above use daily precipitation statistics from NWS COOP, CoCoRaHS, and CoAgMet
NIDIS Drought and Water Assessment
 NIDIS Drought and Water Assessment PRECIPITATION The images above use daily precipitation statistics from NWS COOP, CoCoRaHS, and CoAgMet stations. From top to bottom, and left to right: most recent 7-days
NIDIS Intermountain West Drought Early Warning System October 17, 2017
 NIDIS Drought and Water Assessment NIDIS Intermountain West Drought Early Warning System October 17, 2017 Precipitation The images above use daily precipitation statistics from NWS COOP, CoCoRaHS, and
Great Lakes Update. Background
 Great Lakes Update Background The U.S. Army Corps of Engineers, Detroit District, monitors and forecasts the water levels of the Great Lakes. This report summarizes the hydrologic conditions of the Great
Weather and Climate Summary and Forecast November 2017 Report
 Weather and Climate Summary and Forecast November 2017 Report Gregory V. Jones Linfield College November 7, 2017 Summary: October was relatively cool and wet north, while warm and very dry south. Dry conditions
NOAA Spring Flood Outlook for Iowa
 NOAA Spring Flood Outlook for Iowa Safeguard Iowa Partnership March 10, 2015 1 Agenda Orientation Maps Current Conditions Weather Outlook Spring Flood Outlook 2 1 Orientation Maps 3 4 2 5 Current Conditions
Weather and Climate Summary and Forecast October 2017 Report
 Weather and Climate Summary and Forecast October 2017 Report Gregory V. Jones Linfield College October 4, 2017 Summary: Typical variability in September temperatures with the onset of fall conditions evident
NIDIS Weekly Climate, Water and Drought Assessment Summary. Upper Colorado River Basin June 28, 2011
 NIDIS Weekly Climate, Water and Drought Assessment Summary Upper Colorado River Basin June 28, 2011 PrecipitaFon and Snowpack Fig. 1: June month to date precipitafon in inches. Fig. 2: June 19 25 precipitafon
NIDIS Intermountain West Drought Early Warning System December 11, 2018
 NIDIS Drought and Water Assessment NIDIS Intermountain West Drought Early Warning System December 11, 2018 Precipitation The images above use daily precipitation statistics from NWS COOP, CoCoRaHS, and
Weather and Climate Summary and Forecast January 2018 Report
 Weather and Climate Summary and Forecast January 2018 Report Gregory V. Jones Linfield College January 5, 2018 Summary: A persistent ridge of high pressure over the west in December produced strong inversions
National Wildland Significant Fire Potential Outlook
 National Wildland Significant Fire Potential Outlook National Interagency Fire Center Predictive Services Issued: September, 2007 Wildland Fire Outlook September through December 2007 Significant fire
Hydrologic Forecast Centre Manitoba Infrastructure, Winnipeg, Manitoba. MARCH OUTLOOK REPORT FOR MANITOBA March 23, 2018
 Page 1 of 21 Hydrologic Forecast Centre Manitoba Infrastructure, Winnipeg, Manitoba MARCH OUTLOOK REPORT FOR MANITOBA March 23, 2018 Overview The March Outlook Report prepared by the Hydrologic Forecast
Wind River Indian Reservation and Surrounding Area Climate and Drought Summary
 Northern Arapaho Tribe Wind River Indian Reservation and Surrounding Area Climate and Drought Summary Spring Events & Summer Outlook 2016 Wet Spring Leads To Flooding Spring was very wet across most of
NIDIS Intermountain West Drought Early Warning System November 13, 2018
 NIDIS Intermountain West Drought Early Warning System November 13, 2018 Precipitation The images above use daily precipitation statistics from NWS COOP, CoCoRaHS, and CoAgMet stations. From top to bottom,
NIDIS Intermountain West Drought Early Warning System March 26, 2019
 NIDIS Intermountain West Drought Early Warning System March 26, 2019 The images above use daily precipitation statistics from NWS COOP, CoCoRaHS, and CoAgMet stations. From top to bottom, and left to right:
HyMet Company. Streamflow and Energy Generation Forecasting Model Columbia River Basin
 HyMet Company Streamflow and Energy Generation Forecasting Model Columbia River Basin HyMet Inc. Courthouse Square 19001 Vashon Hwy SW Suite 201 Vashon Island, WA 98070 Phone: 206-463-1610 Columbia River
Souris River Basin Spring Runoff Outlook As of March 1, 2019
 Souris River Basin Spring Runoff Outlook As of March 1, 2019 Prepared by: Flow Forecasting & Operations Planning Water Security Agency Basin Conditions Summer rainfall in 2018 over the Saskatchewan portion
The MRCC and Monitoring Drought in the Midwest
 The and Monitoring Drought in the Midwest Steve Hilberg Director, Illinois State Water Survey Prairie Research Institute, University of Illinois The A partner of a national climate service program that
Enclosure 7. COE-FWS letter dated January 18, 2006 Transmittal of Draft Low Water Mussel Study Report
 Enclosure 7 COE-FWS letter dated January 18, 2006 Transmittal of Draft Low Water Mussel Study Report Depth Distribution of the Fat Threeridge Mussel, Amblema neislerii, during Low Flow Stages on the Apalachicola
NIDIS Weekly Climate, Water and Drought Assessment Summary. Upper Colorado River Basin September 27, 2011
 NIDIS Weekly Climate, Water and Drought Assessment Summary Upper Colorado River Basin September 27, 2011 PrecipitaFon and Snowpack Fig. 1: Water year to date precipitafon as a percent of average. Fig.
-Assessment of current water conditions. - Precipitation Forecast. - Recommendations for Drought Monitor
 May 31 st, 2011 -Assessment of current water conditions - Precipitation Forecast - Recommendations for Drought Monitor Upper Colorado River Basin Snow Snowpack % of average to date: 347% Percent
Development and Testing of Alternate Forecast-Based Flood Operations Rules for West Point Lake
 Development and Testing of Alternate Forecast-Based Flood Operations Rules for West Point Lake Dan Sheer and Sam Lebherz HydroLogics John C. Schaake NWS Ret. Wei Zeng Ga, Dept. of Natural Resources November
2012 Growing Season Weather Summary for North Dakota. Adnan Akyüz and Barbara A. Mullins Department of Soil Science October 30, 2012
 2012 Growing Season Weather Summary for North Dakota Adnan Akyüz and Barbara A. Mullins Department of Soil Science October 30, 2012 Introduction The 2012 growing season (the period from April through September)
FORECAST-BASED OPERATIONS AT FOLSOM DAM AND LAKE
 FORECAST-BASED OPERATIONS AT FOLSOM DAM AND LAKE 255 237 237 237 217 217 217 200 200 200 0 163 131 Bridging the Gap163Conference 255 0 132 255 0 163 122 The Dana on Mission Bay San Diego, CA January 28,
Update on Seasonal Conditions & Summer Weather Outlook
 Update on Seasonal Conditions & Summer Weather Outlook Andy Bryant National Weather Service Portland, Oregon June 6, 2018 Overview Quick review of winter and spring conditions Seasonal water supply forecasts