Appendix C. Apalachicola-Chattahoochee-Flint (ACF) Basin Detailed Analysis
|
|
|
- Frank McCormick
- 6 years ago
- Views:
Transcription
1 Appendix C Apalachicola-Chattahoochee-Flint (ACF) Basin Detailed Analysis
 Basin begin as small Appalachian springs in the Blue Ridge Mountains of North Georgia.")
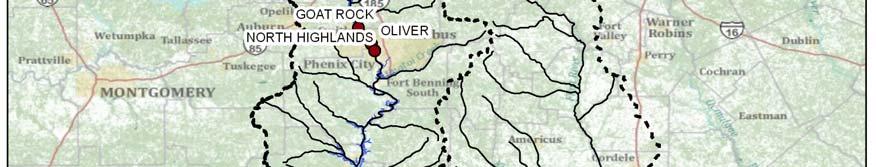
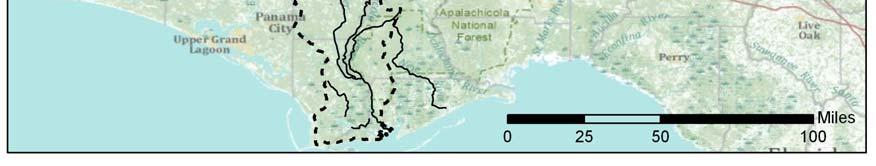
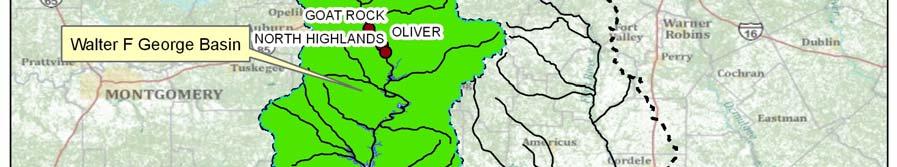
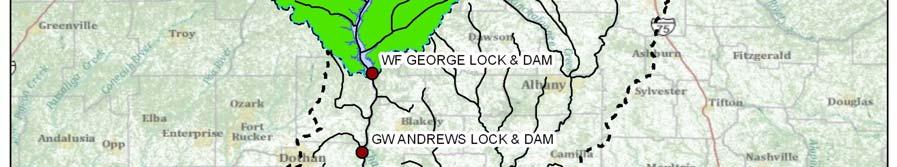
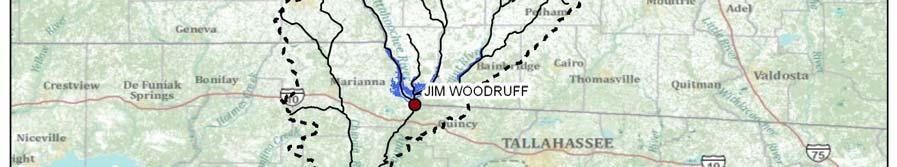
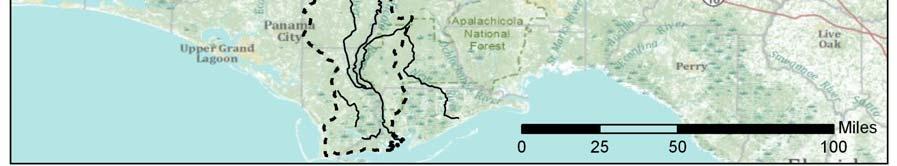
2 Appendix C - Apalachicola-Chattahoochee-Flint Basin Detailed Analysis 1 ACF BASIN 1.1 DESCRIPTION OF BASIN Streams of the Apalachicola-Chattahoochee-Flint Rivers (ACF) Basin begin as small Appalachian springs in the Blue Ridge Mountains of North Georgia. The spring waters flow for over 400 miles until the Chattahoochee River combines with the Flint River, forming the Apalachicola River at the Georgia, Florida border. From the confluence the Apalachicola flows an additional 108 miles to the Gulf of Mexico. The ACF Basin extends about 385 miles from northeast Georgia to the Gulf of Mexico. The total drainage area of the ACF Basin is approximately 19,600 square miles. The largest metropolitan area in the basin is Atlanta, Georgia, located in the northern section. Progressing downstream are the Cities of Columbus, Georgia and Phenix City, Alabama. Albany, Georgia is located in the eastern portion of the basin. At the Gulf of Mexico is the City of Apalachicola, Florida. Features are shown in Figure C-1. Figure C-1. ACF Basin C-1
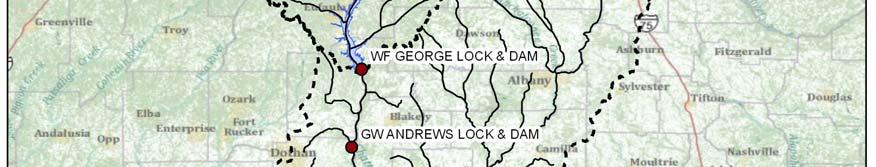
3 1.1.1 Physical Description Chattahoochee Tributaries. The headwaters of the ACF System commence with spring-fed streams feeding Chattahoochee tributaries in northern Georgia mountains. The mountain slopes are steep, with rapid runoff during rainstorms. One of the most upstream tributaries is the Chestatee River that flows into Lake Lanier. In contrast to the mainstream of the Chattahoochee River, many tributaries remain free flowing. Flows in forested tributary basins and those in Metropolitan Atlanta retain similar runoff patterns. They have higher sustained flows during winter months, and relatively quick responses to storm events throughout the year. However, sharper peaks in the hydrographs of urban streams such as Peachtree Creek reflect the influence of impervious land cover in the urbanized parts of the basin. Chattahoochee River. The Chattahoochee River has a drainage area of 8,770 square miles. The headwaters rise as cold-water mountain streams in the Blue Ridge Province at altitudes above 3,000 feet. From its beginning the river flows 430 miles to its confluence with the Flint River. The Chattahoochee River derives its name from Creek Indian words meaning painted rock. This river is one of the most heavily used water resources in Georgia. Through most of its length, flows in the Chattahoochee River are controlled by hydroelectric plants releasing water for production of hydropower. These hydroelectric plants use peaking operations to augment power supply during peak periods of electric demand. Daily fluctuations below some reservoirs can be dramatic. Fluctuations are usually more pronounced during low flow periods when hydropower releases often cause daily fluctuations of several feet. The Chattahoochee River includes five federal projects operated by the Corps of Engineers: Buford Dam (Lake Lanier), West Point Dam, Walter F. George Lock and Dam (Lake Eufaula), and George W. Andrews Lock and Dam. Of these, Lake Sidney Lanier (Buford Dam), West Point Lake, and Lake Eufaula (Walter F. George Dam) provide most water storage available to regulate flows in the basin. Lake Sidney Lanier alone provides 65 percent of conservation storage, although only five percent of the ACF River Basin drains into the lake. In addition, West Point Lake and Lake Walter F. George provide 18 and 14 percent, respectively, of the basin's conservation storage. Lake Seminole has some storage to regulate weekly flows, and the Georgia Power Lake at Morgan Falls provides daily regulation. Georgia Power Company operates seven projects on the Chattahoochee River. One is north of Atlanta, Georgia and the remaining six are located along the Fall Line near Columbus, Georgia. These projects are Morgan Falls Dam, Langdale Dam, Riverview Dam, Bartletts Ferry Dam, Goat Rock Dam, Oliver Dam and North Highlands Dam. The Chattahoochee River Basin also includes City Mills Dam owned by City Mills, and Eagle and Phenix Mills Dam owned by Uptown Columbus Inc. City Mills Dam is currently inoperative. Eagle and Phenix Mills Dam has an operable turbine with an expired Federal Energy Regulatory Commission (FERC) license. Habersham Mill Dam is located in the headwaters above Buford Dam. C-2
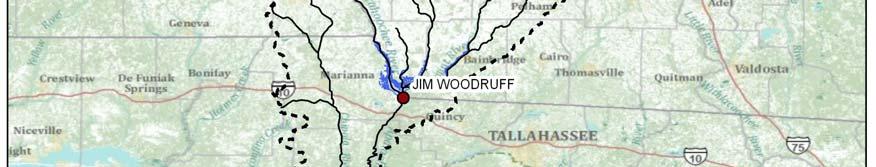
4 Flint River. The Flint River Basin (8,460 square miles) includes Crisp County Dam and Lake (also known as Warwick or Blackshear Lake), and Albany Dam (also known as the Flint River Dam) that impounds Lake Worth. The river begins as a spring or groundwater seep underneath the runways of Hartsfield-Jackson International Airport. The flow is channeled off the airport by large drainage pipes. From the airport it meanders 350 miles in a basin that is approximately 212 miles in length. It has 220 miles of unimpeded flow, making it one of only 40 rivers in the U.S. with open flows of 200 miles or more of near natural stream. The Flint River remains relatively undeveloped, and for much of its length the river is free flowing. Apalachicola River. The Flint River empties into Lake Seminole near Bainbridge, Georgia, where it joins the Chattahoochee River at the Florida state line near the Jim Woodruff Dam to form the Apalachicola River. The Apalachicola River Basin (2,370 square miles) includes Jim Woodruff Lock and Dam (Lake Seminole), which is operated by the Corps of Engineers. The river lies completely within the Coastal Plain and is 108 miles in length. The Apalachicola River then flows south across northwest Florida from the Georgia border to Apalachicola Bay in Florida Climate The chief factors that control the climate of the ACF Basin are its geographical position in the southern end of the Temperate Zone, its proximity to the Gulf of Mexico and South Atlantic Ocean, and its range in altitude from almost sea level at the southern end to over 3,000 feet in the Blue Ridge Mountains to the north. The proximity of the warm South Atlantic and the semitropical Gulf of Mexico ensures a warm, moist climate. Extreme temperatures range from near 110 degrees in the summer to values near zero in the winter. Severe cold weather rarely lasts longer than a few days. The summers, while warm, are usually not oppressive. In the southern end of the basin the average maximum January temperature is 60 degrees and the average minimum January temperature is 37 degrees. The maximum average July temperature is 91 degrees; in the southern end of the basin the corresponding minimum values value is 70 degrees. The frost-free season varies in length from about 200 days in the northern valleys to about 250 days in the southern part of the basin. Precipitation is mostly in the form of rain, but some snow falls in the mountainous northern region on an average of twice a year Precipitation The entire ACF Watershed lies in a region which ordinarily receives an abundance of precipitation. The watershed receives a large amount of rainfall and it is well-distributed throughout the year. Winter and spring are the wettest periods and early fall, the driest. Light snow is not unusual in the northern part of the watershed, but constitutes only a very small fraction of the annual precipitation and has little effect on runoff. Intense flood producing storms occur mostly in the winter and spring. They are usually of the frontal-type, formed by the meeting of warm moist air masses from the Gulf of Mexico colliding with the cold, drier masses from the northern regions, and may cause heavy precipitation over large areas. The storms that occur in summer or early fall are usually of the thunderstorm type with high intensities over smaller areas. Tropical disturbances and hurricanes can occur producing high intensities of rainfall over large areas. C-3
5 1.1.4 Storms and Floods Major flood-producing storms over the ACF Watershed are usually of the frontal type, occurring in the winter and spring and lasting from 2 to 4 days, with their effect on the basin depending on their magnitude and orientation. The axes of the frontal-type storms generally cut across the long, narrow basin. Frequently a flood in the lower reaches is not accompanied by a flood in the upper reaches and vice versa. Occasionally, a summer storm of the hurricane type, such as the storms of July 1916 and July 1994, will cause major floods over practically the entire basin. However, summer storms are usually of the thunderstorm type with high intensities over small areas producing serious local floods. With normal runoff conditions, from 5 to 6 inches of intense rainfall are required to produce widespread flooding, but on many of the minor tributaries 3 to 4 inches are sufficient to produce local floods. Principal Storms. During most years there are one or more flooding events within the ACF Basin. However on occasion there are significant storms that produce widespread flooding or unusually high river stages Runoff Characteristics Within the ACF Basin rainfall occurs throughout the year but is less abundant during the August through November time frame. The amount of this rainfall that actually contributes to streamflow varies much more than the rainfall. Several factors such as plant growth and the seasonal rainfall patterns contribute to the volume of runoff. Tables C-1, C-2, and C-3 present the average monthly runoff for the basin. These tables divide the basin at Atlanta, and Columbus, Georgia and Blountstown, Florida to show the different percentages of runoff verses rainfall for the various sections. The mountainous areas exhibit flashier runoff characteristics and somewhat higher percentages of runoff. Figures C-2, C-3, and C-4 present the same information in graphical form. C-4
6 Table C-1. Basin Rainfall and Runoff above Atlanta AVERAGE MONTHLY RUNOFF IN ACF BASIN MEASURED AT ATLANTA, GEORGIA MONTH JAN FEB MAR APRIL MAY JUNE JULY AUG SEPT OCT NOV DEC AVG MONTHLY FLOW (CFS) AT ATLANTA 3,455 3,887 4,353 3,749 2,913 2,350 2,108 1,891 1,603 1,621 1,947 2,598 AVG RUNOFF IN INCHES AVG RAINFALL IN INCHES PERCENT OF RAINFALL AS RUNOFF 57% 56% 61% 71% 64% 38% 29% 31% 32% 51% 45% 49% AVG RAINFALL IN INCHES C-5 7 BASIN RAINFALL AND RUNOFF ABOVE ATLANTA, GEORGIA AVG RUNOFF IN INCHES PERCENT OF RAINFALL AS RUNOFF INCHES PERCENT JAN FEB MAR APRIL MAY JUNE JULY AUG SEPT OCT NOV DEC MONTH Figure C-2. Basin Rainfall and Runoff above Atlanta, Georgia
7 Table C-2. Basin Rainfall and Runoff between Columbus and Atlanta AVERAGE MONTHLY RUNOFF IN ACF BASIN MEASURED AT COLUMBUS, GEORGIA MONTH JAN FEB MAR APRIL MAY JUNE JULY AUG SEPT OCT NOV DEC AVG MONTHLY FLOW (CFS) BETWEEN ATLANTA AND COLUMBUS 5,567 6,736 7,905 6,495 4,276 3,145 3,144 2,443 2,013 2,096 3,025 4,117 AVG RUNOFF IN INCHES AVG RAINFALL IN INCHES PERCENT OF RAINFALL AS RUNOFF 41% 44% 48% 50% 39% 27% 21% 21% 20% 28% 28% 31% C-6 INCHES BASIN RAINFALL AND RUNOFF BETWEEN COLUMBUS AND ATLANTA AVG RAINFALL IN INCHES AVG RUNOFF IN INCHES PERCENT OF RAINFALL AS RUNOFF PERCENT JAN FEB MAR APRIL MAY JUNE JULY AUG SEPT OCT NOV DEC MONTH Figure C-3. Basin Rainfall and Runoff between Columbus and Atlanta, Georgia
8 Table C-3. Basin Rainfall and Runoff between Blountstown, FL and Columbus, GA AVERAGE MONTHLY RUNOFF IN ACF BASIN MEASURED AT BLOUNTSTOWN, FLORIDA MONTHLY JAN FEB MAR APRIL MAY JUNE JULY AUG SEPT OCT NOV DEC AVG MONTHLY FLOW (CFS) BETWEEN COLUMBUS AND BLOUNTSTOWN 11,431 17,699 22,125 31,014 27,991 17,760 12,803 14,140 11,684 8,684 7,571 6,983 AVG RUNOFF IN INCHES AT BLOUNTSTOWN, FLORIDA AVG RAINFALL IN INCHES PERCENT OF RAINFALL AS RUNOFF 21% 29% 35% 65% 69% 32% 20% 26% 26% 31% 19% 15% C-7 BASIN RAINFALL AND RUNOFF BETWEEN BLOUNTSTOWN AND COLUMBUS AVG RAINFALL IN INCHES AVG RUNOFF IN INCHES INCHES PERCENT OF RAINFALL AS RUNOFF JAN FEB MAR APRIL MAY JUNE JULY AUG SEPT OCT NOV DEC MONTH PERCENT Figure C-4. Basin Rainfall and Runoff between Blountstown, FL and Columbus, GA
9 1.2 RESERVOIRS Reservoir Storage There are five (5) federally owned reservoir projects within the ACF Basin. These are Buford Dam (Lake Lanier), West Point Dam, Walter F. George Lock and Dam (Lake Eufaula), George W. Andrews Lock and Dam, and Jim Woodruff Lock and Dam (Lake Seminole). These projects were built and are operated by the Corps of Engineers, Mobile District Office. As mentioned above, Lake Sidney Lanier alone provides 63 percent of conservation storage, although only five percent of the ACF River Basin drains into the lake. In addition, West Point Lake and Lake Walter F. George provide 18 and 14 percent, respectively, of the basin's conservation storage. The conservation storages by reservoir are shown in Table C-4 and graphically in Figure C-5 below. Table C-4. ACF Basin Conservation Storage by Project Conservation Storage Project (ac-ft) Percentage Lake Lanier 1,087,600 63% West Point 306,127 18% Walter F. George 244,400 14% George Andrews 8,200 1% Lake Seminole 66,847 4% Total 1,713,174 George Andrews 8,200 1% Lake Seminole 66,847 4% W.F. George 244,400 14% West Point 306,127 18% Lake Lanier 1,087,600 63% Figure C-5. ACF Basin Federal Reservoir Conservation Storage Percent by Acre-Feet C-8

10 1.2.2 Reservoirs Selected for Yield The only federal projects with significant storage are Buford Dam (Lake Lanier), West Point Dam, and Walter F. George Lock and Dam (Lake Eufaula). These three projects in the basin account for 95 percent of the total basin conservation storage. Therefore, yield analyses were done only on these three projects. These analyses are presented separately. 1.3 BUFORD DAM (LAKE SIDNEY LANIER) Buford Dam (Lake Lanier) is the uppermost project in the basin. The site is located 50 miles northeast of central Atlanta, Georgia on the Chattahoochee River, river miles above the Apalachicola River or 456 river miles from the Gulf Coast. Above Buford Dam, the Chattahoochee River Basin has a length of 52 miles, and an average width of 20 miles, with extreme widths ranging from a maximum of 36 miles in the headwater area to a minimum of 12 miles in the vicinity of the dam site. The drainage area above the dam is 1,040 square miles. The project was completed in June Buford Dam is a multiplepurpose project with major project purposes including flood control, navigation, hydroelectric power, recreation, fish and wildlife development and water quality. An aerial photo of the main dam is shown on Figure C-6. Figure C-6. Buford Dam Drainage area The Chattahoochee River and its upstream tributaries originate in the Blue Ridge Mountains of northern Georgia, near the western tip of South Carolina. The upper reaches of the basin streams are characterized by the steep slopes of mountain streams. The upper Chattahoochee River (157 square miles) is joined by the Soque River (166 square miles) about 60 miles northeast of Atlanta, Georgia and 11 miles upstream of the limits of the pool at elevation 1071 feet. The Chestatee River, a major tributary, formerly flowed into the Chattahoochee River above the dam site but now forms an arm of Lake Sidney Lanier, as shown on Figure C-7. Presently the Chattahoochee and Chestatee Rivers have drainage areas of 565 and 304 square miles and there is a drainage area of 115 square miles into the lake below their junction. The Chattahoochee and Chestatee Rivers comprise 84 percent of the dam site drainage, the reservoir pool comprises five C-9
11 percent and the remaining area is composed of minor streams which drain directly into the pool. The drainage area is shown on the following Figure C-7. Figure C-7. Buford Basin Map The drainage area is shown in relation to the rest of the basin in the following Figure C-8. This figure shows the local, or incremental area between projects. These areas will be used in the yield computations to determine local flows at the downstream project, rather than the whole basin above the project. For the Buford project, however, there is no upstream project, so the total area above Buford is used in the yield computations. C-10
12 Figure C-8. Incremental Drainage Basin Map for Federal Projects on the ACF Features The project consists of an ear th dam supplemented by earth saddle dikes and an unpaved chute spillway, an 86,000 kw power plant and appurtenances, and a reservoir extending about 44 miles up the Chattahoochee River and about 19 miles up the Chestatee River at full conservation pool. The main dam and reservoir are described below. C-11
13 Dam The main dam, 1,630 feet long and 192 feet high at maximum section, is an earth-fill structure with a rock section on the upstream side. The crest at elevation 1106 feet is 40 feet wide Reservoir The reservoir has a total storage capacity of 2,554,000 acre-feet at full flood control pool, elevation 1085 feet, and covers an area of 47,182 acres. At full conservation pool, elevation 1071 feet, the reservoir covers 38,542 acres and has a total storage capacity of 1,955,200 acrefeet; at minimum conservation pool, elevation 1035 feet, the area covered is 22,442 acres with storage capacity of 867,600 acre-feet. Area-capacity curves are shown on Figure C-9 and Table C-5. Conservation storage varies seasonally from 1,049,400 acre-feet to 1,087,600 acre-feet between a minimum elevation of 1035 feet and a top of conservation pool elevation varying from 1070 to 1071 feet. However, another purpose of the project is flood control and a storage of 637,000 acre-feet between elevation 1070 and elevation 1085 feet has been reserved for the detention storage of flood water. The yield analysis will be based on the conservation storage as described above. Area in Acres 60,000 50,000 40,000 30,000 20,000 10, ,100 1,080 Pool Elevation in Feet above NGVD29 1,060 1,040 1,020 1, Area-Capacity Curve Capacity Area ,000 1,200,000 1,800,000 2,400,000 3,000,000 Capacity in Acre-Feet Figure C-9. Buford Area Capacity Curves C-12
14 Table C-5. Buford Reservoir Area and Capacity Data Pool Total Total Elev Area Storage (ft NGVD 29) (ac) (ac-ft) ,090 5, ,100 37, , , , , , , , , , , , , , , , , , ,600 * , , , , , , , , , , , , ,833 1,009, ,257 1,034, ,701 1,059, ,159 1,085, ,619 1,112, ,079 1,139, ,535 1,166, ,983 1,194, ,432 1,222, ,861 1,250, ,291 1,279, ,721 1,309, ,153 1,339, ,587 1,369, ,023 1,400, ,461 1,431,800 Pool Total Total Elev Area Storage (ft NGVD 29) (ac) (ac-ft) ,901 1,463, ,343 1,495, ,789 1,528, ,238 1,56, ,690 1,594, ,147 1,628, ,610 1,663, ,079 1,698, ,555 1,733, ,036 1,769, ,522 1,805, ,015 1,842, ,515 1,879,200 ** ,024 1,917,000 *** ,542 1,955, ,078 1,994, ,638 2,033, ,226 2,073, ,833 2,114, ,458 2,155, ,086 2,196, ,716 2,239, ,348 2,282, ,982 2,326, ,618 2,370, ,256 2,415, ,896 2,460, ,538 2,507, ,182 2,554, ,250 2,800, ,300 3,070, ,500 3,330, ,900 3,850,000 * Bottom of Conservation Pool ** Top of Winter Conservation Pool *** Top of Summer Conservation Pool C-13
15 1.3.3 Top of Conservation Pool The top of conservation pool varies during the year from elevation 1070 to 1071 feet. Whenever surplus water is available the criteria is to hold the pool at elevation 1071 from 1 May through 1 October, then decrease to 1070 feet by 1 December, then hold 1070 feet unti1 15 April, and then increase to 1071 feet by 1 May. Figure C-10 presents the guide curve to be used. A constant top-of conservation pool level at elevation 1070 feet had been used until In February 1976 the extra storage was approved by the Division Engineer. A plot of the top of the conservation pool is shown on the following Figure C-10. POOL ELEVATION NGVD 29 Figure C-10. Top and Bottom of Buford Conservation Pool The storage for the yield analysis will be based on the storage in the conservation pool from elevation 1071 (or 1070 depending on the time of year) to Regulation Plan Normally the Buford project is operated as a peaking plant for the production of hydroelectric power and during off-peak periods maintains a continuous flow of approximately 650 cfs. Releases from Buford are re-regulated by Georgia Power Company s Morgan Falls Reservoir to insure the City of Atlanta has sufficient flow for water supply and wastewater assimilation. In addition, increased flows during low flow periods are utilized by Corps of Engineers projects at West Point, Walter F. George, and Jim Woodruff for hydropower, to aid navigation and meet the flow requirements of the Jim Woodruff Revised Interim Operating Plan (RIOP). C-14
16 1.3.5 Surface Water Inflows Observed daily inflow, outflow (discharge), and pool elevation data for the period of record starting in Jan 1958, just as the pool was filling through the present (Oct 2009) are available. The data are presented in the following Figure C Unimpaired Flow The existing unimpaired flow data set was updated through 2008 for use in the yield analysis. The daily data was smoothed using 3-, 5-, or 7-day averaging to eliminate small negative values. Although this averaging affects the peak values, the volume is the same and the yield computations were done on the smoothed data. A plot of this smoothed unimpaired daily flow averaged over each year for the period of record is shown in Figure C-12. Daily flows for critical drought periods are plotted in more detail in Figures C-13 C-17. C-15
17 cfs 70,000 60,000 50,000 40,000 30,000 20,000 10, ,000 C-16 Elev (ft) 1,075 1,070 1,065 1,060 1,055 1,050 1,045 1,040 1,035 1, BUFORD OBSERVED INFLOW BUFORD OBSERVED ELEV BUFORD OBSERVED DISCHARGE Figure C-11. Buford Inflow-Outflow-Pool Elevation (Jul 1957-Dec 2009)
18 Buford Reservoir Unimpaired Ann Inflow (cfs) Figure C-12. Buford Unimpaired Annual Inflow Jan 1939 to Dec 2008 Ave = 2021 cfs C-17
19 8,000 7,000 6,000 Unimpaired Flow Average 25 th Percentile 75 th Percentile 5,000 Flow (cfs) 4,000 3,000 C-18 2,000 1, BUFORD UNIMP_CMA7[01JAN DEC2008] FLOW_INC-AVER BUFORD UNIMP_CMA7[01JAN DEC2008] FLOW_INC-P25 BUFORD UNIMP_CMA7[01JAN DEC2008] FLOW_INC-P75 BUFORD UNIMP_CMA7 FLOW_INC Figure C-13. Buford Unimpaired Inflow 1940 s Drought
20 12,000 10,000 Unimpaired Flow Average 25 th Percentile 75 th Percentile 8,000 Flow (cfs) 6,000 4,000 C-19 2, BUFORD UNIMP_CMA7[01JAN DEC2008] FLOW_INC-AVER BUFORD UNIMP_CMA7[01JAN DEC2008] FLOW_INC-P25 BUFORD UNIMP_CMA7[01JAN DEC2008] FLOW_INC-P75 BUFORD UNIMP_CMA7 FLOW_INC Figure C-14. Buford Unimpaired Inflow 1950 s Drought
21 12,000 10,000 8,000 Unimpaired Flow Average 25 th Percentile 75 th Percentile Flow (cfs) 6,000 4,000 C-20 2, BUFORD UNIMP_CMA7[01JAN DEC2008] FLOW_INC-AVER BUFORD UNIMP_CMA7[01JAN DEC2008] FLOW_INC-P25 BUFORD UNIMP_CMA7[01JAN DEC2008] FLOW_INC-P75 BUFORD UNIMP_CMA7 FLOW_INC Figure C-15. Buford Unimpaired Inflow 1980 s Drought
22 12,000 10,000 8,000 Unimpaired Flow Average 25 th Percentile 75 th Percentile Flow (cfs) 6,000 4,000 C-21 2, , BUFORD UNIMP_CMA7[01JAN DEC2008] FLOW_INC-AVER BUFORD UNIMP_CMA7[01JAN DEC2008] FLOW_INC-P25 BUFORD UNIMP_CMA7[01JAN DEC2008] FLOW_INC-P75 BUFORD UNIMP_CMA7 FLOW_INC Figure C-16. Buford Unimpaired Inflow 2000 Drought
23 7,000 6,000 5,000 Unimpaired Flow Average 25 th Percentile 75 th Percentile 4,000 Flow (cfs) 3,000 2,000 C-22 1,000-0 Jan Jul Jan Jul Jan Jul BUFORD UNIMP_CMA7[01JAN DEC2008] FLOW_INC-AVER BUFORD UNIMP_CMA7[01JAN DEC2008] FLOW_INC-P25 BUFORD UNIMP_CMA7[01JAN DEC2008] FLOW_INC-P75 BUFORD UNIMP_CMA7 FLOW_INC Figure C-17. Buford Unimpaired Inflow 2007 Drought

24 1.4 WEST POINT DAM (WEST POINT LAKE) West Point Dam is located on the Chattahoochee River at mile above the mouth and 3.2 miles north of West Point, Georgia. It is river miles below Buford Dam, and miles above Walter F. George Lock and Dam. The project was completed in May West Point Dam is a multiple-purpose project with major project purposes including flood control, hydroelectric power, navigation, recreation, fish and wildlife development and water quality. An aerial photo of the dam is shown in Figure C-18. Figure C-18. West Point Dam Drainage Area The drainage area above the dam is 3,440 square miles. The area is shown on the following Figure C-19. The operation of Buford Dam reduces peak stages about 10 feet to essentially non-damage stages at Morgan Falls Dam and for several miles downstream. The river bottoms are subject to some overbank flow during the infrequent floods at Vinings and in the northwest suburbs of Atlanta near Bolton. Between Bolton and West Point, a distance of about 100 river miles, there is no urban development in the floodplain. The Town of Franklin, 37 miles above West Point, is on high ground well above the flood zone. However, the effect of Buford Dam on floods decreases progressively downstream so that at West Point, peak stages are only slightly reduced. The Cities of West Point and Columbus, Georgia, and Lanett, Langdale, Riverview and Phenix City, Alabama, are all subject to flooding. Bankfull channel capacities downstream are 40,000 cfs at West Point and 32,000 cfs at Columbus. The West Point project provides a maximum flood storage of 391,000 acre-feet including the 221,000 acre-feet between elevations 628 and 635 available on a seasonal basis, and the 170,300 acre-feet between elevations 635 and 641 for induced surcharge operations. C-23


25 Figure C-19. West Point Basin Map C-24


26 For the single reservoir yield analysis in this report, only the area below Buford will be used for local inflow to West Point. This drainage area is the difference in the Buford and West Point drainage areas and is equal to 2,400 square miles. This West Point Basin below Buford area is shown in the following Figure C-20. Figure C-20. Incremental Drainage Basin Map for Federal Projects on the ACF C-25
27 1.4.2 Features The West Point Dam is a concrete gravity type structure with rolled earthfill embankments joining the high ground on the east and west sides of the river. The total length of the concrete dam and earth embankments is 7,250 feet. At the top of the structures, elevation 652 feet above mean sea level, the length of the concrete portion of the dam is 896 feet. The principal structures that make up the concrete dam are an intake-powerhouse structure, a non-overflow section, a gated spillway located in the main river channel, and a left embankment retaining wall which supports the earth embankment on the east abutment Non-Overflow Section The non-overflow section is 185 feet long and forms the tie between the earth embankment on the west side of the river and the powerhouse intake section. The length of the non-overflow is determined by the clearance required between the terminal cone slopes and the powerhouse intake Spillway Section The spillway section is a gravity type ogee section 350 feet long with crest at elevation 597. The spillway contains six tainter gates, each 50 feet wide and 41 feet high, between 10-foot thick piers supported on the overflow section Powerhouse and Intake The powerhouse and intake structure are integrated into a reinforced concrete unit which acts as a part of the dam. The structure is 321 feet in length and consists of five monoliths located between the spillway and non-overflow section. The intake structure provides waterway openings for three main generating units (two to be installed initially and one for a future unit) and one small generating unit to provide continuous minimum flow releases. The main turbines are propeller type with concrete semi-spiral cases. The small was selected to give maximum efficiency while discharging 675 cfs at any head Reservoir The reservoir has a total storage capacity of 774,800 acre-feet at full flood control pool, elevation 641 feet, and covers an area of 31,800 acres. At full conservation pool, elevation 635 feet, the reservoir covers 25,900 acres and has a total storage capacity of 604,500 acre-feet; at minimum conservation pool, elevation 620 feet, the area covered is 15,500 acres with storage capacity of 298,400 acre-feet. Area-capacity curves are shown on Table C-6 and Figure C-21. Conservation storage varies seasonally from 143,900 acre-feet to 306,100 acre-feet between a minimum elevation of 620 feet and a top of conservation pool elevation varying from 628 to 635 feet. Although the top of the flood control pool is 641 feet, only the conservation pool will be used in the yield analysis. C-26
28 Table C-6. West Point Reservoir Area and Capacity Pool Elev Total Area Total Storage (ft NGVD 29) (ac) (ac-ft) *620 15, , , , , , , , , , , , , , , ,025 **628 20, , , , , , , , , , , , , ,062 ***635 25, , , , , , , , , , , ,254 ****641 30, , , , , , , , , ,200 * Minimum power pool ** Top of power pool - December through April *** Top of power pool - June through October **** Top of flood control pool C-27
29 Area in Acres 40, , , , , Pool Elevation in Feet above NGVD Area-Capacity Curve Capacity Area 0 200, , , ,000 1,000,000 Capacity in Acre-Feet Figure C-21. West Point Area Capacity Curves C-28
30 1.4.3 Top of Conservation Pool The top of conservation pool varies during the year from elevation 628 to 635 feet. Whenever surplus water is available the criteria is to hold the pool at elevation 635 from 1 June through 1 November, then decrease to 628 feet by 15 December, then hold 628 feet unti1 15 February, and then increase to 635 feet by 1 June, as shown in Figure C Regulation Plan Normally the West Point project will be operated as a peaking plant for the production of hydroelectric power and during off-peak periods will maintain a continuous flow of 675 cfs. During low-water periods such regulation will provide increased flow downstream for navigation, water supply, water quality requirements and other purposes TOP OF FLOOD CONTROL AT 641 POOL ELEVATION IN FT NGVD FLOOD CONTROL TOP OF CONSERVATION POOL VARIES BOTTOM OF CONSERVATION POOL AT Jan 1-Feb 1-Mar 1-Apr 1-May 1-Jun 1-Jul 1-Aug 1-Sep 1-Oct 1-Nov 1-Dec ALL ELEVS REFERENCE TO NGVD 615 Figure C-22. Top and Bottom of West Point Conservation Pool The storage for the yield analysis will be based on the storage in the conservation pool from elevation 635 (or 628 depending on the time of year) to 620. C-29
31 1.4.5 Surface Water Inflows Observed daily inflow, outflow (discharge), and pool elevation data for the period of record starting in May 1975, just as the pool was filling through the present (Oct 2009) are available. The data are presented in the following Figure C Unimpaired Flow The existing unimpaired flow data set was updated through 2008 for use in the yield analysis. The daily data was smoothed using 3-, 5-, or 7-day averaging to eliminate small negative values. Although this averaging affects the peak values, the volume is the same and the yield computations were done on the smoothed data. A plot of this smoothed unimpaired daily flow averaged over each year for the period of record is shown in Figure C-24. Daily flows for critical drought periods are plotted in more detail in Figures C-25 C-29. C-30
32 80,000 60,000 cfs 40,000 20,000 0 C-31 FLOW Elev (ft) 70,000 60,000 50,000 40,000 30,000 20,000 10, WEST-POINT OBSERVED INFLOW WEST-POINT OBSERVED ELEV WEST-POINT OBSERVED DISCHARGE Figure C-23. West Point Inflow-Outflow-Pool Elevation (Jan 1975-Dec 2009)
33 West Point Reservoir Unimpaired Annual Inflow (cfs) Figure C-24. West Point Unimpaired Annual Inflow Jan 1939 to Dec 2008 Ave =5466 cfs C-32
34 35,000 30,000 25,000 Unimpaired Flow Average 25 th Percentile 75 th Percentile Flow (cfs) 20,000 15,000 10,000 C-33 5, WEST POINT R UNIMP_CMA[04JAN DEC2008] FLOW_CUM-AVER WEST POINT R UNIMP_CMA[04JAN DEC2008] FLOW_CUM-P25 WEST POINT R UNIMP_CMA[04JAN DEC2008] FLOW_CUM-P75 WEST POINT R UNIMP_CMA FLOW_CUM Figure C-25. West Point Unimpaired Inflow 1940 s Drought; 75 th Percentile, Average and 25 th Percentile Flow
35 30,000 25,000 20,000 Unimpaired Flow Average 25 th Percentile 75 th Percentile Flow (cfs) 15,000 10,000 C-34 5, WEST POINT R UNIMP_CMA[04JAN DEC2008] FLOW_CUM-AVER WEST POINT R UNIMP_CMA[04JAN DEC2008] FLOW_CUM-P25 WEST POINT R UNIMP_CMA[04JAN DEC2008] FLOW_CUM-P75 WEST POINT R UNIMP_CMA FLOW_CUM Figure C-26. West Point Unimpaired Inflow 1950 s Drought; 75 th Percentile, Average and 25 th Percentile Flow
36 35,000 30,000 25,000 Unimpaired Flow Average 25 th Percentile 75 th Percentile Flow (cfs) 20,000 15,000 C-35 10,000 5, WEST POINT R UNIMP_CMA[04JAN DEC2008] FLOW_CUM-AVER WEST POINT R UNIMP_CMA[04JAN DEC2008] FLOW_CUM-P25 WEST POINT R UNIMP_CMA[04JAN DEC2008] FLOW_CUM-P75 WEST POINT R UNIMP_CMA FLOW_CUM Figure C-27. West Point Unimpaired Inflow 1980 s Drought; 75 th Percentile, Average and 25 th Percentile Flow
37 45,000 40,000 35,000 30,000 Unimpaired Flow Average 25 th Percentile 75 th Percentile Flow (cfs) 25,000 20,000 15,000 C-36 10,000 5, WEST POINT R UNIMP_CMA[04JAN DEC2008] FLOW_CUM-AVER WEST POINT R UNIMP_CMA[04JAN DEC2008] FLOW_CUM-P25 WEST POINT R UNIMP_CMA[04JAN DEC2008] FLOW_CUM-P75 WEST POINT R UNIMP_CMA FLOW_CUM Figure C-28. West Point Unimpaired Inflow 2000 Drought; 75 th Percentile, Average and 25 th Percentile Flow
38 16,000 14,000 12,000 Unimpaired Flow Average 25 th Percentile 75 th Percentile 10,000 Flow (cfs) 8,000 6,000 C-37 4,000 2,000 0 Jan Jul Jan Jul Jan Jul WEST POINT R UNIMP_CMA[04JAN DEC2008] FLOW_CUM-AVER WEST POINT R UNIMP_CMA[04JAN DEC2008] FLOW_CUM-P25 WEST POINT R UNIMP_CMA[04JAN DEC2008] FLOW_CUM-P75 WEST POINT R UNIMP_CMA FLOW_CUM Figure C-29. West Point Unimpaired Inflow 2007 Drought; 75 th Percentile, Average and 25 th Percentile Flow

39 1.5 WALTER F. GEORGE DAM (LAKE EUFAULA) Walter F. George Lock and Dam is located on the Chattahoochee River at mile 75, approximately one mile north of Fort Gaines, Georgia and approximately 1.6 miles upstream from the Georgia State Highway 37 bridge. The dam crosses the Alabama-Georgia state line with the earth dike on the west bank entirely in Henry County, Alabama. The earth dike on the east is entirely in Clay County, Georgia. The project was completed in June Walter F. George Dam is a multiple-purpose project with major project purposes including, hydroelectric power, navigation, recreation, fish and wildlife development and water quality. The project was not designed for flood control. An aerial photo of the dam is shown in Figure C-30. Figure C-30. Walter F. George Dam Drainage Area The drainage area above Walter F. George Lock and Dam is 7,460 square miles. In the drainage area above Walter F. George Lock and Dam there are nine power developments and two multiple-purpose dams. Seven of the power projects are owned and operated by the Georgia Power Company. They are: Morgan Falls, Langdale, Riverview, Bartletts Ferry, Goat Rock, Oliver, and North Highlands. The City Mills Dam and Eagle and Phenix Mills Dam are independently owned and operated. These are very low head projects which have no effect on river hydraulics. Buford and West Point Dams are federal projects operated by the Corps of Engineers and are multiple-purpose dams that provide flood protection, production of hydroelectric power, water supply, recreation, instream flow, and increased flows for navigation during low-flow seasons. The drainage area and federal and Georgia Power Company dams are shown on the following Figure C-31. C-38


40 Figure C-31. Walter F. George Basin Map C-39


41 For the single reservoir yield analysis in this report, only the area below West Point was used for local inflow to Walter F. George. This drainage area is the difference in the West Point and Walter F. George drainage areas and is equal to 4,020 square miles. This Walter F. George Basin below West Point area is shown in the following Figure C-32. Figure C-32. Incremental Drainage Basin Map for Federal Projects on the ACF C-40
42 1.5.2 General Features The dam consists of a powerhouse, a gated spillway, a lock in and adjacent to the original river channel, and earth dikes extending to high ground on both banks. The lock is 82 by 450 feet with a maximum lift of 88 feet. The project has a 130,000 kw power plant with appurtenances, and a reservoir extending up the Chattahoochee River 85 miles to Columbus, Georgia and Phenix City, Alabama. The reservoir provides a nine-foot minimum depth for navigation from the dam to Columbus and Phenix City. The principal features of the structure are, from left to right bank, an earth dike, the navigation lock, the concrete gated spillway, the powerhouse with intake section constituting part of the dam, and an earth dike Dam Overall length of the structure including the lock and powerhouse sections is 13,585 feet, or 2.6 miles Reservoir The reservoir at maximum summer operating level (conservation pool) of elevation 190, covers an area of 45,180 acres and has a total storage of 934,400 acre-feet. The pool extends up the Chattahoochee River 85 miles to Columbus, Georgia. At the minimum operating level (conservation pool), elevation 184, the reservoir covers an area of 36,375 acres and has a total storage of 690,000 acre-feet. Area and capacity curves are shown on Figure C-33 and in Table C-7. Area in Acres 80,000 70,000 60,000 50,000 40,000 30,000 20,000 10, Pool Elevation in Feet above NGVD Area-Capcity Curve Capacity Area , , , ,000 1,000,000 1,200,000 1,400,000 1,600,000 Capacity in Acre-Feet Figure C-33. Walter F. George Area Capacity Curves C-41
43 Table C-7. Walter F. George Reservoir Area and Capacity Pool Elev Total Area Total Storage (ft NGVD 29 (ac) (ac-ft) , , ,248 11, ,550 18, ,894 27, ,375 37, ,966 51, ,720 67, ,895 89, , , , ,500 *163 12, , , , , , , , , , , , , , , , , , , , , , , ,500 **188 42, , , ,000 ***190 45, , , , ,615 1,028, ,356 1,077, ,250 1,129, ,045 1,182, ,975 1,237, ,800 1,294, ,650 1,352, ,528 1,413, ,375 1,475,800 * Crest of gated spillway ** Top of power pool - December through April *** Top of power pool - June through September C-42
44 1.5.3 Top of Conservation Pool The top of conservation pool varies during the year from elevation 188 to 190 feet. Whenever surplus water is available the criteria is to hold the pool at elevation 190 from 1 June through 31 October, then decrease to 188 feet by 1 December, then hold 188 feet unti1 1 May, and then increase to 190 feet by 1 June, as shown in Figure C Regulation Plan The Walter F. George pool is regulated between the minimum pool elevation 184 and 190. The pool may rise above elevation 190 for short periods of time during high flow periods. A major operating constraint is the structural limitation that the difference between the headwater and tailwater must not exceed 88 feet at any time. In addition to reservoir constraints, downstream water needs will, at times, require outflow from Walter F. George to be fairly evenly distributed throughout each week TOP OF DAM 194 POOL ELEVATION IN FT NGVD TOP OF CONSERVATION POOL VARIES ( ) 184 BOTTOM OF CONSERVATION AT ALL ELEVS REFERENCE TO NGVD 29 1-Jan 1-Feb 1-Mar 1-Apr 1-May 1-Jun 1-Jul 1-Aug 1-Sep 1-Oct 1-Nov 1-Dec Figure C-34. Top and Bottom of Walter F. George Conservation Pool The storage for the yield analysis will be based on the storage in the conservation pool from elevation 184 to (depending on the time of year). C-43
45 1.5.5 Surface Water Inflows Observed daily inflow, outflow (discharge), and pool elevation data for the period of record starting in January 1964, just after the pool filled, through the present (Oct 2009) are available. The data are presented in the following Figure C Unimpaired Flow The existing unimpaired flow data set was updated through 2008 for use in the yield analysis. The daily data was smoothed using 3-, 5-, or 7-day averaging to eliminate small negative values. Although this averaging affects the peak values, the volume is the same and the yield computations were done on the smoothed data. A plot of this smoothed unimpaired daily flow averaged over each year for the period of record is shown in Figure C-36. Daily flows for critical drought periods are plotted in more detail in Figures C-37 C-41. C-44
46 cfs 100,000 80,000 60,000 40,000 20, ,000 FLOW 60,000 40,000 C-45 20, Elev (ft) GEORGE OBSERVED INFLOW GEORGE OBSERVED ELEV GEORGE OBSERVED DISCHARGE Figure C-35. Walter F. George Inflow-Outflow-Pool Elevation (Jan 1964-Dec 2009)
47 W.F. George Reservoir Ave = 9845 cfs Figure C-36. Walter F. George Unimpaired Annual Inflow Jan 1939 to Dec Unimpaired Annual Inflow (cfs) C-46
48 80,000 70,000 60,000 Unimpaired Flow Average 25 th Percentile 75 th Percentile 50,000 C-47 Flow (cfs) 40,000 30,000 20,000 10, W.F.GEORGE UNIMP_CMA[07JAN DEC2008] FLOW_CUM-AVER W.F.GEORGE UNIMP_CMA[07JAN DEC2008] FLOW_CUM-P25 W.F.GEORGE UNIMP_CMA[07JAN DEC2008] FLOW_CUM-P75 W.F.GEORGE UNIMP_CMA FLOW_CUM Figure C-37. Walter F. George Unimpaired Inflow 1940 s Drought; 75 th Percentile, Average and 25 th Percentile Flow
49 50,000 45,000 40,000 35,000 Unimpaired Flow Average 25 th Percentile 75 th Percentile 30,000 Flow (cfs) 25,000 20,000 C-48 15,000 10,000 5, W.F.GEORGE UNIMP_CMA[07JAN DEC2008] FLOW_CUM-AVER W.F.GEORGE UNIMP_CMA[07JAN DEC2008] FLOW_CUM-P25 W.F.GEORGE UNIMP_CMA[07JAN DEC2008] FLOW_CUM-P75 W.F.GEORGE UNIMP_CMA FLOW_CUM Figure C-38. Walter F. George Unimpaired Inflow 1950 s Drought; 75 th Percentile, Average and 25 th Percentile Flow
50 40,000 35,000 Unimpaired Flow Average 25 th Percentile 75 th Percentile 30,000 25,000 Flow (cfs) 20,000 15,000 C-49 10,000 5, W.F.GEORGE UNIMP_CMA[07JAN DEC2008] FLOW_CUM-AVER W.F.GEORGE UNIMP_CMA[07JAN DEC2008] FLOW_CUM-P25 W.F.GEORGE UNIMP_CMA[07JAN DEC2008] FLOW_CUM-P75 W.F.GEORGE UNIMP_CMA FLOW_CUM Figure C-39. Walter F. George Unimpaired Inflow 1980 s Drought; 75 th Percentile, Average and 25 th Percentile Flow
51 100,000 90,000 80,000 70,000 Unimpaired Flow Average 25 th Percentile 75 th Percentile 60,000 Flow (cfs) 50,000 40,000 C-50 30,000 20,000 10, W.F.GEORGE UNIMP_CMA[07JAN DEC2008] FLOW_CUM-AVER W.F.GEORGE UNIMP_CMA[07JAN DEC2008] FLOW_CUM-P25 W.F.GEORGE UNIMP_CMA[07JAN DEC2008] FLOW_CUM-P75 W.F.GEORGE UNIMP_CMA FLOW_CUM Figure C-40. Walter F. George Unimpaired Inflow 2000 Drought; 75 th Percentile, Average and 25 th Percentile Flow
52 30,000 Unimpaired Flow Average 25 th Percentile 75 th Percentile 25,000 20,000 15,000 Flow (cfs) 10,000 C-51 5, ,000 Jan Jul Jan Jul Jan Jul W.F.GEORGE UNIMP_CMA[07JAN DEC2008] FLOW_CUM-AVER W.F.GEORGE UNIMP_CMA[07JAN DEC2008] FLOW_CUM-P25 W.F.GEORGE UNIMP_CMA[07JAN DEC2008] FLOW_CUM-P75 W.F.GEORGE UNIMP_CMA FLOW_CUM Figure C-41. Walter F. George Unimpaired Inflow 2007 Drought; 75 th Percentile, Average and 25 th Percentile Flow

53 1.6 ResSim MODELING The ResSim model for the ACF Basin is shown below in Figure C-42. Figure C-42. ACF ResSim Model Schematic C-52
54 ResSim version 3.2 Dev, November 2009 was utilized using the ResSim Watershed "ACF2009- Yield" and the network "ACF Yield". The ACF ResSim model includes four reservoirs, 19 nonreservoir locations and three diversion destinations. The fourth reservoir, Jim Woodruff, is runof-river and not included in the yield analysis. Physical characteristics of each reservoir incorporated into the model using the latest published reservoir operation manual. Yield computations are dependent on the conservation storage and hydrology. The regulation plan section for each reservoir above describes the conservation storage. The ResSim operation set only includes the diversion yield rules and the downstream flood control rules. Reservoir guidelines for determining releases are defined using the operation set. Method C (System Yield) also includes tandem rules in the operation set for the system yield analysis from Walter F. George. Simulations were created for each of the five indentified drought periods. The beginning and end period was selected to capture the drawdown and refill of all projects. Buford, having the greatest amount of storage and smallest drainage area, determined the duration of the simulation period. Each yield method (A, B and C) includes one simulation for each of five drought periods. A total of 40 simulations were run. This included 15 simulations under Method A, 15 simulations under Method B and 10 simulations under Method C (5 without diversion and 5 with diversions). Each simulation determined the yield for a particular reservoir and drought period. Simulation naming uses the drought label from Table C-8. For example Method A simulation name for the 1980 drought is 1980 wo Div, Method B is 1980 w Div and Method C is 1980 System Yield. Table C-8. Drought Periods Drought Periods Label Method A does not include the net river withdrawals and Method B does include the net river withdrawals in the yield determination. Each storage reservoir has a different operating set for the Method A and B alternatives, YieldNoDiv and YieldWDiv respectively. For Methods A and B the upstream reservoir is the primary reservoir and the yield is met first before proceeding downstream. Projects are full at the beginning of the drought period simulation. None of the yield is returned to the system. This assumes that the yield is diverted from the system and is consumptively used. For instance, on the ACF, this means that the yield computed at Buford was not counted as inflow to West Point, downstream. This methodology determines the conservative individual project yield. As mentioned in the Methods Employed in Critical Yield Analysis section, for the Method C simulations the reservoirs are operated together to compute a system yield at Walter F. George. C-53

55 A diversion outlet is added to each of the three reservoirs (Buford, West Point and Walter F. George). Water from the reservoir is diverted through the outlet to a dummy location not connected to the system. None of the diverted water is returned to the system. The yield represents the maximum continuous flow of water through this outlet during one of the five drought periods using all available conservation storage. 1.7 RESULTS Table C-9 below presents the results from each of the simulations for Method A, and the pool elevations and yield flow values are presented graphically in Figures C-43 C-45. The flow represents the total release from the reservoir. When the flow hydrograph rises above the constant yield value, flows are released through the reservoir. Table C-9. ACF Project Yield Analysis without River Diversions, Method A Drought Period Project Critical Yield Lanier 1,776 1,802 1,465 1,518 1,631 1,465 West Point 1,736 1,359 1,746 1,538 1,167 1,167 Walter F. George 1,903 1,589 1, Method A critical yield for Buford is 1,465 cfs and the critical period is the 1980 s drought period Method A critical yield for West Point is 1,167 cfs and the critical period is the 2007 drought period Method A critical yield for Walter F. George is 572 cfs and the critical period is the 2007 drought period Legend Guide Curve Pool Elevation Inflow Outflow Figure C-43. Buford Critical Yield Result, Method A (No Diversions) C-54
 Legend Guide Curve Pool Elevation Inflow Outflow Figure C-45.")
56 Legend Guide Curve Pool Elevation Inflow Outflow Figure C-44. West Point Critical Yield Result, Method A (No Diversions) Legend Guide Curve Pool Elevation Inflow Outflow Figure C-45. Walter F. George Critical Yield Result, Method A (No Diversions) C-55
57 The drawdown period for each drought period is listed in Table C-10. Table C-10. ACF Yield Drawdown Period Drought Label Buford West Point Walter F. George 1940's Jun Feb 1946 Apr Jan 1942 May Dec 's Apr Apr 1962 May Feb 1955 May Feb 's Mar Mar 1990 Mar Dec 1986 May Nov Jun Sep 2004 Apr Feb 2001 Apr Dec Mar 2006 Oct 2009* Mar Feb 2008 Apr Jan 2008 * Estimated based on actual refill Table C-11 below captures the impact of net year 2007 river withdrawals above the lakes from the Chattahoochee River and tributaries. Graphical results of the pool elevation and yield are presented in Figures C-46, C-47, and C-48. As expected the yield values are reduced because the inflow into the reservoirs is reduced by the river withdrawal amounts. The critical yield reduction for Buford, West Point and Walter F. George is 0.4%, 23.7% and 17.9% respectfully. Lake Lanier does not refill during the simulation period because unimpaired flow data through 2009 was not available at the time of analysis. The Corps will run the analysis through 2009 when flow data becomes available. Table C-11. ACF Projects Yield Analysis with River Diversions, Method B Drought Period Project Critical Yield Lanier 1,772 1,798 1,460 1,513 1,628 1,460 West Point 1,449 1,077 1,454 1, Walter F. George 1,763 1,496 1, Method B critical yield for Buford is 1,460 cfs and the critical period is the 1980 s drought period Method B l yield for West Point is 891 cfs and the critical period is the 2007 drought period Method B yield for Walter F. George is 470 cfs and the critical period is the 2007 drought period C-56
 Legend Guide Curve Pool Elevation Inflow Outflow Figure C-47.")
58 Legend Guide Curve Pool Elevation Inflow Outflow Figure C-46. Buford Critical Yield Result, Method B (With Diversions) Legend Guide Curve Pool Elevation Inflow Outflow Figure C-47. West Point Critical Yield Result, Method B (With Diversions) C-57
59 Legend Guide Curve Pool Elevation Inflow Outflow Figure C-48. Walter F. George Critical Yield Result, Method B (With Diversions) Table C-12 presents the results from ACF system analysis, Method C. The table shows that, using the 2007 river diversions, the system yield is reduced 16%, from 4370 cfs to 3683 cfs. Graphical results are presented in Figure C-49 and Figure C-50. Table C-12. ACF System Yield Analysis, Method C Drought Period Project Critical Yield System with Diversions 5,471 4,616 4,671 4,019 3,683 3,683 System without Diversions 6,124 5,231 5,338 4,738 4,370 4,370 C-58
 C-59")
60 Buford Reservoir Release West Point Reservoir Release Legend Guide Curve Pool Elevation Inflow Outflow Figure C-49. System Critical Yield Result, Method C (No Diversions) C-59

61 Buford Reservoir Release West Point Reservoir Release Legend Guide Curve Pool Elevation Inflow Outflow Figure C-50. System Critical Yield Result, Method C (With Diversions) C-60
Appendix B - Alabama-Coosa-Tallapoosa (ACT) Basin
 Basin") Appendix B - Alabama-Coosa-Tallapoosa (ACT) Basin 1 ACT BASIN 1.1 DESCRIPTION OF BASIN The headwater streams of the Alabama-Coosa-Tallapoosa (ACT) System rise in the Blue Ridge Mountains of Georgia and
Appendix B - Alabama-Coosa-Tallapoosa (ACT) Basin 1 ACT BASIN 1.1 DESCRIPTION OF BASIN The headwater streams of the Alabama-Coosa-Tallapoosa (ACT) System rise in the Blue Ridge Mountains of Georgia and
National Integrated Drought Information System. Southeast US Pilot for Apalachicola- Flint-Chattahoochee River Basin 20-March-2012
 National Integrated Drought Information System Southeast US Pilot for Apalachicola- Flint-Chattahoochee River Basin 20-March-2012 Current drought status from Drought Monitor http://www.drought.unl.edu/dm/monitor.html
Attachment B to Technical Memorandum No.2. Operations Plan of Ross Valley Detention Basins
 Attachment B to Technical Memorandum No.2 Operations Plan of Ross Valley Detention Basins Operations Plan of Ross Valley Detention Basins Stetson Engineers Inc. January 26, 2011 1.0 Introduction Achieving
Mobile District River System Status for November 17, 2017
 Mobile District River System Status for November 17, 2017 Weather Update The Quantitative Precipitation Forecast (QPF) in Figure 1 shows forecasted precipitation for the next 7 days. Figure 2 shows the
Mobile District River System Status for October 25, 2018
 Mobile District River System Status for October 25, 2018 Weather Update The Quantitative Precipitation Forecast (QPF) in Figure 1 shows 0.4 to 2.5 inches of precipitation forecasted for the next 7 days.
National Integrated Drought Information System Southeast US Pilot for Apalachicola- Flint-Chattahoochee River Basin. 22 May 2012
 National Integrated Drought Information System Southeast US Pilot for Apalachicola- Flint-Chattahoochee River Basin 22 May 2012 Outline Welcome Keith Ingram, UF, Southeast Climate Consortium Current drought
3.0 TECHNICAL FEASIBILITY
 3.0 TECHNICAL FEASIBILITY 3.1 INTRODUCTION To enable seasonal storage and release of water from Lake Wenatchee, an impoundment structure would need to be constructed on the lake outlet channel. The structure
9. PROBABLE MAXIMUM PRECIPITATION AND PROBABLE MAXIMUM FLOOD
 9. PROBABLE MAXIMUM PRECIPITATION AND PROBABLE MAXIMUM FLOOD 9.1. Introduction Due to the size of Watana Dam and the economic importance of the Project to the Railbelt, the Probable Maximum Flood (PMF)
PRELIMINARY DRAFT FOR DISCUSSION PURPOSES
 Memorandum To: David Thompson From: John Haapala CC: Dan McDonald Bob Montgomery Date: February 24, 2003 File #: 1003551 Re: Lake Wenatchee Historic Water Levels, Operation Model, and Flood Operation This
FORECAST-BASED OPERATIONS AT FOLSOM DAM AND LAKE
 FORECAST-BASED OPERATIONS AT FOLSOM DAM AND LAKE 255 237 237 237 217 217 217 200 200 200 0 163 131 Bridging the Gap163Conference 255 0 132 255 0 163 122 The Dana on Mission Bay San Diego, CA January 28,
2015 Fall Conditions Report
 2015 Fall Conditions Report Prepared by: Hydrologic Forecast Centre Date: December 21 st, 2015 Table of Contents Table of Figures... ii EXECUTIVE SUMMARY... 1 BACKGROUND... 2 SUMMER AND FALL PRECIPITATION...
REDWOOD VALLEY SUBAREA
 Independent Science Review Panel Conceptual Model of Watershed Hydrology, Surface Water and Groundwater Interactions and Stream Ecology for the Russian River Watershed Appendices A-1 APPENDIX A A-2 REDWOOD
Lake Winnebago Regulation Meeting
 Lake Winnebago Regulation Meeting USACE Detroit District October 9, 2014 US Army Corps of Engineers Agenda Basin Overview Major Stakeholders Maintenance a and Repair Work Weather Conditions 2013-20142014
Climate. Annual Temperature (Last 30 Years) January Temperature. July Temperature. Average Precipitation (Last 30 Years)
 January Temperature. July Temperature. Average Precipitation (Last 30 Years)") Climate Annual Temperature (Last 30 Years) Average Annual High Temp. (F)70, (C)21 Average Annual Low Temp. (F)43, (C)6 January Temperature Average January High Temp. (F)48, (C)9 Average January Low Temp.
Climate Annual Temperature (Last 30 Years) Average Annual High Temp. (F)70, (C)21 Average Annual Low Temp. (F)43, (C)6 January Temperature Average January High Temp. (F)48, (C)9 Average January Low Temp.
Rainfall Observations in the Loxahatchee River Watershed
 Rainfall Observations in the Loxahatchee River Watershed Richard C. Dent Loxahatchee River District September 1997 Introduction Rain is a common occurrence in south Florida, yet its presence or absence
Missouri River Basin Water Management
 Missouri River Basin Water Management US Army Corps of Engineers Missouri River Navigator s Meeting February 12, 2014 Bill Doan, P.E. Missouri River Basin Water Management US Army Corps of Engineers BUILDING
January 25, Summary
 January 25, 2013 Summary Precipitation since the December 17, 2012, Drought Update has been slightly below average in parts of central and northern Illinois and above average in southern Illinois. Soil
2. PHYSICAL SETTING FINAL GROUNDWATER MANAGEMENT PLAN. 2.1 Topography. 2.2 Climate
 FINAL GROUNDWATER MANAGEMENT PLAN 2. PHYSICAL SETTING Lassen County is a topographically diverse area at the confluence of the Cascade Range, Modoc Plateau, Sierra Nevada and Basin and Range geologic provinces.
Monthly Long Range Weather Commentary Issued: APRIL 18, 2017 Steven A. Root, CCM, Chief Analytics Officer, Sr. VP,
 Monthly Long Range Weather Commentary Issued: APRIL 18, 2017 Steven A. Root, CCM, Chief Analytics Officer, Sr. VP, sroot@weatherbank.com MARCH 2017 Climate Highlights The Month in Review The average contiguous
Lower Tuolumne River Accretion (La Grange to Modesto) Estimated daily flows ( ) for the Operations Model Don Pedro Project Relicensing
 Estimated daily flows ( ) for the Operations Model Don Pedro Project Relicensing") Lower Tuolumne River Accretion (La Grange to Modesto) Estimated daily flows (1970-2010) for the Operations Model Don Pedro Project Relicensing 1.0 Objective Using available data, develop a daily time series
Lower Tuolumne River Accretion (La Grange to Modesto) Estimated daily flows (1970-2010) for the Operations Model Don Pedro Project Relicensing 1.0 Objective Using available data, develop a daily time series
Monthly Long Range Weather Commentary Issued: NOVEMBER 16, 2015 Steven A. Root, CCM, Chief Analytics Officer, Sr. VP, sales
 Monthly Long Range Weather Commentary Issued: NOVEMBER 16, 2015 Steven A. Root, CCM, Chief Analytics Officer, Sr. VP, sales sroot@weatherbank.com OCTOBER 2015 Climate Highlights The Month in Review The
INFLOW DESIGN FLOOD CONTROL SYSTEM PLAN 40 C.F.R. PART PLANT YATES ASH POND 2 (AP-2) GEORGIA POWER COMPANY
 GEORGIA POWER COMPANY") INFLOW DESIGN FLOOD CONTROL SYSTEM PLAN 40 C.F.R. PART 257.82 PLANT YATES ASH POND 2 (AP-2) GEORGIA POWER COMPANY EPA s Disposal of Coal Combustion Residuals from Electric Utilities Final Rule (40 C.F.R.
INFLOW DESIGN FLOOD CONTROL SYSTEM PLAN 40 C.F.R. PART 257.82 PLANT YATES ASH POND 2 (AP-2) GEORGIA POWER COMPANY EPA s Disposal of Coal Combustion Residuals from Electric Utilities Final Rule (40 C.F.R.
The Climate of Oregon Climate Zone 4 Northern Cascades
 /05 E55 Unbound issue No. 9/ is Does not circulate Special Report 916 May 1993 The Climate of Oregon Climate Zone 4 Property of OREGON STATE UNIVERSITY Library Serials Corvallis, OR 97331-4503 Agricultural
Flooding in Western North Carolina: Some Spatial, Hydrologic, and Seasonal Characteristics CAUTION!! Outline. Basic Flood Facts.
 Flooding in Western North Carolina: Some Spatial, Hydrologic, and Seasonal Characteristics J. Greg Dobson CAUTION!! National Environmental Modeling and Analysis Center RENCI at UNC-Asheville Engagement
The hydrologic service area (HSA) for this office covers Central Kentucky and South Central Indiana.
 for this office covers Central Kentucky and South Central Indiana.") MONTH YEAR January 2011 February 15, 2011 X An X inside this box indicates that no flooding occurred within this hydrologic service area. January 2011 was drier than normal in all locations in the area.
MONTH YEAR January 2011 February 15, 2011 X An X inside this box indicates that no flooding occurred within this hydrologic service area. January 2011 was drier than normal in all locations in the area.
Monthly Long Range Weather Commentary Issued: February 15, 2015 Steven A. Root, CCM, President/CEO
 Monthly Long Range Weather Commentary Issued: February 15, 2015 Steven A. Root, CCM, President/CEO sroot@weatherbank.com JANUARY 2015 Climate Highlights The Month in Review During January, the average
Summary of the 2017 Spring Flood
 Ottawa River Regulation Planning Board Commission de planification de la régularisation de la rivière des Outaouais The main cause of the exceptional 2017 spring flooding can be described easily in just
Climate also has a large influence on how local ecosystems have evolved and how we interact with them.
 The Mississippi River in a Changing Climate By Paul Lehman, P.Eng., General Manager Mississippi Valley Conservation (This article originally appeared in the Mississippi Lakes Association s 212 Mississippi
The Climate of Oregon Climate Zone 3 Southwest Interior
 .k) 105 Unbound issue " " 1 4oes not circulate C4P. Special Report 915 May 1993 The Climate of Oregon Climate Zone 3 Southwest Interior Property of OREGON STATE UNIVERSITY Library Serials Corvallis, OR
Monthly Long Range Weather Commentary Issued: SEPTEMBER 19, 2016 Steven A. Root, CCM, Chief Analytics Officer, Sr. VP,
 Monthly Long Range Weather Commentary Issued: SEPTEMBER 19, 2016 Steven A. Root, CCM, Chief Analytics Officer, Sr. VP, sroot@weatherbank.com SEPTEMBER 2016 Climate Highlights The Month in Review The contiguous
Chiang Rai Province CC Threat overview AAS1109 Mekong ARCC
 Chiang Rai Province CC Threat overview AAS1109 Mekong ARCC This threat overview relies on projections of future climate change in the Mekong Basin for the period 2045-2069 compared to a baseline of 1980-2005.
SEPTEMBER 2013 REVIEW
 Monthly Long Range Weather Commentary Issued: October 21, 2013 Steven A. Root, CCM, President/CEO sroot@weatherbank.com SEPTEMBER 2013 REVIEW Climate Highlights The Month in Review The average temperature
PENNSYLVANIA DEPARTMENT OF TRANSPORTATION ENGINEERING DISTRICT 3-0
 PENNSYLVANIA DEPARTMENT OF TRANSPORTATION ENGINEERING DISTRICT 3-0 LYCOMING COUNTY S.R.15, SECTION C41 FINAL HYDROLOGIC AND HYDRAULIC REPORT STEAM VALLEY RUN STREAM RELOCATION DATE: June, 2006 REVISED:
Drought Early Warning for the Apalachicola- Chattahoochee-Flint River Basin 20 December 2016
 National Integrated Drought Information System Drought Early Warning for the Apalachicola- Chattahoochee-Flint River Basin 20 December 2016 If you are new to the webinar: For audio: Dial in: 877-922-7940
Proposal to limit Namakan Lake to 1970 Upper Rule Curve for remainder of summer
 July 7, 214 Subject: Proposal to limit Namakan Lake to 197 Upper Rule Curve for remainder of summer Background: Flooding in 214 has resulted in the highest water levels on Namakan Lake since 1968, and
Monthly Long Range Weather Commentary Issued: May 15, 2014 Steven A. Root, CCM, President/CEO
 Monthly Long Range Weather Commentary Issued: May 15, 2014 Steven A. Root, CCM, President/CEO sroot@weatherbank.com APRIL 2014 REVIEW Climate Highlights The Month in Review The average temperature for
A Report on a Statistical Model to Forecast Seasonal Inflows to Cowichan Lake
 A Report on a Statistical Model to Forecast Seasonal Inflows to Cowichan Lake Prepared by: Allan Chapman, MSc, PGeo Hydrologist, Chapman Geoscience Ltd., and Former Head, BC River Forecast Centre Victoria
A Review of the 2007 Water Year in Colorado
 A Review of the 2007 Water Year in Colorado Nolan Doesken Colorado Climate Center, CSU Mike Gillespie Snow Survey Division, USDA, NRCS Presented at the 28 th Annual AGU Hydrology Days, March 26, 2008,
Section 4: Model Development and Application
 Section 4: Model Development and Application The hydrologic model for the Wissahickon Act 167 study was built using GIS layers of land use, hydrologic soil groups, terrain and orthophotography. Within
NATIONAL WEATHER SERVICE
 January 2016 February 9, 2016 This was a dry month across the HSA despite one large and several smaller snowfalls. Most locations ended up 1-2 inches below normal for the month. The driest locations at
Monthly Long Range Weather Commentary Issued: APRIL 25, 2016 Steven A. Root, CCM, Chief Analytics Officer, Sr. VP, sales
 Monthly Long Range Weather Commentary Issued: APRIL 25, 2016 Steven A. Root, CCM, Chief Analytics Officer, Sr. VP, sales sroot@weatherbank.com MARCH 2016 Climate Highlights The Month in Review The March
Illinois Drought Update, December 1, 2005 DROUGHT RESPONSE TASK FORCE Illinois State Water Survey, Department of Natural Resources
 Illinois Drought Update, December 1, 2005 DROUGHT RESPONSE TASK FORCE Illinois State Water Survey, Department of Natural Resources For more drought information please go to http://www.sws.uiuc.edu/. SUMMARY.
Integrating Weather Forecasts into Folsom Reservoir Operations
 Integrating Weather Forecasts into Folsom Reservoir Operations California Extreme Precipitation Symposium September 6, 2016 Brad Moore, PE US Army Corps of Engineers Biography Brad Moore is a Lead Civil
Changing Hydrology under a Changing Climate for a Coastal Plain Watershed
 Changing Hydrology under a Changing Climate for a Coastal Plain Watershed David Bosch USDA-ARS, Tifton, GA Jeff Arnold ARS Temple, TX and Peter Allen Baylor University, TX SEWRU Objectives 1. Project changes
 Red River Flooding June 2015 Caddo and Bossier Parishes Presented by: Flood Technical Committee Where the Rain Falls Matters I-30 versus I-20 I-20 Backwater and Tributary Floods (Localized) 2016 Flood
Stream Discharge and the Water Budget
 Regents Earth Science Unit 6: Water Cycle & Climate Name: Lab # Stream Discharge and the Water Budget Introduction: The United States Geological Survey (USGS) measures and publishes values for the daily
David R. Vallee Hydrologist-in-Charge NOAA/NWS Northeast River Forecast Center
 David R. Vallee Hydrologist-in-Charge NOAA/NWS Northeast River Forecast Center Record flooding along the Shawsheen River during the 2006 Mother s Day Floods Calibrate and implement a variety of hydrologic
2011 Flood: Technical Review of Lake Manitoba, Lake St. Martin and Assiniboine River Water Levels Summary
 2011 Flood: Technical Review of Lake Manitoba, Lake St. Martin and Assiniboine River Water Levels Summary October 2013 Introduction Manitoba experienced unprecedented flooding in 2011. While flooding was
Weather History on the Bishop Paiute Reservation
 Weather History on the Bishop Paiute Reservation -211 For additional information contact Toni Richards, Air Quality Specialist 76 873 784 toni.richards@bishoppaiute.org Updated 2//214 3:14 PM Weather History
February 10, Mr. Jeff Smith, Chairman Imperial Valley Water Authority E County Road 1000 N Easton, IL Dear Chairman Smith:
 February 1, 1 Mr. Jeff Smith, Chairman Imperial Valley Water Authority 8 E County Road 1 N Easton, IL Dear Chairman Smith: The Illinois State Water Survey (ISWS), under contract to the Imperial Valley
Current Climate Trends and Implications
 Current Climate Trends and Implications Dr. Mark Seeley Professor emeritus Department of Soil, Water, and Climate University of Minnesota St Paul, MN 55108 Crop Insurance Conference September 12, 2018
Missouri River Basin Water Management Monthly Update
 Missouri River Basin Water Management Monthly Update Participating Agencies 255 255 255 237 237 237 0 0 0 217 217 217 163 163 163 200 200 200 131 132 122 239 65 53 80 119 27 National Oceanic and Atmospheric
Champaign-Urbana 1998 Annual Weather Summary
 Champaign-Urbana 1998 Annual Weather Summary ILLINOIS STATE WATER SURVEY Audrey Bryan, Weather Observer 2204 Griffith Dr. Champaign, IL 61820 wxobsrvr@sparc.sws.uiuc.edu The development of the El Nìno
Folsom Dam Water Control Manual Update Joint Federal Project, Folsom Dam
 Folsom Dam Water Control Manual Update Joint Federal Project, Folsom Dam Public Workshop May 25, 2016 Sacramento Library Galleria 828 I Street, Sacramento, CA US Army Corps of Engineers BUILDING STRONG
The Climate of Oregon Climate Zone 5 High Plateau
 105 E55 Unbound issue i". 9 13oes not circulate CZe Special Report 917 May 1993 The Climate of Oregon Climate Zone 5 Property of OREGON STATE UNIVERSITY Library Serials Corvallis, OR 97331-4503 Agricultural
Monthly Long Range Weather Commentary Issued: APRIL 1, 2015 Steven A. Root, CCM, President/CEO
 Monthly Long Range Weather Commentary Issued: APRIL 1, 2015 Steven A. Root, CCM, President/CEO sroot@weatherbank.com FEBRUARY 2015 Climate Highlights The Month in Review The February contiguous U.S. temperature
Hydrologic Forecast Centre. Manitoba Infrastructure. Winnipeg, Manitoba FEBRUARY FLOOD OUTLOOK REPORT FOR MANITOBA.
 Page 1 of 20 Hydrologic Forecast Centre Manitoba Infrastructure Winnipeg, Manitoba FEBRUARY FLOOD OUTLOOK REPORT FOR MANITOBA February 28, 2019 Overview The February Outlook Report prepared by the Hydrologic
U.S. ARMY CORPS OF ENGINEERS
 CORPS FACTS Regulating Mississippi River Navigation Pools U.S. ARMY CORPS OF ENGINEERS BUILDING STRONG Historical Background Federal improvements in the interest of navigation on the Mississippi River
The hydrologic service area (HSA) for this office covers Central Kentucky and South Central Indiana.
 for this office covers Central Kentucky and South Central Indiana.") January 2012 February 13, 2012 An X inside this box indicates that no flooding occurred within this hydrologic service area. January 2012 continued the string of wet months this winter. Rainfall was generally
January 2012 February 13, 2012 An X inside this box indicates that no flooding occurred within this hydrologic service area. January 2012 continued the string of wet months this winter. Rainfall was generally
Weather and Climate of the Rogue Valley By Gregory V. Jones, Ph.D., Southern Oregon University
 Weather and Climate of the Rogue Valley By Gregory V. Jones, Ph.D., Southern Oregon University The Rogue Valley region is one of many intermountain valley areas along the west coast of the United States.
Rong Jiang. Map of River. Table of Basic Data. China 14. Serial No. : China-14
 Rong Jiang Map of River Table of Basic Data Name(s): Rong Jiang Location: Guangdong Province, Coastways China Area: 4,408 km 2 Serial No. : China-14 N 23 11' ~ 23 55' E 115 37' ~ 116 38' Length of the
Modeling of peak inflow dates for a snowmelt dominated basin Evan Heisman. CVEN 6833: Advanced Data Analysis Fall 2012 Prof. Balaji Rajagopalan
 Modeling of peak inflow dates for a snowmelt dominated basin Evan Heisman CVEN 6833: Advanced Data Analysis Fall 2012 Prof. Balaji Rajagopalan The Dworshak reservoir, a project operated by the Army Corps
San Francisco Public Utilities Commission Hydrological Conditions Report For March 2016
 San Francisco Public Utilities Commission Hydrological Conditions Report For March 2016 J. Chester, C. Graham, A. Mazurkiewicz, & M. Tsang, April 7, 2016 Snow Surveyor Chris Graham crossing Huckleberry
Souris River Basin Spring Runoff Outlook As of March 1, 2019
 Souris River Basin Spring Runoff Outlook As of March 1, 2019 Prepared by: Flow Forecasting & Operations Planning Water Security Agency Basin Conditions Summer rainfall in 2018 over the Saskatchewan portion
The Colorado Drought of 2002 in Perspective
 The Colorado Drought of 2002 in Perspective Colorado Climate Center Nolan Doesken and Roger Pielke, Sr. Prepared by Tara Green and Odie Bliss http://climate.atmos.colostate.edu Known Characteristics of
Missouri River Basin Water Management Monthly Update
 Missouri River Basin Water Management Monthly Update Participating Agencies 255 255 255 237 237 237 0 0 0 217 217 217 163 163 163 200 200 200 131 132 122 239 65 53 80 119 27 National Oceanic and Atmospheric
The Climate of Bryan County
 The Climate of Bryan County Bryan County is part of the Crosstimbers throughout most of the county. The extreme eastern portions of Bryan County are part of the Cypress Swamp and Forest. Average annual
Southeast US Pilot for Apalachicola- Flint-Chattahoochee River Basin
 National Integrated Drought Information System Southeast US Pilot for Apalachicola- Flint-Chattahoochee River Basin 11 February 2014 Outline Welcome Keith Ingram, Southeast Climate Consortium Current drought
Typical Hydrologic Period Report (Final)
") (DELCORA) (Final) November 2015 (Updated April 2016) CSO Long-Term Control Plant Update REVISION CONTROL REV. NO. DATE ISSUED PREPARED BY DESCRIPTION OF CHANGES 1 4/26/16 Greeley and Hansen Pg. 1-3,
(DELCORA) (Final) November 2015 (Updated April 2016) CSO Long-Term Control Plant Update REVISION CONTROL REV. NO. DATE ISSUED PREPARED BY DESCRIPTION OF CHANGES 1 4/26/16 Greeley and Hansen Pg. 1-3,
The Climate of Payne County
 The Climate of Payne County Payne County is part of the Central Great Plains in the west, encompassing some of the best agricultural land in Oklahoma. Payne County is also part of the Crosstimbers in the
Webinar and Weekly Summary February 15th, 2011
 Webinar and Weekly Summary February 15th, 2011 -Assessment of current water conditions - Precipitation Forecast - Recommendations for Drought Monitor Upper Colorado Normal Precipitation Upper Colorado
The Climate of Haskell County
 The Climate of Haskell County Haskell County is part of the Hardwood Forest. The Hardwood Forest is characterized by its irregular landscape and the largest lake in Oklahoma, Lake Eufaula. Average annual
Fenhe (Fen He) Map of River. Table of Basic Data. China 10
 Map of River. Table of Basic Data. China 10") Fenhe (Fen He) Map of River Table of Basic Data Name(s): Fenhe (in Huanghe River) Location: Shanxi Province, Northern China Area: 39,471 km 2 Origin: Mt. Guancen (2,147 m) Outlet: Huanghe Serial No. :
Fenhe (Fen He) Map of River Table of Basic Data Name(s): Fenhe (in Huanghe River) Location: Shanxi Province, Northern China Area: 39,471 km 2 Origin: Mt. Guancen (2,147 m) Outlet: Huanghe Serial No. :
Technical Notes: Magnitude and Return Period of 2004 Hurricane Rainfall in Florida
 Journal of Floodplain Management Floodplain Management Association NOV. 2005 Vol. 5, No. 1 Glenn Tootle 1 Thomas Mirti 2 Thomas Piechota 3 Technical Notes: Magnitude and Return Period of 2004 Hurricane
The Climate of Seminole County
 The Climate of Seminole County Seminole County is part of the Crosstimbers. This region is a transition region from the Central Great Plains to the more irregular terrain of southeastern Oklahoma. Average
Local Ctimatotogical Data Summary White Hall, Illinois
 SWS Miscellaneous Publication 98-5 STATE OF ILLINOIS DEPARTMENT OF ENERGY AND NATURAL RESOURCES Local Ctimatotogical Data Summary White Hall, Illinois 1901-1990 by Audrey A. Bryan and Wayne Armstrong Illinois
The Climate of Murray County
 The Climate of Murray County Murray County is part of the Crosstimbers. This region is a transition between prairies and the mountains of southeastern Oklahoma. Average annual precipitation ranges from
Upper Missouri River Basin February 2018 Calendar Year Runoff Forecast February 6, 2018
 Upper Missouri River Basin February 2018 Calendar Year Runoff Forecast February 6, 2018 Calendar Year Runoff Forecast Explanation and Purpose of Forecast U.S. Army Corps of Engineers, Northwestern Division
Colorado CoCoRaHS. Colorado CoCoRaHS. Because Every Drop Counts! November 2014 Volume 2, Issue 11
 U.S. PRECIPITATION (% OF AVERAGE) LOOKING BACK AT OCTOBER 2014 October was a fairly dry month for much of the nation with the exception of the Pacific Northwest, portions of New England and the Tennessee
Champaign-Urbana 2000 Annual Weather Summary
 Champaign-Urbana 2000 Annual Weather Summary ILLINOIS STATE WATER SURVEY 2204 Griffith Dr. Champaign, IL 61820 wxobsrvr@sws.uiuc.edu Maria Peters, Weather Observer January: January started on a mild note,
Upper Missouri River Basin December 2017 Calendar Year Runoff Forecast December 5, 2017
 Upper Missouri River Basin December 2017 Calendar Year Runoff Forecast December 5, 2017 Calendar Year Runoff Forecast Explanation and Purpose of Forecast U.S. Army Corps of Engineers, Northwestern Division
Disentangling Impacts of Climate & Land Use Changes on the Quantity & Quality of River Flows in Southern Ontario
 Disentangling Impacts of Climate & Land Use Changes on the Quantity & Quality of River Flows in Southern Ontario by Trevor Dickinson & Ramesh Rudra, Water Resources Engineering University of Guelph Acknowledgements
NRC Workshop Probabilistic Flood Hazard Assessment (PFHA) Jan 29-31, Mel Schaefer Ph.D. P.E. MGS Engineering Consultants, Inc.
 Jan 29-31, Mel Schaefer Ph.D. P.E. MGS Engineering Consultants, Inc.") Stochastic Event Flood Model (SEFM) Stochastic Modeling of Extreme Floods A Hydrological Tool for Analysis of Extreme Floods Mel Schaefer Ph.D. P.E. MGS Engineering Consultants, Inc. Olympia, WA NRC Workshop
Stochastic Event Flood Model (SEFM) Stochastic Modeling of Extreme Floods A Hydrological Tool for Analysis of Extreme Floods Mel Schaefer Ph.D. P.E. MGS Engineering Consultants, Inc. Olympia, WA NRC Workshop
Missouri River Basin Water Management Monthly Update
 Missouri River Basin Water Management Monthly Update Participating Agencies 255 255 255 237 237 237 0 0 0 217 217 217 163 163 163 200 200 200 131 132 122 239 65 53 80 119 27 National Oceanic and Atmospheric
Illinois State Water Survey Division
 Illinois State Water Survey Division SURFACE WATER SECTION SWS Miscellaneous Publication 108 SEDIMENT YIELD AND ACCUMULATION IN THE LOWER CACHE RIVER by Misganaw Demissie Champaign, Illinois June 1989
Jackson County 2013 Weather Data
 Jackson County 2013 Weather Data 61 Years of Weather Data Recorded at the UF/IFAS Marianna North Florida Research and Education Center Doug Mayo Jackson County Extension Director 1952-2008 Rainfall Data
Great Lakes Update. Great Lakes Winter and Spring Summary January June Vol. 187 Great Lakes Update August 2012
 Great Lakes Update Great Lakes Winter and Spring Summary January June 2012 The US Army Corps of Engineers (USACE) Detroit District monitors hydraulic and hydrologic conditions of the Great Lakes. This
Ecological Context - Urban settlements are part of their surrounding ecosystem. Austin
 Ecological Context - Urban settlements are part of their surrounding ecosystem Austin Ecotone Division between West and East Flyway Uplift River Balcones Escarpment Central Texas Climate The principal
Albeni Falls Operations Meeting 2015
 Albeni Falls Operations Meeting 2015 Katherine Rowden NWS Joel Fenolio Corps of Engineers Agenda Introductions Drought-Weather Conditions Free flow operations Review of Clarified Operations Albeni Falls
2012 USACE Drought Actions
 2012 USACE Drought Actions for Inland Waterway Users Board 68 Jim Walker Navigation Branch Chief 19 December 2012 US US Army Corps of of Engineers US Drought Monitor 1 2 3 4 6 5 Impacts: 1. The area in
Three main areas of work:
 Task 2: Climate Information 1 Task 2: Climate Information Three main areas of work: Collect historical and projected weather and climate data Conduct storm surge and wave modeling, sea-level rise (SLR)
Evapo-transpiration Losses Produced by Irrigation in the Snake River Basin, Idaho
 Nov 7, 2007 DRAFT Evapo-transpiration Losses Produced by Irrigation in the Snake River Basin, Idaho Wendell Tangborn and Birbal Rana HyMet Inc. Vashon Island, WA Abstract An estimated 8 MAF (million acre-feet)
Missouri River Basin Water Management Monthly Update
 Missouri River Basin Water Management Monthly Update Participating Agencies 255 255 255 237 237 237 0 0 0 217 217 217 163 163 163 200 200 200 131 132 122 239 65 53 80 119 27 National Oceanic and Atmospheric
Hydrologic Conditions in the Delaware River Basin
 Hydrologic Conditions in the Delaware River Basin April : Flooding in Lambertville, New Jersey Aerial photo used with permission of www.elevated-images.com Annual Report Prepared by Operations Staff June
APPENDIX J MODELING TEHCNICAL MEMORANDUM (RESSIM MODELING)
") APPENDIX J MODELING TEHCNICAL MEMORANDUM (RESSIM MODELING) Technical Memorandum To: Michael J. Preszler, California Water Consulting From: Marieke Armstrong, Mead & Hunt Rahul Ranade, Mead & Hunt Date:
APPENDIX J MODELING TEHCNICAL MEMORANDUM (RESSIM MODELING) Technical Memorandum To: Michael J. Preszler, California Water Consulting From: Marieke Armstrong, Mead & Hunt Rahul Ranade, Mead & Hunt Date:
2016 Fall Conditions Report
 2016 Fall Conditions Report Prepared by: Hydrologic Forecast Centre Date: December 13, 2016 Table of Contents TABLE OF FIGURES... ii EXECUTIVE SUMMARY... 1 BACKGROUND... 5 SUMMER AND FALL PRECIPITATION...
The Climate of Pontotoc County
 The Climate of Pontotoc County Pontotoc County is part of the Crosstimbers. This region is a transition region from the Central Great Plains to the more irregular terrain of southeast Oklahoma. Average
Great Lakes Update. Volume 194: 2015 Annual Summary
 Great Lakes Update Volume 194: 2015 Annual Summary Background The U.S. Army Corps of Engineers (USACE) tracks and forecasts the water levels of each of the Great Lakes. This report summarizes the hydrologic
Monthly Long Range Weather Commentary Issued: SEPTEMBER 19, 2015 Steven A. Root, CCM, Chief Analytics Officer, Sr. VP, sales
 Monthly Long Range Weather Commentary Issued: SEPTEMBER 19, 2015 Steven A. Root, CCM, Chief Analytics Officer, Sr. VP, sales sroot@weatherbank.com AUGUST 2015 Climate Highlights The Month in Review The
Red River Levee Panel
 Red River Levee Panel Mississippi River Commission Monday, August 9, 2017 Red River Levees in LA & AR NONE along TX & OK Boarder Red River Levee Issues Caddo Levee Cherokee Park Authorization Bossier Levee