Global climate model scenarios downscaled for Canada. David Price Northern Forestry Centre, Edmonton CIF e-lecture, 14 March 2012
|
|
|
- Lionel Austin Harvey
- 5 years ago
- Views:
Transcription

1 Global climate model scenarios downscaled for Canada David Price Northern Forestry Centre, Edmonton CIF e-lecture, 14 March 2012
2 Acknowledgements Slide 2 Dan McKenney Marty Siltanen Pia Papadopol Kevin Lawrence John Pedlar Kathy Campbell Yonghe Wang (all the above are with CFS) Mike Hutchinson (Australian National University, Canberra) Linda Joyce (USDA Forest Service, Ft Collins CO) Dave Coulson (USDA Forest Service, Ft Collins CO) Canadian Centre for Climate Modelling and Analysis (CCCMA) US National Center for Atmospheric Research (NCAR) G. Strand (UCAR) Australia: Commonwealth Scientific and Industrial Research Organisation (CSIRO) M. Collier, M. Dix, and T. Hirst (CSIRO Marine and Atmospheric Research Division) Japan: Center for Climate System Research, University of Tokyo, National Institute for Environmental Studies, Frontier Research Center for Global Change Many reviewers in Canada and the USA of two reports published in 2011.
3 Outline Slide 3 Techniques: Downscaling and ANUSPLIN Selecting GCMs and GHG scenarios Results Maps Graphs Sample applications Testing the climate models Biophysical variables and moisture indices Concluding remarks Publications & data distribution
4 Outline Slide 4 Techniques: Downscaling and ANUSPLIN Selecting GCMs and GHG scenarios Results Maps Graphs Sample applications Testing the climate models Biophysical variables and moisture indices Concluding remarks Publications & data distribution

5 What is Downscaling? Slide 5 Downscaling is using coarse spatial resolution data to generate information that is more useful at smaller scales Dynamical: physically consistent simulations of weather at GCM timesteps but at higher spatial resolution. RCMs are the prime example. Statistical: many methods to relate GCM results to observed weather and climate. Diagram from: D. Viner, CRU, University of East Anglia Spatial interpolation: relatively simple and largely empirical, but robust!
6 About ANUSPLIN Slide 6 Mike Hutchinson at Australian National University (Canberra) FORTRAN program for application of multi-variate thin-plate splines (typically up to 4 independent variables, more covariates) Most applications routinely incorporate a spatially (and temporally) varying dependence on elevation A key element is that ANUSPLIN minimizes General Cross Validation (GCV) statistic an objective method to select the best interpolation models, optimize data smoothing, and provide estimates of predictive error Diagnostics help to identify data errors ANUSPLIN continually being updated Check out Numerous applications worldwide, many independent of Hutchinson s group Lots of references available: see CFS GLFC web site for a list and links:
7 Normalizing the GCM data Slide 7 Ideally, we want to capture the climate change signal generated by the GCM, but corrected for the GCM s inaccuracies in representing reality We use the Delta method, based on a reference period for which we also have observed data (e.g., ) Interpolated long-term monthly means (30-year normals ) provide a reference data set with spatial detail We then add the change signal (i.e., the temperature difference) to the observed climate normals for the reference period, interpolated to the same coordinates. Requires processing of GCM data to convert them to deltas WRT the same period in the simulation.


8 Correcting for GCM inacuracy Slide 8 Step 1: Determine mean of observations for reference period.

9 Correcting for GCM inacuracy Slide 9 Step 1: Determine mean of observations for reference period. Step 2: Determine mean of GCM projection for reference period.

10 Correcting for GCM inacuracy Slide 10 Step 1: Determine mean of observations for reference period. Step 2: Determine mean of GCM projection for reference period. Step 3: Calculate delta values by subtracting (or dividing by) the GCM mean from Step 2
 the GCM mean from Step 2 Step 4: Calculate corrected GCM data by adding (or multiplying by) the observed mean")
11 Correcting for GCM inacuracy Slide 11 Step 1: Determine mean of observations for reference period. Step 2: Determine mean of GCM projection for reference period. Step 3: Calculate delta values by subtracting (or dividing by) the GCM mean from Step 2 Step 4: Calculate corrected GCM data by adding (or multiplying by) the observed mean from Step 1
12 Selected GCM Scenarios Slide 12 Projection data generated by GCMs from CCCma (Canada), CSIRO (Australia), NCAR (USA) and NIES (Japan). [Data also available from IPCC 3 rd Assessment (TAR, 2001) (CCCma, CSIRO, Hadley Centre (UK) and NCAR.] SRES A2: increasing population, little technological change, greater deforestation, pollution and CO 2 emissions SRES B1: as A2, but rapid global shift towards resource-efficient technologies and reduced GHG emissions SRES B2: as B1, but more local efforts to increase resource efficiency and reduce emissions SRES A1B: higher population growth than A2, with balance of energy from fossil and renewable sources Monthly time series extending from 1961 to 2100, gridded to 5 arcminute (1/12 degree lat/lon) resolution about 10 km. 20 data sets in total. Lots of ways to use these data! Nakićenović et al IPCC Special Report on Emissions Scenarios.
13 IPCC AR4 GHG Scenarios Slide 13

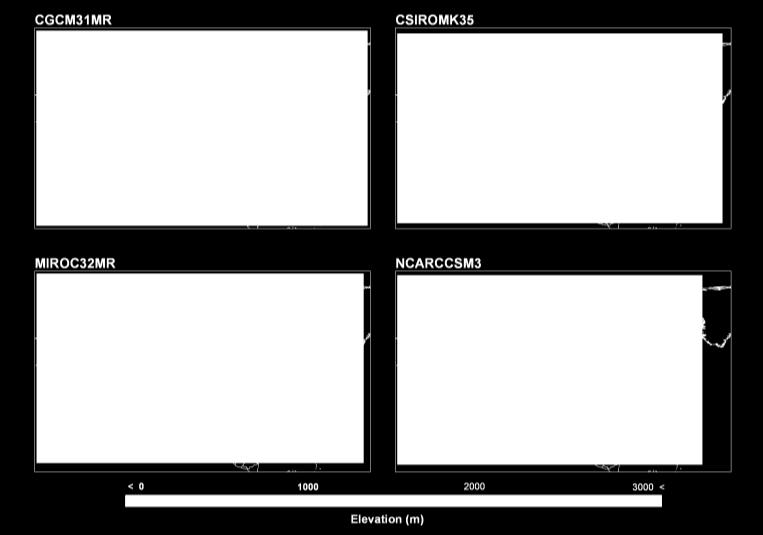
14 GCM spatial resolutions vary Slide 14
15 GCM input data sets Slide 15 GCM 1 IPCC AR4 scenario(s) Monthly variable(s) 2 Source 3 Time period CGCM31MR 20C3M, A1B, A2, B1 pr, tas, rsds, hur, huss, psl, uas, vas CMIP CGCM31MR 20C3M, A1B, A2, B1 tasmin, tasmax CCCma CSIROMK35 20C3M, A1B, A2, B1 pr, tas, tasmin, tasmax, rsds, psl, uas, vas, hur, huss (except B1) CMIP CSIROMK35 B1 huss CSIRO MIROC32MR 20C3M, A1B, A2, B1 pr, tas, tasmin, tasmax, rsds, hur, huss, psl, uas, vas CMIP NCARCCSM3 20C3M, A1B, B1 pr, tas, tasmin, tasmax, rsds, hur, huss, psl, uas, vas CMIP NCARCCSM3 A2 pr, tas, tasmin, tasmax, rsds, hur, huss, psl, uas, vas ESG
16 Outline Slide 16 Techniques: Downscaling and ANUSPLIN Selecting GCMs and GHG scenarios Results Maps Graphs Applications Testing the climate models Biophysical variables and moisture indices Concluding remarks Publications & data distribution
17 Projected changes in T max Slide 17 These maps show absolute temperatures. It is very hard to see the changes over 100+ simulated years!

18 Projected changes in Precip Slide 18 These maps show absolute total annual precipitation. Again, it is very hard to see the changes over 100+ simulated years! It would be just as hard to see differences among different GCMs when forced by the same GHG emissions scenario.


19 Changes in annual means (SRES A2, 2080s) Slide 19 CGCM3.1 - Canada CSIRO Mk Australia MIROC3.2 - Japan NCAR CCSM3 - USA Temperature Increase ( C) Precipitation Change (ratio)
20 Analysis by Canadian ecozones Slide 20
 Slide 21 Temperature ( C) (Historical data")
21 Annual Mean Daily T min Prairies subhumid ecozone (Parkland) Slide 21 Temperature ( C) (Historical data ~45 years)

22 Winter (DJF) Mean Daily T min Boreal Plains ecozone Slide 22 Temperature ( C)

23 Summer (JJA) Mean Daily T max Atlantic Maritime ecozone Slide 23 Temperature ( C)
 (No historical")
24 Summer (JJA) Mean Vapour Pressure Atlantic Maritime ecozone Slide 24 Vapour pressure (kpa) (No historical record)

25 Fall (SON) Total Precipitation Mixedwood Plains ecozone Slide 25 Total Precipitation (mm)

26 Winter (DJF) Mean Daily Solar Radn Boreal Shield W ecozone Slide 26 MJ m -2 day -1 (No historical record) M
27 Winter (DJF) Mean Daily Solar Radn Boreal Shield W ecozone Slide 27 MJ m -2 day year moving averages
28 Which GCM scenarios are best for a regional study? It depends. Slide 28 Pacific Maritime Montane Cordillera Atlantic Maritime Prairies Aspen parkland Mixedwood Plains
29 Which GCM scenarios are best for a regional study? It depends. Slide 29 Taiga Plains Boreal Shield W Boreal Shield E Boreal Cordillera Boreal Plains Hudson Plains

30 IPCC AR4 GHG Scenarios Slide 30
 Taiga Plains Aspen Parkland Hudson Plains Boreal Plains")
31 Temperature trends by ecozone 1960 to 2100 Slide 31 Annual Mean Daily Tmin ( C) Taiga Plains Aspen Parkland Hudson Plains Boreal Plains Shield E
32 Temperature trends by ecozone 1960 to 2100 Slide 32 Annual Mean Daily Tmin ( C) Taiga Plains Aspen Parkland Hudson Plains Boreal Plains Shield E


33 Precipitation trends by ecozone 1960 to 2100 Slide 33 Annual Total Precipitation (mm) Taiga Plains Aspen Parkland Hudson Plains Boreal Plains Shield E
34 Outline Slide 34 Techniques: Downscaling and ANUSPLIN Selecting GCMs and GHG scenarios Results Maps Graphs Applications Testing the climate models Biophysical variables and moisture indices Concluding remarks Publications & data distribution

35 Do GCMs really work? Slide 35 Data from: Meehl et al J. Clim. 17: Jones and Moberg J. Clim. 16:
 Underestimating observed Tmin it was warmer in 1990-2005 than the GCMs predicted!")
36 Slide 36 GCM validation (15 years of observed data vs. simulated) Underestimating observed Tmin it was warmer in than the GCMs predicted! Overestimating Tmax Ensemble_a2_MaxT_July Ensemble_a2_MinT_January
 / (7) 4")
37 Biophysical variables Slide 37 No. Variable Description 1 Annual Mean Temperature Annual mean of monthly mean temperatures 2 Mean Diurnal Range Annual mean of monthly mean daily temperature ranges 3 Isothermality (2) / (7) 4 Temperature Seasonality Standard deviation of monthly mean temperature estimates expressed as a percentage of their mean 5 Max Temperature of Warmest Period Highest monthly maximum temperature 6 Min Temperature of Coldest Period Lowest monthly minimum temperature 7 Temperature Annual Range (5) (6) 8 Mean Temperature of Wettest Mean temperature of three wettest months Quarter 9 Mean Temperature of Driest Quarter Mean temperature of three driest months 10 Mean Temperature of Warmest Mean temperature of three warmest months Quarter 11 Mean Temperature of Coldest Mean temperature of three coldest months Quarter 12 Annual Precipitation Sum of monthly precipitation values 13 Precipitation of Wettest Period Precipitation of the wettest month 14 Precipitation of Driest Period Precipitation of the driest month 15 Precipitation Seasonality Standard deviation of monthly precipitation estimates expressed as a percentage of their mean 16 Precipitation of Wettest Quarter Total precipitation of three wettest months 17 Precipitation of Driest Quarter Total precipitation of three driest months 18 Precipitation of Warmest Quarter Total precipitation of three warmest months 19 Precipitation of Coldest Quarter Total precipitation of three coldest months 20 Start of Growing Season Date when daily mean temperature first meets or exceeds 5 C for five consecutive days in spring 21 End of Growing Season Date when daily minimum temperature first falls below -2 C after 1 August 22 Growing Season Length (21) (20) 23 Total Precipitation for Period 1 Total precipitation of three months prior to (20) 24 Total Precipitation for Period 3 Total precipitation during (22) 25 Growing Degree Days for Period 3 Total degree days during (22), accumulated for all days where mean temperature exceeds 5 C. 26 Annual Minimum Temperature Annual mean of monthly minimum temperatures 27 Annual Maximum Temperature Annual mean of monthly maximum temperatures 28 Mean Temperature for Period 3 Mean temperature during (22) 29 Temperature Range for Period 3 Highest minus lowest temperature during (22)
38 Projecting Future Drought Slide 38 Range of approaches to calculating balance of annual precipitation and evapotranspiration, the latter a function of temperature and radiation. Climate Moisture Index (Hogg 1994, 1997) PDSI (Palmer 1965) Considerable interest in projecting how climate change will affect water supplies, availability, and hence ecosystems and communities E.g., Dai (2011) We are investigating implications for Canadian forest regions using our own data

39 The future global context? Slide 39 Dai WIRES Climate Change 2: doi: /wcc yr average Palmer Drought Severity Index from IPCC AR4 (A1B scenario, 22 models,)

40 Projections of Hogg CMI Slide SRES A2 averages of four GCMs Maps prepared by Y. Wang, NRCan
41 Outline Slide 41 Techniques: Downscaling and ANUSPLIN Selecting GCMs and GHG scenarios Results Maps Graphs Applications Testing the climate models Biophysical variables and moisture indices Concluding remarks Publications & data distribution
42 Data distribution - GLFC Slide 42


43 Data distribution - GLFC Slide 43
44 Concluding Remarks Slide 44 We have created a suite of several nationalscale climate scenarios which allow us to explore a range of potential impacts We chose a simple downscaling approach that is easy to understand and provides robust data for application over large regions It is not clear that other methods give results that are more meaningful, especially considering all the assumptions and errors in current GCMs. (Not suggesting there is anything wrong with other downscaling methods!) Data are freely available to anyone on request!


45 Publications Slide
Authors. Keywords: Climate scenario, downscaling, PRISM, natural renewable resource assessments, RPA Scenarios.
 Joyce, Linda A.; Price, David T.; Coulson, David P.; McKenney, Daniel W.; Siltanen, R. Martin; Papadopol, Pia; Lawrence, Kevin. 2014. Projecting climate change in the United States: A technical document
Climate Change Scenarios Dr. Elaine Barrow Canadian Climate Impacts Scenarios (CCIS) Project
 Project") Climate Change Scenarios Dr. Elaine Barrow Canadian Climate Impacts Scenarios (CCIS) Project What is a scenario? a coherent, internally consistent and plausible description of a possible future state of
Climate Change Scenarios Dr. Elaine Barrow Canadian Climate Impacts Scenarios (CCIS) Project What is a scenario? a coherent, internally consistent and plausible description of a possible future state of
Climate Summary for the Northern Rockies Adaptation Partnership
 Climate Summary for the Northern Rockies Adaptation Partnership Compiled by: Linda Joyce 1, Marian Talbert 2, Darrin Sharp 3, John Stevenson 4 and Jeff Morisette 2 1 USFS Rocky Mountain Research Station
Southern New England s Changing Climate. Raymond S. Bradley and Liang Ning Northeast Climate Science Center University of Massachusetts, Amherst
 Southern New England s Changing Climate Raymond S. Bradley and Liang Ning Northeast Climate Science Center University of Massachusetts, Amherst Historical perspective (instrumental data) IPCC scenarios
Climate projections for the Chesapeake Bay and Watershed based on Multivariate Adaptive Constructed Analogs (MACA)
") Climate projections for the Chesapeake Bay and Watershed based on Multivariate Adaptive Constructed Analogs (MACA) Maria Herrmann and Raymond Najjar The Pennsylvania State University Chesapeake Hypoxia
Climate projections for the Chesapeake Bay and Watershed based on Multivariate Adaptive Constructed Analogs (MACA) Maria Herrmann and Raymond Najjar The Pennsylvania State University Chesapeake Hypoxia
 http://www.ukm.edu.my/seaclid-cordex/ Addressing future climate change information gaps and data needs in the Southeast Asia region through the Southeast Asia Regional Climate Downscaling (SEACLID)/CORDEX
Projected Changes in Climate for Alberta and Forest Tree Improvement Program Regions
 Projected Changes in Climate for Alberta and Forest Tree Improvement Program Regions Laura K. Gray and Andreas Hamann Department of Renewable Resources University of Alberta, Edmonton June 2015 Tree Species
Fine-scale climate projections for Utah from statistical downscaling of global climate models
 Fine-scale climate projections for Utah from statistical downscaling of global climate models Thomas Reichler Department of Atmospheric Sciences, U. of Utah thomas.reichler@utah.edu Three questions A.
Evaluation of ClimateBC V5
 1 Evaluation of ClimateBC Dave Spittlehouse, BC Min Forests, Lands and Natural Resource Operations, Victoria, BC & Tongli Wang, Centre for Forest Conservation Genetics, Department of Forest and Conservation
Mozambique. General Climate. UNDP Climate Change Country Profiles. C. McSweeney 1, M. New 1,2 and G. Lizcano 1
 UNDP Climate Change Country Profiles Mozambique C. McSweeney 1, M. New 1,2 and G. Lizcano 1 1. School of Geography and Environment, University of Oxford. 2.Tyndall Centre for Climate Change Research http://country-profiles.geog.ox.ac.uk
Climate Futures for Eastern Melbourne. Data provided for the Eastern Alliance for Greenhouse Action CSIRO July 2010 (Updated 2013)
") Data provided for the Eastern Alliance for Greenhouse Action CSIRO July 2010 (Updated 2013) 2030 A1B Climate Futures for the 5 grid centred on 37.5 S 146.5 E the 2050s Climate Futures for the 5 grid centred
Data provided for the Eastern Alliance for Greenhouse Action CSIRO July 2010 (Updated 2013) 2030 A1B Climate Futures for the 5 grid centred on 37.5 S 146.5 E the 2050s Climate Futures for the 5 grid centred
technological change and economic growth more fragmented; slower, higher population growth middle emissions path
 TACCIMO Climate Report: Flathead National Forest 08-28-2013 Table of Contents Introduction Historic National Regional Forest Metadata and Interpretive Guidance Page 1 2 3 6 9 12 Introduction The TACCIMO
The CLIMGEN Model. More details can be found at and in Mitchell et al. (2004).
.") Provided by Tim Osborn Climatic Research Unit School of Environmental Sciences University of East Anglia Norwich NR4 7TJ, UK t.osborn@uea.ac.uk The CLIMGEN Model CLIMGEN currently produces 8 climate variables
Provided by Tim Osborn Climatic Research Unit School of Environmental Sciences University of East Anglia Norwich NR4 7TJ, UK t.osborn@uea.ac.uk The CLIMGEN Model CLIMGEN currently produces 8 climate variables
Climate Risk Profile for Samoa
 Climate Risk Profile for Samoa Report Prepared by Wairarapa J. Young Samoa Meteorology Division March, 27 Summary The likelihood (i.e. probability) components of climate-related risks in Samoa are evaluated
Antigua and Barbuda. General Climate. Recent Climate Trends. UNDP Climate Change Country Profiles. Temperature
 UNDP Climate Change Country Profiles Antigua and Barbuda C. McSweeney 1, M. New 1,2 and G. Lizcano 1 1. School of Geography and Environment, University of Oxford. 2. Tyndall Centre for Climate Change Research
CLIMATE SCENARIOS FOR ALBERTA
 CLIMATE SCENARIOS FOR ALBERTA A Report Prepared for the Prairie Adaptation Research Collaborative (PARC) in co-operation with Alberta Environment Elaine Barrow 1 & Ge Yu 2 May 2005 1 Climate Research Services
Training: Climate Change Scenarios for PEI. Training Session April Neil Comer Research Climatologist
 Training: Climate Change Scenarios for PEI Training Session April 16 2012 Neil Comer Research Climatologist Considerations: Which Models? Which Scenarios?? How do I get information for my location? Uncertainty
St Lucia. General Climate. Recent Climate Trends. UNDP Climate Change Country Profiles. Temperature. Precipitation
 UNDP Climate Change Country Profiles St Lucia C. McSweeney 1, M. New 1,2 and G. Lizcano 1 1. School of Geography and Environment, University of Oxford. 2. Tyndall Centre for Climate Change Research http://country-profiles.geog.ox.ac.uk
Fifth ICTP Workshop on the Theory and Use of Regional Climate Models. 31 May - 11 June, 2010
 2148-9 Fifth ICTP Workshop on the Theory and Use of Regional Climate Models 31 May - 11 June, 2010 Extreme precipitation by RegCM3 and other RCMs in NARCCAP William J. Gutowski Iowa State University Ames,
Changing Hydrology under a Changing Climate for a Coastal Plain Watershed
 Changing Hydrology under a Changing Climate for a Coastal Plain Watershed David Bosch USDA-ARS, Tifton, GA Jeff Arnold ARS Temple, TX and Peter Allen Baylor University, TX SEWRU Objectives 1. Project changes
Urban Water Security Research Alliance
 Urban Water Security Research Alliance Drought Frequency and Duration Projections for South East Queensland David Kent, Wenju Cai, Kim Nguyen Climate and Water 29 September 2010 Outline Previous projections
Appendix E. OURANOS Climate Change Summary Report
 Appendix E OURANOS Climate Change Summary Report Production of Climate Scenarios for Pilot Project and Case Studies The protocol developed for assessing the vulnerability of infrastructure requires data
Downscaling ability of the HadRM3P model over North America
 Downscaling ability of the HadRM3P model over North America Wilfran Moufouma-Okia and Richard Jones Crown copyright Met Office Acknowledgments Special thanks to the Met Office Hadley Centre staff in the
Cuba. General Climate. Recent Climate Trends. UNDP Climate Change Country Profiles. Temperature. C. McSweeney 1, M. New 1,2 and G.
 UNDP Climate Change Country Profiles Cuba C. McSweeney 1, M. New 1,2 and G. Lizcano 1 1. School of Geography and Environment, University of Oxford. 2. Tyndall Centre for Climate Change Research http://country-profiles.geog.ox.ac.uk
Will a warmer world change Queensland s rainfall?
 Will a warmer world change Queensland s rainfall? Nicholas P. Klingaman National Centre for Atmospheric Science-Climate Walker Institute for Climate System Research University of Reading The Walker-QCCCE
Climate change projections for Ontario: an updated synthesis for policymakers and planners
 Ministry of Natural Resources and Forestry Climate change projections for Ontario: an updated synthesis for policymakers and planners Shannon Fera and Adam Hogg Ontario Ministry of Natural Resources and
Suriname. General Climate. Recent Climate Trends. UNDP Climate Change Country Profiles. Temperature. C. McSweeney 1, M. New 1,2 and G.
 UNDP Climate Change Country Profiles Suriname C. McSweeney 1, M. New 1,2 and G. Lizcano 1 1. School of Geography and Environment, University of Oxford. 2. Tyndall Centre for Climate Change Research http://country-profiles.geog.ox.ac.uk
Multi-model approach for projecting future climate change conditions in Central Vietnam
 2011/03/03 at the ICSS-Asia 2011 conference Multi-model approach for projecting future climate change conditions in Central Vietnam Thanh NGO-DUC, Van Tan PHAN, Trung NGUYEN QUANG Department of Meteorology
Zambia. General Climate. Recent Climate Trends. UNDP Climate Change Country Profiles. Temperature. C. McSweeney 1, M. New 1,2 and G.
 UNDP Climate Change Country Profiles Zambia C. McSweeney 1, M. New 1,2 and G. Lizcano 1 1. School of Geography and Environment, University of Oxford. 2. Tyndall Centre for Climate Change Research http://country-profiles.geog.ox.ac.uk
Andrey Martynov 1, René Laprise 1, Laxmi Sushama 1, Katja Winger 1, Bernard Dugas 2. Université du Québec à Montréal 2
 CMOS-2012, Montreal, 31 May 2012 Reanalysis-driven climate simulation over CORDEX North America domain using the Canadian Regional Climate Model, version 5: model performance evaluation Andrey Martynov
Water Balance in the Murray-Darling Basin and the recent drought as modelled with WRF
 18 th World IMACS / MODSIM Congress, Cairns, Australia 13-17 July 2009 http://mssanz.org.au/modsim09 Water Balance in the Murray-Darling Basin and the recent drought as modelled with WRF Evans, J.P. Climate
UPPLEMENT A COMPARISON OF THE EARLY TWENTY-FIRST CENTURY DROUGHT IN THE UNITED STATES TO THE 1930S AND 1950S DROUGHT EPISODES
 UPPLEMENT A COMPARISON OF THE EARLY TWENTY-FIRST CENTURY DROUGHT IN THE UNITED STATES TO THE 1930S AND 1950S DROUGHT EPISODES Richard R. Heim Jr. This document is a supplement to A Comparison of the Early
Using Multivariate Adaptive Constructed Analogs (MACA) data product for climate projections
 data product for climate projections") Using Multivariate Adaptive Constructed Analogs (MACA) data product for climate projections Maria Herrmann and Ray Najjar Chesapeake Hypoxia Analysis and Modeling Program (CHAMP) Conference Call 2017-04-21
Using Multivariate Adaptive Constructed Analogs (MACA) data product for climate projections Maria Herrmann and Ray Najjar Chesapeake Hypoxia Analysis and Modeling Program (CHAMP) Conference Call 2017-04-21
chapter 3. Climate Change Summary
 chapter 3. Climate Change Summary 27 Chapter 3. Climate Change Summary Steve McNulty, Jennifer Moore Myers, Peter Caldwell, and Ge Sun 1 Key FindiNGS Since 1960, all but two southern capital cities (Montgomery,
RACER-WWF Report on Climate Change Scenarios
 RACER-WWF Report on Climate Change Scenarios Author: Institution: David Huard Ouranos Inc. Date: May 2010 Introduction The present document provides a brief overview of the work
Annex I to Target Area Assessments
 Baltic Challenges and Chances for local and regional development generated by Climate Change Annex I to Target Area Assessments Climate Change Support Material (Climate Change Scenarios) SWEDEN September
Cape Verde. General Climate. Recent Climate. UNDP Climate Change Country Profiles. Temperature. Precipitation
 UNDP Climate Change Country Profiles C. McSweeney 1, M. New 1,2 and G. Lizcano 1 1. School of Geography and Environment, University of Oxford. 2. Tyndall Centre for Climate Change Research http://country-profiles.geog.ox.ac.uk
Projected Impacts of Climate Change in Southern California and the Western U.S.
 Projected Impacts of Climate Change in Southern California and the Western U.S. Sam Iacobellis and Dan Cayan Scripps Institution of Oceanography University of California, San Diego Sponsors: NOAA RISA
DROUGHT, HEAVY PRECIPITATION AND CLIMATE. Ronald Stewart University of Manitoba
 DROUGHT, HEAVY PRECIPITATION AND CLIMATE Ronald Stewart University of Manitoba 2000-2009 TOP WEATHER STORIES 1.Vanishing Arctic ice in 2007. 2. B.C.'s year of disastrous weather -- fires, floods and freezes
The North American Regional Climate Change Assessment Program (NARCCAP) Raymond W. Arritt for the NARCCAP Team Iowa State University, Ames, Iowa USA
 Raymond W. Arritt for the NARCCAP Team Iowa State University, Ames, Iowa USA") The North American Regional Climate Change Assessment Program (NARCCAP) Raymond W. Arritt for the NARCCAP Team Iowa State University, Ames, Iowa USA NARCCAP Participants Raymond Arritt, David Flory, William
The North American Regional Climate Change Assessment Program (NARCCAP) Raymond W. Arritt for the NARCCAP Team Iowa State University, Ames, Iowa USA NARCCAP Participants Raymond Arritt, David Flory, William
Julie A. Winkler. Raymond W. Arritt. Sara C. Pryor. Michigan State University. Iowa State University. Indiana University
 Julie A. Winkler Michigan State University Raymond W. Arritt Iowa State University Sara C. Pryor Indiana University Summarize by climate variable potential future changes in the Midwest as synthesized
NADM, NACEM, and Opportunities for Future Collaboration
 NADM, NACEM, and Opportunities for Future Collaboration Richard R. Heim Jr. NOAA/NESDIS/National Climatic Data Center Asheville, North Carolina, U.S.A. 4th Annual DRI Workshop 26-28 January 2009, Regina,
METADATA MANAGEMENT TOOL (LIO)
") METADATA MANAGEMENT TOOL (LIO) Climate data - High resolution projections Metadata Metadata (XML) Title Climate data - High resolution projections Date Date type Creation Date Date type Abstract Publication
METADATA MANAGEMENT TOOL (LIO) Climate data - High resolution projections Metadata Metadata (XML) Title Climate data - High resolution projections Date Date type Creation Date Date type Abstract Publication
ClimateBC version history
 ClimateBC version history ClimateBC v5.60 (August 31, 2018) Improvements Historical monthly data from the Climate Research Unit (CRU ts4.01) for the years 1999-2016 have been replaced by our newly developed
Confronting Climate Change in the Great Lakes Region. Technical Appendix Climate Change Projections CLIMATE MODELS
 Confronting Climate Change in the Great Lakes Region Technical Appendix Climate Change Projections CLIMATE MODELS Large, three-dimensional, coupled atmosphere-ocean General Circulation Models (GCMs) of
Climate Projections and Energy Security
 NOAA Research Earth System Research Laboratory Physical Sciences Division Climate Projections and Energy Security Andy Hoell and Jim Wilczak Research Meteorologists, Physical Sciences Division 7 June 2016
North American Regional Climate Change Assessment Program
 North American Regional Climate Change Assessment Program Toni Rosati IMAGe NCAR narccap@ucar.edu Outline Basic concepts of numerical climate modeling NetCDF data format overview NARCCAP project NARCCAP
Grenada. General Climate. Recent Climate Trends. UNDP Climate Change Country Profiles. Temperature. Precipitation
 UNDP Climate Change Country Profiles C. McSweeney 1, M. New 1,2 and G. Lizcano 1 1. School of Geography and Environment, University of Oxford. 2. Tyndall Centre for Climate Change Research http://country-profiles.geog.ox.ac.uk
Hydroclimate Data for the Prairies An Analysis of Possibilities. Elaine Barrow (PhD) May 2010
 May 2010") Hydroclimate Data for the Prairies An Analysis of Possibilities Elaine Barrow (PhD) May 2010 Table of Contents Summary... 3 Introduction... 4 Data Sources... 4 Moisture deficits... 9 1. Thornthwaite method...
Hydroclimate Data for the Prairies An Analysis of Possibilities Elaine Barrow (PhD) May 2010 Table of Contents Summary... 3 Introduction... 4 Data Sources... 4 Moisture deficits... 9 1. Thornthwaite method...
Climate Dataset: Aitik Closure Project. November 28 th & 29 th, 2018
 1 Climate Dataset: Aitik Closure Project November 28 th & 29 th, 2018 Climate Dataset: Aitik Closure Project 2 Early in the Closure Project, consensus was reached to assemble a long-term daily climate
Climate Change RMJOC Study Summary
 Climate Change RMJOC Study Summary Erik Pytlak Weather and Streamflow Forecasting Bonneville Power Administration Portland, OR IPCC: International Panel on Climate Change Established by the United Nations
Northern Rockies Adaptation Partnership: Climate Projections
 Northern Rockies Adaptation Partnership: Climate Projections Contents Observed and Projected Climate for the NRAP Region... 2 Observed and Projected Climate for the NRAP Central Subregion... 8 Observed
Climate Data: Diagnosis, Prediction and Projection
 Climate Data: Diagnosis, Prediction and Projection Paul Bowyer (paul.bowyer@hzg.de) Climate Service Center Germany (GERICS) Boram Lee (blee@wmo.int) World Meteorological Organization (WMO), World Climate
Climate Downscaling 201
 Climate Downscaling 201 (with applications to Florida Precipitation) Michael E. Mann Departments of Meteorology & Geosciences; Earth & Environmental Systems Institute Penn State University USGS-FAU Precipitation
High resolution rainfall projections for the Greater Sydney Region
 20th International Congress on Modelling and Simulation, Adelaide, Australia, 1 6 December 2013 www.mssanz.org.au/modsim2013 High resolution rainfall projections for the Greater Sydney Region F. Ji a,
Historical and Projected Future Climate Changes in the Great Lakes Region
 Historical and Projected Future Climate Changes in the Great Lakes Region B.J. Baule Great Lakes Integrates Sciences + Assessments University of Michigan Jeffrey A. Andresen Dept. of Geography Michigan
Modelling Fuel Moisture Under Climate Change
 18 th World IMACS / MODSIM Congress, Cairns, Australia 13-17 July 2009 http://mssanz.org.au/modsim09 Abstract: Modelling Fuel Moisture Under Climate Change Matthews, S. 1,2, Nguyen, K. 3, and McGregor,
How Will Low Clouds Respond to Global Warming?
 How Will Low Clouds Respond to Global Warming? By Axel Lauer & Kevin Hamilton CCSM3 UKMO HadCM3 UKMO HadGEM1 iram 2 ECHAM5/MPI OM 3 MIROC3.2(hires) 25 IPSL CM4 5 INM CM3. 4 FGOALS g1. 7 GISS ER 6 GISS
Three main areas of work:
 Task 2: Climate Information 1 Task 2: Climate Information Three main areas of work: Collect historical and projected weather and climate data Conduct storm surge and wave modeling, sea-level rise (SLR)
Impacts of Climate Change on Autumn North Atlantic Wave Climate
 Impacts of Climate Change on Autumn North Atlantic Wave Climate Will Perrie, Lanli Guo, Zhenxia Long, Bash Toulany Fisheries and Oceans Canada, Bedford Institute of Oceanography, Dartmouth, NS Abstract
Uncertainty and regional climate experiments
 Uncertainty and regional climate experiments Stephan R. Sain Geophysical Statistics Project Institute for Mathematics Applied to Geosciences National Center for Atmospheric Research Boulder, CO Linda Mearns,
Twenty-first-century projections of North Atlantic tropical storms from CMIP5 models
 SUPPLEMENTARY INFORMATION DOI: 10.1038/NCLIMATE1530 Twenty-first-century projections of North Atlantic tropical storms from CMIP5 models SUPPLEMENTARY FIGURE 1. Annual tropical Atlantic SST anomalies (top
SEASONAL VARIABILITY AND PERSISTENCE IN TEMPERATURE SCENARIOS FOR ICELAND
 SEASONAL VARIABILITY AND PERSISTENCE IN TEMPERATURE SCENARIOS FOR ICELAND Haraldur Ólafsson 1,2 and Ólafur Rögnvaldsson 2,3 1 University of Iceland, Reykjavík, Iceland 2 Bergen School of Meteorology, Geophysical
Sierra Weather and Climate Update
 Sierra Weather and Climate Update 2014-15 Kelly Redmond Western Regional Climate Center Desert Research Institute Reno Nevada Yosemite Hydroclimate Workshop Yosemite Valley, 2015 October 8-9 Percent of
Malawi. General Climate. UNDP Climate Change Country Profiles. C. McSweeney 1, M. New 1,2 and G. Lizcano 1
 UNDP Climate Change Country Profiles Malawi C. McSweeney 1, M. New 1,2 and G. Lizcano 1 1. School of Geography and Environment, University of Oxford. 2. Tyndall Centre for Climate Change Research http://country-profiles.geog.ox.ac.uk
THE CANADIAN CENTRE FOR CLIMATE MODELLING AND ANALYSIS
 THE CANADIAN CENTRE FOR CLIMATE MODELLING AND ANALYSIS As Canada s climate changes, and weather patterns shift, Canadian climate models provide guidance in an uncertain future. CANADA S CLIMATE IS CHANGING
Snow occurrence changes over the central and eastern United States under future. warming scenarios
 Snow occurrence changes over the central and eastern United States under future warming scenarios Liang Ning 1,2,3* and Raymond S. Bradley 2 1 Key Laboratory of Virtual Geographic Environment of Ministry
Climate variability and changes at the regional scale: what we can learn from various downscaling approaches
 Climate variability and changes at the regional scale: what we can learn from various downscaling approaches by Philippe Gachon 1,2,3 Milka Radojevic 1,2, Hyung Il Eum 3, René Laprise 3 & Van Thanh Van
The PRECIS Regional Climate Model
 The PRECIS Regional Climate Model General overview (1) The regional climate model (RCM) within PRECIS is a model of the atmosphere and land surface, of limited area and high resolution and locatable over
7.7 HIGH RESOLUTION FUTURE SCENARIO CLIMATE DATA FOR NORTH AMERICA
 7.7 HIGH RESOLUTION FUTURE SCENARIO CLIMATE DATA FOR NORTH AMERICA David T. Price 1, D. W. McKenney 2, P. Papadopol 2, T. Logan l, M. F. Hutchinson 3 1 Canadian Forest Service, Edmonton, Alberta dprice@nrcan.gc.ca;
Yuqing Wang. International Pacific Research Center and Department of Meteorology University of Hawaii, Honolulu, HI 96822
 A Regional Atmospheric Inter-Model Evaluation Project (RAIMEP) with the Focus on Sub-daily Variation of Clouds and Precipitation Yuqing Wang International Pacific Research Center and Department of Meteorology
National Cheng Kung University, Taiwan. downscaling. Speaker: Pao-Shan Yu Co-authors: Dr Shien-Tsung Chen & Mr. Chin-yYuan Lin
 Department of Hydraulic & Ocean Engineering, National Cheng Kung University, Taiwan Impact of stochastic weather generator characteristic on daily precipitation downscaling Speaker: Pao-Shan Yu Co-authors:
Chiang Rai Province CC Threat overview AAS1109 Mekong ARCC
 Chiang Rai Province CC Threat overview AAS1109 Mekong ARCC This threat overview relies on projections of future climate change in the Mekong Basin for the period 2045-2069 compared to a baseline of 1980-2005.
High Resolution Indicators for Local Drought Monitoring
 High Resolution Indicators for Local Drought Monitoring REBECCA CUMBIE, STATE CLIMATE OFFICE OF NC, NCSU Monitoring Drought Multiple indicators, multiple sources Local detail important 1 Point-Based Climate-Division
Karonga Climate Profile: Full Technical Version
 Karonga Climate Profile: Full Technical Version Prepared by: University of Cape Town November 2017 For enquiries regarding this Climate Profile, please contact Lisa van Aardenne (lisa@csag.uct.ac.za) or
Climate Change Modelling: BASICS AND CASE STUDIES
 Climate Change Modelling: BASICS AND CASE STUDIES TERI-APN s Training program on Urban Climate Change Resilience 22 nd 23 rd January, 2014 Goa Saurabh Bhardwaj Associate Fellow Earth Science & Climate
Declining availability of outdoor skating in Canada
 Declining availability of outdoor skating in Canada Jeremy R. Brammer* a, Jason Samson b, and Murray M. Humphries a a Department of Natural Resource Sciences, McGill University, Montreal, Canada b Ministère
SUPPLEMENTARY INFORMATION
 doi:10.1038/nature12310 We present here two additional Tables (Table SI-1, 2) and eight further Figures (Figures SI-1 to SI-8) to provide extra background information to the main figures of the paper.
Urban Water Security Research Alliance Technical Report No. 79
 Future Climates of South East Queensland: Results from High-Resolution Climate Modelling Kim C. Nguyen and John L. McGregor August 2012 Urban Water Security Research Alliance Technical Report No. 79 Urban
Université du Québec à Montréal!
 Université du Québec à Montréal! PhD candidate: Alejandro Di Luca! Director: René Laprise! Co director: Ramon de Elia! May 28th 2009! !! Wide range of atmospheric phenomena...!! Important dependence between
Experiments with Statistical Downscaling of Precipitation for South Florida Region: Issues & Observations
 Experiments with Statistical Downscaling of Precipitation for South Florida Region: Issues & Observations Ramesh S. V. Teegavarapu Aneesh Goly Hydrosystems Research Laboratory (HRL) Department of Civil,
Historical and Projected Future Climatic Trends in the Great Lakes Region
 Historical and Projected Future Climatic Trends in the Great Lakes Region Jeffrey A. Andresen Dept. of Geography, Environment, and Spatial Sciences Michigan State University Flooding along I-696 Warren,
Indices of droughts (SPI & PDSI) over Canada as simulated by a statistical downscaling model: current and future periods
 over Canada as simulated by a statistical downscaling model: current and future periods") Indices of droughts (SPI & PDSI) over Canada as simulated by a statistical downscaling model: current and future periods Philippe Gachon 1, Rabah Aider 1 & Grace Koshida Adaptation & Impacts Research Division,
Indices of droughts (SPI & PDSI) over Canada as simulated by a statistical downscaling model: current and future periods Philippe Gachon 1, Rabah Aider 1 & Grace Koshida Adaptation & Impacts Research Division,
A downscaling and adjustment method for climate projections in mountainous regions
 A downscaling and adjustment method for climate projections in mountainous regions applicable to energy balance land surface models D. Verfaillie, M. Déqué, S. Morin, M. Lafaysse Météo-France CNRS, CNRM
Future Rainfall and Areal Potential Evapotranspiration (APET) Projections to Inform Water Security Studies
 Projections to Inform Water Security Studies") Future Rainfall and Areal Potential Evapotranspiration (APET) Projections to Inform Water Security Studies 2016 State of NSW and Office of Environment and Heritage and CSIRO CSIRO advises that the information
Future Rainfall and Areal Potential Evapotranspiration (APET) Projections to Inform Water Security Studies 2016 State of NSW and Office of Environment and Heritage and CSIRO CSIRO advises that the information
Climate Surfaces for New Zealand
 Climate Surfaces for New Zealand J. R. Leathwick, G. Wilson, & R. T. T. Stephens Biodiversity and Conservation Division Private Bag 3127, Hamilton New Zealand Landcare Research Contract Report: LC9798/126
2016 Irrigated Crop Production Update
 2016 Irrigated Crop Production Update Mapping Climate Trends and Weather Extremes Across Alberta for the Period 1950-2010 Stefan W. Kienzle Department of Geography University of Lethbridge, Alberta, Canada
Climate Modelling: Basics
 Climate Modelling: Basics Lecture at APN-TERI Student Seminar Teri University, 16 th Feb 2015 Saurabh Bhardwaj Associate Fellow Earth Science & Climate Change Division TERI saurabh.bhardwaj@teri.res.in
Climate Modeling: From the global to the regional scale
 Climate Modeling: From the global to the regional scale Filippo Giorgi Abdus Salam ICTP, Trieste, Italy ESA summer school on Earth System Monitoring and Modeling Frascati, Italy, 31 July 11 August 2006
2009 FINAL REPORT PROJECT Final report for Project 1.5.1
 Final report for Project 1.5.1 Application of the Bureau of Meteorology downscaling technique to coupled climate model simulation of the 20 th century and implications for the attribution of observed climate
Drought and Climate Extremes Indices for the North American Drought Monitor and North America Climate Extremes Monitoring System. Richard R. Heim Jr.
 Drought and Climate Extremes Indices for the North American Drought Monitor and North America Climate Extremes Monitoring System Richard R. Heim Jr. NOAA/NESDIS/National Climatic Data Center Asheville,
Fig P3. *1mm/day = 31mm accumulation in May = 92mm accumulation in May Jul
 Met Office 3 month Outlook Period: May July 2014 Issue date: 24.04.14 Fig P1 3 month UK outlook for precipitation in the context of the observed annual cycle The forecast presented here is for May and
PREDICTING DROUGHT VULNERABILITY IN THE MEDITERRANEAN
 J.7 PREDICTING DROUGHT VULNERABILITY IN THE MEDITERRANEAN J. P. Palutikof and T. Holt Climatic Research Unit, University of East Anglia, Norwich, UK. INTRODUCTION Mediterranean water resources are under
Kevin Friedland National Marine Fisheries Service Narragansett, Rhode Island
 How climate and post-smolt growth control marine mortality in Atlantic salmon; the potential effects of a changing climate on the marine survival of Atlantic salmon Kevin Friedland National Marine Fisheries
How reliable are selected methods of projections of future thermal conditions? A case from Poland
 How reliable are selected methods of projections of future thermal conditions? A case from Poland Joanna Wibig Department of Meteorology and Climatology, University of Łódź, Outline 1. Motivation Requirements
A PROTOTYPE FOR THE APPLICATION OF CLIMATE INFORMATION TO IMPROVE HIGHWAY AND INFRASTRUCTURE PLANNING IN THE COASTAL REGIONS OF LAKE VICTORIA
 A PROTOTYPE FOR THE APPLICATION OF CLIMATE INFORMATION TO IMPROVE HIGHWAY AND INFRASTRUCTURE PLANNING IN THE COASTAL REGIONS OF LAKE VICTORIA Kara Smith October 26, 2016 Lake Victoria Levels Sudden increase
Extremes Events in Climate Change Projections Jana Sillmann
 Extremes Events in Climate Change Projections Jana Sillmann Max Planck Institute for Meteorology International Max Planck Research School on Earth System Modeling Temperature distribution IPCC (2001) Outline
Statistically Downscaled Climate Projections of Temperature, Precipitation, and Snow for Wisconsin. Michael Notaro
 Statistically Downscaled Climate Projections of Temperature, Precipitation, and Snow for Wisconsin Michael Notaro Associate Scientist Center for Climatic Research University of Wisconsin-Madison mnotaro@wisc.edu
Impacts of Long-term Climate Cycles on Alberta. A Summary. by Suzan Lapp and Stefan Kienzle
 Impacts of Long-term Climate Cycles on Alberta A Summary by Suzan Lapp and Stefan Kienzle Large Scale Climate Drivers The Pacific Decadal Oscillation (PDO) [Mantua et al., 1997] is the dominant mode of
Examining Changes to the Temporal Distribution of Seasonal-to-Annual Precipitation across the Mid-Atlantic Region,
 Examining Changes to the Temporal Distribution of Seasonal-to-Annual Precipitation across the Mid-Atlantic Region, 1982-2016 Michael Marston PhD Student, Virginia Tech Precipitation (mm) Precipitation