chapter 3. Climate Change Summary
|
|
|
- Piers Heath
- 5 years ago
- Views:
Transcription
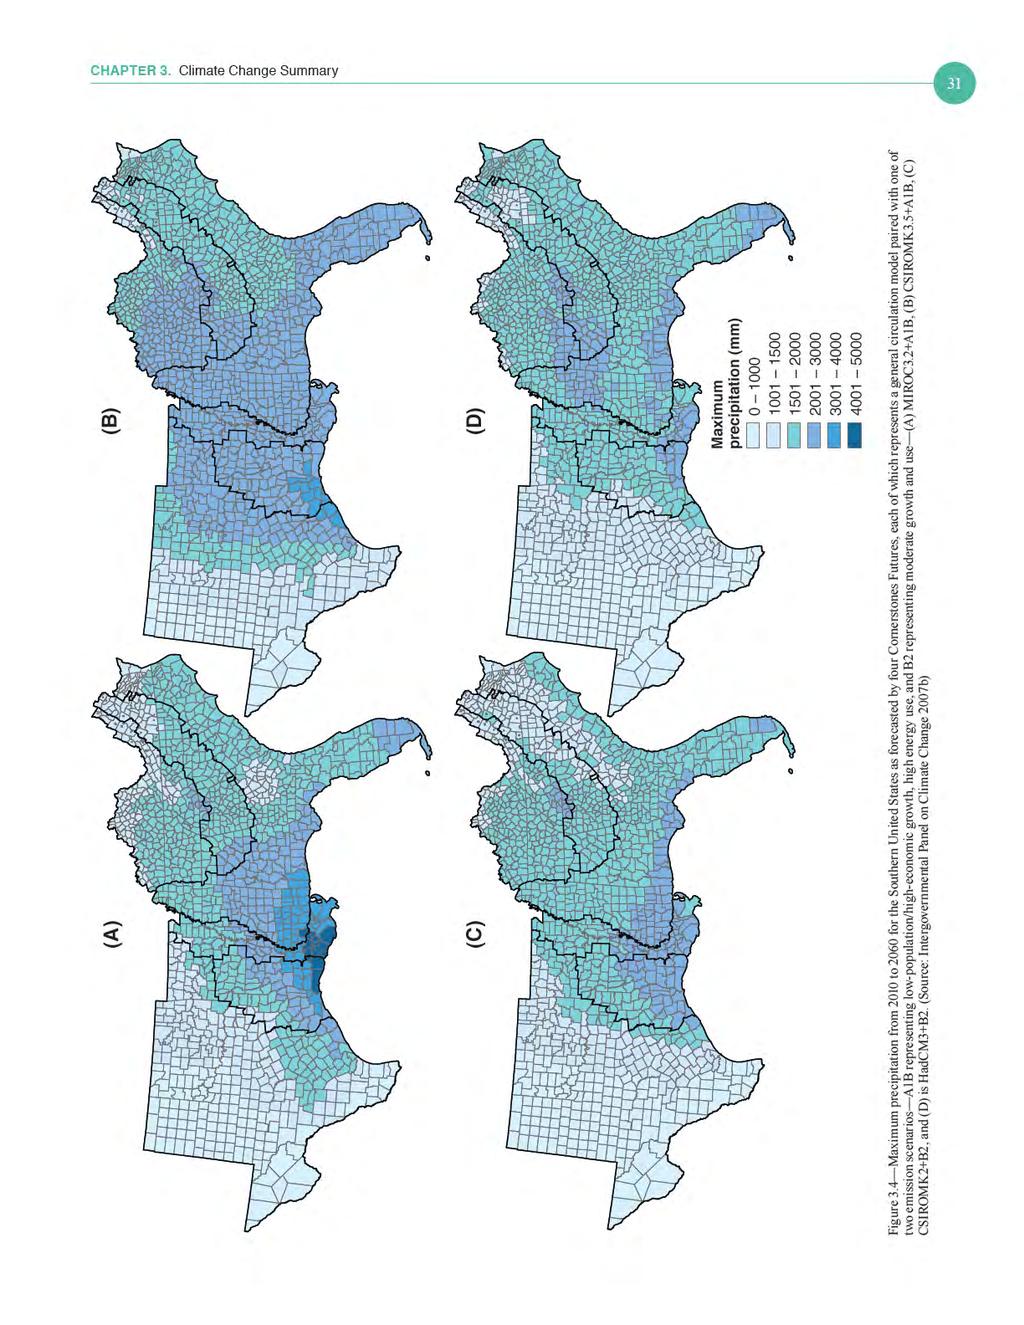
1 chapter 3. Climate Change Summary 27 Chapter 3. Climate Change Summary Steve McNulty, Jennifer Moore Myers, Peter Caldwell, and Ge Sun 1 Key FindiNGS Since 1960, all but two southern capital cities (Montgomery, AL, and Oklahoma City, OK) have experienced a statistically significant increase in average annual temperature (approximately C), but none has experienced significant trends in precipitation. The South is forecasted to experience warmer temperatures for the duration of the 21 st century; forecasts are mixed for precipitation changes during the same period. Climate predictions range from wet and warm (1167 mm/19.06 C) to moderate and warm (1083 mm/19.45 C and 1106 mm/19.27 C) to dry and hot (912 mm/20.22 C). Introduction This chapter summarizes the climate predictions that have been used throughout the Southern Forest Futures Project (IPCC 2007b). Four distinct combinations of general circulation models (GCMs) and special report emissions scenarios were selected as Cornerstone Futures. GCMs are complex models that provide geographically and physically consistent estimates of regional climate change (IPCC 2009). The emissions scenarios are global storylines representing alternative demographic, socioeconomic, and environmental futures (Nakicenovic 2000). The GCMs selected for the Futures Project were the MK2 and MK3.5 from the Australian Commonwealth Scientific and Industrial Research Organization (CSIRO), the HadCM3 from the United Kingdom Meteorological Center, and the MIROC 3.2 from the Japanese National Institute for Environmental Studies. Two emissions scenarios were selected for the Futures Project. The A1B scenario is characterized by low population growth, high energy use, and high economic growth. The B2 scenario is characterized by medium population growth, 1 Steve McNulty is Supervisory Ecologist, Jennifer Moore Myers is a Resource Information Specialist, and Peter Caldwell and Ge Sun are Research Hydrologists, Eastern Forest Environmental Threat Assessment Center, Southern Research Station, U.S. Department of Agriculture Forest Service, Raleigh, NC medium energy use, and medium economic growth (IPCC 2007b). These scenarios represent two levels of global carbon dioxide (CO 2 ) emissions by 2100: 60 gigatons of CO 2 - equivalents (eq) (IPCC 2007a) in the A1B scenario (resulting in an atmospheric concentration of approximately 700 ppm) (Solomon and others 2007) and 65 gigatons of CO 2 -eq (IPCC 2007a) in the B2 scenario (resulting in an atmospheric concentration of approximately 600 ppm) (Solomon and others 2007). The relationship between CO 2 equivalent emissions and atmospheric CO 2 concentration is not linear, and the estimates for 2100 are influenced by emission rates throughout the 21 st century. The A1B scenario peaks higher around 2050 and tapers off, while the B2 scenario increases more slowly and steadily. For comparison, carbon dioxide emissions for 2009 were estimated at 40 gigatons of CO 2 -eq (resulting in an atmospheric concentration of 387 parts per million) (IPCC 2007a, Tans 2011). The Futures Project combines GCMs and emissions scenarios into four Cornerstone Futures CSIROMK3.5+A1B, MIROC3.2+A1B, CSIROMK2+B2, and HadCM3+B2 which are described in this chapter. Although this chapter does not discuss subregional variations in detail, the GCM summary data have been provided in both tabular and graphic formats to allow the reader to examine climate change impacts for subregions of interest. Data Sources AND Methods Because the original scale of the GCMs was too coarse for regional analysis, the Cornerstone Futures were downscaled from their original resolution of approximately 2 degrees by the World Climate Research Programme s Coupled Model Intercomparison Project phase 3 (CMIP3) (Maurer and others 2007). Each GCM was spatially downscaled to one-twelfth degree (5 arc minute) using ANUSPLIN, a interpolation model that incorporates four dimensions (climatic variable, latitude, longitude, and elevation) to produce gridded surfaces for both monthly precipitation and surface air temperature (Hutchinson 2009). The CMIP3 data were obtained and processed by Coulson and others (2010) for use in the 2010 Resources Planning Act (RPA) Assessment. Monthly precipitation and
2 28 The Southern Forest Futures Project temperature data from 2000 to 2100 were scaled to the county level for the conterminous United States. All chapters in this assessment use the county level precipitation and temperature data. All regional and subregional averages were area-weighted to remove bias that would result from averaging counties of different areas. For this chapter, annual and decadal averages were generated for the South and for its five subregions using the JMP 8.0 software application (SAS Institute Inc. 2010). For a historical perspective, trends in air temperature and precipitation for the 13 southern capital cities from 1960 to 2007 were obtained from the PRISM Climate Group (Gibson and others 2002). Maps were generated using the ArcMap version software application (ESRI 2010). The decades selected for this chapter were 2010, 2020, 2040, 2060, and To calculate the decadal averages, the ten years surrounding each period were summed, in the case of precipitation, and then averaged. The decadal average for 2010 included data from the years , 2020 included data from , 2040 included data from , etc. The results section describes averages and anomalies for each of the four Cornerstones. Results Regional Forecasts Table 3.1 summarizes precipitation and temperature averages forecasted for the South through 2100, with historical data for comparison. Figures 3.1 through 3.4 present graphic and map displays of precipitation data, and figures 3.5 through 3.8 present graphic and map displays of temperature data. Characterized by low population growth and high energyuse/economic-growth (MIROC3.2+A1B), Cornerstone A is forecasted to be dry and hot, with average annual precipitation of 912 mm and average annual temperature of C. Annual precipitation expected for any southern county ranges from 103 to 4999 mm, and temperature ranges from to C. Average maximum monthly temperatures would exceed the single-day southern maximum of C, which was set in Oklahoma in 1994 (Burt 2007). Also characterized by low population growth and high energy-use/economic-growth (CSIROMK3.5+A1B), Cornerstone B is forecasted to be wet and warm, with average annual precipitation of 1167 mm and average temperature of C. Annual precipitation expected for southern counties ranges from 93 to 3912 mm, and temperature ranges from to C. Characterized by moderate population/income growth and energy use (CSIROMK2+B2), Cornerstone C is forecasted to be moderate and warm, with average annual precipitation of 1083 mm and average annual temperature of C. Annual precipitation expected for any southern county ranges from 35 to 2641 mm. That precipitation minimum would break the 1956 regional low of 42 mm in Texas (Burt 2007). Temperature is expected to range from to C. Also characterized by moderate population/income growth and energy use (HadCM3+B2), Cornerstone D is also forecasted to be moderate and warm, with average annual precipitation of 1106 mm (higher than Cornerstone C) and average annual temperature of C (lower than Cornerstone C). Annual precipitation expected for Table 3.1 Summary statistics for predicted ( ) and historical ( ) annual precipitation and temperature forecasts for the Southern United States by four Cornerstone Futures A through D Precipitation (mm) Temperature ( C) Cornerstone a Minimum Maximum Average Standard deviation Minimum Maximum Average Standard deviation A B C D Average all Cornerstones NA NA 1066 NA NA NA NA Historical (2001 to 2009) NA NA NA = not applicable. a Each Cornerstone represents a general circulation model paired with one of two emission scenarios (A1B represents low-population/ high-economic growth, high energy use; B2 represents moderate growth and use): A is MIROC3.2+A1B, B is CSIROMK3.5+A1B, C is CSIROMK2+B2, and D is HadCM3+B2. Source: Intergovernmental Panel on Climate Change 2007b.
3
4
5
6
7
8
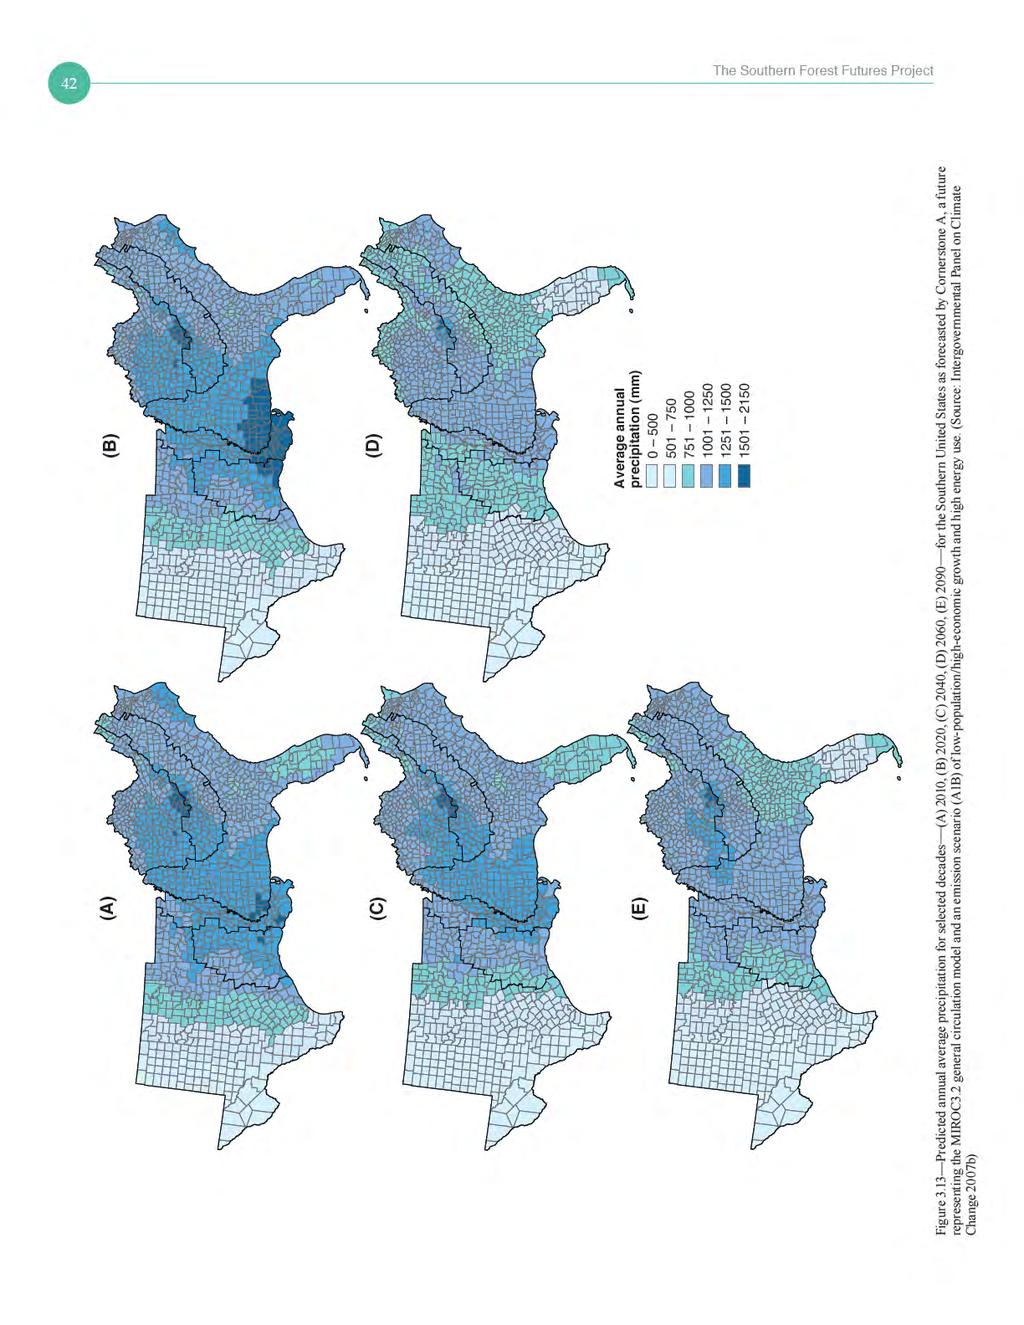
9 chapter 3. Climate Change Summary 35 any southern county ranges from 102 to 2708 mm, and temperature ranges from to C. Subregional Forecasts In the Southern United States, forecasted precipitation (table 3.2) and temperature averages (table 3.3) are not expected to be uniform, with significant variations across the five subregions and between seasons (table 3.4). Figures 3.9 and 3.10 present graphic and map displays of precipitation and temperature data. Cornerstone A s high energy-use/economic-growth (MIROC3.2+A1B) is predicted to result in the least decadal precipitation by 2060, with an overall average of 810 mm for all five southern subregions and a low of 525 mm in the Mid- South. This trend is expected to abate only slightly by 2090 to an average of 858 mm for all subregions and 535 mm for the Mid-South still much drier than the historical overall average of 1136 mm. Although also based on high energy-use/economic-growth, Cornerstone B (CSIROMK3.5+A1B) predicts more decadal precipitation than the other Cornerstones by 2060, with an overall average of 1156 mm. This trend continues into 2090, with an overall average predicted to be 1223 mm. Cornerstone B also predicts cooler decadal temperatures than the other Cornerstones by 2060 with an overall average of C for every subregion except the Mid- South. This trend continues into 2090, with Cornerstone B s overall average of C, lower than all the others for all subregions. Cornerstone A predicts warmer decadal temperatures than the other Cornerstones by 2060, with an overall average of C for all five southern subregions. This trend continues into 2090, with Cornerstone A s overall average of C leading all the others for all subregions. Comparing these predictions with historical trends in air temperature and precipitation for the 13 southern capital cities from 1960 to 2007 shows a statistically significant increase (total of C, average of C) in air temperature but no significant change in precipitation (fig. 3.11). These findings are consistent with a trend of significant increases in temperature from 1970 to 2008 reported by Karl and others (2009) (table 3.4), but not after their data from 1901 to 1969 were included. Discussion AND Conclusions GCMs provide some indication of how climate will change across the South in coming decades. Each has been independently developed, often for a specific region, and frequently calibrated to recreate historical climate on the assumption that successful modeling of the past increases the likelihood of accurately forecasting the future. However, the same calibration that allows an accurate recreation of historical climate for one region can result in over- or underpredicting climate change for others. An example of possible over-predicting is Cornerstone A (MIROC3.2+A1B), which assumes high energy-use and economic-growth and predicts the warmest conditions, with monthly averages sometimes exceeding single-day historical highs (fig. 3.12). Similarly, Cornerstone A s average precipitation is about 20 percent lower (fig. 3.13). For these reasons, it is considered the most severe of the Cornerstones in terms of extreme events as well as annual averages. The other GCMs used in this analysis also predict maximum monthly air temperatures in excess of historically observed conditions, but by a smaller margin. In particular, Cornerstone B (CSIROMK3.5+A1B) predicts increases in average annual precipitation compared to historical averages. Another caveat is that averaged or summed monthly values are less able to express climate variability (especially extremes) than daily values. Monthly average air temperatures are expected to be much lower than some of the individual daily highs, and higher than some of the individual daily lows. For example, if a maximum monthly air temperature is predicted to be 40 C, then individual daily air temperatures are likely to exceed 45 or even 50 C. Likewise, monthly average precipitation does not fully represent the number or magnitude of individual events. Although Cornerstone A predicts a reduction in average precipitation, many of its monthly maximums exceed historical highs. Similarly, variations among months may not be captured by monthly averages or annual summaries. For example, 1000 mm of precipitation during a 5-month period in winter and spring would produce a very different impact than if evenly distributed throughout the year or concentrated during growing-season months. And for monthly level predictions, a 100-mm average would mask the water quality and flooding impacts that would result if precipitation were concentrated in one or two major events. The GCMs also have limited spatial resolution. Their one-twelfth degree by one-twelfth degree resolution is a significant improvement on older model forecasts, but still coarse for predicting precipitation, which can be highly variable with adjacent areas receiving drastically different precipitation amounts from a single event. This variation is also important for localized flood forecasting and in estimating water quality.
10 36 The Southern Forest Futures Project Table 3.2 Predicted average precipitation for subregions of the Southern United States as forecasted by four Cornerstone Futures A through D Date Cornerstone a prediction of average precipitation (mm) Subregion A B C D Appalachian-Cumberland Coastal Plain Mid-South Mississippi Alluvial Valley Piedmont Appalachian-Cumberland Coastal Plain Mid-South Mississippi Alluvial Valley Piedmont Appalachian-Cumberland Coastal Plain Mid-South Mississippi Alluvial Valley Piedmont Appalachian-Cumberland Coastal Plain Mid-South Mississippi Alluvial Valley Piedmont Appalachian-Cumberland Coastal Plain Mid-South Mississippi Alluvial Valley Piedmont a Each Cornerstone represents a general circulation model paired with one of two emission scenarios (A1B represents lowpopulation/high-economic growth, high energy use; B2 represents moderate growth and use): A is MIROC3.2+A1B, B is CSIROMK3.5+A1B, C is CSIROMK2+B2, and D is HadCM3+B2. Source: Intergovernmental Panel on Climate Change 2007b.
11 chapter 3. Climate Change Summary 37 Table 3.3 Predicted average temperature ( C) for subregions of the Southern United States as forecasted by four Cornerstone Futures A through D Date Cornerstone a prediction of average temperature ( C) Subregion A B C D Appalachian-Cumberland Coastal Plain Mid-South Mississippi Alluvial Valley Piedmont Appalachian-Cumberland Coastal Plain Mid-South Mississippi Alluvial Valley Piedmont Appalachian-Cumberland Coastal Plain Mid-South Mississippi Alluvial Valley Piedmont Appalachian-Cumberland Coastal Plain Mid-South Mississippi Alluvial Valley Piedmont Appalachian-Cumberland Coastal Plain Mid-South Mississippi Alluvial Valley Piedmont a Each Cornerstone represents a general circulation model paired with one of two emission scenarios (A1B represents low-population/high-economic growth, high energy use; B2 represents moderate growth and use): A is MIROC3.2+A1B, B is CSIROMK3.5+A1B, C is CSIROMK2+B2, and D is HadCM3+B2. Source: Intergovernmental Panel on Climate Change 2007b. Table 3.4 Average change in temperature and precipitation in the Southeastern United States, as recreated from Karl and others (2009) Temperature change ( F) Precipitation change (percent) Annual Annual Winter Winter Spring Spring Summer Summer Autumn Autumn
12
13
14
15
16
17 chapter 3. Climate Change Summary 43 However, gaps still exist, both in knowledge and its implementation. For example, the GCMs from the most recent assessment incorporate changes in albedo from polar ice cap melting (IPCC 2007b), an improvement over previous assessments (Winton 2008) that can offer more accurate simulations but only if this important feedback is incorporated into new model runs. Additionally, the positive feedback between permafrost melting and subsequent release of carbon dioxide and methane adds important greenhouse gases to the atmosphere that must be included in the global warming predictions (Walter and others 2006). Just as weather forecasts commonly predict from 7 to 10 days into the future with decreasing accuracy over time, climate forecasts based on existing and developing global ocean and atmospheric circulation patterns currently predict 6 to 12 months into the future. Although additional improvement in the accuracy and forecast length of these seasonal predictions are likely, accurately predicting specific weather events or patterns that may occur years or decades in the future is unlikely anytime soon. The science needed to predict the impacts of doubling atmospheric carbon dioxide on global air temperature and precipitation is very different from the science needed to predict monthly air temperature for a specific city on a specific date. Given these limitations, land managers will need to rely on the climate envelopes (ranges of climatic conditions for specific places and times) as they develop climate change impact assessments and coping strategies. AcknowledgmeNTS We acknowledge the modeling groups, the Program for Climate Model Diagnosis and Intercomparison and the World Climate Research Programme (WCRP) Working Group on Coupled Modeling for their roles in making available the WCRP CMIP3 multi-model dataset. Support of this dataset is provided by the Office of Science, U.S. Department of Energy. We also acknowledge John Buckley and Erika Cohen, Southern Research Station, U.S. Department of Agriculture, Forest Service, for their assistance with reviewing climate summaries. Literature Cited Burt, C.C Extreme weather: a guide and record book. New York: W.W. Norton and Co. 303 p. Coulson, D.P.; Joyce, L.A.; Price, D.T. [and others] Climate scenarios for the conterminous United States at the county spatial scale using SRES scenarios A1B and A2 and PRISM climatology. Fort Collins, CO: U.S. Department of Agriculture Forest Service, Rocky Mountain Research Station. US_ClimateScenarios_county_A1B_A2_PRISM.shtml. [Date accessed: January 10, 2011]. Environmental Systems Research Institute (ESRI) ArcGIS. Version Redlands, CA: Environmental Systems Research Institute. Gibson, W.; Daly, C.; Kittel, T. [and others] Development of a 103-year high-resolution climate dataset for the conterminous United States. In: Proceedings of 13th American Meteorological Society Conference on Applied Climatology. Portland, OR: American Meteorological Society: Hutchinson, M.F ANUSPLIN Version edu.au/publications/software/anusplin.php. [Date accessed: March 17, 2011]. Intergovernmental Panel on Climate Change (IPCC). 2007a. Contribution of working groups I, II, and III to the fourth assessment report of the Intergovernmental Panel on Climate Change. Geneva, Switzerland: Intergovernmental Panel on Climate Change. 104 p. pdf/assessment-report/ar4/syr/ar4_syr.pdf. [Date accessed: March 16, 2011]. Intergovernmental Panel on Climate Change (IPCC). 2007b. IPCC fourth assessment report: climate change 2007 (AR4). publications_and_data/publications_and_data_reports.htm. [Date accessed: July 7, 2010]. Intergovernmental Panel on Climate Change (IPCC) What is a GCM? [Date accessed: August 18, 2010]. Karl, T.R.; Melillo, J.M.; Peterson, T.C Global change impacts in the United States. Cambridge, UK: Cambridge University Press. 188 p. [Date accessed: August 24, 2010]. Maurer, E.P.; Brekke, L.; Pruitt, T.; Duffy, P.B Fine-resolution climate projections enhance regional climate change impact studies. Eos, Transactions American Geophysical Union. 88(47): 504. National Assessment Synthesis Team (NAST) Climate change impacts on the United States: the potential consequences of climate variability and change. Foundation Report. Report for the U.S. global change research program. Cambridge, UK: Cambridge University Press. 154 p. Nakicenovic, N.; Swart, R., eds Special report on emissions scenarios: a special report of working group III of the Intergovernmental Panel on Climate Change. Cambridge, UK: Cambridge University Press. 599 p. [Date accessed: August 26, 2010]. SAS Institute Inc JMP. SAS/STAT user s guide. Version 8. Cary, NC: SAS Institute Inc. [pages unknown]. Solomon, S.; Qin, D.; Manning, M.; Chen, Z. [and others], eds Contribution of working group I to the fourth assessment report of the Intergovernmental Panel on Climate Change. Cambridge, UK: Cambridge University Press. 996 p. and_data/ar4/wg1/en/contents.html. [Date accessed: March 15, 2011]. Tans, P Trends in atmospheric carbon dioxide. NOAA/ESRL. [Date accessed: March 15, 2011]. Walter, K.M.; Zimov, S.A.; Chanton, J.P. [and others] Methane bubbling from Siberian thaw lakes as a positive feedback to climate warming. Nature. 443(7): Winton, M Sea ice albedo feedback and nonlinear Arctic climate change. In: DeWeaver, E.; Bitz, C.M.; Tremblay, B., eds. Arctic Sea Ice Decline: Observations, Projections, Mechanisms, and Implications. Geophysical Monograph Service. Washington, DC: Vol. 180.
technological change and economic growth more fragmented; slower, higher population growth middle emissions path
 TACCIMO Climate Report: Flathead National Forest 08-28-2013 Table of Contents Introduction Historic National Regional Forest Metadata and Interpretive Guidance Page 1 2 3 6 9 12 Introduction The TACCIMO
What is the IPCC? Intergovernmental Panel on Climate Change
 IPCC WG1 FAQ What is the IPCC? Intergovernmental Panel on Climate Change The IPCC is a scientific intergovernmental body set up by the World Meteorological Organization (WMO) and by the United Nations
Northern Rockies Adaptation Partnership: Climate Projections
 Northern Rockies Adaptation Partnership: Climate Projections Contents Observed and Projected Climate for the NRAP Region... 2 Observed and Projected Climate for the NRAP Central Subregion... 8 Observed
Climate Summary for the Northern Rockies Adaptation Partnership
 Climate Summary for the Northern Rockies Adaptation Partnership Compiled by: Linda Joyce 1, Marian Talbert 2, Darrin Sharp 3, John Stevenson 4 and Jeff Morisette 2 1 USFS Rocky Mountain Research Station
Will a warmer world change Queensland s rainfall?
 Will a warmer world change Queensland s rainfall? Nicholas P. Klingaman National Centre for Atmospheric Science-Climate Walker Institute for Climate System Research University of Reading The Walker-QCCCE
Confronting Climate Change in the Great Lakes Region. Technical Appendix Climate Change Projections CLIMATE MODELS
 Confronting Climate Change in the Great Lakes Region Technical Appendix Climate Change Projections CLIMATE MODELS Large, three-dimensional, coupled atmosphere-ocean General Circulation Models (GCMs) of
J8.4 TRENDS OF U.S. SNOWFALL AND SNOW COVER IN A WARMING WORLD,
 J8.4 TRENDS OF U.S. SNOWFALL AND SNOW COVER IN A WARMING WORLD, 1948-2008 Richard R. Heim Jr. * NOAA National Climatic Data Center, Asheville, North Carolina 1. Introduction The Intergovernmental Panel
Ryan P. Shadbolt * Central Michigan University, Mt. Pleasant, Michigan
 14A.1 RECENT CLIMATE CHANGE IN THE HIGH ELEVATIONS OF THE SOUTHERN APPALACHIANS Ryan P. Shadbolt * Central Michigan University, Mt. Pleasant, Michigan 1. INTRODUCTION Island species are often vulnerable
Future population exposure to US heat extremes
 Outline SUPPLEMENTARY INFORMATION DOI: 10.1038/NCLIMATE2631 Future population exposure to US heat extremes Jones, O Neill, McDaniel, McGinnis, Mearns & Tebaldi This Supplementary Information contains additional
Mozambique. General Climate. UNDP Climate Change Country Profiles. C. McSweeney 1, M. New 1,2 and G. Lizcano 1
 UNDP Climate Change Country Profiles Mozambique C. McSweeney 1, M. New 1,2 and G. Lizcano 1 1. School of Geography and Environment, University of Oxford. 2.Tyndall Centre for Climate Change Research http://country-profiles.geog.ox.ac.uk
SOUTHERN CLIMATE MONITOR
 SOUTHERN CLIMATE MONITOR AUGUST 2012 VOLUME 2, ISSUE 8 IN THIS ISSUE: Page 2 to 3 Spotlight on Academic Research: Changes in Temperature and Precipitation in the South Page 4 Drought Update and Southern
Climate Outlook through 2100 South Florida Ecological Services Office Vero Beach, FL September 9, 2014
 Climate Outlook through 2100 South Florida Ecological Services Office Vero Beach, FL September 9, 2014 Short Term Drought Map: Short-term (
Climatic and Ecological Conditions in the Klamath Basin of Southern Oregon and Northern California: Projections for the Future
 Climatic and Ecological Conditions in the Klamath Basin of Southern Oregon and Northern California: Projections for the Future A Collaborative Effort by: CLIMATE LEADERSHIP INITIATIVE INSTITUTE FOR A SUSTAINABLE
Activity 2.2: Recognizing Change (Observation vs. Inference)
") Activity 2.2: Recognizing Change (Observation vs. Inference) Teacher Notes: Evidence for Climate Change PowerPoint Slide 1 Slide 2 Introduction Image 1 (Namib Desert, Namibia) The sun is on the horizon
Activity 2.2: Recognizing Change (Observation vs. Inference) Teacher Notes: Evidence for Climate Change PowerPoint Slide 1 Slide 2 Introduction Image 1 (Namib Desert, Namibia) The sun is on the horizon
Future Climate Change
 Future Climate Change How do you know whether to trust a prediction about the future? All predictions are based on global circulation models (GCMs, AOGCMs) - model accuracy is verified by its ability to
Climate Outlook through 2100 South Florida Ecological Services Office Vero Beach, FL January 13, 2015
 Climate Outlook through 2100 South Florida Ecological Services Office Vero Beach, FL January 13, 2015 Short Term Drought Map: Short-term (
Annex I to Target Area Assessments
 Baltic Challenges and Chances for local and regional development generated by Climate Change Annex I to Target Area Assessments Climate Change Support Material (Climate Change Scenarios) SWEDEN September
Climate Modeling Dr. Jehangir Ashraf Awan Pakistan Meteorological Department
 Climate Modeling Dr. Jehangir Ashraf Awan Pakistan Meteorological Department Source: Slides partially taken from A. Pier Siebesma, KNMI & TU Delft Key Questions What is a climate model? What types of climate
Climate Change 2007: The Physical Science Basis
 Climate Change 2007: The Physical Science Basis Working Group I Contribution to the IPCC Fourth Assessment Report Presented by R.K. Pachauri, IPCC Chair and Bubu Jallow, WG 1 Vice Chair Nairobi, 6 February
Authors. Keywords: Climate scenario, downscaling, PRISM, natural renewable resource assessments, RPA Scenarios.
 Joyce, Linda A.; Price, David T.; Coulson, David P.; McKenney, Daniel W.; Siltanen, R. Martin; Papadopol, Pia; Lawrence, Kevin. 2014. Projecting climate change in the United States: A technical document
THE CANADIAN CENTRE FOR CLIMATE MODELLING AND ANALYSIS
 THE CANADIAN CENTRE FOR CLIMATE MODELLING AND ANALYSIS As Canada s climate changes, and weather patterns shift, Canadian climate models provide guidance in an uncertain future. CANADA S CLIMATE IS CHANGING
CLIMATE SIMULATIONS AND PROJECTIONS OVER RUSSIA AND THE ADJACENT SEAS: а CMIP5 Update
 CLIMATE SIMULATIONS AND PROJECTIONS OVER RUSSIA AND THE ADJACENT SEAS: а CMIP5 Update Tatiana Pavlova and Vladimir Kattsov Voeikov Main Geophysical Observatory, St. Petersburg, Russia Workshop on Global
International Journal of Scientific and Research Publications, Volume 3, Issue 5, May ISSN
 International Journal of Scientific and Research Publications, Volume 3, Issue 5, May 2013 1 Projection of Changes in Monthly Climatic Variability at Local Level in India as Inferred from Simulated Daily
Climate Risk Profile for Samoa
 Climate Risk Profile for Samoa Report Prepared by Wairarapa J. Young Samoa Meteorology Division March, 27 Summary The likelihood (i.e. probability) components of climate-related risks in Samoa are evaluated
Historical and Projected National and Regional Climate Trends
 Climate Change Trends for Planning at Sand Creek Massacre National Historic Site Prepared by Nicholas Fisichelli, NPS Climate Change Response Program April 18, 2013 Climate change and National Parks Climate
Observed State of the Global Climate
 WMO Observed State of the Global Climate Jerry Lengoasa WMO June 2013 WMO Observations of Changes of the physical state of the climate ESSENTIAL CLIMATE VARIABLES OCEANIC ATMOSPHERIC TERRESTRIAL Surface
Historical North Cascades National Park. +2.7ºC/century (+4.9ºF./century)
") Climate Change Trends, North Cascades National Park, Ross Lake National Recreation Area, and Lake Chelan National Recreation Area, Washington Patrick Gonzalez Natural Resource Stewardship and Science,
Climate Change Trends, North Cascades National Park, Ross Lake National Recreation Area, and Lake Chelan National Recreation Area, Washington Patrick Gonzalez Natural Resource Stewardship and Science,
Training: Climate Change Scenarios for PEI. Training Session April Neil Comer Research Climatologist
 Training: Climate Change Scenarios for PEI Training Session April 16 2012 Neil Comer Research Climatologist Considerations: Which Models? Which Scenarios?? How do I get information for my location? Uncertainty
Water Stress, Droughts under Changing Climate
 Water Stress, Droughts under Changing Climate Professor A.K.M. Saiful Islam Institute of Water and Flood Management Bangladesh University of Engineering and Technology (BUET) Outline of the presentation
What is Climate? Understanding and predicting climatic changes are the basic goals of climatology.
 What is Climate? Understanding and predicting climatic changes are the basic goals of climatology. Climatology is the study of Earth s climate and the factors that affect past, present, and future climatic
Full Version with References: Future Climate of the European Alps
 Full Version with References: Future Climate of the European Alps Niklaus E. Zimmermann 1, Ernst Gebetsroither 2, Johannes Züger 2, Dirk Schmatz 1, Achilleas Psomas 1 1 Swiss Federal Research Institute
Weather and Climate Summary and Forecast Winter
 Weather and Climate Summary and Forecast Winter 2016-17 Gregory V. Jones Southern Oregon University February 7, 2017 What a difference from last year at this time. Temperatures in January and February
Prentice Hall EARTH SCIENCE
 Prentice Hall EARTH SCIENCE Tarbuck Lutgens Chapter 21 Climate 21.1 Factors That Affect Climate Factors That Affect Climate Latitude As latitude increases, the intensity of solar energy decreases. The
Projected Change in Climate Under A2 Scenario in Dal Lake Catchment Area of Srinagar City in Jammu and Kashmir
 Current World Environment Vol. 11(2), 429-438 (2016) Projected Change in Climate Under A2 Scenario in Dal Lake Catchment Area of Srinagar City in Jammu and Kashmir Saqib Parvaze 1, Sabah Parvaze 2, Sheeza
Climate Change RMJOC Study Summary
 Climate Change RMJOC Study Summary Erik Pytlak Weather and Streamflow Forecasting Bonneville Power Administration Portland, OR IPCC: International Panel on Climate Change Established by the United Nations
Projected Impacts of Climate Change in Southern California and the Western U.S.
 Projected Impacts of Climate Change in Southern California and the Western U.S. Sam Iacobellis and Dan Cayan Scripps Institution of Oceanography University of California, San Diego Sponsors: NOAA RISA
The South Eastern Australian Climate Initiative
 The South Eastern Australian Climate Initiative Phase 2 of the South Eastern Australian Climate Initiative (SEACI) is a three-year (2009 2012), $9 million research program investigating the causes and
Confronting Climate Change in the Great Lakes Region. Technical Appendix Climate Change Projections EXTREME EVENTS
 Confronting Climate Change in the Great Lakes Region Technical Appendix Climate Change Projections EXTREME EVENTS Human health and well-being, as well as energy requirements, building standards, agriculture
Prentice Hall EARTH SCIENCE
 Prentice Hall EARTH SCIENCE Tarbuck Lutgens Chapter 21 Climate 21.1 Factors That Affect Climate Factors That Affect Climate Latitude As latitude increases, the intensity of solar energy decreases. The
Current and future climate of the Cook Islands. Pacific-Australia Climate Change Science and Adaptation Planning Program
 Pacific-Australia Climate Change Science and Adaptation Planning Program Penrhyn Pukapuka Nassau Suwarrow Rakahanga Manihiki N o r t h e r n C o o k I s l a nds S o u t h e Palmerston r n C o o k I s l
CLIMATE CHANGE IMPACTS ON HYDROMETEOROLOGICAL VARIABLES AT LAKE KARLA WATERSHED
 Proceedings of the 14 th International Conference on Environmental Science and Technology Rhodes, Greece, 3-5 September 2015 CLIMATE CHANGE IMPACTS ON HYDROMETEOROLOGICAL VARIABLES AT LAKE KARLA WATERSHED
What is Climate? Climate Change Evidence & Causes. Is the Climate Changing? Is the Climate Changing? Is the Climate Changing? Is the Climate Changing?
 What is Climate? 1 Climate Change Evidence & Causes Refers to the average environmental conditions (i.e. temperature, precipitation, extreme events) in a given location over many years Climate is what
Historical and Projected Future Climatic Trends in the Great Lakes Region
 Historical and Projected Future Climatic Trends in the Great Lakes Region Jeffrey A. Andresen Dept. of Geography, Environment, and Spatial Sciences Michigan State University Flooding along I-696 Warren,
Weather and Climate Summary and Forecast January 2018 Report
 Weather and Climate Summary and Forecast January 2018 Report Gregory V. Jones Linfield College January 5, 2018 Summary: A persistent ridge of high pressure over the west in December produced strong inversions
Climate Change in the Northeast: Past, Present, and Future
 Climate Change in the Northeast: Past, Present, and Future Dr. Cameron Wake Institute for the Study of Earth, Oceans, and Space (EOS) University of New Hampshire 62nd Annual Meeting of the Northeastern
Potential Impacts of Climate Change on Soil Erosion Vulnerability Across the Conterminous U.S.
 Potential Impacts of Climate Change on Soil Erosion Vulnerability Across the Conterminous U.S. Catalina Segura 1, Ge Sun 2, Steve McNulty 2, and Yang Zhang 1 1 2 1 Soil Erosion Natural process by which
Weather and Climate Summary and Forecast Fall/Winter 2016
 Weather and Climate Summary and Forecast Fall/Winter 2016 Gregory V. Jones Southern Oregon University November 5, 2016 After a year where we were seemingly off by a month in terms of temperatures (March
1990 Intergovernmental Panel on Climate Change Impacts Assessment
 1990 Intergovernmental Panel on Climate Change Impacts Assessment Although the variability of weather and associated shifts in the frequency and magnitude of climate events were not available from the
Erik Kabela and Greg Carbone, Department of Geography, University of South Carolina
 Downscaling climate change information for water resources Erik Kabela and Greg Carbone, Department of Geography, University of South Carolina As decision makers evaluate future water resources, they often
Current Climate Science and Climate Scenarios for Florida
 Current Climate Science and Climate Scenarios for Florida Daniel Bader and Vivien Gornitz Water Utilities and Climate Change Workshop Palm Beach County Water Utilities/ Water Research Foundation June 10,
Factors That Affect Climate
 Factors That Affect Climate Factors That Affect Climate Latitude As latitude (horizontal lines) increases, the intensity of solar energy decreases. The tropical zone is between the tropic of Cancer and
Ellen L. Mecray NOAA Regional Climate Services Director, Eastern Region Taunton, MA
 Ellen L. Mecray NOAA Regional Climate Services Director, Eastern Region Taunton, MA Regions of the US National Climate Assessment What we Observe: Climate changes and impacts Increasing temperature Increasingly
A Study of the Uncertainty in Future Caribbean Climate Using the PRECIS Regional Climate Model
 A Study of the Uncertainty in Future Caribbean Climate Using the PRECIS Regional Climate Model by Abel Centella and Arnoldo Bezanilla Institute of Meteorology, Cuba & Kenrick R. Leslie Caribbean Community
An ENSO-Neutral Winter
 An ENSO-Neutral Winter This issue of the Blue Water Outlook newsletter is devoted towards my thoughts on the long range outlook for winter. You will see that I take a comprehensive approach to this outlook
Assessment of Snow Cover Vulnerability over the Qinghai-Tibetan Plateau
 ADVANCES IN CLIMATE CHANGE RESEARCH 2(2): 93 100, 2011 www.climatechange.cn DOI: 10.3724/SP.J.1248.2011.00093 ARTICLE Assessment of Snow Cover Vulnerability over the Qinghai-Tibetan Plateau Lijuan Ma 1,
2015: A YEAR IN REVIEW F.S. ANSLOW
 2015: A YEAR IN REVIEW F.S. ANSLOW 1 INTRODUCTION Recently, three of the major centres for global climate monitoring determined with high confidence that 2015 was the warmest year on record, globally.
Global Climate Change and the Implications for Oklahoma. Gary McManus Associate State Climatologist Oklahoma Climatological Survey
 Global Climate Change and the Implications for Oklahoma Gary McManus Associate State Climatologist Oklahoma Climatological Survey OCS LEGISLATIVE MANDATES Conduct and report on studies of climate and weather
Energy Systems, Structures and Processes Essential Standard: Analyze patterns of global climate change over time Learning Objective: Differentiate
 Energy Systems, Structures and Processes Essential Standard: Analyze patterns of global climate change over time Learning Objective: Differentiate between weather and climate Global Climate Focus Question
138 ANALYSIS OF FREEZING RAIN PATTERNS IN THE SOUTH CENTRAL UNITED STATES: Jessica Blunden* STG, Inc., Asheville, North Carolina
 138 ANALYSIS OF FREEZING RAIN PATTERNS IN THE SOUTH CENTRAL UNITED STATES: 1979 2009 Jessica Blunden* STG, Inc., Asheville, North Carolina Derek S. Arndt NOAA National Climatic Data Center, Asheville,
The science behind southeast Australia s wet, cool summer.
 XXXX The science behind southeast Australia s wet, cool summer. Key facts: 1. For many years scientists have painted a clear picture: that the Earth s surface is warming rapidly and the climate is changing.
Using a library of downscaled climate projections to teach climate change analysis
 Using a library of downscaled climate projections to teach climate change analysis Eugene Cordero, Department of Meteorology San Jose State University Overview of Dataset Climate change activity Applications
Regional Climate Simulations with WRF Model
 WDS'3 Proceedings of Contributed Papers, Part III, 8 84, 23. ISBN 978-8-737852-8 MATFYZPRESS Regional Climate Simulations with WRF Model J. Karlický Charles University in Prague, Faculty of Mathematics
National Wildland Significant Fire Potential Outlook
 National Wildland Significant Fire Potential Outlook National Interagency Fire Center Predictive Services Issued: September, 2007 Wildland Fire Outlook September through December 2007 Significant fire
Manfred A. Lange Energy, Environment and Water Research Center The Cyprus Institute. M. A. Lange 11/26/2008 1
 Manfred A. Lange Energy, Environment and Water Research Center The Cyprus Institute M. A. Lange 11/26/2008 1 Background and Introduction Mediterranean Climate Past and Current Conditions Tele-Connections
Climate Change Scenarios Dr. Elaine Barrow Canadian Climate Impacts Scenarios (CCIS) Project
 Project") Climate Change Scenarios Dr. Elaine Barrow Canadian Climate Impacts Scenarios (CCIS) Project What is a scenario? a coherent, internally consistent and plausible description of a possible future state of
Climate Change Scenarios Dr. Elaine Barrow Canadian Climate Impacts Scenarios (CCIS) Project What is a scenario? a coherent, internally consistent and plausible description of a possible future state of
Climate changes in Finland, but how? Jouni Räisänen Department of Physics, University of Helsinki
 Climate changes in Finland, but how? Jouni Räisänen Department of Physics, University of Helsinki 19.9.2012 Outline Some basic questions and answers about climate change How are projections of climate
Climate Dataset: Aitik Closure Project. November 28 th & 29 th, 2018
 1 Climate Dataset: Aitik Closure Project November 28 th & 29 th, 2018 Climate Dataset: Aitik Closure Project 2 Early in the Closure Project, consensus was reached to assemble a long-term daily climate
Malawi. General Climate. UNDP Climate Change Country Profiles. C. McSweeney 1, M. New 1,2 and G. Lizcano 1
 UNDP Climate Change Country Profiles Malawi C. McSweeney 1, M. New 1,2 and G. Lizcano 1 1. School of Geography and Environment, University of Oxford. 2. Tyndall Centre for Climate Change Research http://country-profiles.geog.ox.ac.uk
The Victorian Climate Initiative: VicCI
 The Victorian Climate Initiative: VicCI Bertrand Timbal M. Ekstrom (CLW), H. Hendon (BoM) + VicCI scientists S. Fiddes (Melb. Uni.), M. Griffiths (BoM) Centre for Australian Weather and Climate Research
Climate Change Assessment in Gilan province, Iran
 International Journal of Agriculture and Crop Sciences. Available online at www.ijagcs.com IJACS/2015/8-2/86-93 ISSN 2227-670X 2015 IJACS Journal Climate Change Assessment in Gilan province, Iran Ladan
Weather and Climate Summary and Forecast Winter
 Weather and Climate Summary and Forecast Winter 2016-17 Gregory V. Jones Southern Oregon University December 5, 2016 Well after an October that felt more like November, we just finished a November that
Changes in Frequency of Extreme Wind Events in the Arctic
 Changes in Frequency of Extreme Wind Events in the Arctic John E. Walsh Department of Atmospheric Sciences University of Illinois 105 S. Gregory Avenue Urbana, IL 61801 phone: (217) 333-7521 fax: (217)
Global warming and Extremes of Weather. Prof. Richard Allan, Department of Meteorology University of Reading
 Global warming and Extremes of Weather Prof. Richard Allan, Department of Meteorology University of Reading Extreme weather climate change Recent extreme weather focusses debate on climate change Can we
DOWNLOAD PDF SCENERY OF SWITZERLAND, AND THE CAUSES TO WHICH IT IS DUE.
 Chapter 1 : The Scenery of Switzerland (Sir John Lubbock - ) (ID) ebay The scenery of Switzerland and the causes to which it is due / Related Titles Series: Collection of British authors ; vol. These diseases
Climate Variability and Change Past, Present and Future An Overview
 Climate Variability and Change Past, Present and Future An Overview Dr Jim Salinger National Institute of Water and Atmospheric Research Auckland, New Zealand INTERNATIONAL WORKSHOP ON REDUCING VULNERABILITY
The 1986 Southeast Drought in Historical Perspective
 The Southeast Drought in Historical Perspective Abstract The dry and hot weather in the southeast United States during the first seven months of caused record drought. The agricultural and hydrological
Jennifer Jacobs, Bryan Carignan, and Carrie Vuyovich. Environmental Research Group University of New Hampshire
 Jennifer Jacobs, Bryan Carignan, and Carrie Vuyovich Environmental Research Group University of New Hampshire New Hampshire Water Conference March 21, 2014 Funding Provided By: NASA 1 Precipitation is
QUANTIFYING CHANGES IN EXTREME PRECIPITATION AT HOUSTON AND OKLAHOMA CITY BY USING THE CANADIAN REGIONAL CLIMATE MODEL (CRCM)
") QUANTIFYING CHANGES IN EXTREME PRECIPITATION AT HOUSTON AND OKLAHOMA CITY BY USING THE CANADIAN REGIONAL CLIMATE MODEL (CRCM) Daniel J. Brouillette 1, Yang Hong 2, Lu Liu 2 1 National Weather Center Research
QUANTIFYING CHANGES IN EXTREME PRECIPITATION AT HOUSTON AND OKLAHOMA CITY BY USING THE CANADIAN REGIONAL CLIMATE MODEL (CRCM) Daniel J. Brouillette 1, Yang Hong 2, Lu Liu 2 1 National Weather Center Research
Operational event attribution
 Operational event attribution Peter Stott, NCAR, 26 January, 2009 August 2003 Events July 2007 January 2009 January 2009 Is global warming slowing down? Arctic Sea Ice Climatesafety.org climatesafety.org
SHAPING OUR FUTURE: THE CLIMATE CHALLENGE KS3 LESSON 1 TEACHER GUIDE HOW IS OUR CLIMATE CHANGING?
 SHAPING OUR FUTURE: THE CLIMATE CHALLENGE KS3 LESSON 1 TEACHER GUIDE HOW IS OUR CLIMATE CHANGING? KS3 LESSON 1 TEACHER GUIDE HOW IS OUR CLIMATE CHANGING? Learning objective: To understand, through the
Climate Change Scenarios in Southern California. Robert J. Allen University of California, Riverside Department of Earth Sciences
 Climate Change Scenarios in Southern California Robert J. Allen University of California, Riverside Department of Earth Sciences Overview Climatology of Southern California Temperature and precipitation
Introduction to Global Warming
 Introduction to Global Warming Cryosphere (including sea level) and its modelling Ralf GREVE Institute of Low Temperature Science Hokkaido University Sapporo, 2010.09.14 http://wwwice.lowtem.hokudai.ac.jp/~greve/
Arctic sea ice response to atmospheric forcings with varying levels of anthropogenic warming and climate variability
 GEOPHYSICAL RESEARCH LETTERS, VOL. 37,, doi:10.1029/2010gl044988, 2010 Arctic sea ice response to atmospheric forcings with varying levels of anthropogenic warming and climate variability Jinlun Zhang,
Chapter outline. Reference 12/13/2016
 Chapter 2. observation CC EST 5103 Climate Change Science Rezaul Karim Environmental Science & Technology Jessore University of science & Technology Chapter outline Temperature in the instrumental record
Suriname. General Climate. Recent Climate Trends. UNDP Climate Change Country Profiles. Temperature. C. McSweeney 1, M. New 1,2 and G.
 UNDP Climate Change Country Profiles Suriname C. McSweeney 1, M. New 1,2 and G. Lizcano 1 1. School of Geography and Environment, University of Oxford. 2. Tyndall Centre for Climate Change Research http://country-profiles.geog.ox.ac.uk
Effects of Sea Level Rise in Florida
 Abstract International Research Journal of Earth Sciences ISSN 2321 2527 Int. Res.J. Earth Sci. Effects of Sea Level Rise in Florida Praveen Khanna, Udaya Kumar and Riyaz Ahamed Osankhan Department of
Weather and Climate Summary and Forecast November 2017 Report
 Weather and Climate Summary and Forecast November 2017 Report Gregory V. Jones Linfield College November 7, 2017 Summary: October was relatively cool and wet north, while warm and very dry south. Dry conditions
Cape Verde. General Climate. Recent Climate. UNDP Climate Change Country Profiles. Temperature. Precipitation
 UNDP Climate Change Country Profiles C. McSweeney 1, M. New 1,2 and G. Lizcano 1 1. School of Geography and Environment, University of Oxford. 2. Tyndall Centre for Climate Change Research http://country-profiles.geog.ox.ac.uk
Weather and Climate Summary and Forecast March 2018 Report
 Weather and Climate Summary and Forecast March 2018 Report Gregory V. Jones Linfield College March 7, 2018 Summary: The ridge pattern that brought drier and warmer conditions from December through most
2011 National Seasonal Assessment Workshop for the Eastern, Southern, & Southwest Geographic Areas
 2011 National Seasonal Assessment Workshop for the Eastern, Southern, & Southwest Geographic Areas On January 11-13, 2011, wildland fire, weather, and climate met virtually for the ninth annual National
Cuba. General Climate. Recent Climate Trends. UNDP Climate Change Country Profiles. Temperature. C. McSweeney 1, M. New 1,2 and G.
 UNDP Climate Change Country Profiles Cuba C. McSweeney 1, M. New 1,2 and G. Lizcano 1 1. School of Geography and Environment, University of Oxford. 2. Tyndall Centre for Climate Change Research http://country-profiles.geog.ox.ac.uk
A Tutorial on Climate Change Science: The. 4 th National Climate Assessment CLIMATE SCIENCE. Don Wuebbles
 CLIMATE SCIENCE S P E C I A L R E P O R T A Tutorial on Climate Change Science: The Fourth National Climate Assessment Volume I 4 th National Climate Assessment Don Wuebbles Department of Atmospheric Sciences
Future pattern of Asian drought under global warming scenario
 Future pattern of Asian drought under global warming scenario Kim D.W., Byun H.R., Lee S.M. in López-Francos A. (ed.). Drought management: scientific and technological innovations Zaragoza : CIHEAM Options
FUTURE PROJECTIONS OF PRECIPITATION CHARACTERISTICS IN ASIA
 FUTURE PROJECTIONS OF PRECIPITATION CHARACTERISTICS IN ASIA AKIO KITOH, MASAHIRO HOSAKA, YUKIMASA ADACHI, KENJI KAMIGUCHI Meteorological Research Institute Tsukuba, Ibaraki 305-0052, Japan It is anticipated
Weather and Climate Summary and Forecast March 2019 Report
 Weather and Climate Summary and Forecast March 2019 Report Gregory V. Jones Linfield College March 2, 2019 Summary: Dramatic flip from a mild winter to a top five coldest February on record in many locations
Projected changes in rainfall and temperature over Greater Horn of Africa (GHA) in different scenarios. In Support of:
 in different scenarios. In Support of:") Projected changes in rainfall and temperature over Greater Horn of Africa (GHA) in different scenarios In Support of: Planning for Resilience in East Africa through Policy, Adaptation, Research, and Economic
Projected changes in rainfall and temperature over Greater Horn of Africa (GHA) in different scenarios In Support of: Planning for Resilience in East Africa through Policy, Adaptation, Research, and Economic
STATE OF THE CLIMATE IN 2017
 STATE OF THE CLIMATE IN 2017 Today s Presenters Jeff Rosenfeld Editor-In-Chief, Bulletin of the American Meteorological Society Boston, MA Deke Arndt Chief, Monitoring Branch, NOAA s National Centers for
Climate variability and the expected. Croatia
 Climate variability and the expected effects of climate change scenario in Croatia Krešo Pandžić Meteorological and Hydrological Service Croatia National roundtable Adaptation to climate change, Zagreb,
Climate Change Models: The Cyprus Case
 Climate Change Models: The Cyprus Case M. Petrakis, C. Giannakopoulos, G. Lemesios National Observatory of Athens AdaptToClimate 2014, Nicosia Cyprus Climate Research (1) Climate is one of the most challenging
Global Climate Change
 Global Climate Change Overview: Students will learn about global climate change, what causes global warming, and scientific projections about climate change in the near future. Levels V-VI Grades 9-12