Experiments with Statistical Downscaling of Precipitation for South Florida Region: Issues & Observations
|
|
|
- Camron O’Neal’
- 6 years ago
- Views:
Transcription
1 Experiments with Statistical Downscaling of Precipitation for South Florida Region: Issues & Observations Ramesh S. V. Teegavarapu Aneesh Goly Hydrosystems Research Laboratory (HRL) Department of Civil, Environmental and Geomatics Engineering, Florida Atlantic University, Boca Raton, FL, Everglades Workshop, March 29, 212
2 Statistical Downscaling From a drop of water a logician could predict an Atlantic or a Niagara - Sir Arthur C. Doyle. ϕ ρσβ Illustration source: Teegavarapu (212)
3 Downscaling methods o Main Focus o Statistical downscaling of Precipitation o Florida and South Florida. o Spatial Resolution o Point and Different Grid Scales o Temporal Resolution o Monthly and Daily (work in progress) o Analyses o Evaluation of different Methodologies o Comparative evaluation of other methodologies (e.g., BCSD based data) o Optimal Predictor sets o Use of available traditional and machine learning techniques to develop transfer functions o Downscaling skill use of performance measures o Extreme Events o Methodologies to handle stationarity issues
4 Point and Grid Scale Downscaling (GCM and NCEP) Point scale downscaling directly from GCM NCEP GCM NCEP Grid to Point Scale Grid scale downscaling directly from GCM NCEP GCM Grid to NCEP Grid Scale Rain gage /Observation Site GCM Grid Centers GCM NCEP Grid Centers
5 Grid Scale Downscaling (NCEP) NCEP NCEP Grid to Point Scale GCM NCEP GCM Grid to NCEP Grid Scale Rain gage /Observation Site GCM GCM Grid Centers NCEP Grid Centers
6 NCEP GCM Modeling Approach NCEP Variable Data (Predictors) [NCEP grid scale] Point/Grid Observations (Predictand) Functional Relationship Development o Fixed functional form o Function-Free form GCM Variable Data (Predictors) [GCM grid scale] Spatial Interpolation GCM Variable Data at [NCEP grid scale] Predictors Predictand Predictor Relationship Point/Grid Predictions/Projections (Predictand) o Selection of Predictor variable (at NCEP and GCM grid Scales) o Principal Component Analysis (PCA) o Principal Component Based Regression o Multiple Linear Regression (MLR) o MLR Positive Coefficients (MLRP) o Stepwise Regression (SWR) o Fuzzy Clustering Method (FCM)* o Artificial Neural Networks (ANN) o Support Vector Machine (SVM)
7 Direct GCM based Approach GCM Variable Data (Predictors) [GCM grid scale] Point/Grid Observations (Predictand) Functional Relationship Development o Fixed functional form o Function-Free form GCM Variable Data (Predictors) [GCM grid scale] Predictors Predictand Predictor Relationship Point/Grid Predictions/Projections (Predictand) o Selection of Predictor variables (at GCM grid scale) o Principal Component Analysis (PCA) o Principal Component Based Regression (PCR) o Multiple Linear Regression (MLR) o MLR Positive Coefficients (MLRP) o Stepwise Regression (SWR) o Fuzzy C-Means Clustering Method (FCM) o Artificial Neural Networks (ANN) o Support Vector Machine (SVM)
8 Functional Forms for Transfer Functions. o o o o o Pre-Fixed Functional Forms o Regression o Variants Stepwise. o Negative values. o Nonlinear Optimization with Positive Coefficients. o Dummy Variables (Binary Variables). Function Free Forms o Artificial Neural Networks o Negative Values o Over Fitting Issues Fuzzy C-Means Clustering (FCM) o Clusters of data, evaluation of membership functions, regression Support Vector Machines (SVM) o Classification of data and regression using a machine learning technique o Negative Vlaues Evaluation is required for different time-slices.
9 Nonlinear Optimization with Positive Coefficients. Nonnegative constraints requirements to obtain positive weights can be enforced using the nonlinear least square constraint formulation defined by equation. Minimize Subject to:. G is the x j matrix of values, is the matrix j x 1 of, weight values and H is the matrix of no x 1 values of observed precipitation data at a point or in a grid, The formulation minimizes the norm given by the above equation with constraint on the weights
10 Fuzzy C Means Clustering (FCM) FCM clustering is used with an assumption that there exists classes or clusters in predictors, which may lead to different relationships between predictors and rainfall for different clusters. To improve the performance of the statistical downscaling model, an approach with clustering is coupled with the model. FCM has improved the model performance compared to PCA-based regression alone., In the fuzzy clustering technique, the crisp classification is extended to fuzzy classification using the concept of membership values. Membership values are assigned to the various data points for each fuzzy set/cluster/class. 1,2,.
11 Specific Issues o Stationarity o Statistical relationship between the predictor and the predictand does not change over time o Florida experienced land use changes over the last few decades that may render stationarity assumption invalid. o The plan to capture future patterns from scenarios via exploring temporal analogues from the past and develop corresponding statistical relationships. o This is being explored and experimented in the current research integrating classification approaches. o Evaluation of how well the large scale gridded data of a specific variable predicts the local variable (of same parameter) o Predictor Variable Selection o Physics inspired o Correlation Selection o All available variables with PCA

12 GCM Data Details GCM Details: Modeling Agency : Canadian Centre for Climate Modelling and Analysis Model and Version: CGCM3.1/T63 Model Scenario: IPCC SRES A1B Experiment Spatial Resolution: 2.81 o x 2.81 o Temporal resolution : day, Month Time period : : IPCC SRES A1B 72 ppm stabilization experiment with CGCM3.1/T63 for years is selected for this analysis. Monthly values from Jan 21 to Dec 21 is available. IPCC 2-th Century experiment monthly values with CGCM3.1/T63 for years is available.

13 NCEP Reanalysis Data Details NCEP Details: Agency : National Center for Environmental Protection Available through: Physical Sciences Division: Data Management NOAA/ESRL/PSD Model and Version: Reanalysis 1 Spatial Resolution: 2.5 o x 2.5 o Temporal resolution : day, Month Time period :


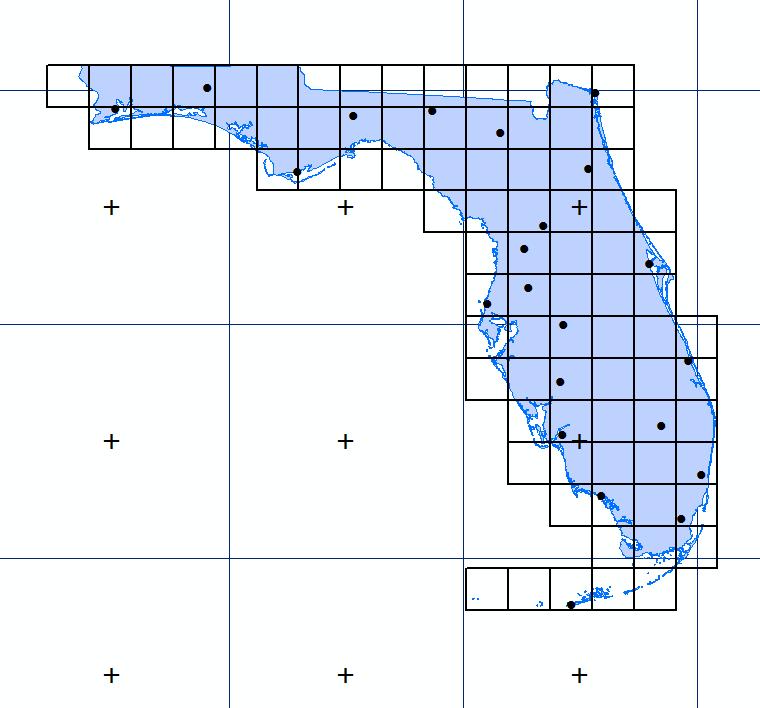
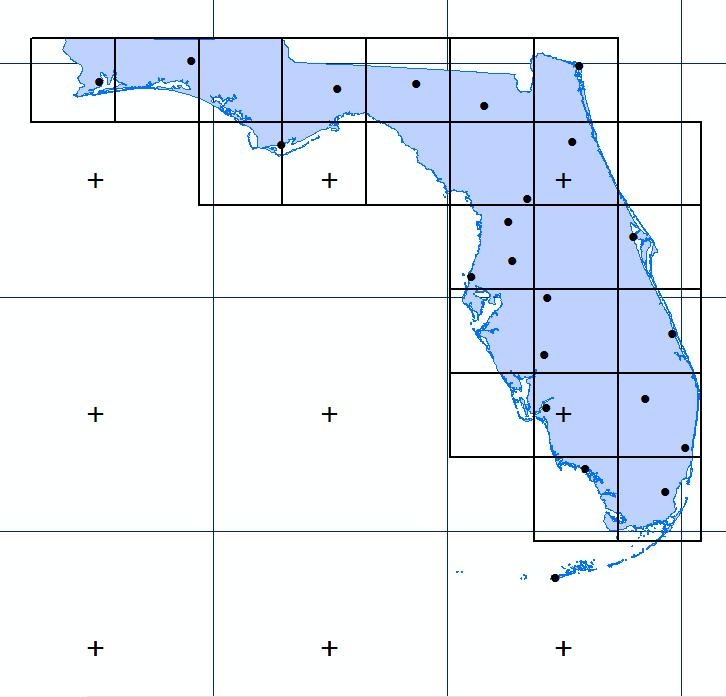
14 NCEP GCM Results Point Scale Downscaling Grids & Grid Centres USHCN Stations
15 GPCC Grid Specifications GPCC.5 Degree GPCC 1 Degree

 Observed Data")

16 BCSD Grid Specifications o o o o Bias Corrected Statistical Downscaling (BCSD) Observed Data Sets Resolution : 1/8 o Data Availability:

 o GPCC station database (67 2 stations with at least 1")
 Rudolf, B., C. Beck, J. Grieser, U.")
17 Observed Precipitation Products Point and Grid based o United States Historical Climatology Network (USHCN) o 22 Stations spread through out Florida o Daily and Monthly data for both precipitation and temperature. o Data Availability: o Global Precipitation Climatology Center (GPCC) o GPCC station database (67 2 stations with at least 1 years of data) available at the time of analysis. Gauge based gridded monthly precipitation available in 2.5 x 2.5, 1. x 1.,.5 x.5, and.25 x.25 resolution) Rudolf, B., C. Beck, J. Grieser, U. Schneider (25): Global Precipitation Analysis Products. Global Precipitation Climatology Centre (GPCC), DWD,
, 3237 3251")
18 Gridded Observed Meteorological Data BCSD Grid Resolution o Gridded Observed Meteorological Data o 1/8 o Spatial Resolution o Period: o Maurer, E.P., A.W. Wood, J.C. Adam, D.P. Lettenmaier, and B. Nijssen, 22, A Long Term Hydrologically Based Data Set of Land Surface Fluxes and States for the Conterminous United States, J. Climate 15(22),
19 Predictor Predictand Correlations 2 Geopotential Height, 5mb - Precipitation 14 Mean Sea Level Pressure - Precipitation 16 Specific Humidity, 85mb - Precipitation Correlation Coefficient Correlation Coefficient Correlation Coefficient 18 U-wind - Precipitation 18 V-wind - Precipitation Correlation Coefficient Correlation Coefficient
20 Bias Correction Spatial Disaggregation (BCSD) GCM Simulation of 2 th Century Climate P T Estimation of Bias Corrections Adjusted GCM Data (Spatial resolution : 2 o ) P T Observed Mean Monthly Values (Spatial resolution : 2 o ) P T 2 th Century Observations P T Spatial Aggregation (from 1/8 o to 2 o ) Application of Bias corrections Spatial Factors (Spatial resolution : 2 o ) Spatial Interpolation Spatial Factors (Spatial resolution : 1/8 o ) P T Precipitation Temperature GCM Simulation of 21 st Century Climate Downscaled GCM Data (Spatial resolution : 1/8 o )
21 Models Model Number Modeling Group and Country of Origin WCRP CMIP3 I.D. 1 Bjerknes Centre for Climate Research BCCR-BCM2. 2 Canadian Centre for Climate Modeling & Analysis CGCM3.1 (T47) 3 Meteo-France / Centre National de Recherches Meteorologiques, France CNRM-CM3 4 CSIRO Atmospheric Research, Australia CSIRO-Mk3. 5 US Dept. of Commerce / NOAA / Geophysical Fluid Dynamics Laboratory, USA GFDL-CM1. 6 US Dept. of Commerce / NOAA / Geophysical Fluid Dynamics Laboratory, USA GFDL-CM2. 7 NASA / Goddard Institute for Space Studies, USA GISS-ER 8 Institute for Numerical Mathematics, Russia INM-CM3. 9 Institut Pierre Simon Laplace, France IPSL-CM Center for Climate System Research (The University of Tokyo) National Institute for Environmental Studies, and Frontier Research Center for Global Change (JAMSTEC), Japan Meteorological Institute of the University of Bonn, Meteorological Research Institute of KMA Max Planck Institute for Meteorology, Germany MIROC3.2 (medres) ECHO-G ECHAM5/ MPI-OM 13 Meteorological Research Institute, Japan MRI-CGCM National Center for Atmospheric Research, USA CCSM3 15 National Center for Atmospheric Research, USA PCM 16 Hadley Centre for Climate Prediction and Research / Met Office, UK UKMO-HadCM3
 Goly and Teegavarapu")
22 Performance Measures, Selection of Models Skill of Models Precipitation 1 Observed Downscaled GCM Cumulative Probability D 1 O 1 D 2 O 2 Variable of interest (magnitude) Goly and Teegavarapu (212)
23 Performance Measures for Skill Assessment o o o o o o Mean absolute error (MAE): absolute difference in precipitation totals based on GCM based and historical data. Correlation coefficient (ρ): correlation between historical and GCM based precipitation data. Absolute Probabilistic Error (APE): absolute difference in values based on Cumulative density plots based on historical and GCM based data. Probabilistic Correlation: correlation based on magnitudes from historical and GCM based data obtained from pre specified non exceedence probabilities. Absolute Deviations in Annual Values: absolute deviation in annual values as opposed to monthly deviations (GCM based temporal resolutions). Absolute Deviation in Month/Year Ratios: absolute deviation in ratios.
24 Correlations based on USHCN and BCSD downscaling results for different models (Temperature) Station \Climate Model BCCR BCM2. CGCM CNRM CM CSIRO Mk GFDL CM GISS ER INM CM IPSL CM MIROC ECHO G ECHAM5 MRI CGCM CCSM3 PCM UKMO HadCM
25 Model Rankings based on Different Performance Measures (Temperature) Model RMSE MAE Monthly Corr Probabilistic Error Diff in Yearly Means Probabilistic Corr Diff in Ratios (Month/Year) Total Weights Rank bccr_bcm2_ cccma_cgcm3_ cnrm_cm csiro_mk3_ gfdl_cm2_ giss_model_e_r inmcm3_ ipsl_cm miroc3_2_medres miub_echo_g mpi_echam mri_cgcm2_3_2a ncar_ccsm3_ ncar_pcm ukmo_hadcm
26 Correlations based on USHCN and BCSD downscaling results for different models (Precipitation) Station \Climate Model BCCR BCM2. CGCM CNRM CM CSIRO Mk GFDL CM INM GISS ER CM IPSL CM MIROC ECHO G ECHAM5 MRI CGCM CCSM3 PCM UKMO HadCM
27 Model Rankings based on Different Performance Measures (Precipitation) Model RMSE MAE Monthly Corr Probabilistic Error Diff in Yearly Means Probabilistic Corr Diff in Ratios (Month/Year) Total Weights bccr_bcm2_ cccma_cgcm3_ cnrm_cm csiro_mk3_ gfdl_cm2_ giss_model_e_r inmcm3_ ipsl_cm Rank miroc3_2_medres miub_echo_g mpi_echam mri_cgcm2_3_2a ncar_ccsm3_ ncar_pcm ukmo_hadcm
28 NCEP based Model Calibration Data Estimated Precipitation (mm) Cumulative Probability Observed Estimated Observed Precipitation (mm) Precipitation (mm) Station # 18
29 7 6 Precipitation (mm) Observed Estimated
30 Test Data based on NCEP Model Observed Estimated 6 5 Cumulative Probability Estimated Precipitation (mm) Precipitation (mm) Observed Precipitation (mm)
31 GCM based Testing Observed Estimated Estimated Precipitation (mm) Observed Precipitation (mm) Cumulative Probability Precipitation (mm)
32 Cumulative Probability Empirical CDF Observed Downscaled Precipitation Precipitation Observed Downscaled Downscaled Precipitation Downscaled Precipitation Observed Precipitation Observed Precipitation GCM based Model (calibration) using BCSD grid resolution
33 1.9 Empirical CDF Observed Downscaled Cumulative Probability Precipitation Precipitation Observed Downscaled Downscaled Precipitation Observed Precipitation Downscaled Precipitation Observed Precipitation GCM based Model (Testing)
34 Comparison of Downscaling Methods (correlations) Cumulative Probability BCSD Multi-Linear Regression Positive Coefficients Regression Step wise Regression Support Vector Machine Correlations
35 Future Projections For Precipitation NCEP GCM based Model CDF Precipitation
36 Conclusions o Different methods are experimented for dowscaling precipitation data in Florida. o NCEP GCM and GCM based downscaling methods are evaluated at point and different grid scale resolutions for Precipitation. o The grid scale resolutions include : 1/8, ½ and 1 Degree resolutions. o Transfer functions linking GCM scale and grid scale predictors in NCEP GCM approach is critical in obtaining improved downscaling values at different resolutions. o The downscaling models provided improved precipitation estimates (based on Canadian Centre for Climate Modeling and Analysis model CGCM CGCM3.1/T63 Model ) compared to those from BCSD approach at different stations in Florida. It is important to note that no bias corrections have been applied to the outputs of downscaling methods. o A search for optimal selection of variables (as predictors) is on and methodologies are planned for selection of optimal number and type.
Supplementary Figure S1: Uncertainty of runoff changes Assessments of. R [mm/yr/k] for each model and the ensemble mean.
![Supplementary Figure S1: Uncertainty of runoff changes Assessments of. R [mm/yr/k] for each model and the ensemble mean.](/thumbs/91/104794017.jpg "Supplementary Figure S1: Uncertainty of runoff changes Assessments of. R [mm/yr/k] for each model and the ensemble mean.") Supplementary Figure S1: Uncertainty of runoff changes Assessments of R [mm/yr/k] for each model and the ensemble mean. 1 Supplementary Figure S2: Schematic diagrams of methods The top panels show uncertainty
Supplementary Figure S1: Uncertainty of runoff changes Assessments of R [mm/yr/k] for each model and the ensemble mean. 1 Supplementary Figure S2: Schematic diagrams of methods The top panels show uncertainty
NARCliM Technical Note 1. Choosing GCMs. Issued: March 2012 Amended: 29th October Jason P. Evans 1 and Fei Ji 2
 NARCliM Technical Note 1 Issued: March 2012 Amended: 29th October 2012 Choosing GCMs Jason P. Evans 1 and Fei Ji 2 1 Climate Change Research Centre, University of New South Wales, Sydney, Australia 2 New
The 20th century warming and projections for the 21st century climate in the region of the Ukrainian Antarctic station Akademik Vernadsky
 The 20th century warming and projections for the 21st century climate in the region of the Ukrainian Antarctic station Akademik Vernadsky S.V.Krakovska, G.A.Djukel Ukrainian Hydrometeorological Institute,
SUPPLEMENTARY INFORMATION
 1 Supplementary Methods Downscaling of global climate model data Global Climate Model data were dynamically downscaled by the Regional Climate Model (RCM) CLM 1 (http://clm.gkss.de/, meanwhile renamed
Statistical downscaling of multivariate wave climate using a weather type approach
 COWPLIP Workshop on Coordinated Global Wave Climate Projections Statistical downscaling of multivariate wave climate using a weather type approach Melisa Menendez, Fernando J. Mendez, Cristina Izaguirre,
INVESTIGATING THE SIMULATIONS OF HYDROLOGICAL and ENERGY CYCLES OF IPCC GCMS OVER THE CONGO AND UPPER BLUE NILE BASINS
 INVESTIGATING THE SIMULATIONS OF HYDROLOGICAL and ENERGY CYCLES OF IPCC GCMS OVER THE CONGO AND UPPER BLUE NILE BASINS Mohamed Siam, and Elfatih A. B. Eltahir. Civil & Environmental Engineering Department,
Multi-model climate change scenarios for southwest Western Australia and potential impacts on streamflow
 16 Quantification and Reduction of Predictive Uncertainty for Sustainable Water Resources Management (Proceedings of Symposium HS2004 at IUGG2007, Perugia, July 2007). IAHS Publ. 313, 2007. Multi-model
Future freshwater stress for island populations
 Future freshwater stress for island populations Kristopher B. Karnauskas, Jeffrey P. Donnelly and Kevin J. Anchukaitis Summary: Top left: Overview map of the four island stations located in the U.S. state
SUPPLEMENTARY INFORMATION
 SUPPLEMENTARY INFORMATION DOI: 10.1038/NGEO1189 Different magnitudes of projected subsurface ocean warming around Greenland and Antarctica Jianjun Yin 1*, Jonathan T. Overpeck 1, Stephen M. Griffies 2,
Climate Change Scenario, Climate Model and Future Climate Projection
 Training on Concept of Climate Change: Impacts, Vulnerability, Adaptation and Mitigation 6 th December 2016, CEGIS, Dhaka Climate Change Scenario, Climate Model and Future Climate Projection A.K.M. Saiful
Climate Downscaling 201
 Climate Downscaling 201 (with applications to Florida Precipitation) Michael E. Mann Departments of Meteorology & Geosciences; Earth & Environmental Systems Institute Penn State University USGS-FAU Precipitation
Supplement of Insignificant effect of climate change on winter haze pollution in Beijing
 Supplement of Atmos. Chem. Phys., 18, 17489 17496, 2018 https://doi.org/10.5194/acp-18-17489-2018-supplement Author(s) 2018. This work is distributed under the Creative Commons Attribution 4.0 License.
Gennady Menzhulin, Gleb Peterson and Natalya Shamshurina
 Availability of the New Climate Models to Reproduce the Historical Climate Variations: Whether the Climate Changes Scenarios Recommended in the 4 th IPCC Report can be Ranked by their Accuracy? Gennady
Changes in the El Nino s spatial structure under global warming. Sang-Wook Yeh Hanyang University, Korea
 Changes in the El Nino s spatial structure under global warming Sang-Wook Yeh Hanyang University, Korea Changes in El Nino spatial structure Yeh et al. (2009) McPhaden et al. (2009) Why the spatial structure
Desert Amplification in a Warming Climate
 Supporting Tables and Figures Desert Amplification in a Warming Climate Liming Zhou Department of Atmospheric and Environmental Sciences, SUNY at Albany, Albany, NY 12222, USA List of supporting tables
Quantifying Uncertainty in Modelled Estimates of Future Extreme Precipitation Events CFCAS Project Progress Report
 Quantifying Uncertainty in Modelled Estimates of Future Extreme Precipitation Events CFCAS Project Progress Report The University of Western Ontario Outline A - Reanalysis Data for UTRW C Quantifying GCM
Drylands face potential threat under 2 C global warming target
 In the format provided by the authors and unedited. SUPPLEMENTARY INFORMATION DOI: 10.1038/NCLIMATE3275 Drylands face potential threat under 2 C global warming target Jianping Huang 1 *, Haipeng Yu 1,
Supporting Information for Relation of the double-itcz bias to the atmospheric energy budget in climate models
 GEOPHYSICAL RESEARCH LETTERS Supporting Information for Relation of the double-itcz bias to the atmospheric energy budget in climate models Ori Adam 1, Tapio Schneider 1,2, Florent Brient 1, and Tobias
Altiplano Climate. Making Sense of 21st century Scenarios. A. Seth J. Thibeault C. Valdivia
 Altiplano Climate Making Sense of 21st century Scenarios A. Seth J. Thibeault C. Valdivia Overview Coupled Model Intercomparison Project (CMIP3) How do models represent Altiplano climate? What do models
Evaluation of CMIP5 Simulated Clouds and TOA Radiation Budgets in the SMLs Using NASA Satellite Observations
 Evaluation of CMIP5 Simulated Clouds and TOA Radiation Budgets in the SMLs Using NASA Satellite Observations Erica K. Dolinar Xiquan Dong and Baike Xi University of North Dakota This talk is based on Dolinar
Snow occurrence changes over the central and eastern United States under future. warming scenarios
 Snow occurrence changes over the central and eastern United States under future warming scenarios Liang Ning 1,2,3* and Raymond S. Bradley 2 1 Key Laboratory of Virtual Geographic Environment of Ministry
Correction notice. Nature Climate Change 2, (2012)
") Correction notice Nature Climate Change 2, 524 549 (2012) Human-induced global ocean warming on multidecadal timescales P. J. Gleckler, B. D. Santer, C. M. Domingues, D.W. Pierce, T. P. Barnett, J. A.
Correction notice Nature Climate Change 2, 524 549 (2012) Human-induced global ocean warming on multidecadal timescales P. J. Gleckler, B. D. Santer, C. M. Domingues, D.W. Pierce, T. P. Barnett, J. A.
Supplemental Material for
 Supplemental Material for Northern North Atlantic Sea Level in CMIP5 Climate Models: Evaluation of Mean State, Variability, and Trends against Altimetric Observations Kristin Richter, a Jan Even Øie Nilsen,
NetCDF, NCAR s climate model data, and the IPCC. Gary Strand NCAR/NESL/CGD
 NetCDF, NCAR s climate model data, and the IPCC Gary Strand NCAR/NESL/CGD NCAR s climate model data A bit of history... 1960s - 1990s Self-designed self-implemented binary formats 1990s-2000s netcdf-3
S16. ASSESSING THE CONTRIBUTIONS OF EAST AFRICAN AND WEST PACIFIC WARMING TO THE 2014 BOREAL SPRING EAST AFRICAN DROUGHT
 S6. ASSESSING THE CONTRIBUTIONS OF EAST AFRICAN AND WEST PACIFIC WARMING TO THE 204 BOREAL SPRING EAST AFRICAN DROUGHT Chris Funk, Shraddhanand Shukla, Andy Hoell, and Ben Livneh This document is a supplement
URBAN DRAINAGE MODELLING
 9th International Conference URBAN DRAINAGE MODELLING Evaluating the impact of climate change on urban scale extreme rainfall events: Coupling of multiple global circulation models with a stochastic rainfall
Twenty-first-century projections of North Atlantic tropical storms from CMIP5 models
 SUPPLEMENTARY INFORMATION DOI: 10.1038/NCLIMATE1530 Twenty-first-century projections of North Atlantic tropical storms from CMIP5 models SUPPLEMENTARY FIGURE 1. Annual tropical Atlantic SST anomalies (top
Geophysical Research Letters. Supporting Information for. Ozone-induced climate change propped up by the Southern Hemisphere oceanic front
 Geophysical Research Letters Supporting Information for Ozone-induced climate change propped up by the Southern Hemisphere oceanic front Authors and affiliations Fumiaki Ogawa, Geophysical Institute, University
Development of Projected Intensity-Duration-Frequency Curves for Welland, Ontario, Canada
 NATIONAL ENGINEERING VULNERABILITY ASSESSMENT OF PUBLIC INFRASTRUCTURE TO CLIMATE CHANGE CITY OF WELLAND STORMWATER AND WASTEWATER INFRASTRUCTURE Final Report Development of Projected Intensity-Duration-Frequency
Projections of harvest disruptions due to. industry under future high and low
 Projections of harvest disruptions due to rainfall for the Australian Sugarcane industry under future high and low emission climate scenarios J. Sexton, Y.L. Everingham a and B. Timbal b Presenting Author:
 http://www.ukm.edu.my/seaclid-cordex/ Addressing future climate change information gaps and data needs in the Southeast Asia region through the Southeast Asia Regional Climate Downscaling (SEACLID)/CORDEX
PUMA toolbox. OCCRI.net Oregon State University. Philip Mote. Philip Mote
 PUMA toolbox Philip Mote OCCRI.net Oregon State University Philip Mote CMIP3 CMIP5 NARCCAP regcpdn WRF delta BCSD CA BCCA MACA etc. observations reanalysis PRISM eractive chemical or biochemical components.
Attribution of observed historical near-surface temperature variations to anthropogenic and natural causes using CMIP5 simulations
 JOURNAL OF GEOPHYSICAL RESEARCH: ATMOSPHERES, VOL. 118, 1, doi:1.1/jgrd.539, 13 Attribution of observed historical near-surface temperature variations to anthropogenic and natural causes using CMIP5 simulations
Supplementary Material: Characterizing Changes in Drought Risk for the United States from Climate Change [1] October 12, 2010
![Supplementary Material: Characterizing Changes in Drought Risk for the United States from Climate Change [1] October 12, 2010](/thumbs/78/77629162.jpg "Supplementary Material: Characterizing Changes in Drought Risk for the United States from Climate Change [1] October 12, 2010") Supplementary Material: Characterizing Changes in Drought Risk for the United States from Climate Change [1] Kenneth Strzepek a, Gary Yohe b, James Neumann c, Brent Boehlert d October 12, 2010 a Visiting
Supplementary Material: Characterizing Changes in Drought Risk for the United States from Climate Change [1] Kenneth Strzepek a, Gary Yohe b, James Neumann c, Brent Boehlert d October 12, 2010 a Visiting
technological change and economic growth more fragmented; slower, higher population growth middle emissions path
 TACCIMO Climate Report: Flathead National Forest 08-28-2013 Table of Contents Introduction Historic National Regional Forest Metadata and Interpretive Guidance Page 1 2 3 6 9 12 Introduction The TACCIMO
Using Multivariate Adaptive Constructed Analogs (MACA) data product for climate projections
 data product for climate projections") Using Multivariate Adaptive Constructed Analogs (MACA) data product for climate projections Maria Herrmann and Ray Najjar Chesapeake Hypoxia Analysis and Modeling Program (CHAMP) Conference Call 2017-04-21
Using Multivariate Adaptive Constructed Analogs (MACA) data product for climate projections Maria Herrmann and Ray Najjar Chesapeake Hypoxia Analysis and Modeling Program (CHAMP) Conference Call 2017-04-21
Impacts of Climate Change on Surface Water in the Onkaparinga Catchment
 Impacts of Climate Change on Surface Water in the Onkaparinga Catchment Final Report Volume 2: Hydrological Evaluation of the CMIP3 and CMIP5 GCMs and the Non-homogenous Hidden Markov Model (NHMM) Westra,
Supplemental material
 Supplemental material The multivariate bias correction algorithm presented by Bürger et al. (2011) is based on a linear transformation that is specified in terms of the observed and climate model multivariate
Using observations to constrain climate project over the Amazon - Preliminary results and thoughts
 Using observations to constrain climate project over the Amazon - Preliminary results and thoughts Rong Fu & Wenhong Li Georgia Tech. & UT Austin CCSM Climate Variability Working Group Session June 19,
On the ability of CMIP3 and CMIP5 models in representing Caribbean current climate
 On the ability of CMIP3 and CMIP5 models in representing Caribbean current climate Sullyandro Oliveira Guimarães sullyandro@gmail.com Alexandre Araújo Costa Domingo Cassain Sales Universidade Estadual
Getting our Heads out of the Clouds: The Role of Subsident Teleconnections in Climate Sensitivity
 Getting our Heads out of the Clouds: The Role of Subsident Teleconnections in Climate Sensitivity John Fasullo Climate Analysis Section, NCAR Getting our Heads out of the Clouds: The Role of Subsident
Decadal shifts of East Asian summer monsoon in a climate. model free of explicit GHGs and aerosols
 Decadal shifts of East Asian summer monsoon in a climate model free of explicit GHGs and aerosols Renping Lin, Jiang Zhu* and Fei Zheng International Center for Climate and Environment Sciences, Institute
Low-level wind, moisture, and precipitation relationships near the South Pacific Convergence Zone in CMIP3/CMIP5 models
 Low-level wind, moisture, and precipitation relationships near the South Pacific Convergence Zone in CMIP3/CMIP5 models Matthew J. Niznik and Benjamin R. Lintner Rutgers University 25 April 2012 niznik@envsci.rutgers.edu
Supplementary Figure 1 A figure of changing surface air temperature and top-1m soil moisture: (A) Annual mean surface air temperature, and (B) top
 Annual mean surface air temperature, and (B) top") Supplementary Figure 1 A figure of changing surface air temperature and top-1m soil moisture: (A) Annual mean surface air temperature, and (B) top 1-m soil moisture averaged over California from CESM1.
Supplementary Figure 1 A figure of changing surface air temperature and top-1m soil moisture: (A) Annual mean surface air temperature, and (B) top 1-m soil moisture averaged over California from CESM1.
Physically-based risk assessment of hurricane storm surge in a changing climate
 Physically-based risk assessment of hurricane storm surge in a changing climate Ning Lin Princeton University Department of Civil and Environmental Engineering Hurricane Ike 5 Year Workshop Rice University,
Forecasting Local Climate for Policy Analysis
 Public Disclosure Authorized Policy Research Working Paper 54 WPS54 Public Disclosure Authorized Public Disclosure Authorized Forecasting Local Climate for Policy Analysis A Pilot Application for Ethiopia
Supplementary Information for Impacts of a warming marginal sea on torrential rainfall organized under the Asian summer monsoon
 1 2 3 4 5 6 7 8 9 10 11 Supplementary Information for Impacts of a warming marginal sea on torrential rainfall organized under the Asian summer monsoon 12 13 14 Atsuyoshi Manda 1, Hisashi Nakamura 2,4,
Projections of Future Drought in the Continental United States and Mexico
 DECEMBER 2011 W E H N E R E T A L. 1359 Projections of Future Drought in the Continental United States and Mexico MICHAEL WEHNER Lawrence Berkeley National Laboratory, Berkeley, California DAVID R. EASTERLING,
SEACLID/CORDEX Southeast Asia: A Regional Initiative to Provide Regional Climate Change Information and Capacity Building
 SEACLID/CORDEX Southeast Asia: A Regional Initiative to Provide Regional Climate Change Information and Capacity Building Liew Ju Neng SEACLID/CORDEX Southeast Asia School of Environment and Natural Sciences
Introduction to Climate Projections and Analysis
 Introduction to Climate Projections and Analysis Jack Katzfey, CSIRO Oceans and Atmosphere 1 June 2016 The project is being implemented by the Asian Development Bank through the technical assistance (TA
Zona Norte 3. Zona Centro 2. Zona Centro 1. Zona Centro 3 Zona Sur
 Zonas de validación 30 Zona Norte 1 25 Zona Norte 2 Zona Norte 3 Zona Centro 1 Zona Centro 2 20 Zona Centro 3 Zona Sur 1 Zona Sur 2 Zona Sur 3 15-115 -110-105 -100-95 -90 IPCC CGCMs vs CRU (obs) Precipitación
Future population exposure to US heat extremes
 Outline SUPPLEMENTARY INFORMATION DOI: 10.1038/NCLIMATE2631 Future population exposure to US heat extremes Jones, O Neill, McDaniel, McGinnis, Mearns & Tebaldi This Supplementary Information contains additional
SUPPLEMENTARY INFORMATION
 SUPPLEMENTARY INFORMATION DOI: 10.1038/NGEO2517 Two distinct influences of Arctic warming on cold winters over North America and East Asia Jong-Seong Kug 1, Jee-Hoon Jeong 2*, Yeon-Soo Jang 1, Baek-Min
Forcing of anthropogenic aerosols on temperature trends of the subthermocline
 Forcing of anthropogenic aerosols on temperature trends of the subthermocline southern Indian Ocean Tim Cowan* 1,2, Wenju Cai 1, Ariaan Purich 1, Leon Rotstayn 1 and Matthew H. England 2 1 CSIRO Marine
S. E. PERKINS. Department of Physical Geography, Macquarie University, Sydney, Australia A. J. PITMAN
 4356 J O U R N A L O F C L I M A T E VOLUME 20 Evaluation of the AR4 Climate Models Simulated Daily Maximum Temperature, Minimum Temperature, and Precipitation over Australia Using Probability Density
What is one-month forecast guidance?
 What is one-month forecast guidance? Kohshiro DEHARA (dehara@met.kishou.go.jp) Forecast Unit Climate Prediction Division Japan Meteorological Agency Outline 1. Introduction 2. Purposes of using guidance
Changes in Timing of the South American Monsoon?
 Changes in Timing of the South American Monsoon? A. Seth, UConn, Storrs M. Rojas, U Chile, Santiago S. Rauscher, ICTP, Trieste AAG 8, Boston IPCC Projections South American Monsoon analysis: - Vera et
Projection Results from the CORDEX Africa Domain
 Projection Results from the CORDEX Africa Domain Patrick Samuelsson Rossby Centre, SMHI patrick.samuelsson@smhi.se Based on presentations by Grigory Nikulin and Erik Kjellström CORDEX domains over Arab
Future Projections of Global Wave Climate by Multi-SST and Multi-Physics Ensemble Experiments. Tomoya Shimura
 Future Projections of Global Wave Climate by Multi-SST and Multi-Physics Ensemble Experiments Graduate School of Engineering, Nobuhito Mori, Tomohiro Yasuda and Hajime Mase Disaster Prevention Research
Karonga Climate Profile: Full Technical Version
 Karonga Climate Profile: Full Technical Version Prepared by: University of Cape Town November 2017 For enquiries regarding this Climate Profile, please contact Lisa van Aardenne (lisa@csag.uct.ac.za) or
The impact of climate change on wind energy resources
 The impact of climate change on wind energy resources Prof. S.C. Pryor 1, Prof. R.J. Barthelmie 1,2, Prof. G.S. Takle 3 and T. Andersen 3 1 Atmospheric Science Program, Department of Geography, Indiana
North Pacific Decadal Variability and Climate Change in the IPCC AR4 Models
 15 JUNE 2011 F U R T A D O E T A L. 3049 North Pacific Decadal Variability and Climate Change in the IPCC AR4 Models JASON C. FURTADO* AND EMANUELE DI LORENZO School of Earth and Atmospheric Sciences,
Chapter 8: Climate Models and Their Evaluation
 First-Order Draft Chapter IPCC WG Fourth Assessment Report Chapter : Climate Models and Their Evaluation Coordinating Lead Authors: David Randall, Richard Wood Lead Authors: Sandrine Bony, Robert Colman,
SUPPLEMENTARY INFORMATION
 SUPPLEMENTARY INFORMATION Radiative forcing and albedo feedback from the northern hemisphere cryosphere between 1979 and 2008 M. G. Flanner 1 *, K. M. Shell 2, M. Barlage 3, D. K. Perovich 4, & M. A. Tschudi
On the Robustness of Emergent Constraints Used in Multimodel Climate Change Projections of Arctic Warming
 15 JANUARY 2013 B R A C E G I R D L E A N D S T E P H E N S O N 669 On the Robustness of Emergent Constraints Used in Multimodel Climate Change Projections of Arctic Warming THOMAS J. BRACEGIRDLE British
Detection and Attribution of Climate Change. ... in Indices of Extremes?
 Detection and Attribution of Climate Change... in Indices of Extremes? Reiner Schnur Max Planck Institute for Meteorology MPI-M Workshop Climate Change Scenarios and Their Use for Impact Studies September
Update on Cordex-AustralAsia domain
 Update on Cordex-AustralAsia domain J. Katzfey (CSIRO) Australia with contributions from J. Evans (UNSW) Bertrand Timbal (BoM) and others The Centre for Australian Weather and Climate Research A partnership
Chapter 7 Projections Based on Downscaling
 Damage caused by Tropical Cyclone Pat, Cook Islands, February 2010. Photo: National Environment Service, Government of the Cook Islands Chapter 7 Projections Based on Downscaling 181 Summary Downscaled
SUPPLEMENTARY INFORMATION
 doi:10.1038/nature11576 1. Trend patterns of SST and near-surface air temperature Bucket SST and NMAT have a similar trend pattern particularly in the equatorial Indo- Pacific (Fig. S1), featuring a reduced
CLIMATE CHANGE IMPACTS ON HYDROMETEOROLOGICAL VARIABLES AT LAKE KARLA WATERSHED
 Proceedings of the 14 th International Conference on Environmental Science and Technology Rhodes, Greece, 3-5 September 2015 CLIMATE CHANGE IMPACTS ON HYDROMETEOROLOGICAL VARIABLES AT LAKE KARLA WATERSHED
RECENT CHANGES IN TROPICAL PACIFIC: ASSOCIATION WITH CLIMATE CHANGE
 PROJECT REPORT ENTITLED RECENT CHANGES IN TROPICAL PACIFIC: ASSOCIATION WITH CLIMATE CHANGE FOR PARTIAL FULFILMENT OF MASTER OF TECHNOLOGY IN ATMOSPHERIC SCIENCE SUBMITTED BY Mr. NITIN U. PATIL UNDER THE
Advances in Statistical Downscaling of Meteorological Data:
 Advances in Statistical Downscaling of Meteorological Data: Development, Validation and Applications John Abatzoglou University of Idaho Department t of Geography EPSCoR Western Tri-State Consortium 7
Funded by the National Communications Support Programme (NCSP) and the UK Department for International Development (DfID).
 and the UK Department for International Development (DfID).") UNDP Climate Change Country Profiles Documentation C. McSweeney 1, M. New 1,2 and G. Lizcano 1 1. School of Geography and Environment, University of Oxford. 2. Tyndall Centre for Climate Change Research
UNDP Climate Change Country Profiles Documentation C. McSweeney 1, M. New 1,2 and G. Lizcano 1 1. School of Geography and Environment, University of Oxford. 2. Tyndall Centre for Climate Change Research
The CLIMGEN Model. More details can be found at and in Mitchell et al. (2004).
.") Provided by Tim Osborn Climatic Research Unit School of Environmental Sciences University of East Anglia Norwich NR4 7TJ, UK t.osborn@uea.ac.uk The CLIMGEN Model CLIMGEN currently produces 8 climate variables
Provided by Tim Osborn Climatic Research Unit School of Environmental Sciences University of East Anglia Norwich NR4 7TJ, UK t.osborn@uea.ac.uk The CLIMGEN Model CLIMGEN currently produces 8 climate variables
Tropical precipitation change under global warming
 Tropical precipitation change under global warming J. D. Neelin *, C. Chou **, M. Munnich *, H. Su *, J. Meyerson *, C. Holloway *, U. Lohmann ***, J. Feichter **** * Dept. of Atmospheric Sciences & Inst.
Indices of droughts (SPI & PDSI) over Canada as simulated by a statistical downscaling model: current and future periods
 over Canada as simulated by a statistical downscaling model: current and future periods") Indices of droughts (SPI & PDSI) over Canada as simulated by a statistical downscaling model: current and future periods Philippe Gachon 1, Rabah Aider 1 & Grace Koshida Adaptation & Impacts Research Division,
Indices of droughts (SPI & PDSI) over Canada as simulated by a statistical downscaling model: current and future periods Philippe Gachon 1, Rabah Aider 1 & Grace Koshida Adaptation & Impacts Research Division,
Southern New England s Changing Climate. Raymond S. Bradley and Liang Ning Northeast Climate Science Center University of Massachusetts, Amherst
 Southern New England s Changing Climate Raymond S. Bradley and Liang Ning Northeast Climate Science Center University of Massachusetts, Amherst Historical perspective (instrumental data) IPCC scenarios
Document and assess methods for generating inputs to hydrological models and extend delivery of projections across Victoria
 Final report for Project 2.2.5P Document and assess methods for generating inputs to hydrological models and extend delivery of projections across Victoria Principal Investigator: Ian Smith Co-Investigator:
Tracking Climate Models
 Tracking Climate Models Claire Monteleoni,GavinA.Schmidt,ShaileshSaroha 3 and Eva Asplund 3,4 Center for Computational Learning Systems, Columbia University, New York, NY, USA Center for Climate Systems
National Cheng Kung University, Taiwan. downscaling. Speaker: Pao-Shan Yu Co-authors: Dr Shien-Tsung Chen & Mr. Chin-yYuan Lin
 Department of Hydraulic & Ocean Engineering, National Cheng Kung University, Taiwan Impact of stochastic weather generator characteristic on daily precipitation downscaling Speaker: Pao-Shan Yu Co-authors:
How Will Low Clouds Respond to Global Warming?
 How Will Low Clouds Respond to Global Warming? By Axel Lauer & Kevin Hamilton CCSM3 UKMO HadCM3 UKMO HadGEM1 iram 2 ECHAM5/MPI OM 3 MIROC3.2(hires) 25 IPSL CM4 5 INM CM3. 4 FGOALS g1. 7 GISS ER 6 GISS
Downscaled Climate Change Projection for the Department of Energy s Savannah River Site
 Downscaled Climate Change Projection for the Department of Energy s Savannah River Site Carolinas Climate Resilience Conference Charlotte, North Carolina: April 29 th, 2014 David Werth Atmospheric Technologies
Assessment of the reliability of climate predictions based on comparisons with historical time series
 European Geosciences Union General Assembly 28 Vienna, Austria, 13 18 April 28 Session IS23: Climatic and hydrological perspectives on long term changes Assessment of the reliability of climate predictions
Testing Climate Models with GPS Radio Occultation
 Testing Climate Models with GPS Radio Occultation Stephen Leroy Harvard University, Cambridge, Massachusetts 18 June 2008 Talk Outline Motivation Uncertainty in climate prediction Fluctuation-dissipation
Training: Climate Change Scenarios for PEI. Training Session April Neil Comer Research Climatologist
 Training: Climate Change Scenarios for PEI Training Session April 16 2012 Neil Comer Research Climatologist Considerations: Which Models? Which Scenarios?? How do I get information for my location? Uncertainty
Muhammad Noor* & Tarmizi Ismail
 Malaysian Journal of Civil Engineering 30(1):13-22 (2018) DOWNSCALING OF DAILY AVERAGE RAINFALL OF KOTA BHARU KELANTAN, MALAYSIA Muhammad Noor* & Tarmizi Ismail Department of Hydraulic and Hydrology, Faculty
Prepared For: California Energy Commission Public Interest Energy Research Program
 VALIDATION OF LATERAL BOUNDARY CONDITIONS FOR REGIONAL CLIMATE MODELS Prepared For: California Energy Commission Public Interest Energy Research Program PIER INTERIM PROJECT REPORT Arnold Schwarzenegger
Beyond IPCC plots. Ben Sanderson
 Beyond IPCC plots Ben Sanderson What assumptions are we making? The Chain of Uncertainty: Heat waves Future Emissions Global Climate Sensitivity Regional Feedbacks Random variability Heat wave frequency
EXPERT MEETING TO ASSESS PROGRESS MADE IN THE PROCESS TO FORMULATE AND IMPLEMENT ANATIONAL ADAPTATION PANS (NAPs)
") EXPERT MEETING TO ASSESS PROGRESS MADE IN THE PROCESS TO FORMULATE AND IMPLEMENT ANATIONAL ADAPTATION PANS (NAPs) LESOTHO'S EXPERIENCE MOKOENA FRANCE MINISTRY OF ENERGY AND METEOROLOGY OUTLINE Key Risks
EXPERT MEETING TO ASSESS PROGRESS MADE IN THE PROCESS TO FORMULATE AND IMPLEMENT ANATIONAL ADAPTATION PANS (NAPs) LESOTHO'S EXPERIENCE MOKOENA FRANCE MINISTRY OF ENERGY AND METEOROLOGY OUTLINE Key Risks
STI for Climate Extremes
 STI for Climate Extremes Fredolin Tangang Professor, Universiti Kebangsaan Malaysia Adjunct Professor, Ramkhamhaeng University, Bangkok, Thailand SEP Member, NADMA Fellow, Academy of Science Malaysia Bengkel
CLIMATE CHANGE IMPACT PREDICTION IN UPPER MAHAWELI BASIN
 6 th International Conference on Structural Engineering and Construction Management 2015, Kandy, Sri Lanka, 11 th -13 th December 2015 SECM/15/163 CLIMATE CHANGE IMPACT PREDICTION IN UPPER MAHAWELI BASIN
Calculation of probability density functions for temperature and precipitation change under global warming
 JOURNAL OF GEOPHYSICAL RESEARCH, VOL. 113,, doi:10.1029/2007jd009254, 2008 Calculation of probability density functions for temperature and precipitation change under global warming I. G. Watterson 1 Received
Downscaling rainfall in the upper Blue Nile basin for use in
 Downscaling rainfall in the upper Blue Nile basin for use in hydrological modelling Michael Menker Girma 1, Brigita Schuett 1, Seleshi B. Awulachew 2, Matthew Mccartney 2, & Solomon S. Demissie 2 1 Department
Probabilistic projections of climate change over China under the SRES A1B scenario using 28 AOGCMs
 Probabilistic projections of climate change over China under the SRES A1B scenario using 28 AOGCMs W. Chen, Z. Jiang, Laurent Li To cite this version: W. Chen, Z. Jiang, Laurent Li. Probabilistic projections
Adaptation for global application of calibration and downscaling methods of medium range ensemble weather forecasts
 Adaptation for global application of calibration and downscaling methods of medium range ensemble weather forecasts Nathalie Voisin Hydrology Group Seminar UW 11/18/2009 Objective Develop a medium range
A downscaling and adjustment method for climate projections in mountainous regions
 A downscaling and adjustment method for climate projections in mountainous regions applicable to energy balance land surface models D. Verfaillie, M. Déqué, S. Morin, M. Lafaysse Météo-France CNRS, CNRM
Tropical Australia and the Australian Monsoon: general assessment and projected changes
 18 th World IMACS / MODSIM Congress, Cairns, Australia 13-17 July 9 http://mssanz.org.au/modsim9 Tropical Australia and the Australian Monsoon: general assessment and projected changes Moise, A.F. and
Evaluation and diagnosis of General Circulation Climate Models (GCMs) Iñigo Errasti Arrieta
 Iñigo Errasti Arrieta") Evaluation and diagnosis of General Circulation Climate Models (GCMs) Iñigo Errasti Arrieta inigo.errasti@ehu.es EOLO Research Group on Meteorology, Climate and Environment www.ehu.es/eolo/index.html Dept.
Evaluation and diagnosis of General Circulation Climate Models (GCMs) Iñigo Errasti Arrieta inigo.errasti@ehu.es EOLO Research Group on Meteorology, Climate and Environment www.ehu.es/eolo/index.html Dept.
CGE TRAINING MATERIALS ON VULNERABILITY AND ADAPTATION ASSESSMENT. Climate change scenarios
 CGE TRAINING MATERIALS ON VULNERABILITY AND ADAPTATION ASSESSMENT Climate change scenarios Outline Climate change overview Observed climate data Why we use scenarios? Approach to scenario development Climate
AMOC Response to Climate Change: Questions after TRACE21
 AMOC Response to Climate Change: Questions after TRACE21 Zhengyu Liu University of Wisconsin-Madison TRACE21 collaborators Jiang Zhu, UW-Madison Wei Liu, Yale Univ. Esther Brady, NCAR Bette Otto-Bliesner,