ANNUAL SUMMARY 2003 CLIMATOLOGICAL REFERENCE STATION SASKATOON. Saskatchewan Research Council
|
|
|
- Rosamund Nelson
- 5 years ago
- Views:
Transcription
1 Environment/Minerals Division Climatology/Aquatic Ecology Section Saskatchewan Research Council CLIMATOLOGICAL REFERENCE STATION SASKATOON ANNUAL SUMMARY 2003 C. Beaulieu V. Wittrock February 2004
2
3 Saskatchewan Research Council CLIMATOLOGICAL REFERENCE STATION SASKATOON ANNUAL SUMMARY 2003 C. Beaulieu V. Wittrock Environment/Minerals Division Climatology/Aquatic Ecology Section Saskatchewan Research Council Innovation Boulevard Saskatoon, SK S7N 2X8 February 2004

4 SRC Climatological Reference Station Annual Summary, 2003 February 2004 ACKNOWLEDGEMENTS The 2003 data was compiled and recorded by Carol Beaulieu with assistance from Virginia Wittrock, Charlene Hudym and Leanne Crone. Miss Beaulieu was responsible for the monitoring of the site while instrument maintenance was carried out by Brett Smith of the Instrumentation and Electronics Section of the Saskatchewan Research Council (SRC). Elaine Wheaton and Virginia Wittrock assisted with the proofreading and editing of this report. Consultations with Larry Flysak and Don Ryback of the Meteorological Service of Canada (MSC), Saskatoon, SK, were most helpful in verifying and comparing data. Although every caution has been taken to ensure the accuracy of data and information presented, errors may occur. If errors are noticed, we would appreciate being informed so they can be corrected. Information and data contained in this report shall not be published, copied, placed in a retrieval system or distributed whole or in part without prior written consent of the Saskatchewan Research Council. All references made to this report shall be acknowledged. Enquiries concerning the SRC Climatological Reference Station (CRS), its data, measurement programs and publications, or becoming a sponsor are most welcome. For further information contact: Elaine Wheaton Senior Research Scientist wheaton@src.sk.ca Virginia Wittrock Research Scientist wittrock@src.sk.ca Carol Beaulieu Research Technologist beaulieu@src.sk.ca Climatology Section Fax Saskatchewan Research Council Web Site Home Page SASKATCHEWAN RESEARCH COUNCIL CLIMATE REFERENCE STATION SPONSORS, 2003 COVER PHOTOGRAPH Untitled by Lori Sopher Merkle, Mfg/VAP, SRC We welcome SIR as a new sponsor for 2004 page ii
5 February 2004 SRC Climatological Reference Station Annual Summary, 2003 TABLE OF CONTENTS Acknowledgements ii Climate Reference Station sponsors, ii Table of Contents iii Climate Reference Station History What is the Climate Reference Station? Climate Reference Station Outreach Summaries for 2003 Overview Weather events summaries, 2003 New 2003 daily temperature and precipitation records Cold spells Greatest extreme precipitation events Hot spells Ranking of precipitation and Temperature for Dates of frost-free season Extreme Winds for Windchill calculation chart Monthly summaries - tables and graphs Monthly Average Temperatures and Extreme Value Average annual temperature time series for Saskatoon A Average annual temperature time series for CRS, Total annual precipitation time series for Saskatoon A, Total annual precipitation time series for CRS, Monthly Precipitation and Extreme Value Monthly heating and cooling degree-days Monthly growing degree-days Monthly bright sunshine Sunrise and sunset at Saskatoon, 2003 and Monthly global and diffuse solar radiation Daily global and diffuse solar radiation Monthly average soil temperatures at 0900 hrs, 10, 20, 50, 100, 150 and 300 cm Soil temperatures at 1600h, 10cm and 20cm Monthly average wind speed and extreme gusts SRC Climate Reference Station daily temperature record SRC Climate Reference Station daily precipitation record Annual weather summary of elements Monthly weather summaries of elements Instruments used at Saskatoon SRC CRS and Glossary of Terms References and Bibliography page iii
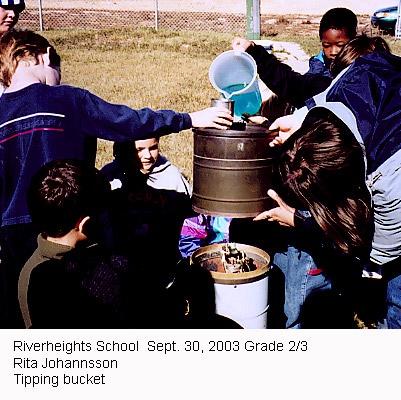

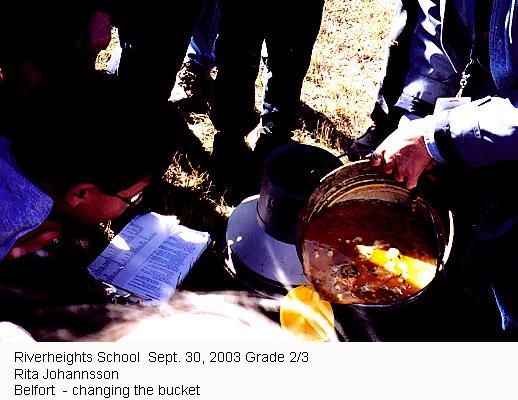
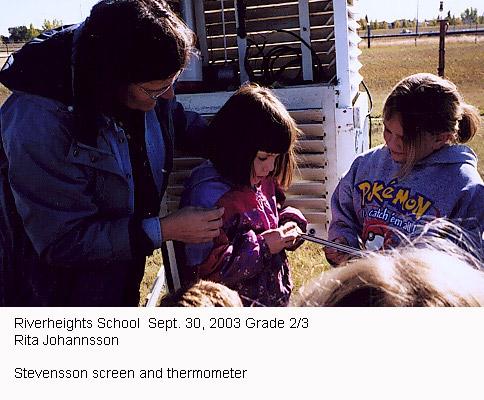

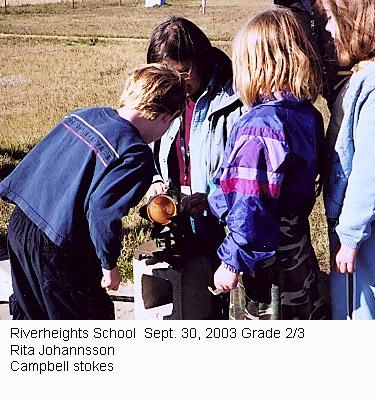
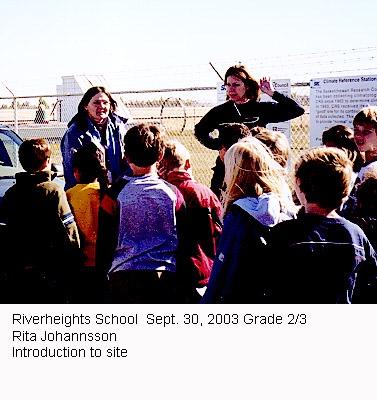
6 SRC Climatological Reference Station Annual Summary, 2003 February 2004 Grade 2/3 Riverheights Elementary School Tour, September 30, 2003 photo credit: Ms Rita Johannsson page iv

7 February 2004 SRC Climatological Reference Station Annual Summary, 2003 CLIMATE REFERENCE STATION HISTORY Cloud formation looking NE from CRS, July photo credit: CR Beaulieu Meteorological observations were first taken at or near Saskatoon by the Royal Northwest Mounted Police in 1889 with temperature only being recorded. There is some disagreement in the early records as to the exact location of the weather observing point, but the majority of the evidence indicates N, W, elevation 480m above sea level as the most probable location. This would place it at Clark s Crossing on the South Saskatchewan River, approximately 16 km northeast of the centre of the City of Saskatoon. There was a settlement at Clark s Crossing at that time as well as 10 to 15 families on either side of the river where Saskatoon is now located. Little is known about the very early observers; however, the records do show that Major T.H. Keenan took observations from March 1892 until March 1895, and Mr. George Will was the observer from January 1897 until April It is thought that T. H. Copeland was involved in the observational program from 1895 to May 1, 1901, at which time it was taken over by Mr. Eby, Sr. Mr. Eby, Sr. recorded the observations until his death in 1921, at which time his daughter, Miss E.S. Eby, continued to record the observations. Her brother, Mr. J.M. Eby, recorded the observations beginning in April 1931 until the station was closed October 31, The Eby station recorded temperature, precipitation and weather notes on fog, thunderstorms, winds and any unusual weather phenomena. Reports were made twice daily, morning and evening. In 1916, a climatological station was established by the Physics Department of the University of Saskatchewan and continuous observations were kept twice daily until January 15, The longtime observer was Mr. Sidney Cox. The Saskatchewan Research Council took over the programme in the fall of 1963 at the newly established Climatological Reference Station at latitude N, longitude W and elevation 497 m asl 1. The first observer was Terry Beck followed three years later by Orville Olm. 2 In 1967, Joe Calvert became the primary observer until his retirement in Ray Begrand succeeded Mr. Calvert until 1988 when Virginia Wittrock became the primary observer. Since 1992, the primary observer has been Carol Beaulieu assisted by Virginia Wittrock, Leanne Crone and Charlene Hudym. In the summer of 1992, the CRS began to be converted to an automated system of data collection with the installation of a Campbell Scientific data logger and automatic sensors. Elements presently recorded at the site are temperature, precipitation, wind, solar radiation, relative humidity, barometric pressure, soil temperature and snow-on-theground (manual recordings). Temperature, precipitation and radiation data are submitted to Environment Canada. 1 Christiansen 1970; Environment Canada Olm 2001 page 1
8 SRC Climatological Reference Station Annual Summary, 2003 February 2004 WHAT IS THE CLIMATE REFERENCE STATION? The Saskatchewan Research Council s Climate Reference Station (SRC CRS) at Saskatoon is classified as a principal climatological station with supplementary climatological observations. 1 A reference climatological station s data are intended for the purpose of determining climatic trends. This requires long periods (not less than thirty years) of homogeneous records, where man-made environmental changes have been or are expected to remain at a minimum. Ideally the records should be of sufficient length to enable the identification of secular changes of climate 2. At our station, hourly readings are taken of elements which include temperature, precipitation amount, humidity, wind, and atmospheric pressure. Our supplemental observations include rate of rainfall, soil temperature, bright sunshine and solar radiation. High quality and consistent climatological observations are maintained providing data sets to meet the current concerns of the effects of climatic change and increased variability. Purpose and Benefits The purpose of the SRC CRS is to provide a record of the observed meteorological elements so that the climate of the area and its changes can be accurately documented and described. Climatological data have assumed new importance as a result of social and environmental issues in which climate is a dominant factor. Climatological information assists in realizing new technological opportunities and social changes. It is necessary and valuable for use in areas such as agriculture, forestry, land use and facility placement, water and energy resources, health and comfort. The CRS also allows us to: evaluate long term climate trends - early warning system for increased frequencies of extreme events such as drought, floods, etc.; determine the impacts of climate events on society, economy, health, and ecosystems - e.g. intense rainfall causing flooding and property damage and heat stress with its implications for health; do value-added research; be part of regional, national and global networks in an important agricultural and ecological area; facilitate development of additional programs - e.g. air quality, biodiversity, and climate change monitoring; have roles in various programs within SRC including spray drift work, The Boreal Ecosystem - Atmosphere Study (BOREAS), and collaborative research with the Western College of Veterinary Medicine and the College of Agriculture, University of Saskatchewan, for example; and provide climate data to governments, universities, insurance agencies, lawyers, agricultural sectors, chemical companies, schools, building science, construction firms, media, transportation studies, accident studies, wildlife studies, tourism groups and interested individuals. The goals of the Climate Reference Station are first, to maintain the high quality of data gathered over its more than thirty-nine years of existence at its current location and, second, to continue to monitor a large variety of elements. These various elements combined with the long-term collection period as well as the stable location allow CRS to be a very valuable climate information collection station. CLIMATE REFERENCE STATION OUTREACH 2003 Outreach activities continued in 2003 at the Climate Reference Station. Presentations on Weather Instruments and How They Work which were presented were well received by students and staff with positive post-presentation feedback. Approximately 60 children from 2 urban schools, grades 2 to 4 participated in the demonstrations. With the help of enthusiastic volunteers, students received hands-on experience with instruments used to measure temperature, precipitation, wind and solar radiation. 1 Environment Canada World Meteorological Organization 1988 page 2
 Climatological Reference Station (CRS) (52 09 N, 106 36 W, 497 m asl), are presented for the year 2003 and")
9 February 2004 SRC Climatological Reference Station Annual Summary, 2003 SUMMARIES FOR 2003 Overview Data concerning temperature, precipitation, wind speed and direction, bright sunshine, solar radiation, and soil temperature, recorded at the Saskatchewan Research Council (SRC) Climatological Reference Station (CRS) (52 09 N, W, 497 m asl), are presented for the year 2003 and compared with the long-term (circa ) and standard-period ( ) records. The 2003 annual temperatures were almost one degree above normal for the minimum and average while the maximum temperature was a full degree. The warmth of 2003 is reflected in its ranking when compared to the previous forty years at the Climate Reference Station. The annual minimum temperature (-2.5 C) tied for 30 th place for the coldest temperature in 40 years while the annual maximum temperature (9.3 C) ranked as the 9 th warmest ranked overall as 8 th warmest year. The year s beginning gave no indication of the ultimate warm rankings for the year. February and March were colder than normal with each recording four daily minimum temperature of below -30 C. Surprisingly, March was also notable for producing the year s coldest temperature of C. The major influences of the above normal annual temperatures were a very hot August and a warm December. Fifteen days in August recorded temperatures above 30 C including three continuous days over 32 C to constitute a heat wave. Out of the nine maximum daily records set for the year, three were in August and one was in December. The above average temperatures are reflected in the degree-days. Heating degree-days were above normal for the cool months of February, March and November. This was easily offset by the rest of the year resulting in an annual total almost 5% less than normal. Cooling degree-days came close to doubling in July and tripling in August to create an annual total over twice the normal. Annual extreme cooling degree-days (base 24 C) quadrupled due to the high August temperatures. The frost-free season s length continued above average for the 11 th year in a row due to a late first fall frost date. Annual growing degree-days were up 21% while the frost-free growing season was 26% above normal. Drought-like conditions persisted into By March, only 42% of normal precipitation had been measured at CRS. April saw a recovery with an 80% more monthly precipitation than normal but May and June precipitation were well below normal dashing hopes for good soil moisture for crop production. July and August saw near normal rainfall. Unfortunately, it was not evenly distributed but came as three downpours; one of which produced a daily record for July 6 th. November and December closed the year with extreme dry conditions resulting in 2003 being the third driest year since Only 2001 (165.8mm) and 1987 (232.4mm) were drier. A bright highlight in the year was the slightly above average bright sunshine hours. The first eight months seesawed from being above normal to below. From October to the end of the year, bright sunshine hours were well above average completing the year with 4% more hours of bright sunshine than normal. The number of days with bright sunshine was near normal. During April, May, June, July and October, CRS recorded Strong Gale force wind between 76 km/h and 88 km/h which, with the exception of one from the west, blew from the west-northwest. June recorded the most wind gusts (6) of over 51 km/h including one measured at 82.8 km/h. The strongest wind of the year was 87.8 km/h recorded on May 16 th. Hawk using perch on the 10m tower, Summer photo credit: CR Beaulieu page 3
10 SRC Climatological Reference Station Annual Summary, 2003 February 2004 Weather Events Summaries, 2003 NEW 2003 DAILY TEMPERATURE AND PRECIPITATION RECORDS TYPE Maximum Daily Temperature C Minimum Daily Temperature C Daily Precipitation mm DAY NEW RECORD OLD RECORD/ year June /1989 July &2002 July /1978 August /1973 August /1973 August /1972 October /1980 October /1985 December /1994 February /1972 February /1972 March /1972 March /1974 February /1998 April /1979 June /1976 July /2000 July /1976&1999 August /1995 September /1983 October /1968&1983 COLD SPELL (less than or equal to -30 C) MONTH DAY TEMPERATURE C January February March Extreme March GREATEST EXTREME PRECIPITATION EVENTS (mm)* PERIOD DATE AMOUNT 0.5 hour September hour June hour September hour June hours September hours August hours July hours September *recorded by tipping bucket April 22 snd to September 30 th HOT SPELL (greater than or equal to 30 C) MONTH DAY TEMPERATURE C June July August Sept Extreme August page 4
 December 17.5 1 3.2 December November 26.4 2 3.9 November March 29.6 3 4.8 March May 30.2 4 7.2 January January 39.6 5 8.1 February June 52.8 6 11.5 October February 60.")
11 February 2004 SRC Climatological Reference Station Annual Summary, 2003 Ranking of Precipitation and Temperature for 2003 DRIEST MONTH BY % OF NORMAL PRECIPITATION RANKING DRIEST MONTH BY PRECIPITATION AMOUNT (mm) December December November November March March May January January February June October February May October June August September July August September April April July WARMEST ANNUAL MAXIMUM TEMPERATURE C COLDEST ANNUAL MINIMUM TEMPERATURE C WARMEST ANNUAL AVERAGE TEMPERATURE C RANKING September 7, 2003 Thunderstorm photo credit: A Sherdahl Dates and Duration of the Frost-free Season YEAR DATE OF LAST SPRING FROST DATE OF FIRST FALL FROST LENGTH OF SEASON (days) 1964 May 31 Sept May 27 Sept May 19 Sept Jun 06 Sept May 19 Sept Jun 14 Sept May 19 Sept May 18 Sept May-08 Sept May 06 Sept May 25 Sept May 21 Sept May 06 Aug May 01 Aug YEAR DATE OF LAST SPRING FROST DATE OF FIRST FALL FROST LENGTH OF SEASON (days) 1978 May 30 Sept May 30 Aug May 14 Aug May 24 Sept May 29 Aug May 24 Sept May 24 Aug Jun 04 Sept May 17 Sept May 21 Oct May 02 Sept May 28 Sept May 13 Sept May 27 Sept YEAR DATE OF LAST SPRING FROST DATE OF FIRST FALL FROST LENGTH OF SEASON (days) 1992 May 23 Sept May 17 Sept May 09 Oct May 22 Sept May 12 Sept May 14 Oct May 13 Sept May 09 Sept May 17 Sept May 10 Oct May 23 Sept May 18 Sept Normal May 18 Sept page 5

12 SRC Climatological Reference Station Annual Summary, 2003 February 2004 Extreme Winds for Wind Speeds JANUARY FEBRUARY MARCH Day Speed Direction Day Speed Direction Day Speed Direction >=51 but < NW N NEAR GALE SSE N >=63 but < WNW W GALE Wind Speeds APRIL MAY JUNE Day Speed Direction Day Speed Direction Day Speed Direction >=51 but < E W SW NEAR GALE E N NW ESE S WSW >=63 but < NNW WSW GALE >=76 but < WNW WNW WNW STRONG GALE Wind Speeds JULY AUGUST SEPTEMBER Day Speed Direction Day Speed Direction Day Speed Direction >=51 but < NW ESE SW NEAR GALE NW WNW NW ESE >=63 but < W WNW SW GALE WNW >=76 but < W STRONG GALE Wind Speeds 1 Beaufort Wind Scale Designation OCTOBER DECEMBER Day Speed Direction Day Speed Direction >=51 but < W SSE NEAR GALE WNW >=63 but < NW GALE >=76 but < WNW STRONG GALE 10m tower, October photo credit: CR Beaulieu page 6
13 February 2004 SRC Climatological Reference Station Annual Summary, 2003 Windchill Calculation Chart 1 (revised 2001) V T where T = Air temperature ( C) and V = Observed wind speed at 10m elevation (km/h). Approximate Thresholds: Risk of frostbite in prolonged exposure: wind chill below -25 Frostbite possible in 10 minutes at -35 Frostbite possible in less than 2 minutes at -60 Warm skin, suddenly exposed. Shorter time if skin is cool at the start. Warm skin, suddenly exposed. Shorter time if skin is cool at the start. Source: Environment Canada, 2001b page 7
14 SRC Climatological Reference Station Annual Summary, 2003 February 2004 Monthly Average Temperatures and Extreme Values, 2003 AVERAGE MAXIMUM TEMPERATURE ( C) AVERAGE MINIMUM TEMPERATURE ( C) AVERAGE TEMPERATURE ( C) EXTREME S FOR TEMPERATURE ( C) MONTH 2003 Normal 2003 Normal 2003 Normal Maximum/Date Minimum/Date January / /26 February / /24 March / /07 April / /04 May /25-2.0/11 June /19 4.0/10&24 July /17 8.6/03 August /16 7.1/26 September /04-4.3/30 October / /31 November / /22 December / /11 Average TEMPERATURE ( C) January February March April May June July August September October November December MONTH Average Maximum Temperature ( C) Average Minimum Temperature ( C) Average Temperature ( C) Normal Average Maximum Temperature ( C) Normal Average Minimum Temperature ( C) Normal Average Temperature ( C) page 8
15 February 2004 SRC Climatological Reference Station Annual Summary, 2003 Average Annual Temperature Time Series for Saskatoon A TEMPERATURE ( C) Mont Pelee, Marinique 1915 Lassen Peak, California 1924 Kilauea,Hawaii 1980 Mount St. Helens, 1985 Nevado del Ruiz, Colombia 1991 Mount Pinatubo, YEAR Average Yearly Temperature 5-Year Running Average Temperature Decade Average Temperature data source: Environment Canada, 2002a, 2002b Goble U.S. Geological Survey, n.d. Average Annual Temperature Time Series for CRS, TEMPERATURE ( C) YEAR SRC Average Yearly Temperature SRC 5-Year Running Average Temperature SRC Decade Average Temperature Normal Mean Temperature ( ) page 9
16 SRC Climatological Reference Station Annual Summary, 2003 February 2004 Total Annual Precipitation Time Series for Saskatoon A, PRECIPITATION (mm) Mount St. Helens, Wahington 1985 Nevado del Ruiz, Colombia 1902 Mont Pelee, Marinique 1915 Lassen Peak, California 1924 Kilauea,Hawaii 1991 Mount Pinatubo, Philippines YEAR Total Yearly Precipitation 5-Year Running Average Precipitation Decade Precipitation Average data source: Environment Canada, 2002a, 2002b, Goble U.S. Geological Survey n.d. 600 Total Annual Precipitation Time Series for CRS, PRECIPITATION (mm) YEAR SRC Total Yearly Precipitation SRC 5-Year Running Average Precipitation SRC Decade Average Precipitation Normal Mean Precipitation ( ) page 10
17 February 2004 SRC Climatological Reference Station Annual Summary, 2003 Monthly Precipitation and Extreme Values, 2003 PRECIPITATION (mm) CUMULATIVE PRECIPITATION (mm) EXTREME (mm) MONTH 2003 Normal % of Normal 2003 Normal % of Normal Value/Date January /26 February /17 March /23 April /26 May /16 June /02 July /06 August /08 September /09 October /26 November /04 December /29 Total PRECIPITATION (mm) CUMULATIVE PRECIPITATION (mm) January February March April May June July August September October November December MONTH 2003 Precipitation (mm) Normal Precipitation (mm) 2003 Cumulative Precipitation (mm) Normal Cumulative Precipitation (mm) 0 page 11
18 SRC Climatological Reference Station Annual Summary, 2003 February 2004 Monthly Heating and Cooling Degree-days, 2003 HEATING DEGREE-DAYS Base 18 C CUMULATIVE HEATING DEGREE-DAYS Base 18 C COOLING DEGREE-DAYS Base 18 C CUMULATIVE COOLING DEGREE-DAYS Base 18 C MONTH 2003 Normal 2003 Normal 2003 Normal 2003 Normal January February March April May June July August September October November December Total HEATING DEGREE-DAYS January February March April May June July August September October November December MONTH Heating Degree-days (Base 18 C) Cumulative Heating Degree-days (Base 18 C) Normal Heating Degree-days (Base 18 C) Normal Cumulative Heating Degree-days (Base 18 C) CUMULATIVE HEATING DEGREE-DAYS COOLING DEGREE-DAYS January February March April May June July August September October November December MONTH Cooling Degree-days (Base 18 C) Normal Cooling Degree-days (Base 18 C) Cumulative Cooling Degree-days (Base 18 C) Normal Cumulative Cooling Degree-days (Base 18 C) CULUMATIVE COOLING DEGREE-DAYS page 12
19 February 2004 SRC Climatological Reference Station Annual Summary, 2003 Monthly Growing Degree-days, 2003 GROWING DEGREE-DAYS Base 5 C CUMULATIVE GROWING DEGREE-DAYS Base 5 C FROST-FREE GROWING DEGREE-DAYS Base 5 C MONTH 2003 Normal 2003 Normal 2003 Cumulative January February March April May June July August September October November December Total GROWING DEGREE-DAYS January February March April May June July August September October November December MONTH Growing Degree-days (Base 5 C) Normal Growing Degree-days (Base 5 C) Frost-free Growing Degree-days (Base 5 C) Normal Cumulative Growing Degree-days (Base 5 C) Cumulative Frost-free Growing Degree-days (Base 5 C) Cumulative Growing Degree-days (Base 5 C) CUMULATIVE GROWING DEGREE-DAYS Days Length of Season 5-year running mean page 13
20 SRC Climatological Reference Station Annual Summary, 2003 February 2004 Monthly Bright Sunshine, 2003 MONTH BRIGHT SUNSHINE (hours) CUMULATIVE BRIGHT SUNSHINE (hours) NUMBER OF BRIGHT SUNSHINE DAYS 2003 Normal % of Normal Possible* % of Possible 2003 Normal 2003 Normal January February March April May June July August September October November December Total * Possible Bright Sunshine hours calculated from Nat. Res. Council of Canada, Hertzberg Institute of Astrophysics sunrise/set table for BRIGHT SUNSHINE (hours) CUMULATIVE BRIGHT SUNSHINE (hours) January February March April May June July August September October November December MONTH 2003 Bright Sunshine (hours) Normal Bright Sunshine (hours) Possible Bright Sunshine (hours)* 2003 Cumulative Bright Sunshine (hours) Normal Cumulative Bright Sunshine (hours) 0 page 14
21 February 2004 SRC Climatological Reference Station Annual Summary, 2003 Sunrise 1 and Sunset 1 at Saskatoon, 2003 and (local time in hours and minutes) 2003 JANUARY FEBRUARY MARCH APRIL MAY JUNE JULY AUGUST SEPTEMBER OCTOBER NOVEMBER DECEMBER Date Rise Set Rise Set Rise Set Rise Set Rise Set Rise Set Rise Set Rise Set Rise Set Rise Set Rise Set Rise Set 1 9:15 17:05 8:47 17:54 7:53 18:46 6:42 19:40 5:37 20:32 4:52 21:17 4:50 21:30 5:27 20:57 6:18 19:54 7:07 18:45 8:01 17:38 8:53 16:58 2 9:15 17:06 8:45 17:56 7:51 18:48 6:39 19:42 5:35 20:33 4:51 21:18 4:51 21:30 5:29 20:56 6:19 19:52 7:09 18:42 8:03 17:36 8:54 16:58 3 9:15 17:07 8:44 17:57 7:48 18:49 6:37 19:44 5:33 20:35 4:50 21:20 4:52 21:30 5:31 20:54 6:21 19:50 7:10 18:40 8:05 17:35 8:55 16:57 4 9:15 17:08 8:42 17:59 7:46 18:51 6:35 19:45 5:31 20:37 4:50 21:21 4:52 21:29 5:32 20:52 6:23 19:48 7:12 18:38 8:07 17:33 8:57 16:57 5 9:14 17:10 8:41 18:01 7:44 18:53 6:32 19:47 5:29 20:38 4:49 21:22 4:53 21:29 5:34 20:50 6:24 19:45 7:14 18:35 8:09 17:31 8:58 16:56 6 9:14 17:11 8:39 18:03 7:42 18:55 6:30 19:49 5:27 20:40 4:48 21:22 4:54 21:28 5:35 20:49 6:26 19:43 7:15 18:33 8:10 17:29 8:59 16:56 7 9:14 17:12 8:37 18:05 7:39 18:57 6:28 19:51 5:26 20:42 4:48 21:23 4:55 21:27 5:37 20:47 6:27 19:41 7:17 18:31 8:12 17:28 9:00 16:55 8 9:13 17:14 8:35 18:07 7:37 18:58 6:26 19:52 5:24 20:43 4:47 21:24 4:56 21:27 5:38 20:45 6:29 19:38 7:19 18:28 8:14 17:26 9:02 16:55 9 9:13 17:15 8:33 18:09 7:35 19:00 6:23 19:54 5:22 20:45 4:47 21:25 4:57 21:26 5:40 20:43 6:31 19:36 7:21 18:26 8:16 17:24 9:03 16: :12 17:16 8:32 18:11 7:33 19:02 6:21 19:56 5:20 20:46 4:47 21:26 4:58 21:25 5:42 20:41 6:32 19:34 7:22 18:24 8:18 17:23 9:04 16: :11 17:18 8:30 18:12 7:30 19:04 6:19 19:57 5:19 20:48 4:46 21:26 4:59 21:24 5:43 20:39 6:34 19:31 7:24 18:22 8:19 17:21 9:05 16: :11 17:19 8:28 18:14 7:28 19:06 6:17 19:59 5:17 20:50 4:46 21:27 5:00 21:24 5:45 20:37 6:36 19:29 7:26 18:19 8:21 17:20 9:06 16: :10 17:21 8:26 18:16 7:26 19:07 6:14 20:01 5:16 20:51 4:46 21:28 5:01 21:23 5:46 20:35 6:37 19:27 7:28 18:17 8:23 17:18 9:07 16: :09 17:22 8:24 18:18 7:23 19:09 6:12 20:03 5:14 20:53 4:45 21:28 5:02 21:22 5:48 20:33 6:39 19:24 7:29 18:15 8:25 17:17 9:08 16: :08 17:24 8:22 18:20 7:21 19:11 6:10 20:04 5:12 20:54 4:45 21:29 5:04 21:21 5:50 20:31 6:41 19:22 7:31 18:13 8:27 17:15 9:09 16: :07 17:26 8:20 18:22 7:19 19:13 6:08 20:06 5:11 20:56 4:45 21:29 5:05 21:20 5:51 20:29 6:42 19:20 7:33 18:11 8:28 17:14 9:10 16: :06 17:27 8:18 18:24 7:17 19:14 6:06 20:08 5:09 20:57 4:45 21:30 5:06 21:18 5:53 20:27 6:44 19:17 7:35 18:09 8:30 17:12 9:10 16: :05 17:29 8:16 18:26 7:14 19:16 6:03 20:09 5:08 20:59 4:45 21:30 5:07 21:17 5:55 20:25 6:45 19:15 7:36 18:06 8:32 17:11 9:11 16: :04 17:31 8:14 18:27 7:12 19:18 6:01 20:11 5:07 21:00 4:45 21:31 5:09 21:16 5:56 20:23 6:47 19:13 7:38 18:04 8:34 17:10 9:12 16: :03 17:32 8:12 18:29 7:10 19:20 5:59 20:13 5:05 21:02 4:45 21:31 5:10 21:15 5:58 20:21 6:49 19:10 7:40 18:02 8:35 17:09 9:12 16: :02 17:34 8:10 18:31 7:07 19:21 5:57 20:15 5:04 21:03 4:46 21:31 5:11 21:14 6:00 20:19 6:50 19:08 7:42 18:00 8:37 17:07 9:13 16: :01 17:36 8:08 18:33 7:05 19:23 5:55 20:16 5:03 21:05 4:46 21:31 5:13 21:12 6:01 20:17 6:52 19:06 7:43 17:58 8:39 17:06 9:13 16: :00 17:37 8:06 18:35 7:03 19:25 5:53 20:18 5:01 21:06 4:46 21:31 5:14 21:11 6:03 20:14 6:54 19:03 7:45 17:56 8:40 17:05 9:14 16: :59 17:39 8:04 18:37 7:00 19:26 5:51 20:20 5:00 21:07 4:46 21:31 5:16 21:10 6:04 20:12 6:55 19:01 7:47 17:54 8:42 17:04 9:14 16: :57 17:41 8:01 18:39 6:58 19:28 5:49 20:21 4:59 21:09 4:47 21:31 5:17 21:08 6:06 20:10 6:57 18:59 7:49 17:52 8:43 17:03 9:15 16: :56 17:43 7:59 18:40 6:56 19:30 5:47 20:23 4:58 21:10 4:47 21:31 5:18 21:07 6:08 20:08 6:59 18:56 7:51 17:50 8:45 17:02 9:15 16: :55 17:45 7:57 18:42 6:53 19:32 5:45 20:25 4:57 21:11 4:48 21:31 5:20 21:05 6:09 20:06 7:00 18:54 7:52 17:48 8:47 17:01 9:15 17: :53 17:46 7:55 18:44 6:51 19:33 5:43 20:27 4:56 21:13 4:48 21:31 5:21 21:04 6:11 20:03 7:02 18:51 7:54 17:46 8:48 17:01 9:15 17: :52 17:48 6:49 19:35 5:41 20:28 4:55 21:14 4:49 21:31 5:23 21:02 6:13 20:01 7:04 18:49 7:56 17:44 8:50 17:00 9:15 17: :50 17:50 6:46 19:37 5:39 20:30 4:54 21:15 4:49 21:31 5:24 21:01 6:14 19:59 7:05 18:47 7:58 17:42 8:51 16:59 9:15 17: :49 17:52 6:44 19:39 4:53 21:16 5:26 20:59 6:16 19:57 8:00 17:40 9:15 17:04 1 Sunrise/set = corresponds to the upper limb of the sun appearing at the horizon 2 National Research Council, Canada, Hertzberg Institute of Astrophysics 2004 JANUARY FEBRUARY MARCH APRIL MAY JUNE JULY AUGUST SEPTEMBER OCTOBER NOVEMBER DECEMBER Date Rise Set Rise Set Rise Set Rise Set Rise Set Rise Set Rise Set Rise Set Rise Set Rise Set Rise Set Rise Set 1 9:15 17:05 8:47 17:53 7:51 18:47 6:40 19:42 5:35 20:33 4:51 21:18 4:51 21:30 5:29 20:56 6:19 19:53 7:08 18:43 8:03 17:37 8:54 16:58 2 9:15 17:06 8:46 17:55 7:49 18:49 6:38 19:43 5:33 20:35 4:51 21:19 4:51 21:30 5:30 20:54 6:20 19:50 7:10 18:40 8:05 17:35 8:55 16:57 3 9:15 17:07 8:44 17:57 7:47 18:51 6:35 19:45 5:32 20:36 4:50 21:20 4:52 21:29 5:32 20:53 6:22 19:48 7:12 18:38 8:06 17:33 8:56 16:57 4 9:15 17:08 8:43 17:59 7:45 18:53 6:33 19:47 5:30 20:38 4:49 21:21 4:53 21:29 5:33 20:51 6:24 19:46 7:13 18:36 8:08 17:31 8:58 16:56 5 9:15 17:09 8:41 18:01 7:42 18:54 6:31 19:48 5:28 20:40 4:49 21:22 4:54 21:28 5:35 20:49 6:25 19:44 7:15 18:34 8:10 17:30 8:59 16:56 6 9:14 17:11 8:39 18:03 7:40 18:56 6:28 19:50 5:26 20:41 4:48 21:23 4:55 21:28 5:36 20:47 6:27 19:41 7:17 18:31 8:12 17:28 9:00 16:55 7 9:14 17:12 8:37 18:05 7:38 18:58 6:26 19:52 5:24 20:43 4:48 21:24 4:56 21:27 5:38 20:45 6:29 19:39 7:18 18:29 8:14 17:26 9:01 16:55 8 9:13 17:13 8:36 18:06 7:35 19:00 6:24 19:54 5:23 20:44 4:47 21:25 4:57 21:26 5:40 20:43 6:30 19:37 7:20 18:27 8:15 17:25 9:03 16:55 9 9:13 17:15 8:34 18:08 7:33 19:02 6:22 19:55 5:21 20:46 4:47 21:26 4:58 21:25 5:41 20:42 6:32 19:34 7:22 18:24 8:17 17:23 9:04 16: :12 17:16 8:32 18:10 7:31 19:03 6:19 19:57 5:19 20:48 4:46 21:26 4:59 21:25 5:43 20:40 6:34 19:32 7:24 18:22 8:19 17:21 9:05 16: :12 17:17 8:30 18:12 7:29 19:05 6:17 19:59 5:18 20:49 4:46 21:27 5:00 21:24 5:44 20:38 6:35 19:30 7:25 18:20 8:21 17:20 9:06 16: :11 17:19 8:28 18:14 7:26 19:07 6:15 20:00 5:16 20:51 4:46 21:28 5:01 21:23 5:46 20:36 6:37 19:27 7:27 18:18 8:23 17:18 9:07 16: :10 17:20 8:26 18:16 7:24 19:09 6:13 20:02 5:14 20:52 4:45 21:28 5:02 21:22 5:48 20:34 6:38 19:25 7:29 18:16 8:24 17:17 9:08 16: :09 17:22 8:25 18:18 7:22 19:10 6:11 20:04 5:13 20:54 4:45 21:29 5:03 21:21 5:49 20:32 6:40 19:23 7:31 18:13 8:26 17:16 9:09 16: :09 17:24 8:23 18:20 7:19 19:12 6:08 20:06 5:11 20:56 4:45 21:29 5:04 21:20 5:51 20:30 6:42 19:20 7:32 18:11 8:28 17:14 9:09 16: :08 17:25 8:21 18:21 7:17 19:14 6:06 20:07 5:10 20:57 4:45 21:30 5:06 21:19 5:53 20:28 6:43 19:18 7:34 18:09 8:30 17:13 9:10 16: :07 17:27 8:19 18:23 7:15 19:16 6:04 20:09 5:08 20:59 4:45 21:30 5:07 21:18 5:54 20:26 6:45 19:16 7:36 18:07 8:31 17:11 9:11 16: :06 17:28 8:17 18:25 7:12 19:17 6:02 20:11 5:07 21:00 4:45 21:30 5:08 21:16 5:56 20:23 6:47 19:13 7:38 18:05 8:33 17:10 9:12 16: :05 17:30 8:15 18:27 7:10 19:19 6:00 20:13 5:06 21:02 4:45 21:31 5:10 21:15 5:58 20:21 6:48 19:11 7:39 18:03 8:35 17:09 9:12 16: :04 17:32 8:13 18:29 7:08 19:21 5:58 20:14 5:04 21:03 4:45 21:31 5:11 21:14 5:59 20:19 6:50 19:08 7:41 18:01 8:36 17:08 9:13 16: :03 17:34 8:10 18:31 7:05 19:23 5:55 20:16 5:03 21:04 4:46 21:31 5:12 21:13 6:01 20:17 6:52 19:06 7:43 17:58 8:38 17:07 9:13 16: :01 17:35 8:08 18:33 7:03 19:24 5:53 20:18 5:02 21:06 4:46 21:31 5:14 21:11 6:02 20:15 6:53 19:04 7:45 17:56 8:40 17:06 9:14 16: :00 17:37 8:06 18:34 7:01 19:26 5:51 20:19 5:00 21:07 4:46 21:31 5:15 21:10 6:04 20:13 6:55 19:01 7:47 17:54 8:41 17:04 9:14 16: :59 17:39 8:04 18:36 6:58 19:28 5:49 20:21 4:59 21:08 4:47 21:31 5:17 21:09 6:06 20:11 6:57 18:59 7:48 17:52 8:43 17:03 9:15 16: :58 17:41 8:02 18:38 6:56 19:30 5:47 20:23 4:58 21:10 4:47 21:31 5:18 21:07 6:07 20:08 6:58 18:57 7:50 17:50 8:45 17:02 9:15 16: :56 17:42 8:00 18:40 6:54 19:31 5:45 20:24 4:57 21:11 4:48 21:31 5:19 21:06 6:09 20:06 7:00 18:54 7:52 17:48 8:46 17:02 9:15 17: :55 17:44 7:58 18:42 6:52 19:33 5:43 20:26 4:56 21:12 4:48 21:31 5:21 21:04 6:11 20:04 7:02 18:52 7:54 17:46 8:48 17:01 9:15 17: :53 17:46 7:56 18:44 6:49 19:35 5:41 20:28 4:55 21:14 4:49 21:31 5:22 21:03 6:12 20:02 7:03 18:50 7:56 17:44 8:49 17:00 9:15 17: :52 17:48 7:53 18:45 6:47 19:36 5:39 20:30 4:54 21:15 4:49 21:31 5:24 21:01 6:14 19:59 7:05 18:47 7:57 17:42 8:51 16:59 9:15 17: :51 17:50 6:45 19:38 5:37 20:31 4:53 21:16 4:50 21:30 5:26 20:59 6:16 19:57 7:07 18:45 7:59 17:41 8:52 16:58 9:15 17: :49 17:51 6:42 19:40 4:52 21:17 5:27 20:58 6:17 19:55 8:01 17:39 9:15 17:05 1 Sunrise/set = corresponds to the upper limb of the sun appearing at the horizon 2 National Research Council, Canada, Hertzberg Institute of Astrophysics page 15
22 SRC Climatological Reference Station Annual Summary, 2003 February 2004 Monthly Global and Diffuse Solar Radiation, 2003 GLOBAL RADIATION (MJ/m 2 ) CUMULATIVE GLOBAL RADIATION (MJ/m 2 ) DIFFUSE RADIATION (MJ/m 2 ) CUMULATIVE DIFFUSE RADIATION (MJ/m 2 ) MONTH 2003 Normal 2003 Normal 2003 Normal 2003 Normal January February March April May June July August September October November December Total Normals = Solar Radiation (MJ/m 2 ) Cumulative Solar Radiation (MJ/m 2 ) January February March April May June July August September October November December MONTH 2003 Global Radiation (MJ/m2) Normal Global Radiation (MJ/m2) 2003 Diffuse Radiation (MJ/m2) Normal Diffuse Radiation (MJ/m2) 2003 Cumulative Global Radiation (MJ/m2) Cumulative Normal Global Radiation (MJ/m2) 2003 Cumulative Diffuse Radiation (MJ/m2) Cumulative Normal Diffusel Radiation (MJ/m2) 0 page 16

23 February 2004 SRC Climatological Reference Station Annual Summary, 2003 Daily Global and Diffuse Solar Radiation, 2003 (MJ/m 2 ) DATE JAN FEB MAR APR MAY JUN JULY AUG SEPT OCT NOV DEC G D G D G D G D G D G D G D G D G D G D G D G D TOTAL COMMENTS: G= Global Radiation D= Diffuse Radiation March 23, 24 Maladjustment of shade ring July 15, diffuse repaired Diffuse Radiation Sensor, September 30, photo credit: Rita Johannsson page 17
24 SRC Climatological Reference Station Annual Summary, 2003 February 2004 Monthly Average Soil Temperatures at 0900 hrs, 2003 (10 to 300cm depths) MONTH Average Air Temperature 10cm ( C) 20cm ( C) 50cm ( C) 100cm ( C) 150cm ( C) 300cm ( 2003 Normal 2003 Normal 2003 Normal 2003 Normal 2003 Normal 2003 Normal January February March April May June July August September October November December Normals = TEMPERATURE ( C) January February March April May June July August September October November December MONTH 10cm ( C) 20cm ( C) 50 cm ( C) 100 cm ( C) 150 cm ( C) 300 cm ( C) Normal Temperature at 10cm ( C) Normal Temperature at 20cm ( C) Normal Temperature at 50 cm ( C) Normal Temperature at 100 cm ( C) Normal Temperature at 150 cm ( C) Normal Temperature at 300 cm ( C) Average Monthly Air 0900h ( C) page 18
25 February 2004 SRC Climatological Reference Station Annual Summary, 2003 Monthly Average Soil Temperatures at 1600 hrs, 2003 (10 to 20cm depths) MONTH Average Monthly Air Temperature 10 cm ( C) 20 cm ( 1600h 2003 Normal 2003 Normal January February March April May June July August September October November December Normal = TEMPERATURE ( C) January February March April May June July August September October November December MONTH 10 cm ( C) 20 cm ( C) Normal Temperature at 10 cm ( C) Normal Temperature at 20 cm ( C) Average Monthly Air 1600h page 19
26 SRC Climatological Reference Station Annual Summary, 2003 February 2004 Monthly Average Wind Speed and Extreme Gusts, 2003 MONTH AVERAGE (km/h) EXTREME GUST (km/h) 2003 Normal* Direction 2003 Date January WNW February N March W April WNW May WNW June WNW July W August WNW September SW&WNW &23 October WNW November NW December SSE * Normals used are from the Environment Canada, Saskatoon Airport station AVERAGE WIND SPEED (km/h) EXTREME WIND GUST (km/h) January February March April May June July August September October November December 0 MONTH Average Wind Speed (km/h) NormalWind Speed (km/h)* Extreme Wind Gust (km/h) page 20
27 February 2004 SRC Climatological Reference Station Annual Summary, 2003 SRC Climate Reference Station Temperature Record for 2003 Extreme Maximum Temperature Mean Daily Maximum Temperature ( ) Mean Daily Temperature ( ) Mean Daily Minimum Temperature ( ) Extreme Daily Minimum Temperature Daily Temperature Range for 2003 Data records began November, 1963 TEMPERATURE C page 21
Climate Reference Station Conservation Learning Center RM of Prince Albert #461 ANNUAL SUMMARY 2016
 Climate Reference Station Conservation Learning Center RM of Prince Albert #461 ANNUAL SUMMARY 16 S. Dunn V. Wittrock Saskatchewan Research Council Air and Climate Climate Reference Station Conservation
CLIMATE REFERENCE STATION SASKATOON ANNUAL SUMMARY V. Wittrock Saskatchewan Research Council Air and Climate
 CLIMATE REFERENCE STATION SASKATOON ANNUAL SUMMARY 217 V. Wittrock Saskatchewan Research Council Air and Climate SRC Publication No. 144-1E18 February 218 Saskatchewan Research Council CLIMATE REFERENCE
SASKATOON STATION
 Day Max Max 1981-1 Temperature Degree-days Precipitation Min Min 1981-1 Mean Mean 1981-1 Growing Heating Cooling Weighing Gauge base 18 base 18 base Comments Preliminary DECEMBER 17 Snow-on- Ground 9h
SASKATOON STATION
 Day Max Max 191-1 Temperature Degree-days Precipitation Min Min 191-1 Mean Mean 191-1 Growing Heating Cooling 1 1 Geonor Weighing Gauge Notes Preliminary OCTOBER 17 Snow-on- Ground 9h Max ½ hr Min ½ hr
Champaign-Urbana 2001 Annual Weather Summary
 Champaign-Urbana 2001 Annual Weather Summary ILLINOIS STATE WATER SURVEY 2204 Griffith Dr. Champaign, IL 61820 wxobsrvr@sws.uiuc.edu Maria Peters, Weather Observer January: After a cold and snowy December,
The Climate of Payne County
 The Climate of Payne County Payne County is part of the Central Great Plains in the west, encompassing some of the best agricultural land in Oklahoma. Payne County is also part of the Crosstimbers in the
The Climate of Murray County
 The Climate of Murray County Murray County is part of the Crosstimbers. This region is a transition between prairies and the mountains of southeastern Oklahoma. Average annual precipitation ranges from
The Climate of Seminole County
 The Climate of Seminole County Seminole County is part of the Crosstimbers. This region is a transition region from the Central Great Plains to the more irregular terrain of southeastern Oklahoma. Average
The Climate of Grady County
 The Climate of Grady County Grady County is part of the Central Great Plains, encompassing some of the best agricultural land in Oklahoma. Average annual precipitation ranges from about 33 inches in northern
The Climate of Marshall County
 The Climate of Marshall County Marshall County is part of the Crosstimbers. This region is a transition region from the Central Great Plains to the more irregular terrain of southeastern Oklahoma. Average
The Climate of Pontotoc County
 The Climate of Pontotoc County Pontotoc County is part of the Crosstimbers. This region is a transition region from the Central Great Plains to the more irregular terrain of southeast Oklahoma. Average
The Climate of Texas County
 The Climate of Texas County Texas County is part of the Western High Plains in the north and west and the Southwestern Tablelands in the east. The Western High Plains are characterized by abundant cropland
The Climate of Kiowa County
 The Climate of Kiowa County Kiowa County is part of the Central Great Plains, encompassing some of the best agricultural land in Oklahoma. Average annual precipitation ranges from about 24 inches in northwestern
The Climate of Bryan County
 The Climate of Bryan County Bryan County is part of the Crosstimbers throughout most of the county. The extreme eastern portions of Bryan County are part of the Cypress Swamp and Forest. Average annual
The Climate of Haskell County
 The Climate of Haskell County Haskell County is part of the Hardwood Forest. The Hardwood Forest is characterized by its irregular landscape and the largest lake in Oklahoma, Lake Eufaula. Average annual
Champaign-Urbana 2000 Annual Weather Summary
 Champaign-Urbana 2000 Annual Weather Summary ILLINOIS STATE WATER SURVEY 2204 Griffith Dr. Champaign, IL 61820 wxobsrvr@sws.uiuc.edu Maria Peters, Weather Observer January: January started on a mild note,
Champaign-Urbana 1999 Annual Weather Summary
 Champaign-Urbana 1999 Annual Weather Summary ILLINOIS STATE WATER SURVEY 2204 Griffith Dr. Champaign, IL 61820 wxobsrvr@sws.uiuc.edu Maria Peters, Weather Observer A major snowstorm kicked off the new
Champaign-Urbana 1998 Annual Weather Summary
 Champaign-Urbana 1998 Annual Weather Summary ILLINOIS STATE WATER SURVEY Audrey Bryan, Weather Observer 2204 Griffith Dr. Champaign, IL 61820 wxobsrvr@sparc.sws.uiuc.edu The development of the El Nìno
CLIMATE OVERVIEW. Thunder Bay Climate Overview Page 1 of 5
 CLIMATE OVERVIEW The climate in the Thunder Bay area is typical of a mid-latitude inland location with a Great Lake Moderating influence. The moderating effect of Lake Superior results in cooler summer
APPENDIX G-7 METEROLOGICAL DATA
 APPENDIX G-7 METEROLOGICAL DATA METEOROLOGICAL DATA FOR AIR AND NOISE SAMPLING DAYS AT MMR Monthly Normals and Extremes for Honolulu International Airport Table G7-1 MMR RAWS Station Hourly Data Tables
A summary of the weather year based on data from the Zumwalt weather station
 ZUMWALT PRAIRIE WEATHER 2016 A summary of the weather year based on data from the Zumwalt weather station Figure 1. An unusual summer storm on July 10, 2016 brought the second-largest precipitation day
Third Grade Math and Science DBQ Weather and Climate/Representing and Interpreting Charts and Data
 Third Grade Math and Science DBQ Weather and Climate/Representing and Interpreting Charts and Data A document based question (DBQ) is an authentic assessment where students interact with content related
Third Grade Math and Science DBQ Weather and Climate/Representing and Interpreting Charts and Data - Teacher s Guide
 Third Grade Math and Science DBQ Weather and Climate/Representing and Interpreting Charts and Data - Teacher s Guide A document based question (DBQ) is an authentic assessment where students interact with
Drought in Southeast Colorado
 Drought in Southeast Colorado Nolan Doesken and Roger Pielke, Sr. Colorado Climate Center Prepared by Tara Green and Odie Bliss http://climate.atmos.colostate.edu 1 Historical Perspective on Drought Tourism
ZUMWALT WEATHER AND CLIMATE ANNUAL REPORT ( )
") ZUMWALT WEATHER AND CLIMATE ANNUAL REPORT (26-29) FINAL DRAFT (9 AUGUST 21) J.D. HANSEN 1, R.V. TAYLOR 2, AND V.S. JANSEN 3 INTRODUCTION The Zumwalt Prairie in northeastern Oregon is a unique grassland
ZUMWALT WEATHER AND CLIMATE ANNUAL REPORT (26-29) FINAL DRAFT (9 AUGUST 21) J.D. HANSEN 1, R.V. TAYLOR 2, AND V.S. JANSEN 3 INTRODUCTION The Zumwalt Prairie in northeastern Oregon is a unique grassland
Agricultural Science Climatology Semester 2, Anne Green / Richard Thompson
 Agricultural Science Climatology Semester 2, 2006 Anne Green / Richard Thompson http://www.physics.usyd.edu.au/ag/agschome.htm Course Coordinator: Mike Wheatland Course Goals Evaluate & interpret information,
Making a Climograph: GLOBE Data Explorations
 Making a Climograph: A GLOBE Data Exploration Purpose Students learn how to construct and interpret climographs and understand how climate differs from weather. Overview Students calculate and graph maximum
5.0 WHAT IS THE FUTURE ( ) WEATHER EXPECTED TO BE?
 WEATHER EXPECTED TO BE?") 5.0 WHAT IS THE FUTURE (2040-2049) WEATHER EXPECTED TO BE? This chapter presents some illustrative results for one station, Pearson Airport, extracted from the hour-by-hour simulations of the future period
5.0 WHAT IS THE FUTURE (2040-2049) WEATHER EXPECTED TO BE? This chapter presents some illustrative results for one station, Pearson Airport, extracted from the hour-by-hour simulations of the future period
Weather and Climate of the Rogue Valley By Gregory V. Jones, Ph.D., Southern Oregon University
 Weather and Climate of the Rogue Valley By Gregory V. Jones, Ph.D., Southern Oregon University The Rogue Valley region is one of many intermountain valley areas along the west coast of the United States.
Climate also has a large influence on how local ecosystems have evolved and how we interact with them.
 The Mississippi River in a Changing Climate By Paul Lehman, P.Eng., General Manager Mississippi Valley Conservation (This article originally appeared in the Mississippi Lakes Association s 212 Mississippi
CAMARGO RANCH, llc. CRAIG BUFORD BufordResources.com
 CAMARGO RANCH, llc 2897 +/- acre Wheat & Cattle Farm Mangum, greer county, oklahoma CRAIG BUFORD 405-833-9499 BufordResources.com 4101 Perimeter Center Dr., Suite 107 Oklahoma City, OK 73112 405.833.9499
Colorado State University, Fort Collins, CO Weather Station Monthly Summary Report
 Colorado State University, Fort Collins, CO Weather Station Monthly Summary Report Month: December Year: 2017 Temperature: Mean T max was 47.2 F which is 4.4 above the 1981-2010 normal for the month. This
Colorado s 2003 Moisture Outlook
 Colorado s 2003 Moisture Outlook Nolan Doesken and Roger Pielke, Sr. Colorado Climate Center Prepared by Tara Green and Odie Bliss http://climate.atmos.colostate.edu How we got into this drought! Fort
Monthly Long Range Weather Commentary Issued: February 15, 2015 Steven A. Root, CCM, President/CEO
 Monthly Long Range Weather Commentary Issued: February 15, 2015 Steven A. Root, CCM, President/CEO sroot@weatherbank.com JANUARY 2015 Climate Highlights The Month in Review During January, the average
Table of Contents. Page
 Eighteen Years (1990 2007) of Climatological Data on NMSU s Corona Range and Livestock Research Center Research Report 761 L. Allen Torell, Kirk C. McDaniel, Shad Cox, Suman Majumdar 1 Agricultural Experiment
Analysis of Rainfall and Other Weather Parameters under Climatic Variability of Parbhani ( )
") International Journal of Current Microbiology and Applied Sciences ISSN: 2319-7706 Volume 7 Number 06 (2018) Journal homepage: http://www.ijcmas.com Original Research Article https://doi.org/10.20546/ijcmas.2018.706.295
International Journal of Current Microbiology and Applied Sciences ISSN: 2319-7706 Volume 7 Number 06 (2018) Journal homepage: http://www.ijcmas.com Original Research Article https://doi.org/10.20546/ijcmas.2018.706.295
Local Ctimatotogical Data Summary White Hall, Illinois
 SWS Miscellaneous Publication 98-5 STATE OF ILLINOIS DEPARTMENT OF ENERGY AND NATURAL RESOURCES Local Ctimatotogical Data Summary White Hall, Illinois 1901-1990 by Audrey A. Bryan and Wayne Armstrong Illinois
Minnesota s Climatic Conditions, Outlook, and Impacts on Agriculture. Today. 1. The weather and climate of 2017 to date
 Minnesota s Climatic Conditions, Outlook, and Impacts on Agriculture Kenny Blumenfeld, State Climatology Office Crop Insurance Conference, Sep 13, 2017 Today 1. The weather and climate of 2017 to date
2011 Year in Review TORNADOES
 2011 Year in Review The year 2011 had weather events that will be remembered for a long time. Two significant tornado outbreaks in April, widespread damage and power outages from Hurricane Irene in August
2003 Moisture Outlook
 2003 Moisture Outlook Nolan Doesken and Roger Pielke, Sr. Colorado Climate Center Prepared by Tara Green and Odie Bliss http://climate.atmos.colostate.edu Through 1999 Through 1999 Fort Collins Total Water
Monthly Long Range Weather Commentary Issued: APRIL 1, 2015 Steven A. Root, CCM, President/CEO
 Monthly Long Range Weather Commentary Issued: APRIL 1, 2015 Steven A. Root, CCM, President/CEO sroot@weatherbank.com FEBRUARY 2015 Climate Highlights The Month in Review The February contiguous U.S. temperature
Monthly Long Range Weather Commentary Issued: SEPTEMBER 19, 2015 Steven A. Root, CCM, Chief Analytics Officer, Sr. VP, sales
 Monthly Long Range Weather Commentary Issued: SEPTEMBER 19, 2015 Steven A. Root, CCM, Chief Analytics Officer, Sr. VP, sales sroot@weatherbank.com AUGUST 2015 Climate Highlights The Month in Review The
Climate Change Impact on Air Temperature, Daily Temperature Range, Growing Degree Days, and Spring and Fall Frost Dates In Nebraska
 EXTENSION Know how. Know now. Climate Change Impact on Air Temperature, Daily Temperature Range, Growing Degree Days, and Spring and Fall Frost Dates In Nebraska EC715 Kari E. Skaggs, Research Associate
A Report on a Statistical Model to Forecast Seasonal Inflows to Cowichan Lake
 A Report on a Statistical Model to Forecast Seasonal Inflows to Cowichan Lake Prepared by: Allan Chapman, MSc, PGeo Hydrologist, Chapman Geoscience Ltd., and Former Head, BC River Forecast Centre Victoria
Jackson County 2013 Weather Data
 Jackson County 2013 Weather Data 61 Years of Weather Data Recorded at the UF/IFAS Marianna North Florida Research and Education Center Doug Mayo Jackson County Extension Director 1952-2008 Rainfall Data
Chiang Rai Province CC Threat overview AAS1109 Mekong ARCC
 Chiang Rai Province CC Threat overview AAS1109 Mekong ARCC This threat overview relies on projections of future climate change in the Mekong Basin for the period 2045-2069 compared to a baseline of 1980-2005.
November 2018 Weather Summary West Central Research and Outreach Center Morris, MN
 November 2018 Weather Summary Lower than normal temperatures occurred for the second month. The mean temperature for November was 22.7 F, which is 7.2 F below the average of 29.9 F (1886-2017). This November
Tracking the Climate Of Northern Colorado Nolan Doesken State Climatologist Colorado Climate Center Colorado State University
 Tracking the Climate Of Northern Colorado Nolan Doesken State Climatologist Colorado Climate Center Colorado State University Northern Colorado Business Innovations November 20, 2013 Loveland, Colorado
Final Report. COMET Partner's Project. University of Texas at San Antonio
 Final Report COMET Partner's Project University: Name of University Researcher Preparing Report: University of Texas at San Antonio Dr. Hongjie Xie National Weather Service Office: Name of National Weather
Wind Resource Data Summary Cotal Area, Guam Data Summary and Transmittal for December 2011
 Wind Resource Data Summary Cotal Area, Guam Data Summary and Transmittal for December 2011 Prepared for: GHD Inc. 194 Hernan Cortez Avenue 2nd Floor, Ste. 203 Hagatna, Guam 96910 January 2012 DNV Renewables
Memo. I. Executive Summary. II. ALERT Data Source. III. General System-Wide Reporting Summary. Date: January 26, 2009 To: From: Subject:
 Memo Date: January 26, 2009 To: From: Subject: Kevin Stewart Markus Ritsch 2010 Annual Legacy ALERT Data Analysis Summary Report I. Executive Summary The Urban Drainage and Flood Control District (District)
TILT, DAYLIGHT AND SEASONS WORKSHEET
 TILT, DAYLIGHT AND SEASONS WORKSHEET Activity Description: Students will use a data table to make a graph for the length of day and average high temperature in Utah. They will then answer questions based
Constructing a typical meteorological year -TMY for Voinesti fruit trees region and the effects of global warming on the orchard ecosystem
 Constructing a typical meteorological year -TMY for Voinesti fruit trees region and the effects of global warming on the orchard ecosystem ARMEANU ILEANA*, STĂNICĂ FLORIN**, PETREHUS VIOREL*** *University
What is happening to the Jamaican climate?
 What is happening to the Jamaican climate? Climate Change and Jamaica: Why worry? Climate Studies Group, Mona (CSGM) Department of Physics University of the West Indies, Mona Part 1 RAIN A FALL, BUT DUTTY
SEPTEMBER 2013 REVIEW
 Monthly Long Range Weather Commentary Issued: October 21, 2013 Steven A. Root, CCM, President/CEO sroot@weatherbank.com SEPTEMBER 2013 REVIEW Climate Highlights The Month in Review The average temperature
Drought Characterization. Examination of Extreme Precipitation Events
 Drought Characterization Examination of Extreme Precipitation Events Extreme Precipitation Events During the Drought For the drought years (1999-2005) daily precipitation data was analyzed to find extreme
KANSAS CLIMATE SUMMARY August 2015
 KANSAS CLIMATE SUMMARY August 2015 Cool and Dry August was drier than normal in most of the state. State-wide average precipitation was 2.80 inches or 85 percent of normal. The Northeast division of the
but 2012 was dry Most farmers pulled in a crop
 After a winter that wasn t, conditions late in the year pointed to a return to normal snow and cold conditions Most farmers pulled in a crop but 2012 was dry b y M i k e Wr o b l e w s k i, w e a t h e
Weather in Saskatchewan. John Paul Cragg Warning Preparedness Meteorologist Environment and Climate Change Canada
 Weather in Saskatchewan John Paul Cragg Warning Preparedness Meteorologist Environment and Climate Change Canada The Climate of Saskatchewan -35 Average January Low Temperature -30-25 -20-15 -10-5 0 5
CLIMATE OF THE ZUMWALT PRAIRIE OF NORTHEASTERN OREGON FROM 1930 TO PRESENT
 CLIMATE OF THE ZUMWALT PRAIRIE OF NORTHEASTERN OREGON FROM 19 TO PRESENT 24 MAY Prepared by J. D. Hansen 1, R.V. Taylor 2, and H. Schmalz 1 Ecologist, Turtle Mt. Environmental Consulting, 652 US Hwy 97,
The Weather Wire. Current Colorado Snowpack. Contents:
 The Weather Wire January 2019 Volume 26 Number 1 Contents: Current Colorado Snowpack Denver Snowfall Since 1999-2000 Denver 2018 Climate Review Drought Monitor December Summary/Statistics January Preview
The weather in Iceland 2012
 The Icelandic Meteorological Office Climate summary 2012 published 9.1.2013 The weather in Iceland 2012 Climate summary Sunset in Reykjavík 24th April 2012 at 21:42. View towards west from the balcony
Vermont Soil Climate Analysis Network (SCAN) sites at Lye Brook and Mount Mansfield
 sites at Lye Brook and Mount Mansfield") Vermont Soil Climate Analysis Network (SCAN) sites at Lye Brook and Mount Mansfield 13 Years of Soil Temperature and Soil Moisture Data Collection September 2000 September 2013 Soil Climate Analysis Network
Vermont Soil Climate Analysis Network (SCAN) sites at Lye Brook and Mount Mansfield 13 Years of Soil Temperature and Soil Moisture Data Collection September 2000 September 2013 Soil Climate Analysis Network
Variability of Reference Evapotranspiration Across Nebraska
 Know how. Know now. EC733 Variability of Reference Evapotranspiration Across Nebraska Suat Irmak, Extension Soil and Water Resources and Irrigation Specialist Kari E. Skaggs, Research Associate, Biological
The Pennsylvania Observer
 The Pennsylvania Observer May 31, 2012 May 2012 - Pennsylvania Weather Recap By: Paul Knight The majority of the fifth month had temperatures averaging well above seasonal levels with two distinct hot
October 2015 Volume 22 Number 10
 The Weather Wire October 2015 Volume 22 Number 10 Contents: Local Frost/Freeze Information Drought Monitor September Summary/Statistics October Preview Rainfall Totals Local Frost Freeze Information Many
February 10, Mr. Jeff Smith, Chairman Imperial Valley Water Authority E County Road 1000 N Easton, IL Dear Chairman Smith:
 February 1, 1 Mr. Jeff Smith, Chairman Imperial Valley Water Authority 8 E County Road 1 N Easton, IL Dear Chairman Smith: The Illinois State Water Survey (ISWS), under contract to the Imperial Valley
September 2018 Weather Summary West Central Research and Outreach Center Morris, MN
 September 2018 Weather Summary The mean temperature for September was 60.6 F, which is 1.5 F above the average of 59.1 F (1886-2017). The high temperature for the month was 94 F on September 16 th. The
Colorado State University, Fort Collins, CO Weather Station Monthly Summary Report
 Colorado State University, Fort Collins, CO Weather Station Monthly Summary Report Month: December Year: 2016 Temperature: Mean T max was 39.7 F which is 3.1 below the 1981-2010 normal for the month. This
SEASONAL AND DAILY TEMPERATURES
 1 2 3 4 5 6 7 8 9 10 11 12 SEASONAL AND DAILY TEMPERATURES Chapter 3 Earth revolves in elliptical path around sun every 365 days. Earth rotates counterclockwise or eastward every 24 hours. Earth closest
Climate of Columbus. Aaron Wilson. Byrd Polar & Climate Research Center State Climate Office of Ohio.
 Climate of Columbus Aaron Wilson Byrd Polar & Climate Research Center http://bpcrc.osu.edu/greenteam Overview Historical Climatology Climate Change & Impacts Projected Changes Summary 2 Historical Climatology
LOCAL CLIMATOLOGICAL DATA Monthly Summary July 2013
 Deg. Days Precip Ty Precip Wind Solar Hu- Adj. to Sea Level mid- ity Avg Res Res Peak Minute 1 fog 2 hvy fog 3 thunder 4 ice plt 5 hail 6 glaze 7 duststm 8 smk, hz 9 blw snw 1 2 3 4A 4B 5 6 7 8 9 12 14
CoCoRaHS Monitoring Colorado s s Water Resources through Community Collaborations
 CoCoRaHS Monitoring Colorado s s Water Resources through Community Collaborations Nolan Doesken Colorado Climate Center Atmospheric Science Department Colorado State University Presented at Sustaining
Case Study Las Vegas, Nevada By: Susan Farkas Chika Nakazawa Simona Tamutyte Zhi-ya Wu AAE/AAL 330 Design with Climate
 Case Study Las Vegas, Nevada By: Susan Farkas Chika Nakazawa Simona Tamutyte Zhi-ya Wu AAE/AAL 330 Design with Climate Professor Alfredo Fernandez-Gonzalez School of Architecture University of Nevada,
KANSAS CLIMATE SUMMARY January 2018
 KANSAS CLIMATE SUMMARY January 2018 Some welcome moisture After an extended period with little to no moisture, parts of Kansas recorded some significant precipitation. At Tribune, a small snow event on
Changing Hydrology under a Changing Climate for a Coastal Plain Watershed
 Changing Hydrology under a Changing Climate for a Coastal Plain Watershed David Bosch USDA-ARS, Tifton, GA Jeff Arnold ARS Temple, TX and Peter Allen Baylor University, TX SEWRU Objectives 1. Project changes
Why the Earth has seasons. Why the Earth has seasons 1/20/11
 Chapter 3 Earth revolves in elliptical path around sun every 365 days. Earth rotates counterclockwise or eastward every 24 hours. Earth closest to Sun (147 million km) in January, farthest from Sun (152
Arizona Climate Summary May 2012
 Arizona Climate Summary May 2012 Summary of conditions for April 2012 April 2012 Temperature and Precipitation Summary April 1 st 16 th : Although April began with another low pressure system sweeping
AgWeatherNet and WA Climate Nic Loyd Meteorologist and Associate in Research AgWeatherNet
 AgWeatherNet and WA Climate Nic Loyd Meteorologist and Associate in Research AgWeatherNet February 23, 2017 Lewis County WSU Extension; Chehalis, WA AgWeatherNet Background WA Climate: Past, Present, and
LOCAL CLIMATOLOGICAL DATA Monthly Summary September 2016
 Deg. Days Precip Ty Precip Wind Solar Hu- Adj. to Sea Level mid- ity Avg Res Res Peak 2 Minute 1 fog 2 hvy fog 3 thunder 4 ice plt 5 hail 6 glaze 7 duststm 8 smk, hz 9 blw snw 1 2 3 4A 4B 5 6 7 8 9 11
WHEN IS IT EVER GOING TO RAIN? Table of Average Annual Rainfall and Rainfall For Selected Arizona Cities
 WHEN IS IT EVER GOING TO RAIN? Table of Average Annual Rainfall and 2001-2002 Rainfall For Selected Arizona Cities Phoenix Tucson Flagstaff Avg. 2001-2002 Avg. 2001-2002 Avg. 2001-2002 October 0.7 0.0
Weather History on the Bishop Paiute Reservation
 Weather History on the Bishop Paiute Reservation -211 For additional information contact Toni Richards, Air Quality Specialist 76 873 784 toni.richards@bishoppaiute.org Updated 2//214 3:14 PM Weather History
Monthly Long Range Weather Commentary Issued: APRIL 18, 2017 Steven A. Root, CCM, Chief Analytics Officer, Sr. VP,
 Monthly Long Range Weather Commentary Issued: APRIL 18, 2017 Steven A. Root, CCM, Chief Analytics Officer, Sr. VP, sroot@weatherbank.com MARCH 2017 Climate Highlights The Month in Review The average contiguous
May 2016 Volume 23 Number 5
 The Weather Wire May 2016 Volume 23 Number 5 Contents: Winter Summary Current Colorado and West-wide Snow Pack Drought Monitor April Summary/Statistics May Preview Snowfall Totals Winter Summary The Front
Funding provided by NOAA Sectoral Applications Research Project CLIMATE. Basic Climatology Colorado Climate Center
 Funding provided by NOAA Sectoral Applications Research Project CLIMATE Basic Climatology Colorado Climate Center Remember These? Factor 1: Our Energy Source Factor 2: Revolution & Tilt Factor 3: Rotation!
Applications/Users for Improved S2S Forecasts
 Applications/Users for Improved S2S Forecasts Nolan Doesken Colorado Climate Center Colorado State University WSWC Precipitation Forecasting Workshop June 7-9, 2016 San Diego, CA First -- A short background
Monthly Long Range Weather Commentary Issued: NOVEMBER 16, 2015 Steven A. Root, CCM, Chief Analytics Officer, Sr. VP, sales
 Monthly Long Range Weather Commentary Issued: NOVEMBER 16, 2015 Steven A. Root, CCM, Chief Analytics Officer, Sr. VP, sales sroot@weatherbank.com OCTOBER 2015 Climate Highlights The Month in Review The
NATIONAL HYDROPOWER ASSOCIATION MEETING. December 3, 2008 Birmingham Alabama. Roger McNeil Service Hydrologist NWS Birmingham Alabama
 NATIONAL HYDROPOWER ASSOCIATION MEETING December 3, 2008 Birmingham Alabama Roger McNeil Service Hydrologist NWS Birmingham Alabama There are three commonly described types of Drought: Meteorological drought
2015 Fall Conditions Report
 2015 Fall Conditions Report Prepared by: Hydrologic Forecast Centre Date: December 21 st, 2015 Table of Contents Table of Figures... ii EXECUTIVE SUMMARY... 1 BACKGROUND... 2 SUMMER AND FALL PRECIPITATION...
Let s Talk Climate! Nolan Doesken Colorado Climate Center Colorado State University. Yampatika Seminar February 16, 2011 Steamboat Springs, Colorado
 Let s Talk Climate! Nolan Doesken Colorado Climate Center Colorado State University Yampatika Seminar February 16, 2011 Steamboat Springs, Colorado First -- A short background In 1973 the federal government
Marche Region Climate Analysis by Danilo Tognetti 1
 Marche Region. 2016 Climate Analysis by Danilo Tognetti 1 With the contribution of eight consecutive high monthly temperature records set from January to August, and the remainder of the months ranking
The Climate of Oregon Climate Zone 3 Southwest Interior
 .k) 105 Unbound issue " " 1 4oes not circulate C4P. Special Report 915 May 1993 The Climate of Oregon Climate Zone 3 Southwest Interior Property of OREGON STATE UNIVERSITY Library Serials Corvallis, OR
HAIDA GWAII CLIMATE ASSESSMENT 2010 Special Report for MIEDS Franc Pridoehl
 HAIDA GWAII CLIMATE ASSESSMENT 2010 Special Report for MIEDS Franc Pridoehl INTRODUCTION Climatic conditions have varied considerably on Haida Gwaii over the past centuries and millennia (Hebda 2007).
Communicating Climate Change Consequences for Land Use
 Communicating Climate Change Consequences for Land Use Site: Prabost, Skye. Event: Kyle of Lochalsh, 28 th February 28 Further information: http://www.macaulay.ac.uk/ladss/comm_cc_consequences.html Who
Table 13 Maximum dewpoint temperature (degrees Celsius), primary meteorological station, H. J. Andrews Experimental Forest, 5/10/72 through 12/31/84
, primary meteorological station, H. J. Andrews Experimental Forest, 5/10/72 through 12/31/84") Table 13 Maximum dewpoint temperature (degrees Celsius), primary meteorological station, H. J. Andrews Experimental Forest, 5/10/72 through 12/31/84 Table 14 Mean nighttime dewpoint temperature (degrees
Table 13 Maximum dewpoint temperature (degrees Celsius), primary meteorological station, H. J. Andrews Experimental Forest, 5/10/72 through 12/31/84 Table 14 Mean nighttime dewpoint temperature (degrees
REDWOOD VALLEY SUBAREA
 Independent Science Review Panel Conceptual Model of Watershed Hydrology, Surface Water and Groundwater Interactions and Stream Ecology for the Russian River Watershed Appendices A-1 APPENDIX A A-2 REDWOOD
KANSAS CLIMATE SUMMARY May 2018
 KANSAS CLIMATE SUMMARY May 2018 From Cold to Hot May came close to setting the record as the hottest since 1895. The state-wide average temperature for the month was 70.6 o F. This was 7.2 degrees warmer
Coupling Climate to Clouds, Precipitation and Snow
 Coupling Climate to Clouds, Precipitation and Snow Alan K. Betts akbetts@aol.com http://alanbetts.com Co-authors: Ray Desjardins, Devon Worth Agriculture and Agri-Food Canada Shusen Wang and Junhua Li
Presentation Overview. Southwestern Climate: Past, present and future. Global Energy Balance. What is climate?
 Southwestern Climate: Past, present and future Mike Crimmins Climate Science Extension Specialist Dept. of Soil, Water, & Env. Science & Arizona Cooperative Extension The University of Arizona Presentation
Analysis of meteorological measurements made over three rainy seasons in Sinazongwe District, Zambia.
 Analysis of meteorological measurements made over three rainy seasons in Sinazongwe District, Zambia. 1 Hiromitsu Kanno, 2 Hiroyuki Shimono, 3 Takeshi Sakurai, and 4 Taro Yamauchi 1 National Agricultural