Case Study Las Vegas, Nevada By: Susan Farkas Chika Nakazawa Simona Tamutyte Zhi-ya Wu AAE/AAL 330 Design with Climate
|
|
|
- Rosaline Crawford
- 6 years ago
- Views:
Transcription
1 Case Study Las Vegas, Nevada By: Susan Farkas Chika Nakazawa Simona Tamutyte Zhi-ya Wu AAE/AAL 330 Design with Climate Professor Alfredo Fernandez-Gonzalez School of Architecture University of Nevada, Las Vegas Spring 2004

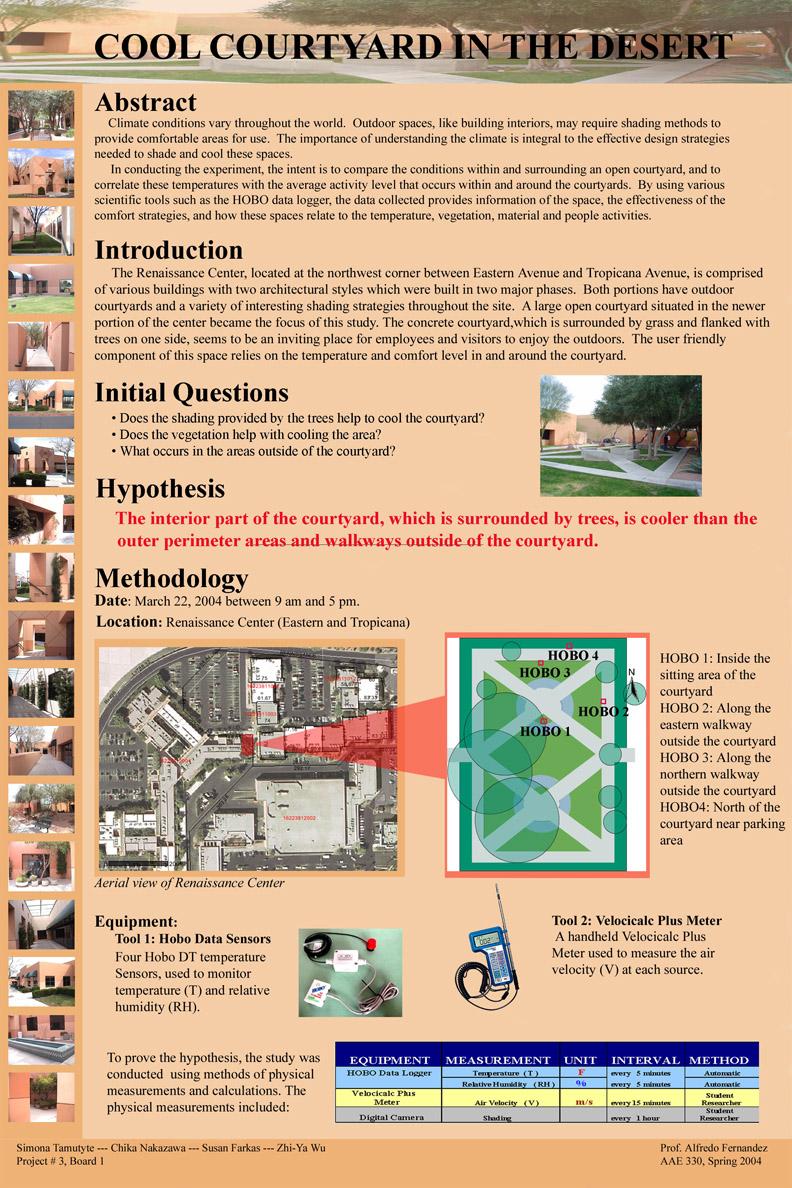
2 ABSTRACT Climate conditions vary throughout the world. Outdoor spaces, like building interiors, may require shading methods to provide comfortable areas for use. The importance of understanding the climate is integral to the effective design strategies needed to shade and cool these spaces The proposed study is an exercise for the AAE/AAL330 Design with Climate course at the University of Nevada, Las Vegas. It is an analysis of outdoor shading devices and cooling strategies at the Renaissance Center in Las Vegas, Nevada. By investigating a specific area within the complex area, the existing outdoor design strategies for shading and cooling can be studied for its effectiveness and alternate options can be suggested. In conducting the experiment, the intent is to compare the conditions within and surrounding an open courtyard, and to correlate these temperatures with the average activity level that occurs within and around the courtyards. By using various scientific tools such as the HOBO data logger, the data collected provides information of the space, the effectiveness of the comfort strategies, and how these spaces relate to the temperature vegetation, material and people activities. INTRODUCTION The desert climate of Las Vegas, Nevada can have extreme weather conditions throughout the year. Winters tend to be cool and windy, while summers temperatures reach 105º Fahrenheit (40º Celsius) from May through September with a few days exceeding 115º Fahrenheit (46º Celsius). Most of the annual 4 inches of rain fall occurs between January and March. Table 1 Average Las Vegas Temperature Chart
 Jan Feb Based on data reported by main weather stations Monthly Averages * Mar Apr May Jun Jul Aug Sep Oct Nov Dec 57 / 14 63 / 17 68 / 20 77 / 25 87 / 31 100 / 38 105 / 41 103 / 40 94 /")
3 Table 2 Average weather in Las Vegas, Nevada High Temperature ( F / C ) Average Temperature ( F / C ) Low Temperature ( F / C ) Morning Humidity (%) Afternoon Humidity (%) Wind speed (mph) (meter/sec) Jan Feb Based on data reported by main weather stations Monthly Averages * Mar Apr May Jun Jul Aug Sep Oct Nov Dec 57 / / / / / / / / / / / / / 7 49 / 9 55 / / / / / / / / / / 7 33 / 1 38 / 4 44 / 7 50 / / / / / / / / 6 33 / Wind Direction WNW WNW SW SW SW SW S SW SW WSW WSW WNW * Orange region denotes the month study was conducted. The Renaissance Center, located at the busy northwest corner between Eastern Avenue and Tropicana Avenue, is comprised of various buildings with two major architectural styles which were built in two major phases. The old portion, which consists of many small office areas linked by a series of courtyard, and the new portion, which consists of big office areas embellished by several courtyards, displays two architectural expressions of the Center. Photograph 1: Renaissance Center Both portions have outdoor courtyards which serve to link not only each building but also connect the two distinct built phases of the center. Both phases utilize the courtyards for circulation not only between the buildings, but also to link the two phases.

4 The Renaissance Center has a variety of interesting shading strategies used throughout the site. A large open main courtyard at the newer portion of the Renaissance Complex became the focus of this study. Situated in the newer phase of the complex, the concrete courtyard surrounded by grass and flanked with trees on one side, seems to be an inviting place for employees and visitors to enjoy the outdoors. The user friendly component of this space relies on the temperature and comfort level in and around the courtyard. Photograph 2: Open space courtyard The 20 ft. x 40 ft paved courtyard is comprised of two sections, each having 4 concrete block benches and is situated along the north-south axis. East of the courtyard, a one story office complex sits approximately 30 feet away with open space between. Several trees line the western part of the courtyard with a one story building just beyond. Parking areas are north and south of the courtyard, approximately 40 feet from the courtyard. Walkways on the east, north and south link the parking lots and office buildings to the courtyard. During the initial site visit, several questions arose about the courtyard including the following: Does the shading provided by the trees help to cool the courtyard? Does the vegetation help with cooling the area? What occurs in the areas outside of the courtyard? Based upon these questions and observations during this initial visit, the student research group hypothesized that the temperature and comfort level is cooler within the courtyard than outside of the courtyard. To test this hypothesis, equipment was placed in strategic areas to collect data pertaining to the temperature, humidity and air velocity. The results clearly supported the hypothesis statement - that the area within the courtyard was cooler than that of the outer perimeter area. Additionally, the air velocity was effective in evaporative cooling when temperatures became high. HYPOTHESIS The intent of this study is to examine the interior courtyard and its surrounding area and observe the characteristics of comfort levels achieved with air temperature, relative humidity and air velocity. The hypothesis is: The interior part of the courtyard, which is surrounded by trees on the western side, is cooler than the outer eastern and northern perimeter areas outside of the courtyard.


5 METHODS Date: Data was collected from four sources in and around the courtyard on March 22, 2004 between 9 am and 5 pm. Location: Renaissance Center open courtyard in new phase. Equipment: Four Hobo Data Sensors by Onset, Inc. These measure temperature (T) and relative humidity (RH). The collected data can be downloaded to a computer spreadsheet program for further analysis. VELOCICALC Plus Meter by TSI, Inc. Using a single probe (Pitot tube), this handheld instrument simultaneously measures logs various ventilation parameters. Once collected, this data can be downloaded to a computer spreadsheet program. For this study, the Velocicalc Plus Meter was used to measure air velocity (V). Equipment Placement: Four HOBO data loggers were secured to the tops of 2 posts that were rods that were placed in the following four locations in and around the courtyard: HOBO 1: Inside the sitting area of the courtyard HOBO 2: Along the eastern walkway outside the courtyard HOBO 3: Along the northern walkway outside the courtyard HOBO 4: North of the courtyard near parking area Additionally, the Velocicalc Plus Meter was taken to each HOBO location to measure the air velocity at 15 minute intervals.
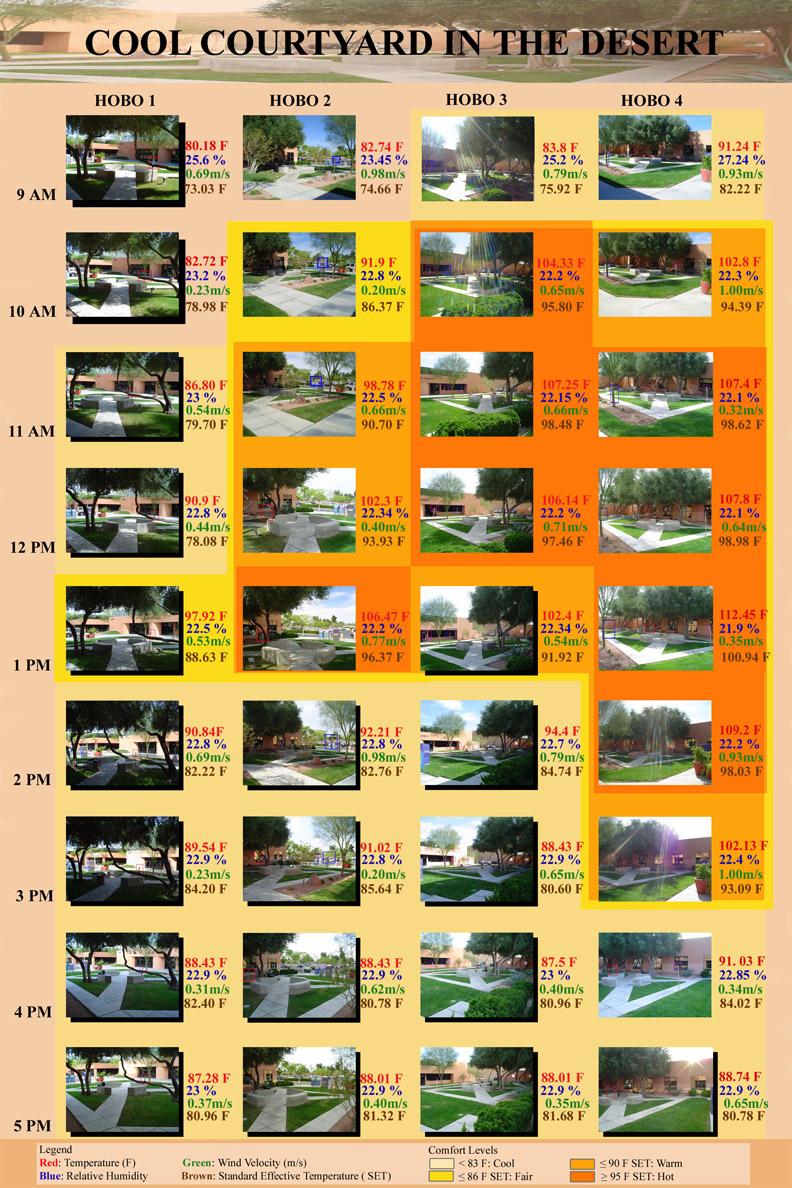
6 Once collected, the data was downloaded and plotted to show correlations of temperature and comfort levels. A final analysis was compiled to show the results. Monitoring the Shade: Trees and buildings can provide shading and create cooler areas. Hourly photographs of the four HOBO locations were taken by the student researchers. The objective was to have visual data to track the shade in the designated areas of study. To prove the hypothesis, the study was conducted using methods of physical measurements and calculations. The physical measurements included: Table 3 EQUIPMENT & METHOD OF MEASURING DATA EQUIPMENT MEASUREMENT UNIT INTERVAL METHOD HOBO Data Logger Temperature ( T ) F every 5 minutes Automatic Relative Humidity ( RH ) % every 5 minutes Automatic Velocicalc Plus Meter Air Velocity ( V ) m/s every 15 minutes Digital Camera Shading every 1 hour Student Researcher Student Researcher Once the information was gathered and downloaded, analysis of the data followed. The ASHRAE Thermal Comfort Program was used to calculate the Standard Effective Temperature Index for the adjusted shift in thermal comfort of the area. SHADING RESULTS Photographs were taken every hour at the top of the hour to track the shading within the designated space. The photographs resulted in showing the times that the HOBO areas were shaded: Table 4 SHADING TIME TABLE LOCATION HOBO 1 HOBO 2 HOBO 3 HOBO 4 TIME AREA WAS SHADED 10AM - 5 PM 2PM - 5 PM 1PM - 5 PM 5 PM
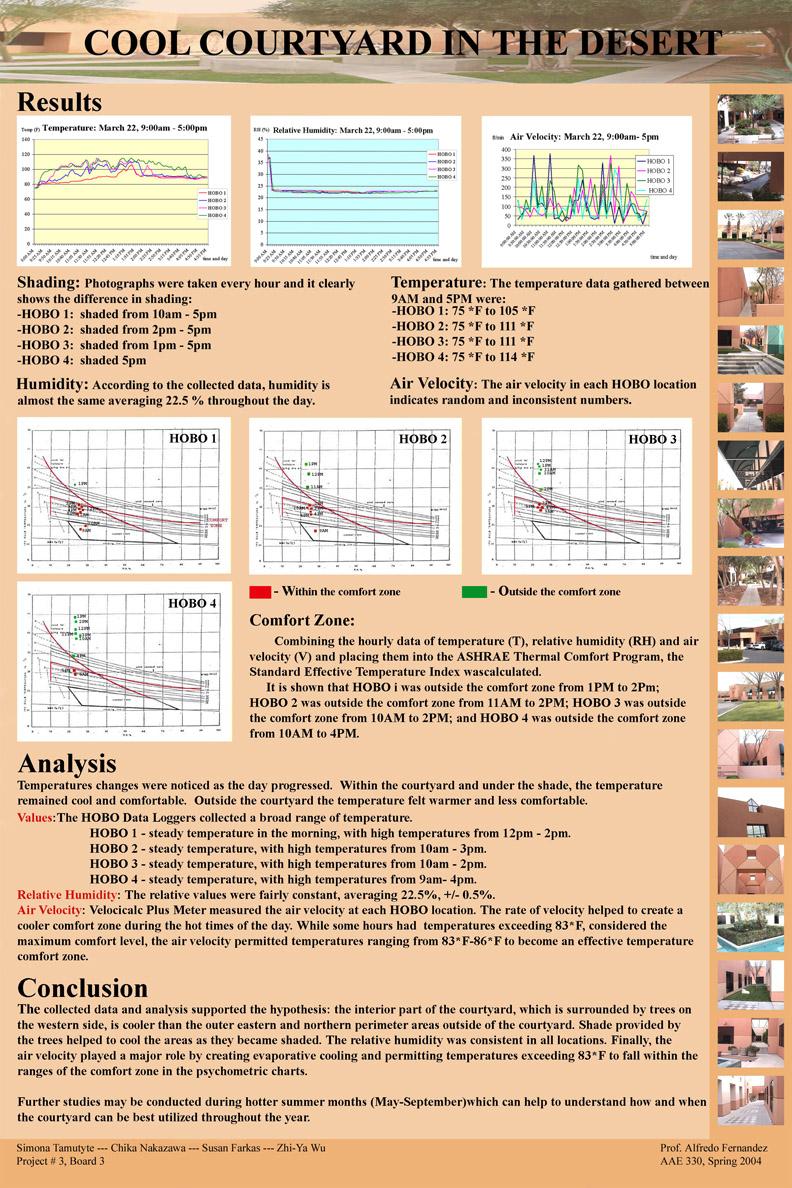
7 TEMPERATURE Meteorological data for March 22, 2004 was reported at Las Vegas McCarran International Airport (approx. 5 miles from Renaissance Center): Table 5 Las Vegas 30 Year Temp. Averages & Records March Monthly Average/Records March 22, 2004 Normal High (F / C) 68 / / 21 Normal Low (F / C) 44 / 7 45 / 7 Record High (F / C) 91 / / 31 Record Low (F / C) 23 / / 0 Mean (F / C) 56 / / 14 Normal Precip (in) The collected Hobo data was downloaded and a graph was prepared to show the relationship between the four locations. Table 6 Temp (F) 140 Temperature: March 22, 9:00am - 5:00pm :00 AM 9:25 AM 9:50 AM 10:15 AM 10:40 AM 11:05 AM 11:30 AM 11:55 AM 12:20 PM 12:45 PM 1:10 PM 1:35 PM 2:00 PM 2:25 PM 2:50 PM 3:15 PM 3:40 PM 4:05 PM 4:30 PM 4:55 PM HOBO 1 HOBO 2 HOBO 3 HOBO 4 time and day
8 HUMIDITY According to the Hobo data, the humidity of the positions were almost the same. Table 7 RH (%) 45 Relative Humidity: March 22, 9:00am - 5:00pm AIR VELOCITY 5 0 9:00 AM 9:25 AM 9:50 AM 10:15 AM 10:40 AM 11:05 AM 11:30 AM 11:55 AM 12:20 PM 12:45 PM 1:10 PM 1:35 PM 2:00 PM 2:25 PM 2:50 PM 3:15 PM 3:40 PM 4:05 PM 4:30 PM 4:55 PM HOBO 1 HOBO 2 HOBO 3 HOBO 4 time and day The air velocity for each HOBO location indicates random and inconsistent numbers. Table 8 Air Velocity 400 Air speed (feet/min) hobo 1 hobo 2 hobo 3 hobo 4 0 9:00 9:45 10:30 11:15 12:00 12:45 13:30 14:15 15:00 15:45 16:30 Time
9 COMFORT ZONE Combining the hourly data of temperature (T), relative humidity (RH) and air velocity (V) and placing them into the ASHRAE Thermal Comfort Program, the Standard Effective Temperature Index was calculated. This index permits the comfort level to shift upward in the psychometric charts (Table 9) The shift changes the average comfort level of 83º F to move upward to 86º F, primarily as a result of the evaporative cooling from the air velocity that occurs at various times of the day. Table 9 PSYCHOMETRIC CHARTS HOBO 1 HOBO 2 Outside comfort zone from 1pm 2pm Outside comfort zone from 11am 2pm HOBO 3 HOBO 4 Outside comfort zone from 10am - 2pm Outside comfort zone from 10am 4pm
10 ANALYSIS During the data collecting, each student researcher was assigned to spend 2 3 hours at the courtyard between 9am and 5 pm. While collecting data throughout the day, noticeable temperature changes were felt as the day progressed. Within the courtyard, under the shade, the temperature remained cool and comfortable, while outside the courtyard the temperature felt warmer and less comfortable. SHADING HOBO 1 Shading from the morning hours of 10 am and onward kept the area cooler with the highest temperatures occurring at 1pm HOBO 2 Shade occurred in the mid afternoon hours of 2 pm onward. This caused higher temperature conditions from 11 am 2 pm. HOBO 3 Shade began to fall upon this area from 1pm onward, with the temperatures dropping only after 3pm. HOBO 4 This area was exposed to the sun throughout the entire study period, from 9am 5pm. Temperatures rose dramatically to over 100º F as early as 10am and remained extremely hot until 4pm. The HOBO Data Loggers collected a broad range of temperature and relative humidity values. The temperature data resulted in a quick analysis and understanding. The temperature graph (Table 6) displays the varied values that each HOBO collected. The following analysis can be made: VALUES HOBO 1 - These values were dramatically different as the distance to the other HOBOs became greater. The values between HOBO 1 and HOBO 4 were the most extreme. HOBO 2 The values were fairly similar to HOBO 1 and HOBO 3. HOBO 3 The values were somewhat similar to HOBO 1 and HOBO 2. HOBO 4 These values were much higher than the rest of the HOBOs. RELATIVE HUMIDITY The relative humidity values were fairly constant inside and surrounding the courtyard throughout the day, averaging 22.5%, +/- 0.5 %. The dryness of the desert climate supports the consistency that this would be relatively constant. AIR VELOCITY Velocicalc Plus Meters measured the air velocity at each HOBO location. The rate of speed (m/s) helped to create a cooler comfort zone during the hot times throughout the day. While some hours had temperatures exceeding 83º F that is normally the maximum comfort level, the air velocity permitted temperatures ranging from 83º F - 86º F to become an effective temperature comfort level.
11 CONCLUSIONS The collected data and analysis supported the hypothesis that the inside courtyard was cooler in temperature and had a more comfortable level while the areas outside the courtyard were warmer and less comfortable. The temperature analysis showed that there is a difference in temperature range between the HOBO locations due to the placement. The shading by the trees on the western side also helped to cool the areas that became shaded. The relative humidity was consistent in all locations and did not have as much effect on the cooling and comfort level as the shading did. Finally, the air velocity played a major role by creating evaporative cooling and permitting temperatures exceeding the 83º F to also become within the ranges of the comfort zone in the psychometric charts. The information gathered and analyzed during this study can provide information for most of the mild months of weather conditions at the Renaissance Center. Further studies may be conducted during hotter months (May September) which can help to understand how the courtyard can be best utilized throughout the year. It may also be helpful to collect data for longer periods of time to establish more precise information. REFERENCES (Las Vegas Climate Data)
12
13
14
Weather History on the Bishop Paiute Reservation
 Weather History on the Bishop Paiute Reservation -211 For additional information contact Toni Richards, Air Quality Specialist 76 873 784 toni.richards@bishoppaiute.org Updated 2//214 3:14 PM Weather History
Champaign-Urbana 2001 Annual Weather Summary
 Champaign-Urbana 2001 Annual Weather Summary ILLINOIS STATE WATER SURVEY 2204 Griffith Dr. Champaign, IL 61820 wxobsrvr@sws.uiuc.edu Maria Peters, Weather Observer January: After a cold and snowy December,
Champaign-Urbana 1999 Annual Weather Summary
 Champaign-Urbana 1999 Annual Weather Summary ILLINOIS STATE WATER SURVEY 2204 Griffith Dr. Champaign, IL 61820 wxobsrvr@sws.uiuc.edu Maria Peters, Weather Observer A major snowstorm kicked off the new
APPENDIX G-7 METEROLOGICAL DATA
 APPENDIX G-7 METEROLOGICAL DATA METEOROLOGICAL DATA FOR AIR AND NOISE SAMPLING DAYS AT MMR Monthly Normals and Extremes for Honolulu International Airport Table G7-1 MMR RAWS Station Hourly Data Tables
UWM Field Station meteorological data
 University of Wisconsin Milwaukee UWM Digital Commons Field Station Bulletins UWM Field Station Spring 992 UWM Field Station meteorological data James W. Popp University of Wisconsin - Milwaukee Follow
The Climate of Payne County
 The Climate of Payne County Payne County is part of the Central Great Plains in the west, encompassing some of the best agricultural land in Oklahoma. Payne County is also part of the Crosstimbers in the
The Climate of Marshall County
 The Climate of Marshall County Marshall County is part of the Crosstimbers. This region is a transition region from the Central Great Plains to the more irregular terrain of southeastern Oklahoma. Average
The Climate of Murray County
 The Climate of Murray County Murray County is part of the Crosstimbers. This region is a transition between prairies and the mountains of southeastern Oklahoma. Average annual precipitation ranges from
Champaign-Urbana 1998 Annual Weather Summary
 Champaign-Urbana 1998 Annual Weather Summary ILLINOIS STATE WATER SURVEY Audrey Bryan, Weather Observer 2204 Griffith Dr. Champaign, IL 61820 wxobsrvr@sparc.sws.uiuc.edu The development of the El Nìno
The Climate of Bryan County
 The Climate of Bryan County Bryan County is part of the Crosstimbers throughout most of the county. The extreme eastern portions of Bryan County are part of the Cypress Swamp and Forest. Average annual
WHEN IS IT EVER GOING TO RAIN? Table of Average Annual Rainfall and Rainfall For Selected Arizona Cities
 WHEN IS IT EVER GOING TO RAIN? Table of Average Annual Rainfall and 2001-2002 Rainfall For Selected Arizona Cities Phoenix Tucson Flagstaff Avg. 2001-2002 Avg. 2001-2002 Avg. 2001-2002 October 0.7 0.0
CLIMATE OVERVIEW. Thunder Bay Climate Overview Page 1 of 5
 CLIMATE OVERVIEW The climate in the Thunder Bay area is typical of a mid-latitude inland location with a Great Lake Moderating influence. The moderating effect of Lake Superior results in cooler summer
Weather and Climate of the Rogue Valley By Gregory V. Jones, Ph.D., Southern Oregon University
 Weather and Climate of the Rogue Valley By Gregory V. Jones, Ph.D., Southern Oregon University The Rogue Valley region is one of many intermountain valley areas along the west coast of the United States.
The Climate of Texas County
 The Climate of Texas County Texas County is part of the Western High Plains in the north and west and the Southwestern Tablelands in the east. The Western High Plains are characterized by abundant cropland
The Climate of Grady County
 The Climate of Grady County Grady County is part of the Central Great Plains, encompassing some of the best agricultural land in Oklahoma. Average annual precipitation ranges from about 33 inches in northern
2016 Meteorology Summary
 2016 Meteorology Summary New Jersey Department of Environmental Protection AIR POLLUTION AND METEOROLOGY Meteorology plays an important role in the distribution of pollution throughout the troposphere,
The Climate of Seminole County
 The Climate of Seminole County Seminole County is part of the Crosstimbers. This region is a transition region from the Central Great Plains to the more irregular terrain of southeastern Oklahoma. Average
The Climate of Oregon Climate Zone 5 High Plateau
 105 E55 Unbound issue i". 9 13oes not circulate CZe Special Report 917 May 1993 The Climate of Oregon Climate Zone 5 Property of OREGON STATE UNIVERSITY Library Serials Corvallis, OR 97331-4503 Agricultural
The Climate of Haskell County
 The Climate of Haskell County Haskell County is part of the Hardwood Forest. The Hardwood Forest is characterized by its irregular landscape and the largest lake in Oklahoma, Lake Eufaula. Average annual
Project No India Basin Shadow Study San Francisco, California, USA
 Project No. 432301 India Basin Shadow Study San Francisco, California, USA Numerical Modelling Studies 04 th June 2018 For Build Inc. Report Title: India Basin Shadow Study San Francisco, California, USA
Champaign-Urbana 2000 Annual Weather Summary
 Champaign-Urbana 2000 Annual Weather Summary ILLINOIS STATE WATER SURVEY 2204 Griffith Dr. Champaign, IL 61820 wxobsrvr@sws.uiuc.edu Maria Peters, Weather Observer January: January started on a mild note,
The Climate of Pontotoc County
 The Climate of Pontotoc County Pontotoc County is part of the Crosstimbers. This region is a transition region from the Central Great Plains to the more irregular terrain of southeast Oklahoma. Average
The Climate of Kiowa County
 The Climate of Kiowa County Kiowa County is part of the Central Great Plains, encompassing some of the best agricultural land in Oklahoma. Average annual precipitation ranges from about 24 inches in northwestern
WIND DATA REPORT FOR THE YAKUTAT JULY 2004 APRIL 2005
 WIND DATA REPORT FOR THE YAKUTAT JULY 2004 APRIL 2005 Prepared on July 12, 2005 For Bob Lynette 212 Jamestown Beach Lane Sequim WA 98382 By John Wade Wind Consultant LLC 2575 NE 32 nd Ave Portland OR 97212
Third Grade Math and Science DBQ Weather and Climate/Representing and Interpreting Charts and Data - Teacher s Guide
 Third Grade Math and Science DBQ Weather and Climate/Representing and Interpreting Charts and Data - Teacher s Guide A document based question (DBQ) is an authentic assessment where students interact with
R.L. Kellogg, Ph.D. North American Sundial Society June 2013
 R.L. Kellogg, Ph.D. North American Sundial Society June 2013 1 Analemmatic Sundials The Human Sundial The Analemmatic Sundial or Human Sundial was first described by M. de Vaulezard in 1640 in a Treatise
CAVE CLIMATE COMPARISON ACTIVITY BETWEEN THE SURFACE AND THE CAVERN
 CAVE CLIMATE COMPARISON ACTIVITY BETWEEN THE SURFACE AND THE CAVERN Created by Ray Bowers For the Virtual Center for the Environment (VCE) A part of the Institute of Natural Resources Analysis and Management
What is happening to the Jamaican climate?
 What is happening to the Jamaican climate? Climate Change and Jamaica: Why worry? Climate Studies Group, Mona (CSGM) Department of Physics University of the West Indies, Mona Part 1 RAIN A FALL, BUT DUTTY
TILT, DAYLIGHT AND SEASONS WORKSHEET
 TILT, DAYLIGHT AND SEASONS WORKSHEET Activity Description: Students will use a data table to make a graph for the length of day and average high temperature in Utah. They will then answer questions based
LAB J - WORLD CLIMATE ZONES
 Introduction LAB J - WORLD CLIMATE ZONES The objective of this lab is to familiarize the student with the various climates around the world and the climate controls that influence these climates. Students
Variability of Reference Evapotranspiration Across Nebraska
 Know how. Know now. EC733 Variability of Reference Evapotranspiration Across Nebraska Suat Irmak, Extension Soil and Water Resources and Irrigation Specialist Kari E. Skaggs, Research Associate, Biological
Project 2. Introduction: 10/23/2016. Josh Rodriguez and Becca Behrens
 Project 2 Josh Rodriguez and Becca Behrens Introduction: Section I of the site Dry, hot Arizona climate Linen supply and cleaning facility Occupied 4am-10pm with two shifts of employees PHOENIX, ARIZONA
Tracking the Climate Of Northern Colorado Nolan Doesken State Climatologist Colorado Climate Center Colorado State University
 Tracking the Climate Of Northern Colorado Nolan Doesken State Climatologist Colorado Climate Center Colorado State University Northern Colorado Business Innovations November 20, 2013 Loveland, Colorado
Jackson County 2013 Weather Data
 Jackson County 2013 Weather Data 61 Years of Weather Data Recorded at the UF/IFAS Marianna North Florida Research and Education Center Doug Mayo Jackson County Extension Director 1952-2008 Rainfall Data
2003 Water Year Wrap-Up and Look Ahead
 2003 Water Year Wrap-Up and Look Ahead Nolan Doesken Colorado Climate Center Prepared by Odie Bliss http://ccc.atmos.colostate.edu Colorado Average Annual Precipitation Map South Platte Average Precipitation
225 Bush Street Suite 1700 San Francisco, CA phone fax
 225 Bush Street Suite 1700 San Francisco, CA 94104 415.896.5900 phone 415.896.0332 fax www.esassoc.com memorandum date July 29, 2009 to from subject Craig Nikitas, San Francisco Planning Department Daniel
Investigating Factors that Influence Climate
 Investigating Factors that Influence Climate Description In this lesson* students investigate the climate of a particular latitude and longitude in North America by collecting real data from My NASA Data
What is the difference between Weather and Climate?
 What is the difference between Weather and Climate? Objective Many people are confused about the difference between weather and climate. This makes understanding the difference between weather forecasts
Sierra Weather and Climate Update
 Sierra Weather and Climate Update 2014-15 Kelly Redmond Western Regional Climate Center Desert Research Institute Reno Nevada Yosemite Hydroclimate Workshop Yosemite Valley, 2015 October 8-9 Percent of
HAIDA GWAII CLIMATE ASSESSMENT 2010 Special Report for MIEDS Franc Pridoehl
 HAIDA GWAII CLIMATE ASSESSMENT 2010 Special Report for MIEDS Franc Pridoehl INTRODUCTION Climatic conditions have varied considerably on Haida Gwaii over the past centuries and millennia (Hebda 2007).
WIND DATA REPORT. Vinalhaven
 WIND DATA REPORT Vinalhaven July 1, 2004 September 30, 2004 Prepared for Fox Islands Electric Cooperative By Melissa L. Ray Anthony L. Rogers April 4, 2005 Renewable Energy Research Laboratory 160 Governors
Jackson County 2018 Weather Data 67 Years of Weather Data Recorded at the UF/IFAS Marianna North Florida Research and Education Center
 Jackson County 2018 Weather Data 67 Years of Weather Data Recorded at the UF/IFAS Marianna North Florida Research and Education Center Doug Mayo Jackson County Extension Director 1952-2008 Rainfall Data
Yucca Mountain climate: Past, present, and future
 Publications (YM) Yucca Mountain 2007 Yucca Mountain climate: Past, present, and future Saxon E. Sharpe Desert Research Institute, saxon.sharpe@dri.edu Follow this and additional works at: https://digitalscholarship.unlv.edu/yucca_mtn_pubs
Over the course of this unit, you have learned about different
 70 People and Weather TA L K I N G I T O V E R Over the course of this unit, you have learned about different aspects of earth s weather and atmosphere. Atmospheric scientists, climatologists, hydrologists,
WIND DATA REPORT. Vinalhaven
 WIND DATA REPORT Vinalhaven April 1, 2004 June 30, 2004 Prepared for Fox Islands Electric Cooperative By Melissa L. Ray Anthony L. Rogers April 4, 2005 Renewable Energy Research Laboratory 160 Governors
ZUMWALT WEATHER AND CLIMATE ANNUAL REPORT ( )
") ZUMWALT WEATHER AND CLIMATE ANNUAL REPORT (26-29) FINAL DRAFT (9 AUGUST 21) J.D. HANSEN 1, R.V. TAYLOR 2, AND V.S. JANSEN 3 INTRODUCTION The Zumwalt Prairie in northeastern Oregon is a unique grassland
ZUMWALT WEATHER AND CLIMATE ANNUAL REPORT (26-29) FINAL DRAFT (9 AUGUST 21) J.D. HANSEN 1, R.V. TAYLOR 2, AND V.S. JANSEN 3 INTRODUCTION The Zumwalt Prairie in northeastern Oregon is a unique grassland
Investigations on effect of the orientation on thermal comfort in terraced housing in Malaysia
 Investigations on effect of the orientation on thermal comfort in terraced housing in Malaysia Dr Mohamed Ali Abdul Hussain Al-Obaidi 1 and Prof. Peter Woods 2 1 Senior lecturer, Center for Equatorial
Table of Contents. Page
 Eighteen Years (1990 2007) of Climatological Data on NMSU s Corona Range and Livestock Research Center Research Report 761 L. Allen Torell, Kirk C. McDaniel, Shad Cox, Suman Majumdar 1 Agricultural Experiment
Climatography of the United States No
 Climate Division: CA 5 NWS Call Sign: Elevation: 6 Feet Lat: 37 Month (1) Min (2) Month(1) Extremes Lowest (2) Temperature ( F) Lowest Month(1) Degree s (1) Base Temp 65 Heating Cooling 1 Number of s (3)
Climatography of the United States No
 Climate Division: CA 4 NWS Call Sign: Elevation: 2 Feet Lat: 37 Month (1) Min (2) Month(1) Extremes Lowest (2) Temperature ( F) Lowest Month(1) Degree s (1) Base Temp 65 Heating Cooling 1 Number of s (3)
Climatography of the United States No
 Climate Division: CA 4 NWS Call Sign: Elevation: 13 Feet Lat: 36 Month (1) Min (2) Month(1) Extremes Lowest (2) Temperature ( F) Lowest Month(1) Degree s (1) Base Temp 65 Heating Cooling 1 Number of s
Climatography of the United States No
 Climate Division: CA 5 NWS Call Sign: Elevation: 1,14 Feet Lat: 36 Month (1) Min (2) Month(1) Extremes Lowest (2) Temperature ( F) Lowest Month(1) Degree s (1) Base Temp 65 Heating Cooling 1 Number of
announcements 4/17/08
 Heat Transfer and the Building Envelope ARCH 331/431 Spring 2008 Lecture 6 announcements 4/17/08 A3: Envelope Heat Transfer Assignment: Available later today (course website) References: Available by this
Drought in Southeast Colorado
 Drought in Southeast Colorado Nolan Doesken and Roger Pielke, Sr. Colorado Climate Center Prepared by Tara Green and Odie Bliss http://climate.atmos.colostate.edu 1 Historical Perspective on Drought Tourism
Climatography of the United States No
 Climate Division: AK 5 NWS Call Sign: ANC Month (1) Min (2) Month(1) Extremes Lowest (2) Temperature ( F) Lowest Month(1) Degree s (1) Base Temp 65 Heating Cooling 90 Number of s (3) Jan 22.2 9.3 15.8
Climatography of the United States No
 Climate Division: CA 6 NWS Call Sign: LAX Elevation: 1 Feet Lat: 33 Month (1) Min (2) Month(1) Extremes Lowest (2) Temperature ( F) Lowest Month(1) Degree s (1) Base Temp 65 Heating Cooling 1 Number of
Climatography of the United States No
 Climate Division: CA 6 NWS Call Sign: TOA Elevation: 11 Feet Lat: 33 2W Temperature ( F) Month (1) Min (2) Month(1) Extremes Lowest (2) Lowest Month(1) Degree s (1) Base Temp 65 Heating Cooling 1 Number
Wind Resource Data Summary Cotal Area, Guam Data Summary and Transmittal for December 2011
 Wind Resource Data Summary Cotal Area, Guam Data Summary and Transmittal for December 2011 Prepared for: GHD Inc. 194 Hernan Cortez Avenue 2nd Floor, Ste. 203 Hagatna, Guam 96910 January 2012 DNV Renewables
2. PHYSICAL SETTING FINAL GROUNDWATER MANAGEMENT PLAN. 2.1 Topography. 2.2 Climate
 FINAL GROUNDWATER MANAGEMENT PLAN 2. PHYSICAL SETTING Lassen County is a topographically diverse area at the confluence of the Cascade Range, Modoc Plateau, Sierra Nevada and Basin and Range geologic provinces.
Lesson Adaptation Activity: Analyzing and Interpreting Data
 Lesson Adaptation Activity: Analyzing and Interpreting Data Related MA STE Framework Standard: 3-ESS2-1. Use graphs and tables of local weather data to describe and predict typical weather during a particular
LOCAL CLIMATOLOGICAL DATA Monthly Summary July 2013
 Deg. Days Precip Ty Precip Wind Solar Hu- Adj. to Sea Level mid- ity Avg Res Res Peak Minute 1 fog 2 hvy fog 3 thunder 4 ice plt 5 hail 6 glaze 7 duststm 8 smk, hz 9 blw snw 1 2 3 4A 4B 5 6 7 8 9 12 14
WYANDOTTE MUNICIPAL SERVICES COMMUNITY WIND ENERGY PROJECT WIND RESOUCE SUMMARY
 WYANDOTTE MUNICIPAL SERVICES COMMUNITY WIND ENERGY PROJECT WIND RESOUCE SUMMARY MONTHLY REPORT October 15, 2007 Black & Veatch Project: 144374 Prepared by: Black & Veatch Corporation 6300 S. Syracuse Way
Climatography of the United States No
 Month (1) Min (2) Month(1) Extremes Lowest (2) Temperature ( F) Lowest Month(1) Degree s (1) Base Temp 65 Heating Cooling 100 Number of s (3) Jan 63.9 39.3 51.6 86 1976 16 56.6 1986 20 1976 2 47.5 1973
Climatography of the United States No
 Temperature ( F) Month (1) Min (2) Month(1) Extremes Lowest (2) Lowest Month(1) Degree s (1) Base Temp 65 Heating Cooling 100 Number of s (3) Jan 32.8 21.7 27.3 62 1918 1 35.8 1983-24 1950 29 10.5 1979
Institut national des sciences appliquées de Strasbourg GENIE CLIMATIQUE ET ENERGETIQUE APPENDICES
 Institut national des sciences appliquées de Strasbourg GENIE CLIMATIQUE ET ENERGETIQUE APPENDICES DEVELOPMENT OF A TOOL, BASED ON THE THERMAL DYNAMIC SIMULATION SOFTWARE TRNSYS, WHICH RUNS PARAMETRIC
In this activity, students will compare weather data from to determine if there is a warming trend in their community.
 Overview: In this activity, students will compare weather data from 1910-2000 to determine if there is a warming trend in their community. Objectives: The student will: use the Internet to locate scientific
Memo. I. Executive Summary. II. ALERT Data Source. III. General System-Wide Reporting Summary. Date: January 26, 2009 To: From: Subject:
 Memo Date: January 26, 2009 To: From: Subject: Kevin Stewart Markus Ritsch 2010 Annual Legacy ALERT Data Analysis Summary Report I. Executive Summary The Urban Drainage and Flood Control District (District)
8.1 Attachment 1: Ambient Weather Conditions at Jervoise Bay, Cockburn Sound
 8.1 Attachment 1: Ambient Weather Conditions at Jervoise Bay, Cockburn Sound Cockburn Sound is 20km south of the Perth-Fremantle area and has two features that are unique along Perth s metropolitan coast
Agricultural Science Climatology Semester 2, Anne Green / Richard Thompson
 Agricultural Science Climatology Semester 2, 2006 Anne Green / Richard Thompson http://www.physics.usyd.edu.au/ag/agschome.htm Course Coordinator: Mike Wheatland Course Goals Evaluate & interpret information,
CAMARGO RANCH, llc. CRAIG BUFORD BufordResources.com
 CAMARGO RANCH, llc 2897 +/- acre Wheat & Cattle Farm Mangum, greer county, oklahoma CRAIG BUFORD 405-833-9499 BufordResources.com 4101 Perimeter Center Dr., Suite 107 Oklahoma City, OK 73112 405.833.9499
Jackson County 2014 Weather Data
 Jackson County 2014 Weather Data 62 Years of Weather Data Recorded at the UF/IFAS Marianna North Florida Research and Education Center Doug Mayo Jackson County Extension Director 1952-2008 Rainfall Data
Constructing a typical meteorological year -TMY for Voinesti fruit trees region and the effects of global warming on the orchard ecosystem
 Constructing a typical meteorological year -TMY for Voinesti fruit trees region and the effects of global warming on the orchard ecosystem ARMEANU ILEANA*, STĂNICĂ FLORIN**, PETREHUS VIOREL*** *University
Climatography of the United States No
 Climate Division: CA 4 NWS Call Sign: Month (1) Min (2) Month(1) Extremes Lowest (2) Temperature ( F) Lowest Month(1) Degree s (1) Base Temp 65 Heating Cooling 100 Number of s (3) Jan 55.6 39.3 47.5 77
Climatography of the United States No
 Climate Division: CA 5 NWS Call Sign: Month (1) Min (2) Month(1) Extremes Lowest (2) Temperature ( F) Lowest Month(1) Degree s (1) Base Temp 65 Heating Cooling 100 Number of s (3) Jan 56.6 36.5 46.6 81
Climatography of the United States No
 Climate Division: CA 1 NWS Call Sign: Month (1) Min (2) Month(1) Extremes Lowest (2) Temperature ( F) Lowest Month(1) Degree s (1) Base Temp 65 Heating Cooling 100 Number of s (3) Jan 57.9 38.9 48.4 85
Climatography of the United States No
 Climate Division: CA 5 NWS Call Sign: Month (1) Min (2) Month(1) Extremes Lowest (2) Temperature ( F) Lowest Month(1) Degree s (1) Base Temp 65 Heating Cooling 100 Number of s (3) Jan 44.8 25.4 35.1 72
Climatography of the United States No
 Climate Division: CA 4 NWS Call Sign: Month (1) Min (2) Month(1) Extremes Lowest (2) Temperature ( F) Lowest Month(1) Degree s (1) Base Temp 65 Heating Cooling 100 Number of s (3) Jan 49.4 37.5 43.5 73
Experimental measurements and analysis of the indoor conditions in Italian museum storerooms: a study case
 Experimental measurements and analysis of the indoor conditions in Italian museum storerooms: a study case F. Cappelletti, P. Romagnoni and A. Birra University Iuav of Venezia, Italy Aims and methods Analysis
Climatography of the United States No
 Climate Division: CA 6 NWS Call Sign: Month (1) Min (2) Month(1) Extremes Lowest (2) Temperature ( F) Lowest Month(1) Degree s (1) Base Temp 65 Heating Cooling 100 Number of s (3) Jan 69.4 46.6 58.0 92
Climatography of the United States No
 Climate Division: CA 4 NWS Call Sign: Month (1) Min (2) Month(1) Extremes Lowest (2) Temperature ( F) Lowest Month(1) Degree s (1) Base Temp 65 Heating Cooling 1 Number of s (3) Jan 58.5 38.8 48.7 79 1962
Climatography of the United States No
 Climate Division: CA 6 NWS Call Sign: Month (1) Min (2) Month(1) Extremes Lowest (2) Temperature ( F) Lowest Month(1) Degree s (1) Base Temp 65 Heating Cooling 1 Number of s (3) Jan 67.5 42. 54.8 92 1971
Climatography of the United States No
 Climate Division: CA 1 NWS Call Sign: Month (1) Min (2) Month(1) Extremes Lowest (2) Temperature ( F) Lowest Month(1) Degree s (1) Base Temp 65 Heating Cooling 1 Number of s (3) Jan 57.8 39.5 48.7 85 1962
GAMINGRE 8/1/ of 7
 FYE 09/30/92 JULY 92 0.00 254,550.00 0.00 0 0 0 0 0 0 0 0 0 254,550.00 0.00 0.00 0.00 0.00 254,550.00 AUG 10,616,710.31 5,299.95 845,656.83 84,565.68 61,084.86 23,480.82 339,734.73 135,893.89 67,946.95
Climatography of the United States No
 No. 2 1971-2 Asheville, North Carolina 2881 COOP ID: 46175 Climate Division: CA 6 NWS Call Sign: 3L3 Elevation: 1 Feet Lat: 33 Month (1) Min (2) Month(1) Extremes Lowest (2) Temperature ( F) Lowest Month(1)
Climatography of the United States No
 No. 2 1971-2 Asheville, North Carolina 2881 COOP ID: 42713 Climate Division: CA 7 NWS Call Sign: Elevation: -3 Feet Lat: 32 Month (1) Min (2) Month(1) Extremes Lowest (2) Temperature ( F) Lowest Month(1)
Climatography of the United States No
 Climate Division: ND 8 NWS Call Sign: BIS Month (1) Min (2) Month(1) Extremes Lowest (2) Temperature ( F) Lowest Month(1) Degree s (1) Base Temp 65 Heating Cooling 100 Number of s (3) Jan 21.1 -.6 10.2
Highlights of the 2006 Water Year in Colorado
 Highlights of the 2006 Water Year in Colorado Nolan Doesken, State Climatologist Atmospheric Science Department Colorado State University http://ccc.atmos.colostate.edu Presented to 61 st Annual Meeting
Climatography of the United States No
 Climate Division: TN 1 NWS Call Sign: Month (1) Min (2) Month(1) Extremes Lowest (2) Temperature ( F) Lowest Month(1) Degree s (1) Base Temp 65 Heating Cooling 100 Number of s (3) Jan 47.6 24.9 36.3 81
Funding provided by NOAA Sectoral Applications Research Project CLIMATE. Basic Climatology Colorado Climate Center
 Funding provided by NOAA Sectoral Applications Research Project CLIMATE Basic Climatology Colorado Climate Center Remember These? Factor 1: Our Energy Source Factor 2: Revolution & Tilt Factor 3: Rotation!
LOCAL CLIMATOLOGICAL DATA Monthly Summary September 2016
 Deg. Days Precip Ty Precip Wind Solar Hu- Adj. to Sea Level mid- ity Avg Res Res Peak 2 Minute 1 fog 2 hvy fog 3 thunder 4 ice plt 5 hail 6 glaze 7 duststm 8 smk, hz 9 blw snw 1 2 3 4A 4B 5 6 7 8 9 11
Climatography of the United States No
 Climate Division: CA 5 NWS Call Sign: FAT Month (1) Min (2) Month(1) Extremes Lowest (2) Temperature ( F) Lowest Month(1) Degree s (1) Base Temp 65 Heating Cooling 1 Number of s (3) Jan 53.6 38.4 46. 78
Climatography of the United States No
 Climate Division: CA 6 NWS Call Sign: 1L2 N Lon: 118 3W Month (1) Min (2) Month(1) Extremes Lowest (2) Temperature ( F) Lowest Month(1) Degree s (1) Base Temp 65 Heating Cooling 1 Number of s (3) Jan 63.7
P7: Limiting Factors in Ecosystems
 P7: Limiting Factors in Ecosystems Purpose To understand that physical factors temperature and precipitation limit the growth of vegetative ecosystems Overview Students correlate graphs of vegetation vigor
Climatography of the United States No
 Climate Division: CA 5 NWS Call Sign: BFL Month (1) Min (2) Month(1) Extremes Lowest (2) Temperature ( F) Lowest Month(1) Degree s (1) Base Temp 65 Heating Cooling 1 Number of s (3) Jan 56.3 39.3 47.8
Science Standard 1: Students analyze monthly precipitation and temperature records, displayed in bar charts, collected in metric units (mm).
.") Title: Precipitation Patterns across the Globe NSF GK-12 Fellow: Terry Legg Type of Lesson: STEM Grade Level(s): 4 th - 7 th grade This activity can be tailored to older, more advanced students by having
Title: Precipitation Patterns across the Globe NSF GK-12 Fellow: Terry Legg Type of Lesson: STEM Grade Level(s): 4 th - 7 th grade This activity can be tailored to older, more advanced students by having
IV. ENVIRONMENTAL IMPACT ANALYSIS B. AESTHETICS SHADE/SHADOW
 IV. ENVIRONMENTAL IMPACT ANALYSIS B. AESTHETICS SHADE/SHADOW 1. INTRODUCTION Potential effects of the Proposed Project related to visual character, views and light/glare are addressed in Section IV.A,
Third Grade Math and Science DBQ Weather and Climate/Representing and Interpreting Charts and Data
 Third Grade Math and Science DBQ Weather and Climate/Representing and Interpreting Charts and Data A document based question (DBQ) is an authentic assessment where students interact with content related
Global Climates. Name Date
 Global Climates Name Date No investigation of the atmosphere is complete without examining the global distribution of the major atmospheric elements and the impact that humans have on weather and climate.
SYSTEM BRIEF DAILY SUMMARY
 SYSTEM BRIEF DAILY SUMMARY * ANNUAL MaxTemp NEL (MWH) Hr Ending Hr Ending LOAD (PEAK HOURS 7:00 AM TO 10:00 PM MON-SAT) ENERGY (MWH) INCREMENTAL COST DAY DATE Civic TOTAL MAXIMUM @Max MINIMUM @Min FACTOR
Minnesota s Climatic Conditions, Outlook, and Impacts on Agriculture. Today. 1. The weather and climate of 2017 to date
 Minnesota s Climatic Conditions, Outlook, and Impacts on Agriculture Kenny Blumenfeld, State Climatology Office Crop Insurance Conference, Sep 13, 2017 Today 1. The weather and climate of 2017 to date