Measuring the Ocean from Space, 2
|
|
|
- Gary Benson
- 6 years ago
- Views:
Transcription

1 Measuring the Ocean from Space, 2 Opportunities and limitations of sampling from satellites Ian Robinson Professor of Oceanography from Space, University of Southampton. Head of the SOC Laboratory for Satellite Oceanography. Southampton Oceanography Centre
2 Purpose of these Lectures The Aim: To learn enough about the basic methods of Space Oceanography to be able critically to appraise global ocean datasets from satellites and understand how to use them effectively. Objective of Lecture 1 (yesterday): To understand what sensors in Space actually measure, and how to derive useful ocean parameters from the primary measurements. Objective of Lecture 2 (today): To recognise the measurement and sampling limitations of satellite sensors, and learn how best to exploit the benefits of satellite data. 2
3 Outline of lecture The sampling limitations of satellite-derived data Measuring SST from satellites Infra-red methods Which Sea surface temperature are we seeing from Space? GHRSST: a case study on preparing SST data for assimilation into models 3
4 The sampling limitations of satellite-derived data 4

5 Satellite orbit limitations Period of orbit, T =2π 3 a GM where GM = m 3 s s-1 Angular speed about the earth, d dt θ = 2 GMr r Linear speed of satellite, V GM = = R g = a r R g R+ h where g = 9.81 ms -2, R = 6378km (Earth s mean radius) Speed of the satellite sub-point over the ground, 2 R g Vg = R+ h R+ h 5
6 Two types of orbit for remote sensing Geostationary orbits For an orbital period of one sidereal day (T = hours), the satellite travels with the earth. This requires r = km, h = km. The satellite remains over the equator. Near-polar orbits T is approximately 100 min. h is 700 to 1000 km. 6

7 What a geostationary orbit sees * * * * * Useful view Horizon from satellite 7

8 Earth coverage by a polar orbiter Ascending track between 1 and 2 One day s descending tracks First track of the next day 8
9 Sun-synchronous orbits A special class of polar orbit The orbit plane precesses in phase with the sun This requires dw/dt = deg/day. Orbital mechanics requires i > 90 deg Thus the satellite passes overhead at a given latitude at the same local (solar) time each day throughout the year. 9


10 Revisit interval impact on spatial resolution ~10-day orbit repeat Inclination 65 Spacing at equator ~315 km 3-day orbit repeat Inclination 72 Spacing at equator ~800 km 10


11 Revisit interval dependence on swath Narrow Swath Same orbit Wide Swath Swath just wide enough to fill the track spacing over a full cycle. Revisit interval is the same as the orbit repeat cycle. Swath wide enough to fill the space between adjacent orbits. Revisit interval is 24 hours.** Intermediate swaths have intermediate revisit intervals, depending on orbit cycle 11
12 Measuring sea surface temperature from satellites Infra-red red radiometry 12
13 Thermal emission from the sea surface M λ Black body radiation, (measured in Wm -2 m -1 ), at wavelength,, is emitted by an ideal surface according to the Plank equation:- 9 8 Thermal emission spectra at C1 Mλ = 7 high (up to solar) temperatures 5 C2 6 λ exp 1 λt 5 where λ is the wavelength in m. C 1 is a constant = Wm 2 C 2 is a constant = 1, m deg K T = temperature of the surface in K Log (M 4 λ ) Wavelength (microns) λ 6000 K 4000 K 2000 K 1000 K 500 K Black-body radiation at typical sea surface temperatures The real surface emits less than the black-body radiation, by a factor called the emissivity ε 13
14 Atmospheric interactions with I-R I R radiation Attenuated signal Reflected solar radiation Absorbed by the atmosphere Noise Emitted by the atmosphere Signal = emitted radiation ε for sea water is about 0.99 so the water-leaving signal is almost the black body radiation. Thermal emission is approximately Lambertian, but it may be affected by surface foam and films. Reflectance is ( 1 - ) which is very small, so solar reflection is negligible at 11 microns. Thermal emission by the atmosphere is the greatest source of atmospheric noise. ε 14
15 Atmospheric correction of infra-red red data The Problem to be corrected: The Brightness temperature, T b, is generally less than than the true sea surface temperature T s. The difference, dt, is caused by atmospheric absorption of infrared. Atmospheric correction: Estimate T s as accurately as possible Allow for variable absorption (dt not uniform) The approach Measure T b in different ways, for which dt differs even for the same pixel. dt1 T1 b T1 b -T2 b T2 b More absorption dt1 Top of atmosphere Less absorption T1 b -T2 b e.g. Use different wavebands, T1 b,t2 b, (T1 b -T2 b ) gives a measure of the amount of atmospheric absorption at each pixel Therefore dt = function of (T1 b -T2 b ) Waveband 1 Waveband 2 Waveband 1 Waveband 2 Sea surface, T s 15
16 Atmospheric correction algorithms Simple multichannel Assume a linear relation between dt and T1 b -T2 b T s = a T1 b + b (T1 b -T2 b ) + c Non-linear T s = a T1 b + b (T1 b -T2 b ) + c (T1 b -T2 b ) 2 + d or T s = a T1 b + b (T1 b -T2 b ) + c (T1 b -T2 b ) (1 - cos(q) + d) where q is the viewing angle of incidence Multi-channel Use more than two wavebands Or use second viewing angle Coefficients The values of a, b, c, d, are determined empirically Either to match in situ temperature measurements (drifting buoys) or to match model-simulated data 16
17 Infra-red red sensors: AVHRR Advanced Very-High Resolution Radiometer Since 1982 the AVHRR/2 has been deployed on NOAA-7, -9,-etc Specification Channel AVHRR/2 wavebands (microns) Description Application Nadir pixel 1.1 km 1.1 km Visible water turbidity Near infra-red coastline, clouds Thermal I-R (night only) SST Thermal I-R SST Thermal I-R SST Sensitivity of thermal channels (NE T) Number of digitisation levels Ground field of view, Square Pixels Swath width 0.12 K at 300K 1024 (10-bit) 1.1 km at nadir 2580 km Swath 2580 km 860 km 17
18 Multi-look look atmospheric correction methods Satellite track Forward view has twice the atmospheric path length of the nadir view Nadir view has the shortest path through the atmosphere Atmosphere Ocean surface Different views of the same patch of sea (separated in time by ~3.5 min.) through different thicknesses of atmosphere will differ by an amount which depends upon the total effect of the atmosphere on the radiance reaching the satellite. Improved atmospheric correction algorithms use two views (multi-angle) as well as multi-spectral information 18

19 The along-track scanning radiometer Flown on ERS-1 and 2 and Envisat. 19
20 Conical viewing geometry I-R R sensors: ATSR (Along-Track Scanning Radiometer) Views the ground twice (at nadir and 60 deg. forward) 1 km pixels at nadir (curved scan lines) Swath width only 500 km Improved accuracy Cooled detector for higher sensitivity (0.1 degc) On-board calibration: two temperature-controlled black body reference targets. Data digitisation into 12 - bit integers Improved atmospheric correction Wavebands at 3.7, 10.5 and 11.5 microns like AVHRR Dual view gives extra atmospheric information (4- and 6-channel algorithms Uses semi-physical T skin algorithms independent of buoy calibration Monitors global sea-surface temperature Accuracy better than 0.3 deg C 20
21 Cloud - the implacable enemy of infra-red red remote sensing There is no IR way of measuring SST below cloud First priority: detect cloud a variety of methods Consequences of poor cloud detection Biases the SST low in climatic averages False hits of cloud can hide frontal and other dynamical structures Coping with cloud Fill the gaps : optimal interpolation or modelling invents data! Assimilate and put up with gaps Additional observations microwave radiometry geostationary I-R sensors can see whenever the cloud breaks Generate composites from several overpasses 21


22 22 Monthly mean Satellite SST: : Annual Mean C Monthly mean SST data from the NASA Pathfinder analysis for The spatial resolution is 9 km.
23 Generating SST anomaly maps 23 Jan Year 1 month A yr2, A yr3, A Average over N years for month A Dec Year n month B month A yr n+1, A Average over N years for month B Jan Dec Year N Jan Dec month B month A Year N, month B Subtract the N-year average for the appropriate month from each monthly image to obtain the SST Anomaly image for that month.

24 SST Anomaly map from AVHRR Degrees C relative to climatological mean Data processed by Al Strong and provided by the Products System Branch of NOAA/NESDIS


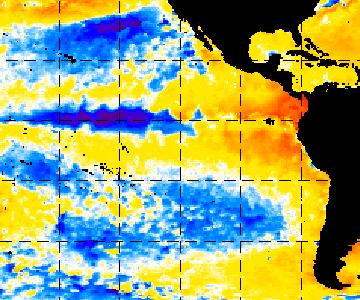


25 25 Evidence of El Niño o in SST Anomalies Degrees C relative to climatological mean
26 Which sea surface temperature do we see from Space? 26
 Solar short wave radiation Surface heat is lost to the atmosphere directly and by radiation. Solar short-wave heating penetrates below the surface.")
27 The skin - bulk temperature difference Net heat transfer Q N = Q IR -Q G Infra-red emission downward (sky & solar ) I-R radiation +Q L sensible heat transfer +Q H Latent heat flux (evaporation - condensation) Solar short wave radiation Surface heat is lost to the atmosphere directly and by radiation. Solar short-wave heating penetrates below the surface. Thus heat flows upwards to the surface to feed the heat flux Q N A thermal gradient is required to drive heat across the molecular conduction layer Wind stress W* Molecular heat conduction Restricted heat transfer Laminar flow layer turbulence reducing towards the surface < 100 microns ~1-2 mm Skin temperature deviation δ T Turbulent heat transfer Fully turbulent layer T skin T sub-skin 27
28 Direct measurements of δt T = T Skin - T bulk Measured by Donlon et al (1999), over the Atlantic Meridional Transect Geophys. Res. Let., 26, pp T, K Day data Wind speed at 10m, m/s ROSSA, AMT-3, Sep-Oct 1996 ROSSA, AMT-7, Sep-Oct 1998 CHAOS, May-June T, -0.2 K -0.4 Night data Wind speed at 10m, m/s 28
29 The diurnal thermocline 0 Night, or windy day Typical temperature, degc Sunny day, light wind Typical temperature, degc Calm, sunny day Typical temperature, degc Depth m 2 Depth m 2 Depth m 2 Weak insolation and strong wind mixing. or Zero insolation and buoyancy instability. Uniform temperature. Strong insolation. Weak to moderate wind mixing. Weak temperature gradient. Strong insolation. Zero to weak wind mixing. Strong temperature gradient 29

30 Diurnal warming features in North Sea A and B are examples of diurnal warming 30

31 Six Year Pathfinder Climatology of T 14:00-02:00 02:00 (18km) Monthly mean T Days p/m when T > 0.5 o C Alice Stuart-Menteth et al., JGR (2003) 31
32 Importance of the diurnal thermocline for remote sensing of SST Develops during the day Surface temperature 0.5 to 1 K warmer in the early afternoon than the previous or subsequent night. Max amplitude 5 K Varies with meteorological conditions Strongest in summer (longer and more direct solar heating). Strongest in calm conditions. Spatially variable within an image Patchiness on daytime images - the so-called afternoon effect. Masks underlying meso-scale mixed-layer temperature patterns. Introduces a warm bias to SST records Eliminate by using only night-time images, Or ignore daytime images under particular conditions, Or predict and correct for the effect (difficult to do confidently). 32
33 Skin, bulk or both? What do users require? T bulk for thermal capacity, deep convection etc. and for existing flux parameterisation. T S for air-sea interaction processes, better for fluxes eventually? Is T diurnal useful in itself? In situ measurements T bulk is conventionally observed. But at what depth? May be compromised by T diurnal Strictly we should record T z and z. Shipborne radiometry with sky correction can now measure T skin Satellite observations All satellites see only T S. T S is precisely defined at the surface. Must allow for ε and sky reflection. N.B. m/w penetrates slightly deeper. T S atmospheric algorithms are fundamentally-based. Independent of in situ calibration. Require in situ T S for validation only. T bulk algorithms have hybrid function. T represented as a globally applied bias correction. Cannot eliminate noise from T. Require in situ calibration. Sensitive to definition of T bulk. A well-developed in situ buoy network. 33
34 Preparing SST for assimilation into ocean models 34
35 35 The GODAE Challenge Develop a global, high-resolution sea surface temperature analysis with proper consideration of the skin effect and sufficient temporal resolution to resolve the diurnal cycle, that is available in real-time for all environmental and climate applications.
36 The Challenge of using SST from Space The importance of sea surface temperature (SST ) as a variable for assimilation into ocean dynamical models Characterises the mesoscale variability of the upper ocean A key property influencing air-sea interaction processes An important property in its own right Fluxes, CO 2 solubility, upwelling, climate change indicator, etc. Measured from Space from a variety of platforms using a variety of techniques Limitations of sampling frequency, cloud cover, spatial resolution How to maximise the benefits of complementary data sources? How best to prepare the data from diverse sources for assimilation 36

37 Platforms for Measuring SST Polar-orbiting infra-red radiometer Polar-orbiting microwave radiometer Geostationary orbit Infra-red radiometer research vessel VOS or SOO VOS = Voluntary observing ship SOO = Ship-of-opportunity drifting or moored buoy 37
38 Measuring SST: Sampling capability 38 Instrument Spatial sampling Time sampling Depth sampling Performance Research vessel In Situ Precise, very sparse Continuous T bulk at all z T Skin <0.1 K 0.1 K Buoy Distributed, sparse 1 hr - 1 day T bulk at z = m (z is uncertain) 0.1 K Voluntary observing ship reports Track-limited, sparse 1 day T bulk at c.w. intake z = 1-7m 0.5 K Ship-of-opportunity, autonomous sensors Track-limited, sparse 1 hr T bulk at z = 1-7m T Skin 0.1 K 0.1 K Satellite Polar orbit infra-red radiometer Polar-orbit micro-wave radiometer Geostationary orbit I-R radiometer Global; 1 km, cloud-limit Global; 50 (20?) km 45S - 45N; 2-6 km, cloud 12 hr T S (z ~ 10 µm) 0.1K K 12 hr - 2 days T S (z < 1mm) 0.5K-1.0 K 30 min T S (z ~ 10 µm) K
39 Flow of information εt S T S S T b +(1-ε)T sky 1mm 10 cm Processes affecting SST Measurement Cloud Processes Detector, transducer, amplifier, digitiser Scattering & absorption by stratospheric dust Absorption by Water vapour, etc. Surface emissivity effects Thermal microlayer Diurnal thermocline Temperature Measure Digital signal, S T.o.a. brightness temperature (radiance), T b Water-leaving radiance Skin temperature, T S Procedures (Problems) Sensor calibration Cloud detection Atmospheric correction Skin-bulk model T bulk? 5 m Bulk temperature, T bulk 39
40 Approaches to SST recovery from space Procedures Sensor calibration S AVHRR/Pathfinder On-board blackbody (A)ATSR Two on-board blackbodies Microwave radiometry Hot-load calibration source Cloud detection T b Multiple tests for cloud detection Multiple tests for cloud detection End-to-end multifrequency empirical algorithm. Atmospheric correction Empirical multispectral model with bias adjustment to match buoy measured T bulk Independent atmos c. correction based on radiation transfer model. Uses dual view Allows for: sea state, atmos. liquid water, viewing geometry and salinity. T S Skin-bulk model T bulk Requires in situ calibration Requires in situ skin validation Requires bulk or skin SST for calibration 40
 0.5º spatial resolution 0.25º spatial sampling 0.")
41 Complementarity of infra-red red and micro- wave radiometry 41 Compare ATSR 1km spatial resolution 0.1 K resolution Cloud dependent with TRIMM Microwave Imager (TMI) 0.5º spatial resolution 0.25º spatial sampling 0.5 K resolution Independent of cloud Data courtesy of G C Quartly, SOC-LSO
42 Meeting the GODAE requirements Accuracy 0.1K (0.2K for climate) Achievable (almost) with specialist polar-orbiting infra-red sensors (AATSR), This requirement exceeds the expectation of standard SST IR sensors on meteorological satellites (polar and geostationary) The new SEVIRI on MSG may approach this requirement Microwave sensors not yet able to meet this Which SST do we mean?? Spatial resolution -10 km (2-5 km in coastal seas) Achievable with polar-orbiting and Geostationary IR sensors Microwave radiometers resolve to 50 km (sampling every 25km) Temporal resolution 6hr able to resolve (avoid aliasing) the diurnal cycle Achievable only with geostationary platforms Cloud is the major drawback for IR sensors Microwaves unaffected by cloud 42
43 The GODAE High-Resolution SST Pilot Project (GHRSST-PP) : Conceptual basis Polar orbiting satellites Microwave sensors (T sub-skin ) AMSR AMSR-E TMI AATSR AVHRR MODIS, GLI etc. Infra-red Sensors (T skin ) In situ measurements T skin from SOO T bulk from Buoys, VOS Dynamic distributed database approach Access diverse level 2 satellite SST products. Access ancillary data (wind, insolation etc.) Apply quality estimates L2P products Merge using OI methods L4 product Use sets of in situ SST for validation. MSG SEVIRI GOES, Meteosat Geostationary satellites Near-real time, less accurate products High accuracy, off-line products Operational users Oceanographic research users Climate monitoring users 43
44 SST definitions within the GHRSST-PP Thermal skin deviation What an IR sensor sees Diurnal thermocline What a MW sensor sees (interface) foundation temperature (Top model layer temp.) 44
45 Outline of GHRSST analysis procedure L2P data consist only of satellite measurements At the native resolution of each sensor s SST product skin SST (from infra-red radiometers) or sub-skin SST (from microwave radiometers) For each L2P value, apply a diurnal warming (and skinsubskin) correction to estimate the corresponding SST fnd L4 data generated by O-I using estimated SST fnd as input This has the variability characteristics of the upper mixed layer Avoids undue influence of ephemeral near-surface thermal events SST fnd has meaning only as a daily updated product Given SST fnd, the skin and sub-skin SST can be estimated for any time of day Apply parametric models for diurnal warming & skin-subskin 45
46 Thermal structure of top 5m (from sub-skin to 5m) Temperature ( o C) This is what SST fnd is intended to represent Note how temperatures at all depths collapse to the same value overnight Arabian Sea WHOI Mooring Data - Spring 1995 (1mm data estimated using Fairall et al. (1996)) 46 (From the work of A. Stuart-Menteth)
47 New Diurnal Warming Parameterisation (Stuart-Menteth et al.) Model Required input cgrad U 0-6h t min U 8-12h, Q 6-12h T 12-tmin U 8-12h, Q 6-12h t max U 12-15h, Q 12-18h T tmax-12 U 12-15h, Q 12-18h T 24-tmin U 16-24h, T max T Model v Obs. 1m (obs.) Sub-skin (obs + Fairall) 1m (par. model) Subskin (p.mod.) 47
48 The GHRSST-PP SST products: L2P Level 2 pre-processed Start with the basic SST level 2 products in sensor coordinates Add a quality flag and error statistics for each pixel Add ancillary data for quality reference (wind, insolation, ice etc) Time dependent error statistics from in situ match-up database Represents skin or sub-skin depending on sources Supplied in near real time for direct assimilation into op. models 48
49 The GHRSST-PP SST products: L4 Level 4 Reduces all the available existing SST to SST foundation and merges them somehow to deliver a best product Use optimal interpolation (O-I) methods to blend data from sources of variable qualities and to fill sampling gaps Use different O-I criteria for different applications Near-real time operational forecasts; or high accuracy climate record The L4 product represents a precisely defined form of bulk SST Includes estimate of the SST skin SSTf oundation difference so skin SST can be retrieved 49

50 Preparing SST data for model assimilation The GHRSST-PP approach Uses all existing stable satellite SST data products Uses available in situ data Generates four types of output: L2P - The input SST data plus quality flags and error analysis L4 Harmonises inputs, then merges by optimal interpolation MDB Match-up database with in situ data DDS Diagnostic data set Satellite SST data Error Analysis MDB In situ SST data Analysis & validation DDS Satellite SST data L2P Process L2P products Merging & interpolation L4 product Satellite SST data Model assimilation Other end users 50
51 Maintaining the quality of SST products Quality flagging of L2P products is the key Depends on things such as proximity to cloud (IR) or proximity to land or rain (MW), and on the probability of diurnal warming Absolute accuracy is based on the match-up database (MDB) with in situ data Different error statistics (bias and standard deviation) are derived from the MDB for different quality flags Thus error statistics can be assigned to new data coming into the system once their quality flag has been determined Inter sensor biases detected using the Diagnostic data set (DDS) The primary challenge is to deliver a SST product whose accuracy is known 51

52 HR-DDS - locations v2.3 Based on output of the 2 nd, 3 rd & 4 th GHRSST-PP Science Team workshop feedback. Fully documented in the HR-DDS Implementation Plan (GHRSST/14) 52
53 A view of the role of the GHRSST -PP PRODUCERS Satellite SST data from individual sensors/ missions produced by Agencies DATA BROKER GHRSST-PP Value adding Critique of data quality Consolidated requirements for future missions USERS Model assimilation of GHRSST-PP merged SST products Widespread usage of forecasts / analysis from operational oceanographic systems INFORMATION Wider application of Application of GHRSST-PP analysed SST analysed SST products by products by individual individual users users

54 GHRSST-PP Implementation Schedule
55 Medspiration An ESA Contract for 1M to serve as the European Regional Data Assembly Centre for GHRSST-PP. A European consortium led by SOC-LSO Ifremer (Fr) Meteo-France CLS (Fr) CNR (I) Met.no (N) Vega (UK) Most operational data processing performed in France SOC will host the Diagnostic Data Set (DDS) Provides a valuable scientific analysis resource tool 55
 100ºW to 45ºE (to include the adjacent seas but excluding any part of Pacific")
56 Medspiration Atlantic coverage 10 km grid L2P, DDS and MDB 70ºS to 90ºN (to the ice limit) 100ºW to 45ºE (to include the adjacent seas but excluding any part of Pacific Ocean) 56

57 Mediterranean coverage Ultra-high resolution (UHR) 2 km grid All products including L4 analysed field 57
58 Current Status Medspiration has started 1 st Jan 2004 Qualification Review Nov 2004 First operational demonstration March 2005 Potential users welcomed into partnership Assimilation into operational models For example Mercator, FOAM, MFS etc. New SST datasets for climate monitoring International developments in GHRSST-PP Japan already has its RDAC operating USA also spinning up a new RDAC activity Time to start interacting with modellers who can benefit from assimilating the new SST products 58
59 Medspiration Products GHRSST-PP L2P data products Over the Atlantic Ocean SST fnd UHR data (L4) for Mediterranean Includes the analysed SST GHRSST diagnostic data set (HR-DDS) granules Over the N Atlantic coverage area GHRSST match up database records (MDR) Over the N Atlantic coverage area 59
60 What do modellers want to assimilate? L2P provides basic SST products from each individual source Skin or subskin depending on sensor type In native format Delivered In near-real time Adjustment needed to match to the model top layer temperature L4 analysed SST product A best merging of all the different sources At least 1 day delay Additional errors from analysis Which is preferred? 60
61 61
Lectures 7 and 8: 14, 16 Oct Sea Surface Temperature
 Lectures 7 and 8: 14, 16 Oct 2008 Sea Surface Temperature References: Martin, S., 2004, An Introduction to Ocean Remote Sensing, Cambridge University Press, 454 pp. Chapter 7. Robinson, I. S., 2004, Measuring
Multi-Sensor Satellite Retrievals of Sea Surface Temperature
 Multi-Sensor Satellite Retrievals of Sea Surface Temperature NOAA Earth System Research Laboratory With contributions from many Outline Motivation/Background Input Products Issues in Merging SST Products
Operational systems for SST products. Prof. Chris Merchant University of Reading UK
 Operational systems for SST products Prof. Chris Merchant University of Reading UK Classic Images from ATSR The Gulf Stream ATSR-2 Image, ƛ = 3.7µm Review the steps to get SST using a physical retrieval
Lectures 7 and 8: 13, 18 Feb Sea Surface Temperature
 Lectures 7 and 8: 13, 18 Feb 2008 Sea Surface Temperature References: Martin, S., 2004, An Introduction to Ocean Remote Sensing, Cambridge University Press, 454 pp. Chapter 7. Robinson, I. S., 2004, Measuring
THREE-WAY ERROR ANALYSIS BETWEEN AATSR, AMSR-E AND IN SITU SEA SURFACE TEMPERATURE OBSERVATIONS.
 THREE-WAY ERROR ANALYSIS BETWEEN AATSR, AMSR-E AND IN SITU SEA SURFACE TEMPERATURE OBSERVATIONS. Anne O Carroll (1), John Eyre (1), and Roger Saunders (1) (1) Met Office, Satellite Applications, Fitzroy
SST in Climate Research
 SST in Climate Research Roger Saunders, Met Office with inputs from Nick Rayner, John Kennedy, Rob Smith, Karsten Fennig, Sarah Millington, Owen Embury. This work is supported by the Joint DECC and Defra
USE OF ENVISAT AATSR WITHIN THE GODAE HIGH RESOLUTION SST PILOT PROJECT (GHRSST-PP).
.") USE OF ENVISAT AATSR WITHIN THE GODAE HIGH RESOLUTION SST PILOT PROJECT (GHRSST-PP). Craig Donlon (1) (1) International GHRSSTPP Project Office, Met Office Hadley Centre, FitzRoy Road, Exeter, (United
USE OF ENVISAT AATSR WITHIN THE GODAE HIGH RESOLUTION SST PILOT PROJECT (GHRSST-PP). Craig Donlon (1) (1) International GHRSSTPP Project Office, Met Office Hadley Centre, FitzRoy Road, Exeter, (United
OSI SAF SST Products and Services
 OSI SAF SST Products and Services Pierre Le Borgne Météo-France/DP/CMS (With G. Legendre, A. Marsouin, S. Péré, S. Philippe, H. Roquet) 2 Outline Satellite IR radiometric measurements From Brightness Temperatures
HOMOGENEOUS VALIDATION SCHEME OF THE OSI SAF SEA SURFACE TEMPERATURE PRODUCTS
 HOMOGENEOUS VALIDATION SCHEME OF THE OSI SAF SEA SURFACE TEMPERATURE PRODUCTS Pierre Le Borgne, Gérard Legendre, Anne Marsouin, Sonia Péré Météo-France/DP/Centre de Météorologie Spatiale BP 50747, 22307
Quality control methods for KOOS operational sea surface temperature products
 Acta Oceanol. Sin., 2016, Vol. 35, No. 2, P. 11 18 DOI: 10.1007/s13131-016-0807-z http://www.hyxb.org.cn E-mail: hyxbe@263.net Quality control methods for KOOS operational sea surface temperature products
Preparation and dissemination of the averaged maps and fields of selected satellite parameters for the Black Sea within the SeaDataNet project
 Journal of Environmental Protection and Ecology 11, No 4, 1568 1578 (2010) Environmental informatics Preparation and dissemination of the averaged maps and fields of selected satellite parameters for the
The Global Monitoring for the Environment
 Medspiration Olivier Arino Head of Project Section, Exploitation Division, Science, Application and New Technologies Department, Directorate of Earth Observation Programme, ESRIN, Frascati, Italy Craig
Satellite Sea Surface Temperature Observations of Ocean Processes. Dr. Craig Donlon.
 Satellite Sea Surface Temperature Observations of Ocean Processes Dr. Craig Donlon Craig.Donlon@esa.int Credits Thanks to the many friends and colleagues who have contributed slides! Ian Robinson David
Improved Fields of Satellite-Derived Ocean Surface Turbulent Fluxes of Energy and Moisture
 Improved Fields of Satellite-Derived Ocean Surface Turbulent Fluxes of Energy and Moisture First year report on NASA grant NNX09AJ49G PI: Mark A. Bourassa Co-Is: Carol Anne Clayson, Shawn Smith, and Gary
OCEAN & SEA ICE SAF CDOP2. OSI-SAF Metop-A IASI Sea Surface Temperature L2P (OSI-208) Validation report. Version 1.4 April 2015
 Validation report. Version 1.4 April 2015") OCEAN & SEA ICE SAF CDOP2 OSI-SAF Metop-A IASI Sea Surface Temperature L2P (OSI-208) Validation report Version 1.4 April 2015 A. O Carroll and A. Marsouin EUMETSAT, Eumetsat-Allee 1, Darmstadt 64295, Germany
OCEAN & SEA ICE SAF CDOP2 OSI-SAF Metop-A IASI Sea Surface Temperature L2P (OSI-208) Validation report Version 1.4 April 2015 A. O Carroll and A. Marsouin EUMETSAT, Eumetsat-Allee 1, Darmstadt 64295, Germany
E-AIMS. SST: synthesis of past use and design activities and plans for E-AIMS D4.432
 Research Project co-funded by the European Commission Research Directorate-General 7 th Framework Programme Project No. 312642 E-AIMS Euro-Argo Improvements for the GMES Marine Service SST: synthesis of
A diurnally corrected highresolution
 A diurnally corrected highresolution SST analysis Andy Harris 1, Jonathan Mittaz 1,4, Gary Wick 3, Prabhat Koner 1, Eileen Maturi 2 1 NOAA-CICS, University of Maryland 2 NOAA/NESDIS/STAR 3 NOAA/OAR/ESRL
Use of Drifting Buoy SST in Remote Sensing. Chris Merchant University of Edinburgh Gary Corlett University of Leicester
 Use of Drifting Buoy SST in Remote Sensing Chris Merchant University of Edinburgh Gary Corlett University of Leicester Three decades of AVHRR SST Empirical regression to buoy SSTs to define retrieval Agreement
Current status of lake modelling and initialisation at ECMWF
 Current status of lake modelling and initialisation at ECMWF G Balsamo, A Manrique Suñen, E Dutra, D. Mironov, P. Miranda, V Stepanenko, P Viterbo, A Nordbo, R Salgado, I Mammarella, A Beljaars, H Hersbach
APPLICATIONS WITH METEOROLOGICAL SATELLITES. W. Paul Menzel. Office of Research and Applications NOAA/NESDIS University of Wisconsin Madison, WI
 APPLICATIONS WITH METEOROLOGICAL SATELLITES by W. Paul Menzel Office of Research and Applications NOAA/NESDIS University of Wisconsin Madison, WI July 2004 Unpublished Work Copyright Pending TABLE OF CONTENTS
School on Modelling Tools and Capacity Building in Climate and Public Health April Remote Sensing
 2453-5 School on Modelling Tools and Capacity Building in Climate and Public Health 15-26 April 2013 Remote Sensing CECCATO Pietro International Research Institute for Climate and Society, IRI The Earth
Synergetic Aspects and Auxiliary Data Concepts for Sea Surface Salinity Measurements from Space
 Synergetic Aspects and Auxiliary Data Concepts for Sea Surface Salinity Measurements from Space AO/1-4505/03/NL/CB An ESA study Kicked-off 1st April 2004 Objectives of the study The present project has
ENVISAT - AATSR CYCLIC REPORT #63
 ENVISAT - AATSR CYCLIC REPORT #63 START END DATE 29 OCT 2007 03 DEC 2007 TIME 21:59:29 21:59:29 ORBIT # 29614 30114 Himalayas, 18 November 2007 Daytime visible image showing snow on the Western Himalayas.
DEFINING OPTIMAL BRIGHTNESS TEMPERATURE SIMULATION ADJUSTMENT PARAMETERS TO IMPROVE METOP-A/AVHRR SST OVER THE MEDITERRANEAN SEA
 DEFINING OPTIMAL BRIGHTNESS TEMPERATURE SIMULATION ADJUSTMENT PARAMETERS TO IMPROVE METOP-A/AVHRR SST OVER THE MEDITERRANEAN SEA Igor Tomažić a, Pierre Le Borgne b, Hervé Roquet b a AGO-GHER, University
Version 7 SST from AMSR-E & WindSAT
 Version 7 SST from AMSR-E & WindSAT Chelle L. Gentemann, Thomas Meissner, Lucrezia Ricciardulli & Frank Wentz www.remss.com Retrieval algorithm Validation results RFI THE 44th International Liege Colloquium
Introduction to the CEOS Virtual Constellation for Sea Surface Temperature (SST-VC) and Group for High Resolution Sea Surface Temperature (GHRSST)
 and Group for High Resolution Sea Surface Temperature (GHRSST)") Introduction to the CEOS Virtual Constellation for Sea Surface Temperature (SST-VC) and Group for High Resolution Sea Surface Temperature (GHRSST) To provide operational users and the science community
Introduction to the CEOS Virtual Constellation for Sea Surface Temperature (SST-VC) and Group for High Resolution Sea Surface Temperature (GHRSST) To provide operational users and the science community
Ice Surface temperatures, status and utility. Jacob Høyer, Gorm Dybkjær, Rasmus Tonboe and Eva Howe Center for Ocean and Ice, DMI
 Ice Surface temperatures, status and utility Jacob Høyer, Gorm Dybkjær, Rasmus Tonboe and Eva Howe Center for Ocean and Ice, DMI Outline Motivation for IST data production IST from satellite Infrared Passive
A HIGH RESOLUTION EUROPEAN CLOUD CLIMATOLOGY FROM 15 YEARS OF NOAA/AVHRR DATA
 A HIGH RESOLUTION EUROPEAN CLOUD CLIMATOLOGY FROM 15 YEARS OF NOAA/AVHRR DATA R. Meerkötter 1, G. Gesell 2, V. Grewe 1, C. König 1, S. Lohmann 1, H. Mannstein 1 Deutsches Zentrum für Luft- und Raumfahrt
C. Jimenez, C. Prigent, F. Aires, S. Ermida. Estellus, Paris, France Observatoire de Paris, France IPMA, Lisbon, Portugal
 All-weather land surface temperature estimates from microwave satellite observations, over several decades and real time: methodology and comparison with infrared estimates C. Jimenez, C. Prigent, F. Aires,
SSS retrieval from space Comparison study using Aquarius and SMOS data
 44 th International Liège Colloquium on Ocean Dynamics 7-11 May 2012 SSS retrieval from space Comparison study using Aquarius and SMOS data Physical Oceanography Department Institute of Marine Sciences
Sea water dielectric constant, temperature and remote sensing of Sea Surface Salinity
 Sea water dielectric constant, temperature and remote sensing of Sea Surface Salinity E. P. Dinnat 1,2, D. M. Le Vine 1, J. Boutin 3, X. Yin 3, 1 Cryospheric Sciences Lab., NASA GSFC, Greenbelt, MD, U.S.A
NEW OSI SAF SST GEOSTATIONARY CHAIN VALIDATION RESULTS
 NEW OSI SAF SST GEOSTATIONARY CHAIN VALIDATION RESULTS Anne Marsouin, Pierre Le Borgne, Gérard Legendre, Sonia Péré Météo-France/DP/Centre de Météorologie Spatiale BP 50747, 22307 Lannion, France Abstract
PP HRSST Pilot Programme for High Resolution Sea Surface Temperature. Review objectives Review progress during year Next steps: workplan
 PP HRSST Pilot Programme for High Resolution Sea Surface Temperature Review objectives Review progress during year Next steps: workplan Collaboration between DBCP and GHRSST Drifter SST vital for satellite
VALIDATION OF THE OSI SAF RADIATIVE FLUXES
 VALIDATION OF THE OSI SAF RADIATIVE FLUXES Pierre Le Borgne, Gérard Legendre, Anne Marsouin Météo-France/DP/Centre de Météorologie Spatiale BP 50747, 22307 Lannion, France Abstract The Ocean and Sea Ice
ATMOS 5140 Lecture 1 Chapter 1
 ATMOS 5140 Lecture 1 Chapter 1 Atmospheric Radiation Relevance for Weather and Climate Solar Radiation Thermal Infrared Radiation Global Heat Engine Components of the Earth s Energy Budget Relevance for
A two-season impact study of the Navy s WindSat surface wind retrievals in the NCEP global data assimilation system
 A two-season impact study of the Navy s WindSat surface wind retrievals in the NCEP global data assimilation system Li Bi James Jung John Le Marshall 16 April 2008 Outline WindSat overview and working
Long-Term Time Series of Water Vapour Total Columns from GOME, SCIAMACHY and GOME-2
 Graphics: ESA Graphics: ESA Graphics: ESA Long-Term Time Series of Water Vapour Total Columns from GOME, SCIAMACHY and GOME-2 S. Noël, S. Mieruch, H. Bovensmann, J. P. Burrows Institute of Environmental
IASI L2Pcore sea surface temperature. By Anne O Carroll, Thomas August, Pierre Le Borgne and Anne Marsouin
 IASI L2Pcore sea surface temperature By Anne O Carroll, Thomas August, Pierre Le Borgne and Anne Marsouin Abstract Anne O Carroll EUMETSAT Eumetsat Allee 1 64295 Darmstadt Germany Tel: +49 6151 807 676
Earth s Heat Budget. What causes the seasons? Seasons
 Earth s Heat Budget Solar energy and the global heat budget Transfer of heat drives weather and climate Ocean circulation A. Rotation of the Earth B. Distance from the Sun C. Variations of Earth s orbit
Comparison of NASA AIRS and MODIS Land Surface Temperature and Infrared Emissivity Measurements from the EOS AQUA platform
 Comparison of NASA AIRS and MODIS Land Surface Temperature and Infrared Emissivity Measurements from the EOS AQUA platform Robert Knuteson, Steve Ackerman, Hank Revercomb, Dave Tobin University of Wisconsin-Madison
Lecture 19: Operational Remote Sensing in Visible, IR, and Microwave Channels
 MET 4994 Remote Sensing: Radar and Satellite Meteorology MET 5994 Remote Sensing in Meteorology Lecture 19: Operational Remote Sensing in Visible, IR, and Microwave Channels Before you use data from any
Evaluation of modeled diurnally varying sea surface temperatures and the influence of surface winds
 Evaluation of modeled diurnally varying sea surface temperatures and the influence of surface winds Rachel R. Weihs and Mark A. Bourassa Center for Ocean-Atmospheric Prediction Studies IOVWST Meeting 6-8
Inter-tropical Convergence Zone (ITCZ) analysis using AIRWAVE retrievals of TCWV from (A)ATSR series and potential extension of AIRWAVE to SLSTR
 analysis using AIRWAVE retrievals of TCWV from (A)ATSR series and potential extension of AIRWAVE to SLSTR") Inter-tropical Convergence Zone (ITCZ) analysis using AIRWAVE retrievals of TCWV from (A)ATSR series and potential extension of AIRWAVE to SLSTR Enzo Papandrea (SERCO, CNR-ISAC, Enzo.Papandrea@serco.com)
Inter-tropical Convergence Zone (ITCZ) analysis using AIRWAVE retrievals of TCWV from (A)ATSR series and potential extension of AIRWAVE to SLSTR Enzo Papandrea (SERCO, CNR-ISAC, Enzo.Papandrea@serco.com)
Saharan Dust Longwave Radiative Forcing using GERB and SEVIRI
 Imperial College London Saharan Dust Longwave Radiative Forcing using GERB and SEVIRI Vincent Gimbert 1, H.E. Brindley 1, Nicolas Clerbaux 2, J.E. Harries 1 1. Blackett Laboratory, Imperial College, London
Generating a Climate data record for SST from Passive Microwave observations
 ESA Climate Change Initiative Phase-II Sea Surface Temperature (SST) www.esa-sst-cci.org Generating a Climate data record for SST from Passive Microwave observations Jacob L. Høyer, Jörg Steinwagner, Pia
APPENDIX 2 OVERVIEW OF THE GLOBAL PRECIPITATION MEASUREMENT (GPM) AND THE TROPICAL RAINFALL MEASURING MISSION (TRMM) 2-1
 AND THE TROPICAL RAINFALL MEASURING MISSION (TRMM) 2-1") APPENDIX 2 OVERVIEW OF THE GLOBAL PRECIPITATION MEASUREMENT (GPM) AND THE TROPICAL RAINFALL MEASURING MISSION (TRMM) 2-1 1. Introduction Precipitation is one of most important environmental parameters.
APPENDIX 2 OVERVIEW OF THE GLOBAL PRECIPITATION MEASUREMENT (GPM) AND THE TROPICAL RAINFALL MEASURING MISSION (TRMM) 2-1 1. Introduction Precipitation is one of most important environmental parameters.
Interpretation of Polar-orbiting Satellite Observations. Atmospheric Instrumentation
 Interpretation of Polar-orbiting Satellite Observations Outline Polar-Orbiting Observations: Review of Polar-Orbiting Satellite Systems Overview of Currently Active Satellites / Sensors Overview of Sensor
SST measurements over the Arctic based on METOP data
 SST measurements over the Arctic based on METOP data Pierre Le Borgne*, Steinar Eastwood**, Jacob Hoyer*** EUMETSAT / Ocean and Sea Ice Satellite Application Facility Presented at the Space and the Arctic
Evaluation of AATSR and TMI Satellite SST Data
 152 J O U R N A L O F C L I M A T E VOLUME 23 Evaluation of AATSR and TMI Satellite SST Data RICHARD W. REYNOLDS NOAA/National Climatic Data Center, Asheville, North Carolina CHELLE L. GENTEMANN Remote
IMPROVING REGIONAL AVHRR SST MEASUREMENTS USING AATSR SST DATA
 IMPROVING REGIONAL AVHRR SST MEASUREMENTS USING AATSR SST DATA Igor Tomažić, Milivoj Kuzmić Ruđer Bošković Institute, Bijenička 54, Zagreb, Croatia Abstract The sea surface temperature (SST) is an important
A REPROCESSING FOR CLIMATE OF SEA SURFACE TEMPERATURE FROM THE ALONG-TRACK SCANNING RADIOMETERS
 A REPROCESSING FOR CLIMATE OF SEA SURFACE TEMPERATURE FROM THE ALONG-TRACK SCANNING RADIOMETERS Owen Embury 1, Chris Merchant 1, David Berry 2, Elizabeth Kent 2 1) University of Edinburgh, West Mains Road,
How DBCP Data Contributes to Ocean Forecasting at the UK Met Office
 How DBCP Data Contributes to Ocean Forecasting at the UK Met Office Ed Blockley DBCP XXVI Science & Technical Workshop, 27 th September 2010 Contents This presentation covers the following areas Introduction
Application of a Land Surface Temperature Validation Protocol to AATSR data. Dar ren Ghent1, Fr ank Göttsche2, Folke Olesen2 & John Remedios1
 Application of a Land Surface Temperature Validation Protocol to AATSR data Dar ren Ghent1, Fr ank Göttsche, Folke Olesen & John Remedios1 1 E a r t h O b s e r v a t i o n S c i e n c e, D e p a r t m
McIDAS support of Suomi-NPP /JPSS and GOES-R L2
 McIDAS support of Suomi-NPP /JPSS and GOES-R L2 William Straka III 1 Tommy Jasmin 1, Bob Carp 1 1 Cooperative Institute for Meteorological Satellite Studies, Space Science and Engineering Center, University
Skin SST assimilation using GEOS Atmospheric Data Assimilation System
 Skin SST assimilation using GEOS Atmospheric Data Assimilation System Santha Akella Collaboration with: Ricardo Todling and Max Suarez Global Modeling & Assimilation Office NASA CDAW 2016 (October, 18,
In-flight Calibration Techniques Using Natural Targets. CNES Activities on Calibration of Space Sensors
 In-flight Calibration Techniques Using Natural Targets CNES Activities on Calibration of Space Sensors Bertrand Fougnie, Patrice Henry (DCT/SI, CNES, Toulouse, France) In-flight Calibration using Natural
REVISION OF THE STATEMENT OF GUIDANCE FOR GLOBAL NUMERICAL WEATHER PREDICTION. (Submitted by Dr. J. Eyre)
") WORLD METEOROLOGICAL ORGANIZATION Distr.: RESTRICTED CBS/OPAG-IOS (ODRRGOS-5)/Doc.5, Add.5 (11.VI.2002) COMMISSION FOR BASIC SYSTEMS OPEN PROGRAMME AREA GROUP ON INTEGRATED OBSERVING SYSTEMS ITEM: 4 EXPERT
WORLD METEOROLOGICAL ORGANIZATION Distr.: RESTRICTED CBS/OPAG-IOS (ODRRGOS-5)/Doc.5, Add.5 (11.VI.2002) COMMISSION FOR BASIC SYSTEMS OPEN PROGRAMME AREA GROUP ON INTEGRATED OBSERVING SYSTEMS ITEM: 4 EXPERT
Validation of AATSR using in situ radiometers in the English channel and Bay of Biscay
 Validation of AATSR using in situ radiometers in the English channel and Bay of Biscay Craig Donlon, Ian Robinson, Werenfrid Wimmer and Dave Poulter AATSR & MERIS Meeting, ESA/ESRIN, Frascati, Italy, 26-30
F O U N D A T I O N A L C O U R S E
 F O U N D A T I O N A L C O U R S E December 6, 2018 Satellite Foundational Course for JPSS (SatFC-J) F O U N D A T I O N A L C O U R S E Introduction to Microwave Remote Sensing (with a focus on passive
Towards a better use of AMSU over land at ECMWF
 Towards a better use of AMSU over land at ECMWF Blazej Krzeminski 1), Niels Bormann 1), Fatima Karbou 2) and Peter Bauer 1) 1) European Centre for Medium-range Weather Forecasts (ECMWF), Shinfield Park,
Discussion document: Near-surface oceanic temperature gradients Authors: Peter Minnett and Andrea Kaiser-Weiss. Page 1 of 7 Version 12 Jan 2012
 Page 1 of 7 This discussion document is to provide an explanation of the cartoon of near-surface temperature gradients that is on the GHRSST web pages (Figure 1), and which receives frequent attention,
Earth s Heat Budget. What causes the seasons? Seasons
 Earth s Heat Budget Solar energy and the global heat budget Transfer of heat drives weather and climate Ocean circulation A. Rotation of the Earth B. Distance from the Sun C. Variations of Earth s orbit
An Introduction to Coupled Models of the Atmosphere Ocean System
 An Introduction to Coupled Models of the Atmosphere Ocean System Jonathon S. Wright jswright@tsinghua.edu.cn Atmosphere Ocean Coupling 1. Important to climate on a wide range of time scales Diurnal to
CONTRAILS FROM (A)ATSR(2) DATA
ATSR(2) DATA") CONTRAILS FROM (A)ATSR(2) DATA Hermann Mannstein and Rüdiger Büll Deutsches Zentrum für Luft- und Raumfahrt, Oberpfaffenhofen, 82230 Wessling, Germany ABSTRACT/RESUME The DLR contrail detection algorithm
CONTRAILS FROM (A)ATSR(2) DATA Hermann Mannstein and Rüdiger Büll Deutsches Zentrum für Luft- und Raumfahrt, Oberpfaffenhofen, 82230 Wessling, Germany ABSTRACT/RESUME The DLR contrail detection algorithm
Lecture 3: Global Energy Cycle
 Lecture 3: Global Energy Cycle Planetary energy balance Greenhouse Effect Vertical energy balance Latitudinal energy balance Seasonal and diurnal cycles Solar Flux and Flux Density Solar Luminosity (L)
Richard W. Reynolds * NOAA National Climatic Data Center, Asheville, North Carolina
 8.1 A DAILY BLENDED ANALYSIS FOR SEA SURFACE TEMPERATURE Richard W. Reynolds * NOAA National Climatic Data Center, Asheville, North Carolina Kenneth S. Casey NOAA National Oceanographic Data Center, Silver
A unified, global aerosol dataset from MERIS, (A)ATSR and SEVIRI
ATSR and SEVIRI") A unified, global aerosol dataset from MERIS, and SEVIRI Gareth Thomas gthomas@atm.ox.ac.uk Introduction GlobAEROSOL is part of the ESA Data User Element programme. It aims to provide a global aerosol
A unified, global aerosol dataset from MERIS, and SEVIRI Gareth Thomas gthomas@atm.ox.ac.uk Introduction GlobAEROSOL is part of the ESA Data User Element programme. It aims to provide a global aerosol
Daily OI SST Trip Report Richard W. Reynolds National Climatic Data Center (NCDC) Asheville, NC July 29, 2005
 Asheville, NC July 29, 2005") Daily OI SST Trip Report Richard W. Reynolds National Climatic Data Center (NCDC) Asheville, NC July 29, 2005 I spent the month of July 2003 working with Professor Dudley Chelton at the College of Oceanic
Daily OI SST Trip Report Richard W. Reynolds National Climatic Data Center (NCDC) Asheville, NC July 29, 2005 I spent the month of July 2003 working with Professor Dudley Chelton at the College of Oceanic
Comparison of cloud statistics from Meteosat with regional climate model data
 Comparison of cloud statistics from Meteosat with regional climate model data R. Huckle, F. Olesen, G. Schädler Institut für Meteorologie und Klimaforschung, Forschungszentrum Karlsruhe, Germany (roger.huckle@imk.fzk.de
GCOM-W1 now on the A-Train
 GCOM-W1 now on the A-Train GCOM-W1 Global Change Observation Mission-Water Taikan Oki, K. Imaoka, and M. Kachi JAXA/EORC (& IIS/The University of Tokyo) Mini-Workshop on A-Train Science, March 8 th, 2013
Measuring the surface temperatures of the earth from space. Darren Ghent, University of Leicester 13/09/2018
 Measuring the surface temperatures of the earth from space Darren Ghent, University of Leicester 13/09/2018 Contents Background Challenges of measuring Land Surface Temperature Applications Current capability
Meteorological Satellite Image Interpretations, Part III. Acknowledgement: Dr. S. Kidder at Colorado State Univ.
 Meteorological Satellite Image Interpretations, Part III Acknowledgement: Dr. S. Kidder at Colorado State Univ. Dates EAS417 Topics Jan 30 Introduction & Matlab tutorial Feb 1 Satellite orbits & navigation
Impact of TRMM SSTs on a Climate-Scale SST Analysis
 2938 JOURNAL OF CLIMATE Impact of TRMM SSTs on a Climate-Scale SST Analysis RICHARD W. REYNOLDS NOAA/NESDIS/National Climatic Data Center, Asheville, North Carolina CHELLE L. GENTEMANN AND FRANK WENTZ
The SeaFlux Turbulent Flux Dataset Version 1.0 Documentation
 The SeaFlux Turbulent Flux Dataset The SeaFlux Turbulent Flux Dataset Version 1.0 Documentation Carol Anne Clayson1 J. Brent Roberts2 Alec S. Bogdanoff1,3 1. Woods Hole Oceanographic Institution, Woods
Remote sensing of sea ice
 Remote sensing of sea ice Ice concentration/extent Age/type Drift Melting Thickness Christian Haas Remote Sensing Methods Passive: senses shortwave (visible), thermal (infrared) or microwave radiation
GEOSC/METEO 597K Kevin Bowley Kaitlin Walsh
 GEOSC/METEO 597K Kevin Bowley Kaitlin Walsh Timeline of Satellites ERS-1 (1991-2000) NSCAT (1996) Envisat (2002) RADARSAT (2007) Seasat (1978) TOPEX/Poseidon (1992-2005) QuikSCAT (1999) Jason-2 (2008)
Data Short description Parameters to be used for analysis SYNOP. Surface observations by ships, oil rigs and moored buoys
 3.2 Observational Data 3.2.1 Data used in the analysis Data Short description Parameters to be used for analysis SYNOP Surface observations at fixed stations over land P,, T, Rh SHIP BUOY TEMP PILOT Aircraft
The Ocean-Atmosphere System II: Oceanic Heat Budget
 The Ocean-Atmosphere System II: Oceanic Heat Budget C. Chen General Physical Oceanography MAR 555 School for Marine Sciences and Technology Umass-Dartmouth MAR 555 Lecture 2: The Oceanic Heat Budget Q
School on Modelling Tools and Capacity Building in Climate and Public Health April Rainfall Estimation
 2453-6 School on Modelling Tools and Capacity Building in Climate and Public Health 15-26 April 2013 Rainfall Estimation CECCATO Pietro International Research Institute for Climate and Society, IRI The
Lecture 7: The Monash Simple Climate
 Climate of the Ocean Lecture 7: The Monash Simple Climate Model Dr. Claudia Frauen Leibniz Institute for Baltic Sea Research Warnemünde (IOW) claudia.frauen@io-warnemuende.de Outline: Motivation The GREB
Atmospheric Lidar The Atmospheric Lidar (ATLID) is a high-spectral resolution lidar and will be the first of its type to be flown in space.
 is a high-spectral resolution lidar and will be the first of its type to be flown in space.") www.esa.int EarthCARE mission instruments ESA s EarthCARE satellite payload comprises four instruments: the Atmospheric Lidar, the Cloud Profiling Radar, the Multi-Spectral Imager and the Broad-Band Radiometer.
www.esa.int EarthCARE mission instruments ESA s EarthCARE satellite payload comprises four instruments: the Atmospheric Lidar, the Cloud Profiling Radar, the Multi-Spectral Imager and the Broad-Band Radiometer.
QUALITY INFORMATION DOCUMENT For OSI TAC SST products , 007, 008
 QUALITY INFORMATION DOCUMENT For OSI TAC SST products 010-003, 007, 008 Issue: 1.5 Contributors: Jacob L. HOYER (DMI), Hanne HEIBERG (met.no), Jean-Francois PIOLLÉ (IFREMER), Bruce Hackett (MET Norway)
Sentinel-3 Sea and Land Surface Temperature Radiometer (SLSTR) Mireya Etxaluze (STFC RAL Space)
 Mireya Etxaluze (STFC RAL Space)") Sentinel-3 Sea and Land Surface Temperature Radiometer (SLSTR) Mireya Etxaluze (STFC RAL Space) RAL Space Radiometry Group Dave Smith Mireya Etxaluze, Ed Polehampton, Caroline Cox, Tim Nightingale, Dan
Sentinel-3 Sea and Land Surface Temperature Radiometer (SLSTR) Mireya Etxaluze (STFC RAL Space) RAL Space Radiometry Group Dave Smith Mireya Etxaluze, Ed Polehampton, Caroline Cox, Tim Nightingale, Dan
Objective Determination of Feature Resolution in an SST Analysis. Richard W. Reynolds (NOAA, CICS) Dudley B. Chelton (Oregon State University)
 Dudley B. Chelton (Oregon State University)") Objective Determination of Feature Resolution in an SST Analysis Richard W. Reynolds (NOAA, CICS) Dudley B. Chelton (Oregon State University) 1 What is an Analysis? An analysis is a field produced on a
Objective Determination of Feature Resolution in an SST Analysis Richard W. Reynolds (NOAA, CICS) Dudley B. Chelton (Oregon State University) 1 What is an Analysis? An analysis is a field produced on a
History of Earth Radiation Budget Measurements With results from a recent assessment
 History of Earth Radiation Budget Measurements With results from a recent assessment Ehrhard Raschke and Stefan Kinne Institute of Meteorology, University Hamburg MPI Meteorology, Hamburg, Germany Centenary
Bias correction of satellite data at Météo-France
 Bias correction of satellite data at Météo-France É. Gérard, F. Rabier, D. Lacroix, P. Moll, T. Montmerle, P. Poli CNRM/GMAP 42 Avenue Coriolis, 31057 Toulouse, France 1. Introduction Bias correction at
Cross-calibration of Geostationary Satellite Visible-channel Imagers Using the Moon as a Common Reference
 Cross-calibration of Geostationary Satellite Visible-channel Imagers Using the Moon as a Common Reference Thomas C. Stone U.S. Geological Survey, Flagstaff AZ, USA 27 30 August, 2012 Motivation The archives
A statistical approach for rainfall confidence estimation using MSG-SEVIRI observations
 A statistical approach for rainfall confidence estimation using MSG-SEVIRI observations Elisabetta Ricciardelli*, Filomena Romano*, Nico Cimini*, Frank Silvio Marzano, Vincenzo Cuomo* *Institute of Methodologies
CHAPTER 2 DATA AND METHODS. Errors using inadequate data are much less than those using no data at all. Charles Babbage, circa 1850
 CHAPTER 2 DATA AND METHODS Errors using inadequate data are much less than those using no data at all. Charles Babbage, circa 185 2.1 Datasets 2.1.1 OLR The primary data used in this study are the outgoing
AN ACCURACY ASSESSMENT OF AATSR LST DATA USING EMPIRICAL AND THEORETICAL METHODS
 AN ACCURACY ASSESSMENT OF AATSR LST DATA USING EMPIRICAL AND THEORETICAL METHODS Elizabeth Noyes, Gary Corlett, John Remedios, Xin Kong, and David Llewellyn-Jones Department of Physics and Astronomy, University
Radiation balance of the Earth. 6. Earth radiation balance under present day conditions. Top of Atmosphere (TOA) Radiation balance
 Radiation balance") Radiation balance of the Earth Top of Atmosphere (TOA) radiation balance 6. Earth radiation balance under present day conditions Atmospheric radiation balance: Difference between TOA and surface radiation
Radiation balance of the Earth Top of Atmosphere (TOA) radiation balance 6. Earth radiation balance under present day conditions Atmospheric radiation balance: Difference between TOA and surface radiation
CLAVR-x is the Clouds from AVHRR Extended Processing System. Responsible for AVHRR cloud products and other products at various times.
 CLAVR-x in CSPP Andrew Heidinger, NOAA/NESDIS/STAR, Madison WI Nick Bearson, SSEC, Madison, WI Denis Botambekov, CIMSS, Madison, WI Andi Walther, CIMSS, Madison, WI William Straka III, CIMSS, Madison,
Status of Libya-4 Activities - RAL
 Status of Libya-4 Activities - RAL Dr David L Smith Preparation for reprocessing AATSR Long term drift correction LUT version 2.09 implemented in reprocessing V3.00 available based on revised BRF modelling
New Salinity Product in the Tropical Indian Ocean Estimated from OLR
 New Salinity Product in the Tropical Indian Ocean Estimated from OLR Aquarius Bulusu Subrahmanyam and James J. O Brien Center for Ocean-Atmospheric Prediction Studies, Florida State University V.S.N. Murty
THE LAND-SAF SURFACE ALBEDO AND DOWNWELLING SHORTWAVE RADIATION FLUX PRODUCTS
 THE LAND-SAF SURFACE ALBEDO AND DOWNWELLING SHORTWAVE RADIATION FLUX PRODUCTS Bernhard Geiger, Dulce Lajas, Laurent Franchistéguy, Dominique Carrer, Jean-Louis Roujean, Siham Lanjeri, and Catherine Meurey
The use and impacts of sea surface temperature from passive microwave measurements
 The use and impacts of sea surface temperature from passive microwave measurements Anne O Carroll 6/12/2017 ECMWF workshop on using low frequency passive microwave measurements in research and operational
MERSEA Marine Environment and Security for the European Area
 MERSEA Marine Environment and Security for the European Area Development of a European system for operational monitoring and forecasting of the ocean physics, biogeochemistry, and ecosystems, on global
Chapter 4 Nadir looking UV measurement. Part-I: Theory and algorithm
 Chapter 4 Nadir looking UV measurement. Part-I: Theory and algorithm -Aerosol and tropospheric ozone retrieval method using continuous UV spectra- Atmospheric composition measurements from satellites are
MSG system over view
 MSG system over view 1 Introduction METEOSAT SECOND GENERATION Overview 2 MSG Missions and Services 3 The SEVIRI Instrument 4 The MSG Ground Segment 5 SAF Network 6 Conclusions METEOSAT SECOND GENERATION
The Structure and Motion of the Atmosphere OCEA 101
 The Structure and Motion of the Atmosphere OCEA 101 Why should you care? - the atmosphere is the primary driving force for the ocean circulation. - the atmosphere controls geographical variations in ocean