vulcanhammer.info the website about Vulcan Iron Works Inc. and the pile driving equipment it manufactured Terms and Conditions of Use:
|
|
|
- Ferdinand Tyler
- 5 years ago
- Views:
Transcription
 presented on this web site is for general information")

1 this document downloaded from vulcanhammer.info the website about Vulcan Iron Works Inc. and the pile driving equipment it manufactured Terms and Conditions of Use: All of the information, data and computer software ( information ) presented on this web site is for general information only. While every effort will be made to insure its accuracy, this information should not be used or relied on for any specific application without independent, competent professional examination and verification of its accuracy, suitability and applicability by a licensed professional. Anyone making use of this information does so at his or her own risk and assumes any and all liability resulting from such use. The entire risk as to quality or usability of the information contained within is with the reader. In no event will this web page or webmaster be held liable, nor does this web page or its webmaster provide insurance against liability, for any damages including lost profits, lost savings or any other incidental or consequential damages arising from the use or inability to use the information contained within. Visit our companion site This site is not an official site of Prentice-Hall, Pile Buck, or Vulcan Foundation Equipment. All references to sources of software, equipment, parts, service or repairs do not constitute an endorsement.
 I G. G. Goble, Garland Likins, Jr., Frank Rausche 9.")
2 L. Technical Keport Documentation Page 1. Report No Government Accession No Rec~p~ent's Catalog No. OHIO-DOT Tttle and Subt~tle Bearing Cap'acity of Piles from Dynamic lrleasurements 5 Report Date A I 8. Perform~ng Organlzatton Report NO. 7. Author's) I G. G. Goble, Garland Likins, Jr., Frank Rausche 9. Perform~ng Orgon~ratton Nome and Address Department of Solid Mechanics, Structures and Mechanical Design Case Western Reserve University Cleveland, Ohio Sponsoring Agency Nome and Address 10. Work Un~t No (TRAIS) 11. Contract or Grant NO. State Job No ) 13. Type of Report and Period Covered 1 1 Ohio Department of Transportation I FINAL REPORT I 1 Box 899 I Columbus, Ohio Supplementary Notes Study conducted in cooperation with the U. S. Department of Transportation, Federal Highway Administration 14. Sponsortng Agency Code I1 I 16. Abstract A series of research projects have produced a reliable and accurate means o f predicting static pile capacity from dynamic measurements. Instrumentation for measuring both force and acceleration at the pile top has been developed and tested. The signal is recorded on analog magnetic tape using a portable tape recorder. Tne necessary processing system, both hardware and software, has been assembled so that the recorded data can be analyzed completely automatically. The data is first converted to digital form and then a variety of computations are performed and the results plotted. 4 procedure, using the dynamic measurements, known as the Case Method has been studied which gives capacity predictions in excellent agreement with statically measured values. This method can be applied in the field using a special purpose computer. The concept was fully tested by the project. Methods were also developed for determination of resistance distribution along the pile using measurements made at the top. Extensive correlation between static measurements and dynamic predictions are presented for mcasuremcnts made in Ohio and also in other states. In all 74 piles were tested. 17. Key Wards BRIDGE PIERS, DESIGN, DYNMIICS, FOWDATIONS, IblPACT, PILE DRIVING, MEASURING INSTRIJMENTS, SOIL MECHANICS 18. Dt str~ but~on Statement.. A a t ' 19. Security Class~f. (of th~report) I 20. Securtty ~lasslf! (of thls No. of Pages Pr~ce * 1 Unclassified Unclassified I. 3, \i i.- Form DOT F (8-72) -,.,! ~epiodu.!,ibn..;f -. F~'"/.q.td 909 authorized ) ' L..~L-...'-.., I!.>.

3 F I N A L R E P O R T BEARING CAPACITY OF PILES FROM DYNAMIC bleasurements March 1975 G. G. Goble Garland Likins, Jr Frank Rausche This research was sponsored in cooperation with the Ohio Department of Transportation and the U. S. Department of Transportation, Federal Highway Administration. The opinions, findings and conclusions expressed in this publication are those of the authors and not necessarily those of the State or the Federal Highway Administration. This report does not constitute a standard, specification or regulation. Case Western Reserve University Department of Solid Mechanics, Structures and Mechanical Design University Circle Cleveland, Ohio

4 During the rather extended period which this project was active a large number of people, far too numerous to list, have made important contributions. Of particular importance is <he assistance provided by many piling contractors in providing cooperation and free driving services. Some important contributors however should be mentioned. Without the advice and assistance of these people the project could never have reached a successful completion. Ohio Department of Transportation Bureau of Bridges Raymond Grover Bureau of Construction Paul Eckhart Richard Dowalter Bureau of Research and Development Ray Hanes Leon Talbert Case Western Reserve University Prof. Fred Moses Prof. Robert Scanlan Graduate Students John Tomko \\I. S. LaPay David Bubb Kenneth Fricke The Department of Transportation of Idaho Yinnesota Pennsylvania New York Georgia Florida The Prestressed Concrete Institute The Foundation Equipment Company

5 PREFACE This report is intended to serve a number of functions. First, it represents the final report on the most recent phase of the research project "Dynamic Studies on the Bearing Capacity of Piles". This phase was the fifth and last in a series which was sponsored at Case Western Reserve University by the Ohio Department of Transportation and the Federal Highway Administration. The new developments coming out of this phase of the work are reported here. The second function of the report is to serve as a means for summarizing the results of a series of small projects sponsored by a number of state highway departments. These projects had as their goal the broadening of the data base. The third and perhaps most important purpose of the report is to summarize the results of the total project and to present a state-ofthe-art report on this approach to pile capacity determination.

6 T.4BLE OF CONTENTS TECHNICAL REPORT STANDARD TITLE P.4GE UNIVERSITY TITLE PAGE ACKNOWLEDGP fents PREFACE - Page i i i i.i i i v TABLE OF CONTENTS CHAPTER I CHAPTER I1 INTRODUCTION DATA ACQUISITION AND PROCESSING 2.1 Data Acquisition Equipment 2.2 Data Processing Equipment 2.3 Field bleasurements CHAPTER I11 CASE WTHOD 3.1 Introduction 3.2 Wave Mechanics 3.3 Evaluation of?.leasurements 3.4 Time Delay Methods 3.5 Derivation of Damping Estimate 3.6 Results of Damping Approach CHAPTER IV RESISTANCE DISTRIBUTION 4.1 Description of Resistance Distribution 4.2 Sample CAPWAP Results CHAPTER V CONCLUSIONS APPENDIX A REFERENCES TABLES FIGURES
.")
7 INTRODUCTION The concept of using a Newton-based approach to the dynamic determination of pile capacity was first studied by Nara and Eiber (I)* at Case Institute of Technology. In 1964 the Ohio Department of Transportation began to sponsor research at Case to continue and expand this concept. already been extensively reported (2-11). -- The resulting series of research studies has By 1970 it became apparent that the research results could be implemented for design and construction control of pile driving. However, there was a serious need for further data obtained on pile types and soils which had not been seen in Ohio. To meet this need, research sponsorship was sought from other state highway departments to provide data on piles which were being load tested statically to failure. The states of Idaho, Minnesota, Pennsylvania, New York, Georgia, and Florida responded to this request and piles were tested at a total of ten sites in these states. timber, prestressed concrete and steel pipes. clay to coarse sand. Pile types consisted of Soil types ranged from These projects have been reported previously (12-21) but summary results of these tests will be included in this report. Test work was also conducted in the state of Nevada under other arrangements with the Federal Highway Administration (the report on these tests is currently in progress) and the results are contained in this report. In the past two years the authors have been called upon to perform consulting services for private agencies around the country. These tests have produced a substantial amount of data on piles which were statically load tested and these results are also contained in this report. Unfortunately, extensive soil data cannot be made available from these tests but the correlation between dynamic and static measurements is substantially expanded as a result of this data. Project activities can be divided into four separate- groups. First, *Refers to references at end of text.

8 1 since the onset of the project tlrere has been a continual development of instrumentation, data acquisition and data processing equipment. This work has continued through the current project and the current state of this equipment is described in Chapter 2. A second activity has been the continued development and refinement of the Case Method of capacity prediction (referred to as the "Simplified Method" in some previous reports). The Case Method capacity prediction involves simple computations and the most recent developments are described in Chapter 3. The third activity has been the development of the necessary analog electronic circuitry to make Case Method capacity predictions in the field. The resulting device appears to now be commercially viable. For the past two years development of this device has been carried on privately and has not caused the expenditure of project funds. However, as new field computers became available they have been used in project activities. The fourth activity has been the continued study and development of a computational technique known as the Case Pile Wave Analysis Program (CAPWAP). This computational procedure involves ) the determination of both static and dynamic resistances and their distribution in the pile using as inputs the measurements of force and acceleration made at the pile top. This requires a substantial amount of computational time on a large digital computer; therefore, the procedure cannot be performed in real time in the field. However, it does provide considerable potential for future application both in pile capacity prediction and in other types of activities. The CAPWAP computational procedure is discussed and some sample results are presented in Chapter 4. I The Case Method of pile capacity prediction has now progressed to the stage of routine application in pile design and construction control. At the present time (January, 1974) three state highway departments have acquired the Pile Capacity Analyzer and transducers to perform tests using their own personnel. In addition the Federal Highway Administration is involved in a demonstration project of this equipment and is currently.. using two Pile Capacity Analyzers in a demonstration projkct. Thus, it can be stated that implementation has been achieved and further expanded applications can be expected.
 require the accurate measurement of force and acceleration at the pile top. In this Chapter the state-of-the-art for the routine measurement of these quantities will be described.")
9 Chapter 2 Data Acquisition and Processing 2.1 Data Acquisition Equipment The prediction of pile bearing capacity; computation of transferre$ energy and investigation of other dynamic quantities (i.e. maximum stresses, etc.) require the accurate measurement of force and acceleration at the pile top. In this Chapter the state-of-the-art for the routine measurement of these quantities will be described. The acceleration measurements have become quite routine due to developments in electronics. Commercially available accelerometers are mounted on small aluminum blocks which are then bolted to the pile as shown in Figure 2.1. The mounting block must be as rigid as possible to avoid measuring accelerations arising from the response of the mounts. The total device must also be lightweight and mounted as close to the pile wall as possible to prevent large inertia forces due to the high accelerations in this mass. Piezoelectric accelerometers were used because of their high natural frequency and ruggedness. The particular model currently used is the PCB Piezotronics Model 302M21 with ground isolation. The model has a built-in amplifier to reduce problems of electronic noise from the cable. The nominal range is 1000 g's with a maximum shock limit of 5000 gls. The nominal sensitivity is 5 milli- volts/g. This accelerometer has a frequency range of 1 to 5000 Hz with a resonant frequency greater than 30,000 Hz. Results have been satis- factory. The measurement of force has had more project involvement. Initially the force was measured by attaching resistance strain gages directly to the steel pile wall. The strain was converted to force using the knom material modulus and cross sectional area of the steel pile. Routine application of this technique for a large number of piles under all weather conditions is not a reasonable procedure. Reusable transducers.. are desirable in that they reduce the time required for attachment and number of the strain gages used. Thus, the total cost and time lost to the contractor for making a routine test is reduced. These transducers
 and thus avoids most of the difficulty experienced.")
10 I are constructed and calibrated in the laboratory. Two types of transducers were developed. force measuring device between the pile and the hammer. One type introduces a The force transducer is relatively lighweight compared with that used in other studies (22) and thus avoids most of the difficulty experienced. Results from this transducer have been compared with strain gages mounted directly on the pile with very good agreement. This trans- ducer attempts to match the cross section shape of the actual pile with a small increase in wall thickness. If damage occurs near the pile top, the transducer's increased wall thickness forces the damage to be in the pile, therefore preventing costly damage to the trans- ducer itself. For the common 12-inch pipe piles used in Ohio with a wall thickness of inches, a 12-inch diameter pipe with a 3/8 inch wall thickness and 12-inch length has performed satisfactorily. A force transducer is shown in Figure 2.2. At the mid-length of this pipe six dual element resistance strain gages are attached at 60 degree intervals to minimize local bending and end effects and obtain the ) average force in the pipe. One element is parallel and the other trans- F)t t * verse to the axis of the pipe. All gages have 120 ohms resistance and are wired three elements in series in each leg of a full bridge. inch thick, 14-inch steel plates were welded to the top and bottom of this pipe. One An 11-inch diameter hole was cut in these plates to minimize the transducer weight and the introduction of bending effects at the ends. The upper end of the transducer is bolted to another section of 12-inch pipe welded on one end to another heavy plate. This top adapter then accepts the driving helmet in exactly the same manner as would the actual pile. The bottom adapter is an undersized pipe which is welded to another heavy plate which is then bolted to the transducer. The bottom adapter then becomes a male adapter having a snug fit inside the pile top. High frequency accelerations can be mechanically filtered out by introducing plywood cushions between the transducer and top adapter. The use of more than two inches of plywood is discouraged as it modifies the actual event by an amount undesirable for use with the Case ~ethbd. The linearity of this transducer is excellent and hysteresis is not

11 noticeable during static calibration in a 200 kip universal testing machine. Transducers of this type have also been constructed for 14-inch and 10-inch pipes with equally satisfactory results. Transducers for steel H piles have been constructed with somewhat less satisfactory results. Due to the less regular shape it appears that the transducer length must be increased or the number of strain gages increased to avoid serious problems of linearity. The bottom adapter is also not as simple. Some type of fitting must be made to guide the transducer to fit well over the pile top or the heavy plate to which the transducer bolts must be tack welded directly to the pile top for each pile tested. Force transducers for concrete and timber piles,have not been satisfactorily designed. The second type of force measuring device can more accurately be described as a strain transducer. The current design is shown in Figure 2.1. This diamond shaped frame is attached to the pile at two points three inches apart along the pile axis. Four 350 ohm strain gages are attached to the "hinge" locations and are again wired in a full bridge arrangement. This frame then measures the average strain between the two points. If the strain transducer is too stiff, large forces are transmitted to the attachment points which can cause yielding of the transducer or slippage with respect to the pile causing. apparent large residual forces in the pile. The current design is very flexible (an axial static test of the transducer alone caused 3000 from only six pounds). To avoid undesirable effects of inertia forces it is also lightweight and attached close to the pile wall. Because of their weight and size, the strain transducers are easily transported to different job sites. They can be attached to any pile type, shape or size. Clearance holes for 1/4-20 bolts are drilled in thin wall steel sections and the transducers mounted with bolts and nuts. In thick wall steel sections the holes can be drilled c t! and tapped. Concrete piles are instrumented by drilling a 1/2-inch.. diameter, 1 inch deep hole and setting anchors for the 1/4-20 bolts. A 1/8-inch pilot hole is drilled in timber piles and the transducer is

12 1 then attached with lag bolts. The recorded strain is then converted to force using the pile area and material modulus. For steel piles these values are well known. However, for concrete and timber piles the dynamic modulus must be computed from the wave speed, c, by where p is the mass density. The density of concrete can be assumed to be 150 pounds per cubic foot. The density of creosoted timber varies widely from 40 to 70 lb/ft3 and, if an accurate modulus is to be determined, must be measured. The wave speed determination is a simple process and has been described elsewhere (13, 16, 17). To cancel any bending effects in the pile, two accelerometers and two strain transducers are attached diametrically opposite as shown in Figures 2.1 and 2.3. The cables from each transducer are connected to a connection box as in Figure 2.3. A single connection cable carrying all signals then goes to a power supply for the accelerometers and a signal conditioning and balancing unit for the strain. The output can then be observed on an oscilloscope or recorded on a high speed oscillograph or analog FM tape recorder for later analysis. The tape recorder gives the advantage of being able to recreate the electronic signal recorded. Thus, processing can be more efficient and accurate. d t"!@+ 2.2 Data Processing Equipment Upon returning from the field, the analog magnetic tape data are analyzed using the Case Project processing system. The data are automatically converted to digital form using an analog-to-digital converter controlled by a small digital computer. Those portions of the record containing the hammer blow are then stored on digital magnetic tape for further analysis. The acceleration record is integrated to obtain displacement. The final displacement can be compared with the driving record and if necessary the acceleration zero can be adjusted to give the correct final set. It should be emphasized that all of the above processing steps are performed automatically. It is

13 C important that as many checks as possible be performed on the data to assure its correctness. velocity are proportional at impact. For instance, it is known that force and Since these two quantities are obtained by two quite different measurement systems their comparison represents a particularly effective check. The records of force and velocity are thkn used to predict the pile's static capacity. If the data was taken at the end of driving, the Case Method capacity gives the static capacity at this time. The last blows are the most important. If data was taken during a restrike, the service conditions of the pile including any set-up or relaxation effects are given. During restrike, the loss of these time dependent effects can occur and, therefore, the first blows are the most critical. I: ' Maximum pile top accelerations, velocities, displacements, forces, stresses, and Case Method capacities are also printed for each blow analyzed. Hammer energy transferred to the pile can be calculated from the expression where the energy, E(t), force, F(t), and velocity, v(t), are all functions of time. This is the energy available to the pile to do work and it eliminates the uncertainty regarding the magnitude of impact losses due to heat, friction, sound, combustion efficiencies or ram impact velocity, and in elastic collisions in the drive cap assembly. The maximum and final energies (after pile rebound occurs) are also printed. In addition, plots of acceleration, velocity, displacement, force and energy may be plotted on a CALCOblP drum plotter as functions of time. An example of these plots is shown in Figure 2.4. Sample blows are then punched on punch paper tape and transferred to a large digital computer for wave equation analysis

14 2.3 Field Measurements Since the ultimate goal of this project has been to develop an easy-to-use method of accurately predicting a pile's static bearing capacity, the dynamic testing of piles which were also statically tested was emphasized. Only in this way could the techniques and prediction reliability be tested and improved. As early as December 1964 project personnel were given the opportunity to make dynamic measurements on piles which were also statically tested by the Ohio Department of Transportation. Data at that time was taken by strain gages mounted directly on the pile wall and recorded on a high speed oscillograph. During the next few years transducer development produced the reuseable force and strain transducers which were checked for accuracy by comparison of the record with strain gages mounted on the same pile. Accelerometers which were more rugged and had less electronic noise were also obtained. Through 1970 because of the limitations of the oscillograph, only a few blows per pile were recorded. They had to be manually converted to digital form for further analysis. The results from several of these early piles have since been determined to be of questionable accuracy. Many of the piles seem to have errors in their calibration of force or acceleration which are irretrievable. In some cases the oscillograph records were not converted to digital form with sufficient accuracy. For these reasons these piles are no longer being used for correlation with capacity. During the summer of 1970 the portable tape recorder became available due to a special grant from the Prestressed Concrete Institute and it was then used to record the data. In replacing the oscillograph, calibration errors were virtually eliminated and digital conversion, controlled by 3 small computer, made it possible to analyze a large volume of data faster and with greater accuracy. This made pile testing more accurate and routine. As the reliability of the results improved more opportunities became available to make the field measurements and compare predicted and measured capacity. This also provided ample opportunity to further- improve

15 the transducers. During this time analog computer for field determination of static capacity had reached the stage where it could be routinely used as the pile was being driven. Results were good and the computer has. since been further modified and improved and is now in routine use by several organizations. On many jobs this testing procedure has replaced or reduced static testing with large cost savings. Use of the technique, has also been applied to the quality control of production piling to insure uniformity over the job site by random testing. Additionally, since results are obtained for every blow, capacity as a function of penetration can be easily investigated to reveal the most suitable bearing stratum and make more efficient use of static load tests. The current list of piles where static and dynamic test results are available is given in Table 2.1. This data set provides the basis for correlation of Case Method capacity prediction with actual static load tests run to failure. Piles where load tests were not run to failure or where no static test was made are not reported in this list. The majority of the piles tested for the Ohio Department of Transportation were 12 inch cast-in-place closed-end steel pipes. are typically 40 to 80 feet in length. In Ohio these piles Cooperative projects were also begun in 1971 with various other state highway departments to expand the measurements to pile types which are not commonly used in Ohio. As a result of this activity, fourteen statically load tested piles were added to the data base, and the capability and reliability to test timber and prestressed concrete piles was proven. Also at about the same time a demand appeared from private agencies for this service on a consulting basis. of dynamically measured static load test piles. The result has again been an increase These 19 piles have been included in Table 2.1 as Consulting Piles (CP1, CP2,..., CP19) and are numbered in chronological order. The 74 piles reported here are of several types. A total of 46 of the piles were either closed end cast-in-place (CIP) steel pipe piles or mono- tube. In fact, the first 27 load tested piles measured by project personnel were of this type since they represent the standard Ohio Department of

16 1 Transportation pile where it is not driven to rock. Ten of the piles fly, 'sulu were timber piles and only three were steel H-pile sections. The remaining 15 piles were prestressed concrete piles of various cross. section. The most common sections were solid, ranging from 10 to 18 inches square. a 14 inch "diameter". Two of these piles were solid octagonal sections with The hammers used to test the piles were of several types; 5 were double acting air steam hammers, 9 were single acting air steam, 20 were double acting diesel, and 40 were single acting diesel. These were the hammers being used on the job sites and were not selected for any other reasons. seen in the midwest. In general the diesel hainmers are those which are most commonly have restrictions on hammer types. The air steam hammers were used in states which No noticeable difference in the reliability of the Case Method capacity prediction has been observed for any hammer type. ) The pile lengths have varied from about 25 feet to 140 feet for the load test piles reported here. Longer piles have been tested but were 9 not statically loaded or had no soil boring available. Shorter piles 4? have been tested but it should be noted that the time required for the force increase at impact becomes longer when compared to the time required for the Case Method. Conceivably this can adversely affect the prediction reliability and for this reason short piles have been discouraged. piles. Also included in Table 2.1 is a general soil description for the The soil at the pile tip is most important for the Case Method capacity predictions. The prevailing soil type along the pile is also given in cases where the side soil is greatly different from that at the pile tip. A wide variety of soil types can be observed. In addition to the load tested piles reported here, measurements of many additional piles have been made. On most construction sites where static tests were performed, in addition to the test pile several other job piles were randomly tested to insure uniformity over the job site..... It is not uncommon to test three to five additional piles in this manner.

17 As the reliability of the method has improved it has become increasingly common that dynamic measurements have completely replaced static testing on many sites. As a reuslt several hundred dynamically measured piles have also been tested in addition to the 74 piles in Table 2.1.

18 Chapter 3 Case Method 3.1 Introduction The Case Method of pile capacity determination has been used with increasing frequency during the past two years for both design and construction control of impact dr'iven piles. As an increasing amount - of static load test data became available for correlation the compu- tation methods were modified, improved and refined. The previous derivation of the fundamental Case Method equation has generally been preceeded by the assumption that the pile be treated as a rigid body. The expression resulting from the application of Newton's Second Law has then been modified without a complete derivation being presented with only a general reference to wave equation analysis. This type of presentation has caused the method to be criticized unjust- ) ly as being based on a rigid body assumption. The relationship was - first derived and presented in Reference 4. It will be developed here d :$ 1-1 in a brief way that will, perhaps, be more readable. Also the various modifications which are necessary to account for different soil and pile types are discussed. In order to illustrate many of the characteristics of pile mechanics a typical force and velocity record for an impact driven pile is shown in Figure 3.1, where the velocity was obtained by integrating the measured acceleration over time. Also, for ease of plotting the velocity was multiplied by a constant, EA/c (Young's modulus times cross sectional araa divided by the wave speed; all pile quantities). The time scale is given in milliseconds and in L/c units, i.e. in units of that time which a stress wave needs to travel along a pile of length L. This record was obtained from a 25 ft. long concrete pile driven by a Delmag D-30 Diesel hammer. The static resistance as determined by a.. load test was 550 kips which is low compared to the force at impact. As a result the pile top force decreases at time 2L/c after impact, i.e. (I <,*
 and will not be presented here. Figure 3.")
19 Ft when the impact wave returns after a (tension) reflection at the pile bottom. 3.2 Wave Mechanics In the subsequent discussion it is assumed that the bar or pile is of uniform cross section. The derivation and solution of the one dimensional wave equation, a linear, second order differential equa- tion, is available from other sources (23) and will not be presented here. Figure 3.1 shows one important phenomenon of wave mechanics, namely the fact that force and velocity at a point on a bar are pzo P ortionad as long as stress - waves-at--this._~-oint travel in-only one \- direction. A wave in a rod which is free at top and bottom always has the same direction of velocity (while the sign of stress changes upon each reflection). The proportionality between the two curves is destroyed as soon as waves caused by soil resistance forces reach the pile top. However, for a completely free pile the top velocity due to a pile top force, Ft(t), can be written Attimes later than 2L/c the effect of waves reflected from the pile bottom is felt at the top. Since a free top is assumed, the velcoity will be doubled under reflection and will always be positive (4). Theref ore 2c 1 v (t) = - t, F EA {T- Ft (t) + 2L (t - + Ft (t - T) +... } L Resistance forces create a somewhat more complex wave behavior in a pile, since they, in general, act at intermediate locations along the pile. A suddenly applied force at such an intermediate location prbhuces
, is directed upwards then the upwards traveling wave will be X in compression and the downwards traveling one in tension.")
20 I two waves. If the force, as in the case of soil resistance at a location x, R (t), is directed upwards then the upwards traveling wave will be X in compression and the downwards traveling one in tension. For reasons. of continuity and equilibrium, together with the proportionality requirement between force and velocity, the forces in each wave must have a magnitude that is one half of the applied force. The velocities. in both waves at the point of force application, xi, are: 1 c v (t) = -- t,fi 2 EA R xi (t) Dealing again with a free pile on which this resistance force acts, the velocities will always be directed upwards. The pile top velocity when either of the two waves arrives and reflects will be twice the magnitude of that in Equation 3.3. The only difference between the two waves is in the arrival time. The upwards traveling wave arrives earlier than the other wave which is first reflected ) from the bottom. Assuming that the distributed soil resistance is concentrated at n locations, x i = 1,..., n (xi measured from the top) whose i ' magnitudes are R i = 1,..., n and which are of the ideal plastic i ' type such that where H(t - a) is the Heavyside step function which is 0 for t < a (negative arguments) and 1 for t - > a. With t = 0 being the time of impact this soil resistance law implies that the resistance forces act only after the impact wave has reached their respective location and that they are constant thereafter. The effect of the upwards traveling wave caused by Rx (t) is felt at the top with a time delay x./c, and that of the downwaras trave17fng 1 wave with a delay (2L - xi)/c (after reflection at the bottom). This means that the first effect of Rx (t) carried by the downwards traveling i n
 as u C 2xi 2xi + 2L 2xi + 4L ) + H(t - t,i EA 1 c c C V (t) = - -R. (H(t - -) + H(t - ) +.. I 3.")
21 wave is felt together with the bottom reflected impact wave at time 2L/c after impact. For all times one can write the top velocity due to the upwards traveling velocity caused by R X i (t) as u C 2xi 2xi + 2L 2xi + 4L ) + H(t - t,i EA 1 c c C V (t) = - -R. (H(t - -) + H(t - ) +.. I 3.5 remembering again that because of'the reflection at the free top the wave velocity has doubled. The downwards traveling wave causes a top velocity d c 2L 4 L 6L v (t) = - - R. {H(t - + H(t - -) + H(t - -) t,i EA 1 c c 3.6 The total velocity caused by the impact force, F (t), and all n resist tance forces R i = 1, 2,..., n can be written as i ' c m j 2L vt(t) = a iift(t) Ft(t - -1 C j=1 where m indicates the time interval after impact: 3.3 Evaluation of bleasurements If this simplified soil model for the resistance force were correct then v (t) would be equal to vm(t) (i.e. the measured velocity) when t.. the measured force F (t) was substituted for Ft(t) in Equation 3.7. Thus, M

22 1 The third term in Equation 3.8, forces is shorn graphically in Figure 3.2. the summation over all resistance The first portion of the term is due to the first arrival at the pile top of the upward travel- ing wave due to the resistance at the location x The full value- 2x. i ' is felt at --A after impact and stays on for the remainder of the blow C as shown by the solid bar in Figure 3.2. The second portion of the term is due to the same wave after reflections from the top and bottom. Thus, for the first and succeeding time intervals m the effects are felt 2L/c after the preceeding interval m-1, the stripped bars in Figure 3.2. and are represented by The third portion of the third term is due to the effect of the downward traveling wave. The wave arrives at 2L/c after impact and again remains on for the remainder of the blow. Due to subsequent reflections the same effect is felt every 2L/c. This portion is depicted by the white bars in Figure 3.2. Since all of these effects are of equal magnitude it can be seen from Figure 3.2 that the third term becomes where m is the time interval. time t* If the measured velocity is taken at any.... and if the measured velocity at a time.2l/c later is subtracted, then the result is fl

23 I el* +' * C,

24 I For a uniform rod with and?i = LAp (p is the mass density, M the total pile mass) direct substitution gives Thus, Equation 3.13 can also be written as i which shows that the prediction R can be considered as an average of two force values 2L/c apart plus an inertia term using an average m. acceleration over the dame time period. Equation 3.13a reduces to Newton's Second Law as L approaches zero. F While the pile elastic properties and the distribution of resistance forces were properly considered in the above derivation, the resitsance force versus time variations were neglected. These variations exist because both dynamic resistance forces (soil damping) and unloading (pile rebound) occur. Originally (2) it was proposed to choose the time t*, yet to be decided upon, at the time when the pile top velocity became zero. Then, it was argued, soil damping forces would have become small. Results obtained in this way were usually somehat low when compared with the ultimate capacity of the pile as determined in a static load test. There was an indication, however, that a correct correlation was to be made with a penetration related capacity (less than ultimate). This approach.. has been abandoned as it is difficult to use in construction control

25 Later, it was found, when analyzing data from piles whose capacity was large compared to the hammer driving capability, or which had long lengths L (t* + 2L/c was then at a very late time) that unloading had occurred. The predictions were then too low. For steel pipe piles in granular soils empirical correlation with ultimate capacity was best when choosing t* at the time when the first relative maximum of velocity was reached (here called the time of impact). Such empirical correlation studies showed, further, that piles in cohesive soils required some time delay between the time of impact and t*. 3.4 Time Delay blethods The Case Method capacity equation is t -_- * This procedure using dynamic measurements has been applied to 60 piles which were also statically load tested. A wide variety of pile types, soil conditions, and hammer combinations are now represented and the results are very promising. Depending upon the pile-soil combination, dynamic forces, commonly called damping, related to the relative pile velocity can occur. For most pile types the majority of both the static soil resistance and dynamic forces have their origin at the pile tip - - C rather than- sidprp- -- ce. This hypothesis has been confirmed by using a wave equation analysis on the dynamically measured data (4) and also through strain gages located along the pile length where readings were taken during the static load tests: Because the largest static resistances usually occur at the pile toe an extensive study was performed to correlate the time t* with the pile type and soil type at the pile toe. If the time r* is chosen as the time of the first velocity maximum, tmax' the Case Method capacity, given by Equation 3.16 is a good approximation to the sum of static resistance and the maximum damping. If damping forces are negligible, then using

26 for t* in the Case Method should yield a good estimate of the tmax static capacity. For pipe piles driven into a sand, the use of the wave equation on dynamically measured force and acceleration showed very little damping. In this situation the Case Method using t max has done very well in predicting the static capacity. In cases where pipe piles have been driven into a finer grained bearing stratum such as silt or clay, damping forces can be substantial (to the point of exceeding the st.atic resistance) and using t could max lead to errors in Case Method. Between t and 2L/c later the velocities max in the pile are usually at their largest magnitude. Since damping forces are proportional to pile velocity, it is logical that to reduce damping forces it is necessary to wait until the velocities in the pile are smaller. A time delay from the time of the first relative maxirnum in velocity, tmax ' then becomes necessary. Because time, referenced to the pile, is measured in 2L/c units the expression for t* in the Case Method Equation 3.16 becomes The computational procedure is illustrated on a sample measurement record in Figure 3.3. For pipe piles various constants, 6, were tried for various soil conditions. Results can be seen in Figure 3.4. The solid bars represent those regions of 6-values which give a Case Method prediction within 15% of the load test value. For nonplastic silt 6 is chosen as 0.25; for weak plastic silt and soft clay 6 is 1.40; for stiff clay 6 is chosen as It would appear that as the soil bearing stratum becomes weaker (as determined from the soil boring logs) the delay time must be increased. For pile types other than steel pipe piles, similar analyses of the data were made. As the pile weight and stiffness of timber piles is similar to that of steel pipe piles, the 6-values for the various soil conditions for pipe piles apply equally well to timber piles. For concrete piles the

27 large pile mass can cause large predictions due to the acceleration related inertia term in Equation Large forces also occur at impact. If the bearing stratum is strong, no time delay is necessary;. however, 6-values of 0.25 have been used successfully on all concrete piles. For prestressed concrete piles in weaker material, larger 6-values also work well. More data is needed-. For H piles not driven to rock the static resistance gained purely from point bearing is smaller than for other pile types driven in a similar soil. Pile tip damping is also increased. From the limited data acquired on 14 piles to date a &-value of 1.50 seems appropriate. Results of all Case Method predictions for all pile soil types using the values recommended above are plotted against the corresponding static load test in Figure 3.5. Using a least squares correlation routine, a correlation coefficient of was obtained with a standard deviation of 19.7 kips. The average predicted divided by measured value was Differences due to the definition of failure for a static test are as large as the scatter represented here. The results for various pile types are shown separately in Figures Derivation of Damping Estimate behavior. Equation 3.13a has been derived using a very simple model for soil An improvement in this model and a commonly used approximation is to assume that the forces R. are really made up of two portions. 1 first portion is due to static resistance forces R and their sum R is i,s s then the actual failure load. The second portion Ri,d is due to dynamic resistance forces (damping) which are usually treated as being proportional to velocity. The sum of these dynamic forces R is important only during D the driving of the pile and is of no further practical value. Thus, the total driving resistance R can be broken up into two distinct portions The c In order to more closely approximate the pile's static capacity from' dynamic measurements an estimate of the total damping forces R must be made. D

28 Because the damping effects of soil and unloading due to pile rebound diminish the force and velocity waves in a rather short time period, only the first 2L/c period is usually available for estimation ' of the maximum damping resistance R Further, as described in D ' - Section 3.6 the majority of this damping resistance is concentrated / near the pile tip. The bottom velocity of thk pile for the free pile solution after the impact velocity arrives and reflects is L 3L for - < t < -. C- -C The effect of the downwards traveling wave caused by R (t) on the X. bottom velocity is given by twice the magnitude of Equation 3.3 due to reflection. The pile top velocity characteristically shows a relative maximum in the beginning of the blow (impact) and then diminishes in magnitude with time. In cases of very easy driving, the large tip penetrations and tensile reflections cause a large increase in pile velocity at 2L/c after impact. In several cases the top velocity after the impact reflection from the weak tip can become significantly larger than the pile velocity at impact. Because piles are rarely considered acceptable for capacity in such easy driving, they are not of great importance. However, in the cases where they have been encountered by the project the velocity estimates are satisfactory. The bottom velocity will reach a L relative maximum value at time t = t + - (t max c max is the time of impact) and is given by

29 (The effect of the upward traveling wave caused by Rx will be zero i L 2x + at time L/c because all Heavyside step functions 14(t - i, are C zero). If the damping force is treated as proportional to this bottom velocity then the maximum damping force becomes - - R ~ max, ' '~,max EA v ' Jc c B,max 3.22 where Jc is a dimensionless damping parameter (see Appendix A). Use of Equation 3.13a with t* equal to t gives the maximum driving resistance max Rrnax. Rearranging Equation 3.18 and using Equations 5.1, 3.12, 3.21 and 3.22 gives the maximum static resistance R S,max as, - E A R~,max Rmax c - Jc(2 - v (t t max ) - Rmax) 3.23a Use of Equation 3.23 can then be made with the measured force and velocity functions of time and the actual failure load of the pile as determined from a static load test to determine the correct value of J for any particular pile. C 3.6 Results of Damping Approach For most piles, if the damping can be assumed to be concentrated at the pile tip, the actual damping resistance was shown in Equation 3.23 to be proportional to the pile properties (EA/c), bottom velocity (which can be calculated from the top velocity, pile properties and total driving resistance), and a damping constant Jc which is related to the soil type at the pile tip. Data has been obtained on 71 test piles where static load test capacity, sufficient soil borings, and total..
 period eleven additional static test piles were tested which bring the total data set to 71 piles.")
30 1 driving resistance R are available. This approach was investigated max several months after the time delay methods. During the intervening ) period eleven additional static test piles were tested which bring the total data set to 71 piles. Of these piles, 43 are closed end steel pipes, 15 are prestressed concrete, ten are timber and three are H pi-les. For each pile a damping constant J was calculated which ' C produced a prediction which was equal to the static load test value. In addition damping constants which produce only 20 percent error in Case Method prediction were determined. chosen between these two limiting values will give Any damping constant Jc Case Method prediction which will be in error from the static load test value by less than 20 percent. Negative damping constants are physically meaning- less and are therefore set to zero should they occur. A plot of the non-negative damping constant J within 20 percent of the load test value C is given as a fucntion oe soil ty-pe regardless of pile type (because all pile types show the same characteristics) in Figure For piles with an ultimate capacity less than 150 kips the 20 percent range becomes less than 30 kips. Measurement errors in the dynamic and static as tests as well as the type and interpretation of the static load test failure appear to dictate for these low capacity piles that an error range of 30 kips instead of 20 percent be considered acceptable. This additional range in the acceptable damping constant value is indicated in Figure 3.10 with the dashed lines. It can be seen that as the soil grains become finer the damping constant, Jc, must become larger. was the expected result. For any given soil type on any job site where a static test is also run, a dynamic test on the static test pile will give the correct damping constant which can then be used on all remaining dynamically tested piles driven to the same soil stratum. For job sites with no static test to correlate with, the previous experiences shown in Figure 3.10 can then serve as a guide in choosing the proper damping constant which will yield a Case Method prediction within 20 percent of the static test result with a good degree of confidence. This Recommended values are Jp equal to 0.05 for sand, 0.15 for silty sand, 0.2 for sandy - ) f!

31 silt.,_0,3- - ffr. sil_t,_-o-.55.fo.r silty - clays.-- and clayey silt, and 1.1 for _I clay. The seemingly high value for clay is to protect against a possible failure in a soil type where relatively little experience. has thus far been obtained. It should be noted from Equation 3.23 that as the damping constant is increased the resulting static pre- diction becomes more conservative. Thus, to-assure that the Case Method is conservative, a higher damping constant than would normally be associated with the soil type need only be selected. It can be seen that the above recommended values are within 20 percent or are at least conservative in all but three cases. Two of these cases were for very low capacity piles in silty clay which were not production piling, but rather were driven especially for project personnel in the early stages of the project when measurement techniques were not as advanced. third pile was within 25 percent. The In general, the results of the Case Method using damping proportional the pile cross section properties EA/c appear very promising. A plot of the predicted versus measured capacities using the Case damping applied to the Case Method prediction is shown in Figure 3.11, and uses the above recommended damping constants One additional damping approach was considered. In the approach originally developed by Smith for the wave equation, the damping was assumed to be proportional to the static soil resistance (24). expression for the damping then becomes The - R~ - J~ S Rs 'bottom and the expression for the static resistance after rearranging then becomes R = S R max + J~ Vbottom 1 The same 20 percent or 30 kip (whichever is greater) criteria was applied.. to the pile with this equation. The results are shown in Figure 3.12 with the damping constant J as a function of soil type. S The differences

32 1 1 ) between the two definitions of damping cause rather large differences. The magnitude of the Smith damping constants J are only about one tenth S those of the Case damping constants Jc. Piles with low capacity seem to exhibit higher damping constants than do the higher capacity piles in the same soil type. It is possible that this is due to the definition of failure in the static tests (a constant error is a larger percentage in the low capacity piles). Due to the division of the damping term in the Smith method, as opposed to the linear subtraction of the Case damping, the low capacity piles have comparatively large ranges of acceptable Smith damping constants. In addition the Smith prediction cannot go negative but will only asymptotically approach zero as the product J s 'bottom becomes large. One last point is that when the pile capacity is small, the pile capacity R is more closely equal S to the pile property EA/c and the damping constant more closely approaches the more natural Case damping approach. The combination of the above factors makes the Smith damping approach a good one for low capacity piles if the damping constant J is chosen slightly S higher than higher capacity piles in the same soil type. For piles where the static capacity Rs is close to the ultimate driving resistance Rmax, the damping constant J must be small and S carefully selected or else large errors can result due to the division. =piles with normal or high capacity the following Smith damconstants are recommended based on current experience: Jp equals J - for sand, for silty sand and for sandy silt, for ~ilt, for clayey silt and silty clay, and for clays. The / user must be aware that- these valubs-wjj-ive results for low capacity piles as shown in Fiaxe 7 ~ very unconservative., P Y - --_- 'A -k 2. The above recommended values give results which are within the 20 percent (or 30 kips) or are conservative in all but six cases. Four of these cases are low capacity piles which have already been noted as giving unsatis- factory results unless the coefficient is increased. The other two piles which are undesirably non-conservative were concrete piles in clay and in sandy silt and were in error by 50.8 and 28.3 percent respectively. To be in error by 50 percent unconservatively is to - I.

33 eliminate the common factor of safety of 2.0 completely. This is very undesirable. Because of such features it is advisable to also compute the capacity using the Case damping approach and if the numbers are greatly different then use the lower of the two capacity estimates. It is often impossible to judge a priori whether or not the pile is a low capacity pile and that the Smith damping constant should be increased.. In addition. For these reasons it would appear that the Case damping approach (damping proportional to pile properties and not static capacity) is the better method. In addition to the piles reported here, three closed end steel pipes had computed bottom velocities which were negative. As this was physically meaningless the damping was assumed to be zero. The resulting error from using the entire maximum driving resistance R max as the static capacity was conservative in all cases. One case had an error less than 15 percent and the other two cases had errors less than two percent. Many additional piles had load tests which were not run to failure of the soil resistance. The piles represented in this report generally had driving resistances between 12 and 200 blows per foot. For larger blows per foot where the entire soil resistance of the pile is not mobilized, the Case Method capacity can only be expected to give the soil resistance which was mobilized. This has usually resulted in a conservative prediction as compared with the static capacity. These piles are also represented in Figure 3.11.

34 Chapter 4 RESISTANCE DISTRIBUTION ) 4.1 Description of Resistance Distribution During Project Phase I11 the capability was developed to determine- the. m ' a ' ~ i r t ~ f i * a R d f " d ~ t ~ ~ ~ -using e ~ i l e as input, measurements of forte* and -acce&er&gion. made.&* thecpi$e e epae This computational procedure can also separate the static and dynamic resistance forces using a simple model for soil resistance consisting of an elastic-plastic spring and a linear dashpot. During the current project phase no further work was done on this computational procedure and there was no opportunity to make static measurements of resistance distribution for correlation with the dynamic predictions. However, since this report represents a state-of-the-art review it is appropriate to summarize the computational algorithm and the results which have been obtained. Consider the physical basis behind this computational method. In Figure 4.1 a drawing is shown which depicts an orthogonal view of the pile force given as a function of both pile location and time. It was obtained from dynamic measurements made at selected locations along the pile. Several lines shown were interpolated from the measured values. The particular record shown in Figure 4.1 was obtained during the testing of a special test pile at a site in Rittman, Ohio. These tests were reported in Reference 5. This record was taken after fifty feet of the pile had been driven with the pile tip in a very soft material. As can be seen there was very little resistance at the tip. The resistance that was there can be largely characterized as being dynamic or velocity dependent since it decreases later in the record as the velocity decreases. Since there is a very weak resistance at the pile tip a tension force is reflected back on the oncoming compression force creating a alley'^ which progresses to the top of the pile at.. approximately 2L/c after the time of impact. fl c,;

35 f) \ I 1 I In Figure 4.2 a similar drawing is shown. It represents the same force-location-time plot based on data taken on the same pile. this case, however, the pile had been extended an additional eight feet causing the tip to be embedded in a hard soil layer. In At the time when the impact reaches the tip the force increases to a very large value which maintains itself at the pile tip Tor an extended period of time. There is little sign of velocity dependent resistance. Further- more, this high resistance force reflects back to the pile top as a compression force superimposed on the oncoming compression causing an increase in the pile top force at 2L/c after impact. of these two figures reveals that -p;hlo +n An examination w. The Case Pile Wave Analysis Program CAPWAP, performs this in a systematic fashion. The measured velocity obtained by integration of the acceleration record is taken as an input quantity. From this input and an assumed set of soil resistance forces, the pile top force can be computed using a lumped mass-spring system as is commonly used in all pile wave equation programs. By adjusting the resistance forces and balancing them between static and dynamic resistance it is possible to adjust the computer force I so that it agrees with the measured force record. The CAPWAP program performs this function automatically. The details of the computation are beyond the scope of this report and have been reported elsewhere (Ref. 4) T1 The above described capability is useful for two reasons. First, it is sometimes necessary to make estimates of the resistance distribution along the pile length. There is, however, another use for this program which may be of greater value than the resistance distribution. Since a very thorough elastic dynamic analysis is performed it would be expected that the calculated total resistance force would be more reliable than values obtained by the Case Method. This has not been proven to be true based on correlation studies which have been made. However, it should be recognized that the Case Method has been calibrated by pile and soil types so that the results correlate well with the available data. there is a large volume of previous experience on any given pile-soil.. If

36 1 type combination then,it would be expected that considerable reliability could be achieved on future sites with the same combination. In some combinations of pile type and soil type rather modest amounts of data have been used to perform this correlation and therefore it can be expected that a certain amount of difficulties may occur when the method is applied to other similar combinations. In cases such as this,. experience has shown that while the CAPWAP method has not produced such high correlation values as achieved by the Case Method, it does not make a substantial unconservative error and provides considerable confidence in the predicted pile capacity. ' n -Y'., 4.2 Sample CAPWAP Results Many piles have been tested during the past two years by project personnel. To provide a comprehensive description of each pile in this report is prohibited by the large volume of data and test experience acquired in this project phase. Therefore, only example piles will be discussed. A 50 foot long 10HBP57 steel H pile was driven on a test site on the Purdue University campus in Lafayette, Indiana by a Delmag D-12 open end diesel hammer with a manufacture's rated energy of 22,500 ftpounds. The soil was generally a medium sand grading gravel with depth. A gray clayey silt (ML) layer was located below the pile tip at final penetration. This test was performed in connection with the 1972 ASCE Soil Mechanics and Foundation Engineering Specialty Conference. The test results are reported in detail in Reference 25. In addition to the standard instrumentation at the pile top, resistance strain gages were attached along the pile length. Thus, measurements of strain at five locations were made and along with two acceleration records at the pile top were recorded on two tape recorders. The dynamic records of strain in the pile as a function of time and pile length were plotted and are shown in Figure 4.3. Strain time relations for pile locations which were not measured were interpolated.from -the measured data. A compressive force from impact can be seen traveling at the wave speed from the pile top to the toe. Because of relatively small end

37 bearing forces this oncoming compression produces a tensile reflection wave which travels back toward the pile top. This tensile reflection almost completely cancels the downwards propagating hammer compression ' force creating a valley of near zero forces. Therefore, it can be observed that the pile top force decreases to nearly zero at approximately 2L/c after impact. This decrease gives an indication of the tip resistance by only observing the pile top force. Another interesting phenomenon can be observed in Figure 4.3. The toe force, which was actually measured 1.5 feet above the pile tip, first reaches a relatively large maximum and then decreases and oscillates near 30 kips. The high peak is a result of the inertia of the 1.5 foot section and viscous damping due to the high tip velocities at this time. The average value at the later time is due to the static resistance below this point which is the same as was measured during the static load test. In general, however, static soil resistances cannot be so easily extracted from dynamic measurements at locations other than the pile toe. Intermediate locations exhibit forces due to hammer impact, static and dynamic soil resistances and pile inertia which only a detailed dynamic analysis can separate. ' The static load test was run to failure at a constant rate of penetration of 0.02 inches per minute. Jack pressure, pile top displacement and the strains at the five locations along the pile length were recorded. This load test data is plotted in Figure 4.4. All forces are plotted as a function of pile top displacement. After pile yielding, the load test was run to 0.8 inches penetration. Elastic rebound was 0.22 inches. The soil resistance between gage locations can be obtained by subtracting the force readings of the two gages. In this way it is noticed that the major portion of the static soil resistance of this pile occurred between gage locations 3 and 5 which were 21 and 4 feet respectively above the pile tip. A few blows were anlayzed automatically by CAPWAP. A sample computed top force is shown in Figure 4.5 for one of the last blows during driving. Agreement is quite good with the measured forces until around 2L/c after
 are presented by ' circles. In general the two distributions agree well. Figure 4.6a shows a plot of the predicted and measured load test curves.")
38 ) impact. Differences can be attributed to the soil model. The force f-3" u distribution predicted by CAPWAP is shown in Figure 4.6b by the solid line. The measured values (at 155 kips top force ) are presented by ' circles. In general the two distributions agree well. Figure 4.6a shows a plot of the predicted and measured load test curves. The predicted load test curve was obtained automatically using a static analysis of the resistance distribution obtained in the CAPWAP analysis. A 12 inch O.D. with 1/4 inch.wal1 pipe pile was driven near Oneonta, New York into a rather uniform silt (15). The standard measurements of force and acceleration were made at the pile top. A Constant Rate of Penetration (CRP) test was run two weeks after initial driving to an ultimate value of 217 kips. Dynamic data was recorded one day after the CRP test as a restrike test. The hammer used was a Vulcan #I. The pile showed increasing pile sets with continued restriking as well as a substantial strength increase over initial driving; it is logical to assume that a substantial setup effect was present. 1 Five selected blows were analyzed with CAPWAP. The blows were selected to reflect the loss of capacity during the early stages of redriving and the capacity and soil resistance distribution at the end of restrike. The results from Blow Number 1 are most important for correlation with the static test. The computed and measured forces curves are shown in Figure 4.7. Excellent agreement was achieved over all time. The agreement of the predicted capacity (204 kips) with the static test is also good. The-measured load test and CAPWAP predicted load test are shown in Figure 4.8a with close agreement. The curve in Figure 4.8b for Blow Number 1 can be interpreted as follows. There is a zero force in the pile at the bottom. About sixteen feet above the pile tip the force is 76 kips. This means that a soil resistance of 76 kips acts over the bottom 16 feet of the pile. The rest of the static soil resistance ( = 128 kips) acted in a relatively uniform manner along the upper 69 feet of the pile. Thus, the pile is mainly a friction pile. The maximum total dynamic resistance for this blow was 93 kips or

39 46 percent of the static prediction. The other blows analyzed for this pile show a rapid capacity breakdown with increasing blow number. Also the resistance distribution changes rapidly from side friction to toe resistance with an increase of toe resistance. This distribution change is apparent even in the second blow and by blow 8 the static capacity-of only 89 kips was entirely end bearing. Such dramatic changes in so few blows can only be studied from such measurements, either by an analysis similar to CAPWAP or by measurements along the pile length as in the Purdue test. The maximm dynamic resistance for Blow 8 was 231 kips or 260 percent of the static capacity. The static capacity continued to decrease to a value of 65 kips for Blow 122, the last blow analyzed. It is impossible to ascertain whether or not the static capacitiei are correct for these later blows with the large dynamic to static ratios. It would seem that for such high ratios that the simple Case Method cannot yield a sufficiently reliable result. On the other hand the linear viscous damping model used in CAPWAP is also only an approximation. The entire Case Project approach to pile driving was originally developed and tested exclusively on the pile types which were commonly used in the state of Ohio, namely steel piles. In order for the procedure to be completely general, the method should also work well on other pile types. The testing of timber and concrete piles were performed in cooperation with other highway departments. The results which were obtained indicated that the procedure worked and that the method was independent of the pile type. A timber pile with a non-uniform cross section was tested near Yonticello, Minnesota with a Linkbelt 440 hammer (13). The soil was a rather uniform sand with silt layers. The ultimate capacity from the CRP test was 132 kips. Data was taken during the last 170 blows of driving. Five blows were analyzed with CAPWAP, three from early records and two at the end of driving. Plots of predicted and measured force curves are shown in Figure 4.9 and 4.10 for early and late blows resjectively. The match is generally very good except at about 2L/c after impact.

40 The load test curve predicted from CAPWAP for the blow at the end of driving shows good agreement with the CRP test curve as shwon in Figure 4.11a. 4.11b. The resistance distribution for all five blows is shown in Figure The early blows showed capacities of about 90 kips, and the predicted capacities of the last blows was around 120 kips. This indicated capacity buildup was also noted in the field by increased driving resistance. above grade as should be expected. As can be seen no resistance was found to act For Blow , 80 kips is the force in the pile 2.5 feet above the tip. This means 44 kips (124-80) resistance along the skin with rather uniform distribution. about 2/3 of the total resistance was end bearing. Thus, Due to the reduced availability and increased cost of steel piling, prestressed concrete piles are becoming more economical throughout the country. A test was performed in Miami, Florida on 18 inch solid section prestressed piles driven with a Delmag D-30 hammer (19). Dynamic data on the load test pile was taken after the CRP test had failed at 358 kips. t-4 The CAPWAP force match, in Figure 4.12, agreed well. The predicted,+ '4 capacity of 372 kips agrees well with the measured value and the measured and CAPWAP predicted load test curves show satisfactory agreement as seen in Figure 4.13a. The resistance distribution shown in Figure 4.13b shows very little static capacity along the upper 2/3 of the pile length. While such results for the prestressed pile presented here are interesting and show the method to be applicable, further tests on 60 foot long, 18 inch concrete piles at this site show another interesting application of the CAPWAP analysis. Current specifications for the driving of prestres'sed concrete piles try to prohibit the cracking of the concrete during impact by controlling the hammer properties. Because the pile tip resistance is smaller than the impact force, the impact com- pression force reflects at the pile tip and returns as a tensile force. If the reflected tensile force is larger than the oncoming compression.. force a net tensile force can occur which, if large enough, can cause structural damage in the form of tensile cracks. The CAPWAP analysis,

41 because it can compute the effects of impact, reflections and soil forces and their time of arrival at various locations along the pile length, can also produce a predicted force-time-pile length curve similar to that measured in Purdue. The only inputs required are the measured top force and acceleration which are necessary (and easy to perform using the current system) for the Cas-e procedures. The cqmputer can then find the location and magnitudes of the most critical tensile and compressive stresses. Because of Florida's interest in tensile stresses, strain measurements were also made at the mid length of these piles. Comparisons of the measured stresses at this location with that predicted by CAPWAP for the same location from measurements taken at the pile top for easy and medium driving resistances are shown in Figures 4.14 and 4.15 respectively. Agreement of the maximum stress magnitudes is excellent. In addition, the stress-time curves also match quite well. Thus, it can be concluded that -'- -Te-~ap. CAPWAP then becomes an effective tool for investigating impact induced structural damage.

42 Chapter 5 Conclusions 1. The instrumentation developed during the course of the project provides a reliable and accurate means of measuring force and acceleration at the pile top during driving. These measurements can be made on a routine basis requiring only a very short interruption of the contractor's operation. 2. Using the automatic processing system developed by the project a large number of hammer blows can be processed and analyzed. Useful driving parameters such as pile top energy, maximum velocity, maximum force, etc. can be easily calculated and printed. Also computer controlled plots of the driving record can be made automatically from the digital record.,y ft*$ 3. The Case Method capacity using time delay gives an excellent, ) correlation with statically measured values. 6 k, 4J.%. 4. The Case Method capacity using a soil dependent damping constant also shows good agreement with the statically measured value. It has the advantage of greater rationality compared with the time delay approach and, in addition, conservatism can be achieved at the judgement of the engineer by use of a larger damping constant. 5. The CAPWA? procedure can obtain the resistance distribution and can separate the static and dynamic resistances using the dynamic pile top measurements only. LVhile the results show a somewhat larger correlation coefficient with the static measurements than does the Case Method, the improved model used to describe the soil and the pile should be expected to produce better results in unfamiliar conditions. I stresses. 6. CAPWAP can also be used to evaluate particular problems of driving.. 7. Limited implementation has been achieved and the application of this work is expanding rapidly.

43 APPENDIX A, Derivation of J C Replacing the pile by a mass-spring-damper system Newton's Second Law becomes If we now define (26) <=b and w 2 =-, k 2mw n m n where 5 is the viscous damping factor and b is the coefficient of viscous damping, then E A where, for the pile, the mass m is pal and the stiffness k is - L Recalling Equation 3.14, the value for 5 becomes and is critically damped when introducing J = 25 we get C for 0 < Jc < 2.

44 REFERENCES A 1. Eiber, R. J., "A Preliminary Laboratory Investigation of the Prediction of Static Pile Resistances in Sand", blaster's ~hesis, Dept. of Civil Engineering, Case Institute of Technology, Goble, G. G., Scanlan, R. H. and Tomko, J. J., "Dynamic Studies on the Bearing Capacity of Piles", Vol. I and 11, - Case Institute of Technology, July Goble, G. G., Tomko, J. J., Rausche, F. and Green, P. M., "Dynamic Studies on the Bearing Capacity of Piles, Phase II", Vol. I and II., Report No. 31, Division of Solid Mechanics, Structures and Mechanical Design, Case Nestern Reserve University, July, Goble, G. G., Rausche, F., and Moses, F., "Dynamic Studies on the Bearing Capacity of Piles, Phase III", Report No. 48, Division of Solid Sfechanics, Structures and Mechanical Design, Case Western Reserve University, Goble, G. G., Scanlan, R. H. and Tomko, J. J., "Dynamic Studies on the Bearing Capacity of PilesTf, Highway Research Record, Number 167, Highway Research Board, Washington, D. C., Goble, G. G. and Rausche, F., "Pile Load Test by Impact Drivingf', paper presented to the Highway Research Board Annual ~eeting, Washington, D. C., January fi I 6.q 7. Rausche, F., Goble, G. G., and Moses, F. "A New Testing Procedure for Axial Pile Strength", Third Annual Offshore Technology Conference, Paper No. OTC 1481, Houston, Texas, Goble, G. G., Fricke, K. and Likins, G. E., "Driving Stresses in Concrete Piles", to be published in PC1 Journal, Nov.-Dec Goble, G. G. and Rausche, F., "Dynamic Measurements of Pile Behavior", Proceedings of the Conference on Design and Installation of Pile Foundations and Cellular Structures, Lehigh University, April, Goble, G. G., Moses, F. and Rausche, F., "Prediction of Pile Behavior from Dynamic Measurements", Proceedings of the Conference on Design and Installation of Pile Foundations and Cellular Structures, Lehigh University, April Goble, G. G., Walker, F., and Rausche, F., "Pile Bearing Capacity - Prediction vs. Performance", Proceedings of the Specialty Conference on Performance of Earth and Earth-Supported Structures, Vol. I, Part 2, Purdue University, Lafayette, Indiana, June 1972.

45 Goble, G. G. and Rausche, F., "A Static and Dynamic Pile Test in Pocatello, Idaho", Division of Solid Mechanics, Structures and Mechanical Design, Case Western Reserve University, Cleveland, Ohio June Goble,.G. G. and Raushce, F., "A Static and Dynamic Timber Test Pile Test in Monticello, Minnesota", Division of Solid Mechanics, Structures and Mechanical Design, Case Western Reserve University, Cleveland, Ohio, December Goble, G. G. and Rausche, F., "Static and Dynamic Tests on Two Pipe Piles in Philadelphia, Pennsylvania", Division of Solid Mechanics, Structures and Mechanical Design, Cleveland, Ohio, January Goble, G. G. and Likins, G. E., Jr., "A Static and Dynamic Pile Test in Oneonta, New York", Division of Solid Mechanics, Structures and Mechanical Design, Cleveland, Ohio, April Goble, G. G. and Likins, G. E., Jr., "A Static and Dynamic Pile Test in Whitehall, New York',' Department of Solid Mechanics, Structures and Mechanical Design, Cleveland, Ohio, August Goble, G. G. and Likins, G. E., Jr., "A Static and Dynamic Pile Test in West Palm Beach, ~lorida',' Department of Solid Mechanics, Structures and Mechanical Design, Cleveland, Ohio, August Goble, G. G., and Likins, G. E., Jr.. "Predicting the Bearing Capacity of a Pile from Dynamic Measurements in Tarv&r,Georgia1', Department of Solid Mechanics, Structures and Mechanical Design, Cleveland, Ohio, February Goble, G. G., Fricke, K. E., Likins, G. E., Jr., I1A Static and Dynamic Pile Test in Dade County, Florida", Department of Solid Mechanics, Structures and Mechanical Design, Cleveland, Ohio, March Goble, G. G. and Fricke, K. E., "A Static and Dynamic Pile Test in Tallahassee, Florida", Department of Solid Mechanics, Structures and Mechanical Design, Cleveland, Ohio, December Goble, G. G., and Likins, G. E., Jr., "A Static and Dynamic Pile Test in Fairmount, Minnesota", Department of Solid Mechanics, Structures and Mechanical Design, Cleveland, Ohio, July Michigan State Highway Commission, "A Performance Investigation of Pile Driving Hmtners and Piles", Final Report, Lansing, Michigan, $!arch Timoshenko, S. P. and Goodier, J. N., Theory of Elasticity, FIcGraw-Hill Book Company, Third Edition, New York, Smith, E. A. L., "Pile Driving Analysis by the Wave Equation", Journal of the Soil Mechanics and Founddtions Division, Proceedings of the ASCE, Paper 2574, SM4, August 1960, pp
46 25. Goble, G. G., Kovacs, W. D., and Rausche, F., "Field Demonstration: 9 Response of Instrumented Piles to Driving and Load Testing", Proceedings --* of the Specialty Conference on Performance of Earth and Earth-Supported Structures, Volume 111, Purdue University, Lafayette, Indiana, June Meirovitch, Leonard, Analytical Siethods in Vibration, MacMiller Co., New York, 1967.

47 Number Date Ilanuner --- Pile Type Pile Length - Tip Soil --- Side Soil 12" CIP 76.5 silty clay 18" CIP 7 6 silty clay 12" monotube 59 sandy gravel 12" CIP sandy silt 12" CIP si lt 12" CIP silt 12" CIP silt 8 F60A 12" CIP silt 9 CIN 68 12" CIP gravelly sand " CIP sandy silt, stone silty clay P r 11 TO50 12" CIP silty clay silt 12 T050A 12" CIP silty clay ' silt 12" CIP 6 0 silty clay silt 12" CI P 60 silty clay silt 15 Logan 12" CIP 58 12" CIP " CIP " CIP 41 12" CIP ' 50 silty gravelly sand clay clay gravelly sand silty clay TABLE 2.1

48 M G O O 6 d M a a a H H H C) U U 4 4 rl \ A \ Ell $-"t H a m m m a U N C. I N U a ' H H U - -. C c C d d N 3 a l - c ( r ( 4 4

49 c a, M'E 0 F-( v,

50 Xt' ) 41!ij z m > m a, v, Ll cd 0 U v, rl X-c cd a, k s M m ' -. - E u u u u a m m m m k k H a a a a a, o u e 0 % % a,.rl E -.cl 2 & rl. d d. r l k :I? i-. o d M I M M i-. M i-. I L n r l P i-. a3 r n ' r n 4-1 a a a a a a a u u r d 5 5 U u

51

52 d d d b b b b d 421 b t-. b t-. t-. b t-. t-- I 1 I I I I I d l A 4, N N N N M 0 4 N b. - I t-.
![Rated Energy [F'T-LB] -- Ram Weight [LD] Delmag Dl2 22,500 Delmag Dl5 Delmag D22 Delmag D30 Fairchi ld 1:20 liera H39 Kobe K13 Kobe K22 Kobe K25 Kobe K60 Linkbelt LB312 Linkbelt LB440 Linkbelt LB520](/docs-images/82/84921033/images/53-1.jpg "Linkbelt LB660 45,000 ~c~iernan- err^ C5.")
53 Rated Energy [F'T-LB] -- Ram Weight [LD] Delmag Dl2 22,500 Delmag Dl5 Delmag D22 Delmag D30 Fairchi ld 1:20 liera H39 Kobe K13 Kobe K22 Kobe K25 Kobe K60 Linkbelt LB312 Linkbelt LB440 Linkbelt LB520 Linkbelt LB660 45,000 ~c~iernan- err^ C5. 16,000 McKiwnan-Terry DE20 16,000 Raymond 65c Vulcan V1 Vulcan V06 Open end diesel Open end diesel Open end diesel Open end diesel Single acting air steam Open end diesel Open end diesel Open end diesel Open end diesel Open end diesel Closed end diesel Closed end diesel Closed end diesel Closed end diesel Double acting air steam Open end diesel Differential steam Single acting air steam Single acting air steam P 0 TABLE 2.1 (cont.)
 bolted to steel pipe section.")
 with single cable then")
54 2.1 Photograph of lightweight accelerometer (1) and strain transducer (2) bolted to steel pipe section. An identical transducer set is bolted to the other side and all wires are connected to connection box (3) with single cable then leading to electronic recording system.

55 2.2 Photograph of Case force transducer for 12 inch pipe piles. Accelerometers also are attached t-o inside. of the force transducer.

56 @ STRAIN TRANSDUCERS 0 SYSTEM CONNECTING BOX ACCELEROMETER POWER SUPPLIES AND OUTPUT BOX STRAIN AMPLIFIER 0 TAPE RECORDER Figure 2.3: Schematic of transducer attachmerlt and data acquisition system.

57 '! n.. > : FORCE, '.,..& i :,.,",.. i,.. : fl,.p!,,%.\/\,!,!.;? ' '<v 8 ', JL,t :/ :. **;, ' \ ENERGY,:,./ I \ '.?' \. 4, \.,,;,;*, \,- -VELOCITY '..:.. '~\-.' '-,,. ' , TIME 25msec inch VELOCITY 25 ft sec inch ENERGY 25 k-ft inch FORCE 300 kips inch Figure 2.4: Sample dynamic records plotted automatically by Case Processing system

58

59

60

61 0 1.0 TIME DELAY FACTOR FOR PIPE PILE ONLY Figure 3.4: Time delay factor versus soil type at the pile tip giving prediction within 15% of load test.

62

63

64
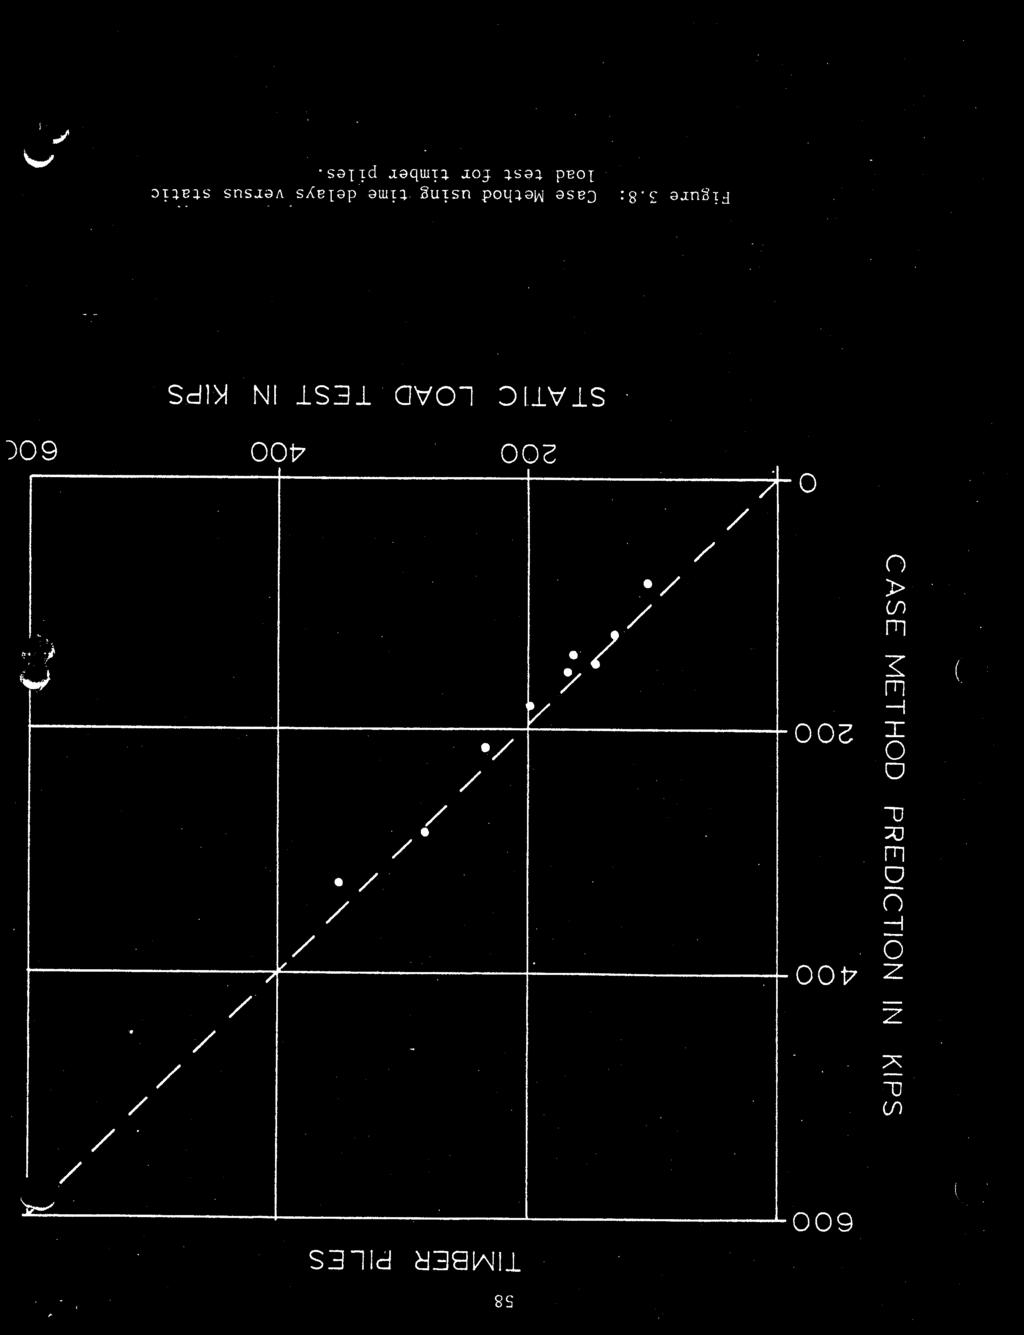
65

66

67 CASE DAMPING CONSTANT Jc Figure 3.10: Case clamping constant,ic giving Case Method predicfion within 20% of the static test versus soil type at tile pile tip.

68

69 SMITH DAMPING CONSTANT Jc n Figure 3.12: Smith damping constant Jc giving Case PletI~od prediction witv of the static test result versus soil type at the pile 'L z ~.

70

71

72

73 TOP PENETRATION IN INCHES. Figure 4.4: bleasured forces in pile during Purdue static load test.
![PURDUE LOAD TEST PILE LAST BLOW 5 M sec FORCE [M] --- FORCE [C] --------](/docs-images/82/84921033/images/74-1.jpg "VELOCI TY r E A/C [M] Figure 3.5: Force match computed by CAPKAP.")
74 PURDUE LOAD TEST PILE LAST BLOW 5 M sec FORCE [M] --- FORCE [C] VELOCI TY r E A/C [M] Figure 3.5: Force match computed by CAPKAP. for Purdue pile.

75

76

77

78

79

80
81 C w w u -'='a ==-I o o w LL -> I l l

82 'in W I- LL] 0 7

83

84
This document downloaded from vulcanhammer.net vulcanhammer.info Chet Aero Marine
 This document downloaded from vulcanhammer.net vulcanhammer.info Chet Aero Marine Don t forget to visit our companion site http://www.vulcanhammer.org Use subject to the terms and conditions of the respective
BACKGROUND AND INTRODUCTION
 WAVE MECHANICS As applied to pile testing 1 BACKGROUND AND INTRODUCTION Wave Mechanics 2 1 HISTORIC TOOLS AND MATERIALS Timber piles Drop Hammers 10 Days for the Romans to build the bridge over the Rhine
vulcanhammer.net This document downloaded from
 This document downloaded from vulcanhammer.net since 1997, your source for engineering information for the deep foundation and marine construction industries, and the historical site for Vulcan Iron Works
Lesson 25. Static Pile Load Testing, O-cell, and Statnamic. Reference Manual Chapter 18
 Lesson 25 Static Pile Load Testing, O-cell, and Statnamic Reference Manual Chapter 18 STATIC LOAD TESTING Most accurate method to determine static pile capacity Perform at design or construction stage
vulcanhammer.info the website about Vulcan Iron Works Inc. and the pile driving equipment it manufactured Terms and Conditions of Use:
 this document downloaded from vulcanhammer.info the website about Vulcan Iron Works Inc. and the pile driving equipment it manufactured Terms and Conditions of Use: All of the information, data and computer
DEVELOPMENT OF DROP WEIGHT IMPACT TEST MACHINE
 CHAPTER-8 DEVELOPMENT OF DROP WEIGHT IMPACT TEST MACHINE 8.1 Introduction The behavior of materials is different when they are subjected to dynamic loading [9]. The testing of materials under dynamic conditions
Interpretation of Pile Integrity Test (PIT) Results
 Results") Annual Transactions of IESL, pp. 78-84, 26 The Institution of Engineers, Sri Lanka Interpretation of Pile Integrity Test (PIT) Results H. S. Thilakasiri Abstract: A defect present in a pile will severely
Annual Transactions of IESL, pp. 78-84, 26 The Institution of Engineers, Sri Lanka Interpretation of Pile Integrity Test (PIT) Results H. S. Thilakasiri Abstract: A defect present in a pile will severely
PDA Workshop: Stresses, Integrity, Energy and Capacity
 PDA Workshop: Stresses, Integrity, Energy and Capacity Ir Richard C L Yu IEM 2 Sep 2013 Dynamic Pile Monitoring For each blow determine Pile driving stresses Pile integrity Hammer performance Capacity
VMS-GeoMil. Background
 Background When using a drilling rig for cone penetration testing, a mechanical clamp can be mounted to the drilling head (by means of a special transition piece). The depth than can be achieved depends
Understanding Dynamic Pile Testing and Driveability
 008-015 understand dynamic 5/30/06 5:10 PM Page 8 Understanding Dynamic Pile Testing and Driveability... By: Engr. Dr Sam Ming Tuck MIEM, P.Eng INTRODUCTION Traditionally, piles are static load tested
Standard Test Method for High-Strain Dynamic Testing of Deep Foundations 1
 Designation: D4945 12 Standard Test Method for High-Strain Dynamic Testing of Deep Foundations 1 This standard is issued under the fixed designation D4945; the number immediately following the designation
S E C T I O N 1 2 P R O D U C T S E L E C T I O N G U I D E - H E L I C A L S C R E W P I L E F O U N D A T I O N S
 1. P R O D U C T S E L E C T I O N G U I D E - H E L I C A L S C R E W P I L E F O U N D A T I O N S Helical foundation pile includes a lead and extension(s). The lead section is made of a central steel
vulcanhammer.info the website about Vulcan Iron Works Inc. and the pile driving equipment it manufactured Terms and Conditions of Use:
 this document downloaded from vulcanhammer.info the website about Vulcan Iron Works Inc. and the pile driving equipment it manufactured Terms and Conditions of Use: All of the information, data and computer
Lecture 19. Measurement of Solid-Mechanical Quantities (Chapter 8) Measuring Strain Measuring Displacement Measuring Linear Velocity
 Measuring Strain Measuring Displacement Measuring Linear Velocity") MECH 373 Instrumentation and Measurements Lecture 19 Measurement of Solid-Mechanical Quantities (Chapter 8) Measuring Strain Measuring Displacement Measuring Linear Velocity Measuring Accepleration and
MECH 373 Instrumentation and Measurements Lecture 19 Measurement of Solid-Mechanical Quantities (Chapter 8) Measuring Strain Measuring Displacement Measuring Linear Velocity Measuring Accepleration and
vulcanhammer.info the website about Vulcan Iron Works Inc. and the pile driving equipment it manufactured Terms and Conditions of Use:
 this document downloaded from vulcanhammer.info the website about Vulcan Iron Works Inc. and the pile driving equipment it manufactured Terms and Conditions of Use: All of the information, data and computer
NEW DOWN-HOLE PENETROMETER (DHP-CIGMAT) FOR CONSTRUCTION APPLICATIONS
 FOR CONSTRUCTION APPLICATIONS") NEW DOWN-HOLE PENETROMETER (DHP-CIGMAT) FOR CONSTRUCTION APPLICATIONS 1 2 C. Vipulanandan 1, Ph.D., M. ASCE and Omer F. Usluogullari 2 Chairman, Professor, Director of Center for Innovative Grouting Materials
NEW DOWN-HOLE PENETROMETER (DHP-CIGMAT) FOR CONSTRUCTION APPLICATIONS 1 2 C. Vipulanandan 1, Ph.D., M. ASCE and Omer F. Usluogullari 2 Chairman, Professor, Director of Center for Innovative Grouting Materials
Additional Pile Design Considerations
 Additional Pile Design Considerations PDCA 2015 Professor Driven Pile Institute Patrick Hannigan GRL Engineers, Inc. What Are Additional Pile Design Considerations? Time Dependent Soil Strength Changes
Foundation Engineering Dr. Priti Maheshwari Department Of Civil Engineering Indian Institute Of Technology, Roorkee
 Foundation Engineering Dr. Priti Maheshwari Department Of Civil Engineering Indian Institute Of Technology, Roorkee Module - 02 Lecture - 15 Machine Foundations - 3 Hello viewers, In the last class we
Elasticity: Term Paper. Danielle Harper. University of Central Florida
 Elasticity: Term Paper Danielle Harper University of Central Florida I. Abstract This research was conducted in order to experimentally test certain components of the theory of elasticity. The theory was
Glossary Innovative Measurement Solutions
 Glossary GLOSSARY OF TERMS FOR TRANSDUCERS, LOAD CELLS AND WEIGH MODULES This purpose of this document is to provide a comprehensive, alphabetical list of terms and definitions commonly employed in the
Civil Engineering, Surveying and Environmental Consulting WASP0059.ltr.JLS.Mich Ave Bridge Geotech.docx
 2365 Haggerty Road South * Canton, Michigan 48188 P: 734-397-3100 * F: 734-397-3131 * www.manniksmithgroup.com August 29, 2012 Mr. Richard Kent Washtenaw County Parks and Recreation Commission 2330 Platt
vulcanhammer.info the website about Vulcan Iron Works Inc. and the pile driving equipment it manufactured Terms and Conditions of Use:
 this document downloaded from vulcanhammer.info the website about Vulcan Iron Works Inc. and the pile driving equipment it manufactured Terms and Conditions of Use: All of the information, data and computer
Study of Rupture Directivity in a Foam Rubber Physical Model
 Progress Report Task 1D01 Study of Rupture Directivity in a Foam Rubber Physical Model Rasool Anooshehpoor and James N. Brune University of Nevada, Reno Seismological Laboratory (MS/174) Reno, Nevada 89557-0141
Deep Foundations 2. Load Capacity of a Single Pile
 Deep Foundations 2 Load Capacity of a Single Pile All calculations of pile capacity are approximate because it is almost impossible to account for the variability of soil types and the differences in the
Special edition paper
 Development of New Aseismatic Structure Using Escalators Kazunori Sasaki* Atsushi Hayashi* Hajime Yoshida** Toru Masuda* Aseismatic reinforcement work is often carried out in parallel with improvement
Purpose of this Guide: To thoroughly prepare students for the exact types of problems that will be on Exam 3.
 ES230 STRENGTH OF MTERILS Exam 3 Study Guide Exam 3: Wednesday, March 8 th in-class Updated 3/3/17 Purpose of this Guide: To thoroughly prepare students for the exact types of problems that will be on
Improving site specific modified driving formulae using high frequency displacement monitoring
 Proc. 20 th NZGS Geotechnical Symposium. Eds. GJ Alexander & CY Chin, Napier Improving site specific modified driving formulae using high frequency displacement monitoring R Damen Brian Perry Civil, Auckland,
Feasibility of dynamic test methods in classification of damaged bridges
 Feasibility of dynamic test methods in classification of damaged bridges Flavio Galanti, PhD, MSc., Felieke van Duin, MSc. TNO Built Environment and Geosciences, P.O. Box 49, 26 AA, Delft, The Netherlands.
INTRODUCTION TO STATIC ANALYSIS PDPI 2013
 INTRODUCTION TO STATIC ANALYSIS PDPI 2013 What is Pile Capacity? When we load a pile until IT Fails what is IT Strength Considerations Two Failure Modes 1. Pile structural failure controlled by allowable
Seismic Pushover Analysis Using AASHTO Guide Specifications for LRFD Seismic Bridge Design
 Seismic Pushover Analysis Using AASHTO Guide Specifications for LRFD Seismic Bridge Design Elmer E. Marx, Alaska Department of Transportation and Public Facilities Michael Keever, California Department
Service Information Letter SIL # 017
 Service Information Letter SIL # 017 Trunnion Adjustment - Double Barrels Only Equipment: Double Barrels With Sloped Trunnions Date Issued: 9-24-03 Additional Reference: SIL # 016 Revised: Revision #:
ME 2570 MECHANICS OF MATERIALS
 ME 2570 MECHANICS OF MATERIALS Chapter III. Mechanical Properties of Materials 1 Tension and Compression Test The strength of a material depends on its ability to sustain a load without undue deformation
ON THE PREDICTION OF EXPERIMENTAL RESULTS FROM TWO PILE TESTS UNDER FORCED VIBRATIONS
 Transactions, SMiRT-24 ON THE PREDICTION OF EXPERIMENTAL RESULTS FROM TWO PILE TESTS UNDER FORCED VIBRATIONS 1 Principal Engineer, MTR & Associates, USA INTRODUCTION Mansour Tabatabaie 1 Dynamic response
THE STRUCTURAL DESIGN OF PILE FOUNDATIONS BASED ON LRFD FOR JAPANESE HIGHWAYS
 THE STRUCTURAL DESIGN OF PILE FOUNDATIONS BASED ON LRFD FOR JAPANESE HIGHWAYS Hideaki Nishida 1,Toshiaki Nanazawa 2, Masahiro Shirato 3, Tetsuya Kohno 4, and Mitsuaki Kitaura 5 Abstract One of the motivations
Use of Ultra-High Performance Concrete in Geotechnical and Substructure Applications
 Use of Ultra-High Performance Concrete in Geotechnical and Substructure Applications i PI: Muhannad Suleiman Co-PI: Sri Sritharan Graduate Research Assistant: Thomas L. Vande Voort January 13, 29 IOWA
CTC 460 kcmil ACCC Conductor Stress Strain Tests
 CTC 46 kcmil ACCC Conductor Stress Strain Tests NEETRAC Project Number: 8-45 March, 28 Requested by: Doug Pilling CTC Principal Investigator: Paul Springer, PE Reviewed by: Graham Price CTC 46 kcmil Conductor
Neutral Plane Method for Drag Force of Deep Foundations and the AASHTO LRFD Bridge Design Specifications
 Neutral Plane Method for Drag Force of Deep Foundations and the AASHTO LRFD Bridge Design Specifications Timothy C. Siegel, P.E., G.E., D.GE Dan Brown and Associates, PC, Knoxville, Tennessee USA Rich
Measurement Techniques for Engineers. Motion and Vibration Measurement
 Measurement Techniques for Engineers Motion and Vibration Measurement Introduction Quantities that may need to be measured are velocity, acceleration and vibration amplitude Quantities useful in predicting
ABSTRACT INTRODUCTION
 A gauge for measurements of soil-structure interface force due to explosive loading H. Ilstad," T. B0rvik& & K.A. Malo" ^Department of Structural Engineering, The Norwegian Institute of Technology, N-7034
Dynamic behavior of turbine foundation considering full interaction among facility, structure and soil
 Dynamic behavior of turbine foundation considering full interaction among facility, structure and soil Fang Ming Scholl of Civil Engineering, Harbin Institute of Technology, China Wang Tao Institute of
Page AC : INSTRUMENTATION FOR SHOCK AND IMPACT ANALYSIS
 AC 2010-2123: INSTRUMENTATION FOR SHOCK AND IMPACT ANALYSIS Randy Buchanan, University of Southern Mississippi Steven Bunkley, University of Southern Mississippi American Society for Engineering Education,
(Refer Slide Time: 1: 19)
") Mechanical Measurements and Metrology Prof. S. P. Venkateshan Department of Mechanical Engineering Indian Institute of Technology, Madras Module - 4 Lecture - 46 Force Measurement So this will be lecture
Mechanical Measurements and Metrology Prof. S. P. Venkateshan Department of Mechanical Engineering Indian Institute of Technology, Madras Module - 4 Lecture - 46 Force Measurement So this will be lecture
Laboratory Analysis Improves Crankshaft Design
 Purdue University Purdue e-pubs International Compressor Engineering Conference School of Mechanical Engineering 1972 Laboratory Analysis Improves Crankshaft Design L. L. Faulkner Ohio State University
Evaluation of dynamic behavior of culverts and embankments through centrifuge model tests and a numerical analysis
 Computer Methods and Recent Advances in Geomechanics Oka, Murakami, Uzuoka & Kimoto (Eds.) 2015 Taylor & Francis Group, London, ISBN 978-1-138-00148-0 Evaluation of dynamic behavior of culverts and embankments
CAPWAP rules Important!
 CAPWAP rules Important! Unit friction < 4 ksf (200 kpa ) for most soils QT (+TG) < Dmax, toe to assure activation QS < 0.2 inch (5 mm ) usually 0.1 inch; 2.5 mm SS, ST < 0.4 s/ft (1.3 s/m ) if higher,
EQUIVALENT FRACTURE ENERGY CONCEPT FOR DYNAMIC RESPONSE ANALYSIS OF PROTOTYPE RC GIRDERS
 EQUIVALENT FRACTURE ENERGY CONCEPT FOR DYNAMIC RESPONSE ANALYSIS OF PROTOTYPE RC GIRDERS Abdul Qadir Bhatti 1, Norimitsu Kishi 2 and Khaliq U Rehman Shad 3 1 Assistant Professor, Dept. of Structural Engineering,
Construction of a Vibrating Structure for Demonstration of Vibration Measurement
 Paper ID #9316 Construction of a Vibrating Structure for Demonstration of Vibration Measurement and FFT Analysis Prof. Aaron Alexander, Oklahoma State University Aaron Alexander is an Assistant Professor
THEORETICAL DESIGN OF A NAILED OR BOLTED JOINT UNDER LATERAL LOAD 1. Summary
 THEORETICAL DESIGN OF A NAILED OR BOLTED JOINT UNDER LATERAL LOAD 1 BY EDWARD W. KUENZI, 2 Engineer Forest Products Laboratory,3 Forest Service U. S. Department of Agriculture Summary This report presents
[5] Stress and Strain
![[5] Stress and Strain](/thumbs/95/123344550.jpg "[5] Stress and Strain") [5] Stress and Strain Page 1 of 34 [5] Stress and Strain [5.1] Internal Stress of Solids [5.2] Design of Simple Connections (will not be covered in class) [5.3] Deformation and Strain [5.4] Hooke s Law
[5] Stress and Strain Page 1 of 34 [5] Stress and Strain [5.1] Internal Stress of Solids [5.2] Design of Simple Connections (will not be covered in class) [5.3] Deformation and Strain [5.4] Hooke s Law
INCREASE IN PILE CAPACITY WITH TIME IN MISSOURI RIVER ALLUVIUM
 INCREASE IN PILE CAPACITY WITH TIME IN MISSOURI RIVER ALLUVIUM Paul J. Axtell Jacob W. Owen Scott D. Vollink U.S. Army Corps of Engineers U.S. Army Corps of Engineers U.S. Army Corps of Engineers Kansas
Investigation of basic elements loading and tension of heavy hydraulic presses for metallurgical production
 Investigation of basic elements loading and tension of heavy hydraulic presses for metallurgical production Ganush V. I. National metallurgical academe of Ukraine Ostroverhov N. P., Sultan A. V., Dzichkovky
Bulk Modulus Capacitor Load Cells
 '.\ '._,. SSCL-274. Superconducting Super Collider Labora Bulk Modulus Capacitor Load Cells C. E. Dickey April 1990 SSCL-274 BULK MODULUS CAPACITOR LOAD CELLS" C. E. Dickey Superconducting Super Cullider
IN SITU TESTING TECHNOLOGY FOR FOUNDATION & EARTHQUAKE ENGINEERING. Wesley Spang, Ph.D., P.E. AGRA Earth & Environmental, Inc.
 IN SITU TESTING TECHNOLOGY FOR FOUNDATION & EARTHQUAKE ENGINEERING Wesley Spang, Ph.D., P.E. AGRA Earth & Environmental, Inc. Portland, Oregon In situ testing of soil, which essentially consists of evaluating
EVALUATION OF STRENGTH OF SOILS AGAINST LIQUEFACTION USING PIEZO DRIVE CONE
 4 th International Conference on Earthquake Geotechnical Engineering June 25-28, 2007 Paper No. 1146 EVALUATION OF STRENGTH OF SOILS AGAINST LIQUEFACTION USING PIEZO DRIVE CONE Shun-ichi Sawada 1 ABSTRACT
MAPPING THE RAINFALL EVENT FOR STORMWATER QUALITY CONTROL
 Report No. K-TRAN: KU-03-1 FINAL REPORT MAPPING THE RAINFALL EVENT FOR STORMWATER QUALITY CONTROL C. Bryan Young The University of Kansas Lawrence, Kansas JULY 2006 K-TRAN A COOPERATIVE TRANSPORTATION
Foundation Engineering Prof. Mahendra Singh Department of Civil Engineering Indian Institute of Technology, Roorkee
 Foundation Engineering Prof. Mahendra Singh Department of Civil Engineering Indian Institute of Technology, Roorkee Module - 03 Lecture - 05 Field Tests Hello viewers, welcome back to the course on Foundation
EXPERIMENTAL EVALUATION OF SHEAR STRENGTH OF WOVEN WEBBINGS
 EXPERIMENTAL EVALUATION OF SHEAR STRENGTH OF WOVEN WEBBINGS Kevin L. Peil +, Ever J. Barbero +, Eduardo M. Sosa* + Department of Mechanical and Aerospace Engineering, West Virginia University (WVU), Morgantown,
CHAPTER 5. 1:6-Scale Frame: Northridge Ground-Motion Modeling and Testing
 CHAPTER 5 :6-Scale Frame: Northridge Ground-Motion Modeling and Testing 5. OVERVIEW This Chapter was organized with the intent of concisely presenting pertinent aspects of analytical and experimental results
Harmonized European standards for construction in Egypt
 Harmonized European standards for construction in Egypt EN 1998 - Design of structures for earthquake resistance Jean-Armand Calgaro Chairman of CEN/TC250 Organised with the support of the Egyptian Organization
PLATE GIRDERS II. Load. Web plate Welds A Longitudinal elevation. Fig. 1 A typical Plate Girder
 16 PLATE GIRDERS II 1.0 INTRODUCTION This chapter describes the current practice for the design of plate girders adopting meaningful simplifications of the equations derived in the chapter on Plate Girders
Finite Element Modelling with Plastic Hinges
 01/02/2016 Marco Donà Finite Element Modelling with Plastic Hinges 1 Plastic hinge approach A plastic hinge represents a concentrated post-yield behaviour in one or more degrees of freedom. Hinges only
Congreso Internacional de Fundaciones Profundas de Bolivia Santa Cruz, Bolivia, 12 al 15 de Mayo de 2015 Day 1: Software Demonstrations
 Applications of Stress Wave Theory to Deep Foundations with an Emphasis on The Wave Equation (GRLWEAP) Congreso Internacional de Fundaciones Profundas de Bolivia Santa Cruz, Bolivia, 12 al 15 de Mayo de
Acceleration levels of dropped objects. Technical paper 321
 Acceleration levels of dropped objects Technical paper 31 Acceleration levels of dropped objects Introduction This paper is intended to provide an overview of drop shock testing, which is defined as the
Module 1 : Site Exploration and Geotechnical Investigation
 Objectives In this section you will learn the following Displacement borings Wash boring Auger boring Rotary drilling Percussion drilling Continuous sampling Boring methods of exploration The boring methods
BioMechanics and BioMaterials Lab (BME 541) Experiment #5 Mechanical Prosperities of Biomaterials Tensile Test
 Experiment #5 Mechanical Prosperities of Biomaterials Tensile Test") BioMechanics and BioMaterials Lab (BME 541) Experiment #5 Mechanical Prosperities of Biomaterials Tensile Test Objectives 1. To be familiar with the material testing machine(810le4) and provide a practical
BioMechanics and BioMaterials Lab (BME 541) Experiment #5 Mechanical Prosperities of Biomaterials Tensile Test Objectives 1. To be familiar with the material testing machine(810le4) and provide a practical
The Ohio Department of Transportation Office of Research & Development Executive Summary Report
 The Ohio Department of Transportation Office of Research & Development Executive Summary Report Shear Strength of Clay and Silt Embankments Start Date: January 1, 2007 Duration: 2 Years- 10 Months Completion
Dynamic Pile Testing ASTM D4945
 Dynamic Pile Testing ASTM D4945 Pile Driving Analyzer Garland Likins, Pile Dynamics, Inc. 2011 PDCA Professor s Institute Why test driven piles? Public assured of safe foundation (bridges, buildings, etc.)
Type approval granted by the Finnish Ministry of the Environment
 RR Piling Manual 2 Type approval granted by the Finnish Ministry of the Environment 2..02. RR Piling Manual 1. General This manual deals with impact-driven RR piles. It is an abridgement of the RR Piling
RESEARCH PROJECT NO. 26
 RESEARCH PROJECT NO. 26 DETERMINATION OF POISSON'S RATIO IN AD1 TESTING BY UNIVERSITY OF MICHIGAN REPORT PREPARED BY BELA V. KOVACS and JOHN R. KEOUGH \ MEMBER / / DUCTILE IRON \ SOCIETY Issued by the
Excerpt from the Proceedings of the COMSOL Conference 2010 Boston
 Excerpt from the Proceedings of the COMSOL Conference 21 Boston Uncertainty Analysis, Verification and Validation of a Stress Concentration in a Cantilever Beam S. Kargar *, D.M. Bardot. University of
LRFD GEOTECHNICAL IMPLEMENTATION
 LRFD GEOTECHNICAL IMPLEMENTATION Ching-Nien Tsai, P.E. LADOTD Pavement and Geotechnical Services In Conjunction with LTRC WHY LRFD FHWA deadline - October 2007 LRFD is a better method Risk is quantified
The University of Texas at Austin
 r The University of Texas at Austin College of Engineering COEFFICIENT OF THERMAL EXPANSION FOR FOUR BATCH DESIGNS AND ONE SOLID GRANITE SPECIMEN by A Report Prepared for FOSTER YEOMAN LIMITED by the CENTER
Lecture 20. Measuring Pressure and Temperature (Chapter 9) Measuring Pressure Measuring Temperature MECH 373. Instrumentation and Measurements
 Measuring Pressure Measuring Temperature MECH 373. Instrumentation and Measurements") MECH 373 Instrumentation and Measurements Lecture 20 Measuring Pressure and Temperature (Chapter 9) Measuring Pressure Measuring Temperature 1 Measuring Acceleration and Vibration Accelerometers using
MECH 373 Instrumentation and Measurements Lecture 20 Measuring Pressure and Temperature (Chapter 9) Measuring Pressure Measuring Temperature 1 Measuring Acceleration and Vibration Accelerometers using
Drilled Shaft Foundations in Limestone. Dan Brown, P.E., Ph.D. Dan Brown and Associates
 Drilled Shaft Foundations in Limestone Dan Brown, P.E., Ph.D. Dan Brown and Associates Foundation Engineering How we teach our students Fundamental understanding of soil and rock behavior (good!) Focus
Discussion: behaviour of jacked and driven piles in sandy soil
 Title Discussion: behaviour of jacked and driven piles in sandy soil Author(s) Yang, J; Tham, LG; Lee, PKK; Chan, ST; Yu, F Citation Géotechnique, 27, v. 7 n., p. 47-478 Issued Date 27 URL http://hdl.handle.net/1722/7161
CHAPTER 6: ULTIMATE LIMIT STATE
 CHAPTER 6: ULTIMATE LIMIT STATE 6.1 GENERAL It shall be in accordance with JSCE Standard Specification (Design), 6.1. The collapse mechanism in statically indeterminate structures shall not be considered.
CPT Pore Water Pressure Correlations with PDA to Identify Pile Drivability Problem
 CPT Pore Water Pressure Correlations with PDA to Identify Pile Drivability Problem Fauzi Jarushi, Paul Cosentino, Edward Kalajian, Hadeel Dekhn Abstract At certain depths during large diameter displacement
Mechanics of Materials
 Mechanics of Materials Notation: a = acceleration = area (net = with holes, bearing = in contact, etc...) SD = allowable stress design d = diameter of a hole = calculus symbol for differentiation e = change
vulcanhammer.net This document downloaded from
 This document downloaded from vulcanhammer.net since 1997, your source for engineering information for the deep foundation and marine construction industries, and the historical site for Vulcan Iron Works
Chapter 6 Seismic Design of Bridges. Kazuhiko Kawashima Tokyo Institute of Technology
 Chapter 6 Seismic Design of Bridges Kazuhiko Kawashima okyo Institute of echnology Seismic Design Loading environment (dead, live, wind, earthquake etc) Performance criteria for gravity (deflection, stresses)
CHAPTER II EXPERIMENTAL INVESTIGATION
 CHAPTER II EXPERIMENTAL INVESTIGATION 2.1 SCOPE OF TESTING The objective of this research is to determine the force distribution between the column web and stiffener when the column flanges are subjected
Mechanics of Solids. Mechanics Of Solids. Suraj kr. Ray Department of Civil Engineering
 Mechanics Of Solids Suraj kr. Ray (surajjj2445@gmail.com) Department of Civil Engineering 1 Mechanics of Solids is a branch of applied mechanics that deals with the behaviour of solid bodies subjected
Summary and Review of Part II of the Symposium on Pile Foundations
 Summary and Review of Part II of the Symposium on Pile Foundations G. A. LEONARDS, Purdue University PILE FOUNDATIONS share with cellular cofferdams the distinction of yielding most reluctantly to the
UTC ETT160. Incorporation of Hands-on Experiments in an Introductory Structural Analysis Course
 Incorporation of Hands-on Experiments in an Introductory Structural Analysis Course By John J. Myers, Ph.D., P.E. Trevor Hrynyk Ashraf Ayoub, Ph.D., P.E. Abdeldjelil Belarbi, Ph.D., P.E. William Schonberg,
Mechanics of Materials Primer
 Mechanics of Materials rimer Notation: A = area (net = with holes, bearing = in contact, etc...) b = total width of material at a horizontal section d = diameter of a hole D = symbol for diameter E = modulus
Use of reciprocity calibrated accelerometer standards for performing routine laboratory comparison calibrations. Technical paper 226
 Use of reciprocity calibrated accelerometer standards for performing routine laboratory comparison calibrations Technical paper 6 Use of reciprocity calibrated accelerometer standards for performing routine
DYNAMIC ANALYSIS OF PILES IN SAND BASED ON SOIL-PILE INTERACTION
 October 1-17,, Beijing, China DYNAMIC ANALYSIS OF PILES IN SAND BASED ON SOIL-PILE INTERACTION Mohammad M. Ahmadi 1 and Mahdi Ehsani 1 Assistant Professor, Dept. of Civil Engineering, Geotechnical Group,
DETERMINATION OF EI FOR PULTRUDED GFRP SHEET PILE PANELS. Abstract
 DETERMINATION OF EI FOR PULTRUDED GFRP SHEET PILE PANELS Yixin Shao, Cynthia Giroux and Zeid Bdeir McGill University Montreal, Quebec, Canada Abstract The flexural rigidity, EI, plays an especially important
The subject of this paper is the development of a design
 The erformance and Design Checking of Chord-Angle Legs in Joist Girders THEODORE V. GALAMBOS ABSTRACT The subject of this paper is the development of a design checking method for the capacity of the outstanding
ROLLER BEARING FAILURES IN REDUCTION GEAR CAUSED BY INADEQUATE DAMPING BY ELASTIC COUPLINGS FOR LOW ORDER EXCITATIONS
 ROLLER BEARIG FAILURES I REDUCTIO GEAR CAUSED BY IADEQUATE DAMPIG BY ELASTIC COUPLIGS FOR LOW ORDER EXCITATIOS ~by Herbert Roeser, Trans Marine Propulsion Systems, Inc. Seattle Flexible couplings provide
Stress Strain Elasticity Modulus Young s Modulus Shear Modulus Bulk Modulus. Case study
 Stress Strain Elasticity Modulus Young s Modulus Shear Modulus Bulk Modulus Case study 2 In field of Physics, it explains how an object deforms under an applied force Real rigid bodies are elastic we can
Coating Requirements for Pipelines Installed by Horizontal Directional Drilling John D. Hair, P.E.*
 Coating Requirements for Pipelines Installed by Horizontal Directional Drilling John D. Hair, P.E.* *President, J. D. Hair & Associates, Inc., 2121 South Columbia Avenue, Suite 101, Tulsa, OK 74114-3502;
EVALUATION OF LOAD TESTS FOR DRIVEN PILES FOR THE ALABAMA DEPARTMENT OF TRANSPORTATION. Jacob Wayne Hill
 EVALUATION OF LOAD TESTS FOR DRIVEN PILES FOR THE ALABAMA DEPARTMENT OF TRANSPORTATION Except where reference is made to the work of others, the work described in this thesis is my own or was done in collaboration
ICSE Board Class IX Physics Paper 3 Solution
 ICSE Board Class IX Physics Paper 3 Solution Answer 1 (a) i. Minute ii. Hour iii. Day iv. Month SECTION I (b) 10 dyne =1 kg m/s 1 10 3 3 100 dyne = 100 kg m/s =10 kg m/s or 10 N Two simple aspects that
DISTRIBUTION CONDUCTOR STRINGING EQUIPMENT & TECHNIQUES
 DISTRIBUTION CONDUCTOR STRINGING EQUIPMENT & TECHNIQUES FOR THE 21 ST CENTURY PRESENTED AT: SOUTHWEST TRAINING EXPO FEBRUARY, 2000 PRESENTED BY: JOHN R. WHITT SR. VICE PRESIDENT 1 When the decision is
WIND TUNNEL TESTING GEOTECHNICAL STUDY
 WIND TUNNEL TESTING Wind tunnel testing was conducted by the Boundary Layer Wind Tunnel Laboratory (BLWTL) at the University of Western Ontario (UWO) to develop wind load time histories for the chimney.
Improvement of Low Strain Pile Integrity Test
 Improvement of Low Strain Pile Integrity Test Wenzhang Luo 1, Fan Chen 2, and Junling Hu 1 1 Deparment of Mechanical Engineering, University of Bridgeport, Bridgeport, CT 06604 2 National Center for Quality
Implementation of Pile Setup in the LRFD Design of Driven Piles in Louisiana
 Implementation of Pile Setup in the LRFD Design of Driven Piles in Louisiana Md. Nafiul Haque (Ph.D. Candidate) Murad Y. Abu-Farsakh, Ph.D., P.E. March 1, 2016 Louisiana Transportation Conference OUTLINE
PILE SETUP LA-1 EXPERIENCE. Ching-Nien Tsai, P.E.
 PILE SETUP LA-1 EXPERIENCE Ching-Nien Tsai, P.E. Bayou Lafourche Mississippi River GEOTECHNICAL INVESTIGATION PROGRAM 102 CPT soundings Depths from 100 feet to 200 feet 118 borings Depths from
APPENDIX A - COMPUTER PROGRAM INPUT DATA. NCARDS = Total number of identification cards to be read, including Card 1 (Maximum of 8 cards).
.") APPENDIX A - COMPUTER PROGRAM INPUT DATA Introduction The following section lists the required information necessary to perform an analysis using the wave equation computer program. A detailed discussion
APPENDIX A - COMPUTER PROGRAM INPUT DATA Introduction The following section lists the required information necessary to perform an analysis using the wave equation computer program. A detailed discussion