Multivariate Data Analysis with TMVA
|
|
|
- Aron Daniel
- 6 years ago
- Views:
Transcription

1 Multivariate Data Analysis with TMVA Andreas Hoecker ( * ) (CERN) Statistical Tools Workshop, DESY, Germany, June 19, 2008 ( * ) On behalf of the present core team: A. Hoecker, P. Speckmayer, J. Stelzer, H. Voss And the contributors: A. Christov, Or Cohen, Kamil Kraszewski, Krzysztof Danielowski, S. Henrot-Versillé, M. Jachowski, A. Krasznahorkay Jr., Maciej Kruk, Y. Mahalalel, R. Ospanov, X. Prudent, A. Robert, F. Tegenfeldt, K. Voss, M. Wolter, A. Zemla See acknowledgments on page 43 On the web: (home), (tutorial)


2 Event Classification Suppose data sample with two types of events: H 0, H 1 We have found discriminating input variables x 1, x 2, What decision boundary should we use to select events of type H 1? Rectangular cuts? A linear boundary? A nonlinear one? x 2 H 1 H 1 x 2 x 2 H 1 H 0 H 0 H 0 x 1 x 1 x 1 How can we decide this in an optimal way? Let the machine learn it! 2
 multi-variable input information in a single scalar output")
 0, y(h 1 ) 1 MV regression is also interesting!")
3 Multivariate Event Classification All multivariate classifiers have in common to condense (correlated) multi-variable input information in a single scalar output variable It is a R n R regression problem; classification is in fact a discretised regression y(h 0 ) 0, y(h 1 ) 1 MV regression is also interesting! In work for TMVA! 3
4 T M V A 4
5 What is TMVA ROOT: is the analysis framework used by most (HEP)-physicists Idea: rather than just implementing new MVA techniques and making them available in ROOT (i.e., like TMulitLayerPercetron does): Have one common platform / interface for all MVA classifiers Have common data pre-processing capabilities Train and test all classifiers on same data sample and evaluate consistently Provide common analysis (ROOT scripts) and application framework Provide access with and without ROOT, through macros, C++ executables or python Outline of this talk The TMVA project Quick survey of available classifiers and processing steps Evaluation tools 5

6 TMVA Development and Distribution TMVA is a sourceforge (SF) package for world-wide access Home page. SF project page. View CVS Mailing list... Tutorial TWiki. Active project fast response time on feature requests Currently 4 core developers, and 16 active contributors >2400 downloads since March 2006 (not accounting cvs checkouts and ROOT users) Written in C++, relying on core ROOT functionality Integrated and distributed with ROOT since ROOT v5.11/03 6
7 T h e T M V A C l a s s i f i e r s Currently implemented classifiers : Rectangular cut optimisation Projective and multidimensional likelihood estimator k-nearest Neighbor algorithm Fisher and H-Matrix discriminants Function discriminant Artificial neural networks (3 multilayer perceptron implementations) Boosted/bagged decision trees with automatic node pruning RuleFit Support Vector Machine Currently implemented data preprocessing stages: Decorrelation Principal Value Decomposition Transformation to uniform and Gaussian distributions (coming soon) 7


8 Data Preprocessing: Decorrelation Commonly realised for all methods in TMVA (centrally in DataSet class) Removal of linear correlations by rotating input variables using the square-root of the correlation matrix using the Principal Component Analysis Note that decorrelation is only complete, if Correlations are linear Input variables are Gaussian distributed Not very accurate conjecture in general original original SQRT SQRT derorr. derorr. PCA PCA derorr. derorr. 8
 { } ( i ) { variables} (")


9 Rectangular Cut Optimisation Simplest method: cut in rectangular variable volume ( ) { } ( i ) { variables} ( v event xv,min v,max ) xcut ievent 0,1 = x, x v Technical challenge: how to find optimal cuts? MINUIT fails due to non-unique solution space TMVA uses: Monte Carlo sampling, Genetic Algorithm, Simulated Annealing Huge speed improvement of volume search by sorting events in binary tree Cuts usually benefit from prior decorrelation of cut variables 9
10 Projective Likelihood Estimator (PDE Approach) Much liked in HEP: probability density estimators for each input variable combined in likelihood estimator Likelihood ratio for event i event y L ( i ) event = U k { species} PDFs { variables} k p signal k { variables} ( x ( i )) p U k k event ( x ( i )) k discriminating variables event Species: signal, background types PDE introduces fuzzy logic Ignores correlations between input variables Optimal approach if correlations are zero (or linear decorrelation) Otherwise: significant performance loss 10

11 PDE Approach: Estimating PDF Kernels Technical challenge: how to estimate the PDF shapes 3 ways: parametric fitting (function) nonparametric fitting event counting Difficult to automate for arbitrary PDFs Easy to automate, can create artefacts/suppress information Automatic, unbiased, but suboptimal We have chosen to implement nonparametric fitting in TMVA Binned shape interpolation using spline functions and adaptive smoothing Unbinned adaptive kernel density estimation (KDE) with Gaussian smearing TMVA performs automatic validation of goodness-of-fit original distribution is Gaussian 11
12 Multidimensional PDE Approach Use a single PDF per event class (sig, bkg), which spans N var dimensions PDE Range-Search: count number of signal and background events in vicinity of test event preset or adaptive volume defines vicinity Carli-Koblitz, NIM A501, 576 (2003) x 2 H 1 H 0 x 1 12
13 Multidimensional PDE Approach Use a single PDF per event class (sig, bkg), which spans N var dimensions PDE Range-Search: count number of signal and background events in vicinity of test event preset or adaptive volume defines vicinity Carli-Koblitz, NIM A501, 576 (2003) x 2 ( ) y i V PDERS event, 0.86 H 1 test event H 0 x 1 Improve y PDERS estimate within V by using various N var -D kernel estimators Enhance speed of event counting in volume by binary tree search 13
14 Multidimensional PDE Approach k-nearest Neighbor Better than searching within a volume (fixed or floating), count adjacent reference events till statistically significant number reached Method intrinsically adaptive Very fast search with kd-tree event sorting 14
15 Fisher s Linear Discriminant Analysis (LDA) Well known, simple and elegant classifier LDA determines axis in the input variable hyperspace such that a projection of events onto this axis pushes signal and background as far away from each other as possible x 2 x 2 x 2 H 1 H H 0 0 H1 H H11 Classifier response couldn t be simpler: ( i ) ( i ) Fi event 0 k y = F + x F { variables} k event k Fisher coefficients x 1 x 1 Compute Fisher coefficients from signal and background covariance matrices Fisher requires distinct sample means between signal and background Optimal classifier for linearly correlated Gaussian-distributed variables 15
16 Fisher s Linear Discriminant Analysis (LDA) Function discriminant analysis (FDA) Fit any user-defined function of input variables requiring that signal events return 1 and background 0 Parameter fitting: Genetics Alg., MINUIT, MC and combinations Easy reproduction of Fisher result, but can add nonlinearities Very transparent discriminator 16
17 Nonlinear Analysis: Artificial Neural Networks Achieve nonlinear classifier response by activating output nodes using nonlinear weights Feed-forward Multilayer Perceptron N var discriminating input variables 1 input layer k hidden layers 1 ouput layer 1. i... N (0) x i = 1.. Nvar w 11 w 1j w ij 1. j. M M k x w w x ( k 1) x + 1,2 M k 1 ( k) ( k) ( k) ( k 1) j = A 0 j + ij i i = 1 2 output classes (signal and background) with: ( Activation function) Ax ( ) = 1+ x ( e ) 1 Weight adjustment using analytical back-propagation Three different implementations in TMVA (all are Multilayer Perceptrons) TMlpANN: Interface to ROOT s MLP implementation MLP: TMVA s own MLP implementation for increased speed and flexibility CFMlpANN: ALEPH s Higgs search ANN, translated from FORTRAN 17
 classify an event as signal or background")
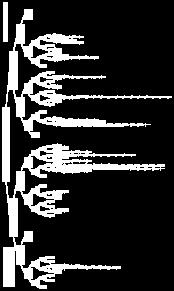
18 Decision Trees Sequential application of cuts splits the data into nodes, where the final nodes (leafs) classify an event as signal or background 18


 Continue")

19 Decision Trees Sequential application of cuts splits the data into nodes, where the final nodes (leafs) classify an event as signal or background Growing a decision tree: Start with Root node Split training sample according to cut on best variable at this node Splitting criterion: e.g., maximum Gini-index : purity (1 purity) Continue splitting until min. number of events or max. purity reached Classify leaf node according to majority of events, or give weight; unknown test events are classified accordingly 19

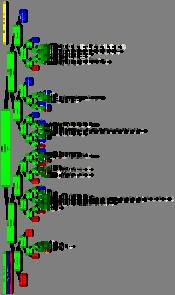
20 Decision Trees Sequential application of cuts splits the data into nodes, where the final nodes (leafs) classify an event as signal or background Decision tree before pruning Decision tree after pruning Bottom-up pruning of a decision tree Remove statistically insignificant nodes to reduce tree overtraining 20
 deteriorate performance) Shortcomings: Instability: small changes in training sample can dramatically alter the tree structure Sensitivity to")
21 Boosted Decision Trees (BDT) Data mining with decision trees is popular in science (so far mostly outside of HEP) Advantages: Independent of monotonous variable transformations, immune against outliers Weak variables are ignored (and don t (much) deteriorate performance) Shortcomings: Instability: small changes in training sample can dramatically alter the tree structure Sensitivity to overtraining ( requires pruning) Boosted decision trees: combine forest of decision trees, with differently weighted events in each tree (trees can also be weighted), by majority vote e.g., AdaBoost : incorrectly classified events receive larger weight in next decision tree Bagging (instead of boosting): random event weights, resampling with replacement Boosting or bagging are means to create set of basis functions : the final classifier is linear combination (expansion) of these functions improves stability! 21
 normalised discriminating event")

22 Predictive Learning via Rule Ensembles (RuleFit) Following RuleFit approach by Friedman-Popescu Friedman-Popescu, Tech Rep, Stat. Dpt, Stanford U., 2003 Model is linear combination of rules, where a rule is a sequence of cuts RuleFit classifier rules (cut sequence r m =1 if all cuts satisfied, =0 otherwise) normalised discriminating event variables nr y x = a + r x + b xˆ MR ( ) a ( ˆ) RF 0 m m k k m= 1 k= 1 Sum of rules Linear Fisher term The problem to solve is Create rule ensemble: use forest of decision trees Fit coefficients a m, b k : gradient direct regularization minimising Risk (Friedman et al.) Pruning removes topologically equal rules (same variables in cut sequence) One of the elementary cellular automaton rules (Wolfram 1983, 2002). It specifies the next color in a cell, depending on its color and its immediate neighbors. Its rule outcomes are encoded in the binary representation 30=
23 Support Vector Machine (SVM) Linear case: find hyperplane that best separates signal from background x 2 support vectors Best separation: maximum distance (margin) between closest events (support) to hyperplane Linear decision boundary If data non-separable add misclassification cost parameter to minimisation function Separable data optimal hyperplane margin x 1 Non-linear cases: Transform variables into higher dim. space where a linear boundary can fully separate the data Explicit transformation not required: use kernel functions to approximate scalar products between transformed vectors in the higher dim. space Choose Kernel and fit the hyperplane using the techniques developed for linear case Non-separable data x 3 φ(x 1,x 2 ) x 2 x 1 x 1 23


24 U s i n g T M V A A typical TMVA analysis consists of two main steps: 1. Training phase: training, testing and evaluation of classifiers using data samples with known signal and background composition 2. Application phase: using selected trained classifiers to classify unknown data samples Illustration of these steps with toy data samples T MVA tutorial 24


25 Code Flow for Training and Application Phases T MVA tutorial 25


26 Code Flow for Training and Application Phases Can Can be be ROOT ROOT scripts, scripts, C++ C++ executables executables or or python python scripts scripts (via (via PyROOT), PyROOT), or or any any other other high-level high-level language language that that interfaces interfaces with with ROOT ROOT T MVA tutorial 26
27 A Simple Example for Training void TMVAnalysis( ) { TFile* outputfile = TFile::Open( "TMVA.root", "RECREATE" ); TMVA::Factory *factory = new TMVA::Factory( "MVAnalysis", outputfile,"!v"); create Factory TFile *input = TFile::Open("tmva_example.root"); factory->addsignaltree ( (TTree*)input->Get("TreeS"), 1.0 ); factory->addbackgroundtree ( (TTree*)input->Get("TreeB"), 1.0 ); factory->addvariable("var1+var2", 'F'); factory->addvariable("var1-var2", 'F'); factory->addvariable("var3", 'F'); factory->addvariable("var4", 'F'); give training/test trees register input variables factory->preparetrainingandtesttree("", "NSigTrain=3000:NBkgTrain=3000:SplitMode=Random:!V" ); factory->bookmethod( TMVA::Types::kLikelihood, "Likelihood", "!V:!TransformOutput:Spline=2:NSmooth=5:NAvEvtPerBin=50" ); factory->bookmethod( TMVA::Types::kMLP, "MLP", "!V:NCycles=200:HiddenLayers=N+1,N:TestRate=5" ); select MVA methods } factory->trainallmethods(); factory->testallmethods(); factory->evaluateallmethods(); outputfile->close(); delete factory; train, test and evaluate T MVA tutorial 27
28 A Simple Example for an Application void TMVApplication( ) { TMVA::Reader *reader = new TMVA::Reader("!Color"); Float_t var1, var2, var3, var4; reader->addvariable( "var1+var2", &var1 ); reader->addvariable( "var1-var2", &var2 ); reader->addvariable( "var3", &var3 ); reader->addvariable( "var4", &var4 ); reader->bookmva( "MLP classifier", "weights/mvanalysis_mlp.weights.txt" ); TFile *input = TFile::Open("tmva_example.root"); TTree* thetree = (TTree*)input->Get("TreeS"); // set branch addresses for user TTree for (Long64_t ievt=3000; ievt<thetree->getentries();ievt++) { thetree->getentry(ievt); var1 = uservar1 + uservar2; var2 = uservar1 - uservar2; var3 = uservar3; var4 = uservar4; Double_t out = reader->evaluatemva( "MLP classifier" ); // do something with it } delete reader; } create Reader register the variables book classifier(s) prepare event loop compute input variables calculate classifier output T MVA tutorial 28
29 Data Preparation Data input format: ROOT TTree or ASCII Supports selection of any subset or combination or function of available variables Supports application of pre-selection cuts (possibly independent for signal and bkg) Supports global event weights for signal or background input files Supports use of any input variable as individual event weight Supports various methods for splitting into training and test samples: Block wise Randomly Periodically (i.e. periodically 3 testing ev., 2 training ev., 3 testing ev, 2 training ev..) User defined training and test trees Preprocessing of input variables (e.g., decorrelation) 29
 for test and training samples (spot overtraining) Classifier Rarity")
30 MVA Evaluation Framework TMVA is not only a collection of classifiers, but an MVA framework After training, TMVA provides ROOT evaluation scripts (through GUI) Plot all signal (S) and background (B) input variables with and without pre-processing Correlation scatters and linear coefficients for S & B Classifier outputs (S & B) for test and training samples (spot overtraining) Classifier Rarity distribution Classifier significance with optimal cuts B rejection versus S efficiency Classifier-specific plots: Likelihood reference distributions Classifier PDFs (for probability output and Rarity) Network architecture, weights and convergence Rule Fitting analysis plots Visualise decision trees 30


31 Evaluating the Classifier Training (I) Projective likelihood PDFs, MLP training, BDTs, average no. of nodes before/after pruning: 4193 /


32 Evaluating the Classifier Training (II) Classifier output distributions for test and training samples 32


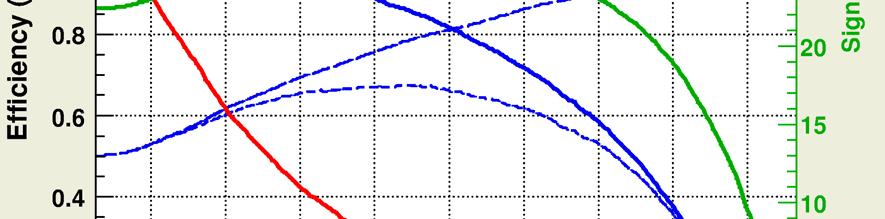

33 Evaluating the Classifier Training (III) Optimal cut for each classifiers Determine the optimal cut (working point) on a classifier output 33

 = yy ˆ( )")


34 Evaluating the Classifier Training (IV) Background rejection versus signal efficiencies Best plot to compare classifier performance y Ry ( ) = yy ˆ( ) dy If background in data non-uniform problem in training sample An elegant variable is the Rarity: transforms to uniform background. Height of signal peak direct measure of classifier performance 34
35 Evaluating the Classifiers (taken from TMVA output ) Input Variable Ranking Better variable --- Fisher : Ranking result (top variable is best ranked) --- Fisher : Fisher : Rank : Variable : Discr. power --- Fisher : Fisher : 1 : var4 : 2.175e Fisher : 2 : var3 : 1.718e Fisher : 3 : var1 : 9.549e Fisher : 4 : var2 : 2.841e Fisher : How discriminating is a variable? Classifier correlation and overlap --- Factory : Inter-MVA overlap matrix (signal): --- Factory : Factory : Likelihood Fisher --- Factory : Likelihood: Factory : Fisher: Factory : Do classifiers select the same events as signal and background? If not, there is something to gain! 35
36 Evaluating the Classifiers (taken from TMVA output ) Better classifier Check for overtraining Evaluation results ranked by best signal efficiency and purity (area) MVA Signal efficiency at bkg eff. (error): Sepa- @B=0.30 Area ration: cance: Fisher : 0.268(03) 0.653(03) 0.873(02) MLP : 0.266(03) 0.656(03) 0.873(02) LikelihoodD : 0.259(03) 0.649(03) 0.871(02) PDERS : 0.223(03) 0.628(03) 0.861(02) RuleFit : 0.196(03) 0.607(03) 0.845(02) HMatrix : 0.058(01) 0.622(03) 0.868(02) BDT : 0.154(02) 0.594(04) 0.838(03) CutsGA : 0.109(02) 1.000(00) 0.717(03) Likelihood : 0.086(02) 0.387(03) 0.677(03) Testing efficiency compared to training efficiency (overtraining check) MVA Signal efficiency: from test sample (from traing @B= Fisher : (0.275) (0.658) (0.873) MLP : (0.278) (0.658) (0.873) LikelihoodD : (0.273) (0.657) (0.872) PDERS : (0.389) (0.691) (0.881) RuleFit : (0.198) (0.616) (0.848) HMatrix : (0.060) (0.623) (0.868) BDT : (0.268) (0.736) (0.911) CutsGA : (0.123) (0.424) (0.715) Likelihood : (0.092) (0.379) (0.677)
37 Evaluating the Classifiers (taken from TMVA output ) Better classifier Check for overtraining Evaluation results ranked by best signal efficiency and purity (area) MVA Signal efficiency at bkg eff. (error): Sepa- @B=0.30 Area ration: cance: Fisher : 0.268(03) 0.653(03) 0.873(02) MLP : 0.266(03) 0.656(03) 0.873(02) LikelihoodD : 0.259(03) 0.649(03) 0.871(02) PDERS : 0.223(03) 0.628(03) 0.861(02) RuleFit : 0.196(03) 0.607(03) 0.845(02) HMatrix : 0.058(01) 0.622(03) 0.868(02) BDT : 0.154(02) 0.594(04) 0.838(03) CutsGA : 0.109(02) 1.000(00) 0.717(03) Likelihood : 0.086(02) 0.387(03) 0.677(03) Testing efficiency compared to training efficiency (overtraining check) MVA Signal efficiency: from test sample (from traing @B= Fisher : (0.275) (0.658) (0.873) MLP : (0.278) (0.658) (0.873) LikelihoodD : (0.273) (0.657) (0.872) PDERS : (0.389) (0.691) (0.881) RuleFit : (0.198) (0.616) (0.848) HMatrix : (0.060) (0.623) (0.868) BDT : (0.268) (0.736) (0.911) CutsGA : (0.123) (0.424) (0.715) Likelihood : (0.092) (0.379) (0.677)


38 The Schachbrett Toy 38
39 The Schachbrett Toy Performance achieved without parameter tuning: PDERS and BDT best out of the box classifiers After specific tuning, also SVM und MLP perform well Theoretical maximum A. Hoecker: Multivariate Multivariate Data Analysis Analysiswith withtmva TMVA Top Workshop, DESY, June 19,LPSC, 2008 Oct 18 20, 2007 A. Hoecker 39


40 S u m m a r y & P l a n s 40
41 Summary of the Classifiers and their Properties Classifiers Criteria Cuts Likelihood PDERS / k-nn H-Matrix Fisher MLP BDT RuleFit SVM Performance no / linear correlations nonlinear correlations Speed Training Response / Robust -ness Overtraining Weak input variables Curse of dimensionality Transparency The properties of the Function discriminant (FDA) depend on the chosen function 41
42 O u t l o o k Primary development from last Summer: Generalised classifiers Combine any classifier with any other classifier using any combination of input variables in any phase space region Be able to boost or bag any classifier Categorisation: use any combination of input variables and classifiers in any phase space region Code is ready now in testing mode. Dispatched soon hopefully... regression This summer: Extend TMVA to multivariate Backup slides on: (i) more toy examples (ii) treatment of systematic uncertainties (iii) sensitivity to weak input variables 42

43 a d v e r t i s e m e n t We have a Users Guide! Available on TMVA Users Guide 97pp, incl. code examples arxiv physics/ Top DESY, Workshop, June 19, LPSC, 2008 Oct 18 20, 2007 A. Hoecker A. Hoecker: Multivariate Multivariate Data Analysis with TMVA 43
 Also frequently used: StatPatternRecognition package by I.")
44 C o p y r i g h t s & C r e d i t s TMVA is open source software Use & redistribution of source permitted according to terms in BSD license Several similar data mining efforts with rising importance in most fields of science and industry Important for HEP: Parallelised MVA training and evaluation pioneered by Cornelius package (BABAR) Also frequently used: StatPatternRecognition package by I. Narsky Many implementations of individual classifiers exist Acknowledgments: The fast development of TMVA would not have been possible without the contribution and feedback from many developers and users to whom we are indebted. We thank in particular the CERN Summer students Matt Jachowski (Stanford) for the implementation of TMVA's new MLP neural network, Yair Mahalalel (Tel Aviv) and three genius Krakow mathematics students for significant improvements of PDERS, the Krakow student Andrzej Zemla and his supervisor Marcin Wolter for programming a powerful Support Vector Machine, as well as Rustem Ospanov for the development of a fast k-nn algorithm. We are grateful to Doug Applegate, Kregg Arms, René Brun and the ROOT team, Tancredi Carli, Zhiyi Liu, Elzbieta Richter-Was, Vincent Tisserand and Alexei Volk for helpful conversations. Top DESY, Workshop, June 19, LPSC, 2008 Oct 18 20, 2007 A. Hoecker A. Hoecker: Multivariate Multivariate Data Analysis with TMVA 44
45 M o r e T o y E x a m p l e s Top DESY, Workshop, June 19, LPSC, 2008 Oct 18 20, 2007 A. Hoecker A. Hoecker: Multivariate Multivariate Data Analysis with TMVA 45

 Circular correlations (same for signal and")

46 More Toys: Linear-, Cross-, Circular Correlations Illustrate the behaviour of linear and nonlinear classifiers Linear correlations (same for signal and background) Linear correlations (opposite for signal and background) Circular correlations (same for signal and background) Top DESY, Workshop, June 19, LPSC, 2008 Oct 18 20, 2007 A. Hoecker A. Hoecker: Multivariate Multivariate Data Analysis with TMVA 46
47 How does linear decorrelation affect strongly nonlinear cases? Original correlations Top DESY, Workshop, June 19, LPSC, 2008 Oct 18 20, 2007 A. Hoecker A. Hoecker: Multivariate Multivariate Data Analysis with TMVA 47
48 How does linear decorrelation affect strongly nonlinear cases? Original correlations SQRT decorrelation Top DESY, Workshop, June 19, LPSC, 2008 Oct 18 20, 2007 A. Hoecker A. Hoecker: Multivariate Multivariate Data Analysis with TMVA 48
49 Weight Variables by Classifier Output How well do the classifier resolve the various correlation patterns? Linear correlations (same for signal and background) Cross-linear correlations (opposite for signal and background) Circular correlations (same for signal and background) Likelihood Top DESY, Workshop, June 19, LPSC, 2008 Oct 18 20, 2007 A. Hoecker A. Hoecker: Multivariate Multivariate Data Analysis with TMVA 49
50 Weight Variables by Classifier Output How well do the classifier resolve the various correlation patterns? Linear correlations (same for signal and background) Cross-linear correlations (opposite for signal and background) Circular correlations (same for signal and background) Likelihood - D Top DESY, Workshop, June 19, LPSC, 2008 Oct 18 20, 2007 A. Hoecker A. Hoecker: Multivariate Multivariate Data Analysis with TMVA 50
51 Weight Variables by Classifier Output How well do the classifier resolve the various correlation patterns? Linear correlations (same for signal and background) Cross-linear correlations (opposite for signal and background) Circular correlations (same for signal and background) Likelihood PDERS- D Top DESY, Workshop, June 19, LPSC, 2008 Oct 18 20, 2007 A. Hoecker A. Hoecker: Multivariate Multivariate Data Analysis with TMVA 51
52 Weight Variables by Classifier Output How well do the classifier resolve the various correlation patterns? Linear correlations (same for signal and background) Cross-linear correlations (opposite for signal and background) Circular correlations (same for signal and background) Likelihood PDERS Fisher - D Top DESY, Workshop, June 19, LPSC, 2008 Oct 18 20, 2007 A. Hoecker A. Hoecker: Multivariate Multivariate Data Analysis with TMVA 52
53 Weight Variables by Classifier Output How well do the classifier resolve the various correlation patterns? Linear correlations (same for signal and background) Cross-linear correlations (opposite for signal and background) Circular correlations (same for signal and background) Likelihood PDERS Fisher MLP - D Top DESY, Workshop, June 19, LPSC, 2008 Oct 18 20, 2007 A. Hoecker A. Hoecker: Multivariate Multivariate Data Analysis with TMVA 53
54 Weight Variables by Classifier Output How well do the classifier resolve the various correlation patterns? Linear correlations (same for signal and background) Cross-linear correlations (opposite for signal and background) Circular correlations (same for signal and background) Likelihood PDERS Fisher MLP BDT - D Top DESY, Workshop, June 19, LPSC, 2008 Oct 18 20, 2007 A. Hoecker A. Hoecker: Multivariate Multivariate Data Analysis with TMVA 54
55 Final Classifier Performance Background rejection versus signal efficiency curve: Linear Cross Circular Example Top DESY, Workshop, June 19, LPSC, 2008 Oct 18 20, 2007 A. Hoecker A. Hoecker: Multivariate Multivariate Data Analysis with TMVA 55
56 Final Classifier Performance Background rejection versus signal efficiency curve: Linear Cross Circular Example Top DESY, Workshop, June 19, LPSC, 2008 Oct 18 20, 2007 A. Hoecker A. Hoecker: Multivariate Multivariate Data Analysis with TMVA 56
57 Final Classifier Performance Background rejection versus signal efficiency curve: Linear Cross Circular Example Top DESY, Workshop, June 19, LPSC, 2008 Oct 18 20, 2007 A. Hoecker A. Hoecker: Multivariate Multivariate Data Analysis with TMVA 57
58 S o m e w o r d s o n s y s t e m a t i c s Top DESY, Workshop, June 19, LPSC, 2008 Oct 18 20, 2007 A. Hoecker A. Hoecker: Multivariate Multivariate Data Analysis with TMVA 58
59 Treatment of Systematic Uncertainties Assume strongest variable var4 suffers from systematic uncertainty Top DESY, Workshop, June 19, LPSC, 2008 Oct 18 20, 2007 A. Hoecker A. Hoecker: Multivariate Multivariate Data Analysis with TMVA 59


60 Treatment of Systematic Uncertainties Assume strongest variable var4 suffers from systematic uncertainty Calibration uncertainty may shift the central value and hence worsen the discrimination power of var4 Top DESY, Workshop, June 19, LPSC, 2008 Oct 18 20, 2007 A. Hoecker A. Hoecker: Multivariate Multivariate Data Analysis with TMVA 60
61 Treatment of Systematic Uncertainties Assume strongest variable var4 suffers from systematic uncertainty (at least) Two ways to deal with it: 1. Ignore the systematic in the training, and evaluate systematic error on classifier output Drawbacks: var4 appears stronger in training than it might be suboptimal performance Classifier response will strongly depend on var4 2. Train with shifted (= weakened) var4, and evaluate systematic error on classifier output Cures previous drawbacks If classifier output distributions can be validated with data control samples, the second drawback is mitigated, but not the first one (the performance loss)! Top DESY, Workshop, June 19, LPSC, 2008 Oct 18 20, 2007 A. Hoecker A. Hoecker: Multivariate Multivariate Data Analysis with TMVA 61


62 Treatment of Systematic Uncertainties Classifier Classifier output output distributions distributions for for signal signal only only 1 st Way Top DESY, Workshop, June 19, LPSC, 2008 Oct 18 20, 2007 A. Hoecker A. Hoecker: Multivariate Multivariate Data Analysis with TMVA 62


63 Treatment of Systematic Uncertainties Classifier Classifier output output distributions distributions for for signal signal only only 2 nd Way Top DESY, Workshop, June 19, LPSC, 2008 Oct 18 20, 2007 A. Hoecker A. Hoecker: Multivariate Multivariate Data Analysis with TMVA 63
64 Stability with Respect to Irrelevant Variables Toy example with 2 discriminating and 4 non-discriminating variables? A. Hoecker: Multivariate Multivariate Data Analysis Analysiswith withtmva TMVA Top Workshop, DESY, June 19,LPSC, 2008 Oct 18 20, 2007 A. Hoecker 64
65 Stability with Respect to Irrelevant Variables Toy example with 2 discriminating and 4 non-discriminating variables? use use only only two two discriminant discriminant variables variables in in classifiers classifiers Top DESY, Workshop, June 19, LPSC, 2008 Oct 18 20, 2007 A. Hoecker A. Hoecker: Multivariate Multivariate Data Analysis with TMVA 65
66 Stability with Respect to Irrelevant Variables Toy example with 2 discriminating and 4 non-discriminating variables? use use all all discriminant discriminant variables variables in in classifiers classifiers Top DESY, Workshop, June 19, LPSC, 2008 Oct 18 20, 2007 A. Hoecker A. Hoecker: Multivariate Multivariate Data Analysis with TMVA 66
HEP Data Mining with TMVA
 HEP Data Mining with TMVA ToolKit for Multivariate Analysis with ROOT Andreas Hoecker ( * ) (CERN) Seminar, IFJ Krakow, Feb 27, 2007 ( * ) on behalf of J. Stelzer, F. Tegenfeldt, H.+K. Voss, and many other
Multivariate Data Analysis Techniques
 Multivariate Data Analysis Techniques Andreas Hoecker (CERN) Workshop on Statistics, Karlsruhe, Germany, Oct 12 14, 2009 O u t l i n e Introduction to multivariate classification and regression Multivariate
The Toolkit for Multivariate Data Analysis, TMVA 4
 7th International Conference on Computing in High Energy and Nuclear Physics (CHEP9) IOP Publishing Journal of Physics: Conference Series 29 (2) 3257 doi:.88/742-6596/29/3/3257 The Toolkit for Multivariate
Multivariate Analysis, TMVA, and Artificial Neural Networks
 http://tmva.sourceforge.net/ Multivariate Analysis, TMVA, and Artificial Neural Networks Matt Jachowski jachowski@stanford.edu 1 Multivariate Analysis Techniques dedicated to analysis of data with multiple
Multivariate statistical methods and data mining in particle physics
 Multivariate statistical methods and data mining in particle physics RHUL Physics www.pp.rhul.ac.uk/~cowan Academic Training Lectures CERN 16 19 June, 2008 1 Outline Statement of the problem Some general
Machine learning approaches to the Higgs boson self coupling
 Machine learning approaches to the Higgs boson self coupling 6 JUNE ICHEP 2018 @ COEX SEOUL JUBIN PARK (CHONNAM NATIONAL UNIVERSITY) COLLABORATED WITH JUNG CHANG, KINGMAN CHEUNG, JAE SIK LEE, CHIH-TING
Multivariate Methods in Statistical Data Analysis
 Multivariate Methods in Statistical Data Analysis Web-Site: http://tmva.sourceforge.net/ See also: "TMVA - Toolkit for Multivariate Data Analysis, A. Hoecker, P. Speckmayer, J. Stelzer, J. Therhaag, E.
Applied Statistics. Multivariate Analysis - part II. Troels C. Petersen (NBI) Statistics is merely a quantization of common sense 1
 Statistics is merely a quantization of common sense 1") Applied Statistics Multivariate Analysis - part II Troels C. Petersen (NBI) Statistics is merely a quantization of common sense 1 Fisher Discriminant You want to separate two types/classes (A and B) of
Applied Statistics Multivariate Analysis - part II Troels C. Petersen (NBI) Statistics is merely a quantization of common sense 1 Fisher Discriminant You want to separate two types/classes (A and B) of
Statistical Methods in Particle Physics
 Statistical Methods in Particle Physics 8. Multivariate Analysis Prof. Dr. Klaus Reygers (lectures) Dr. Sebastian Neubert (tutorials) Heidelberg University WS 2017/18 Multi-Variate Classification Consider
Multivariate Data Analysis and Machine Learning in High Energy Physics (III)
") Multivariate Data Analysis and Machine Learning in High Energy Physics (III) Helge Voss (MPI K, Heidelberg) Graduierten-Kolleg, Freiburg, 11.5-15.5, 2009 Outline Summary of last lecture 1-dimensional Likelihood:
Multivariate Data Analysis and Machine Learning in High Energy Physics (III) Helge Voss (MPI K, Heidelberg) Graduierten-Kolleg, Freiburg, 11.5-15.5, 2009 Outline Summary of last lecture 1-dimensional Likelihood:
StatPatternRecognition: A C++ Package for Multivariate Classification of HEP Data. Ilya Narsky, Caltech
 StatPatternRecognition: A C++ Package for Multivariate Classification of HEP Data Ilya Narsky, Caltech Motivation Introduction advanced classification tools in a convenient C++ package for HEP researchers
CSE 417T: Introduction to Machine Learning. Final Review. Henry Chai 12/4/18
 CSE 417T: Introduction to Machine Learning Final Review Henry Chai 12/4/18 Overfitting Overfitting is fitting the training data more than is warranted Fitting noise rather than signal 2 Estimating! "#$
Statistical Tools in Collider Experiments. Multivariate analysis in high energy physics
 Statistical Tools in Collider Experiments Multivariate analysis in high energy physics Pauli Lectures - 06/0/01 Nicolas Chanon - ETH Zürich 1 Main goals of these lessons - Have an understanding of what
Statistical Methods for Particle Physics Lecture 2: statistical tests, multivariate methods
 Statistical Methods for Particle Physics Lecture 2: statistical tests, multivariate methods www.pp.rhul.ac.uk/~cowan/stat_aachen.html Graduierten-Kolleg RWTH Aachen 10-14 February 2014 Glen Cowan Physics
Advanced statistical methods for data analysis Lecture 2
 Advanced statistical methods for data analysis Lecture 2 RHUL Physics www.pp.rhul.ac.uk/~cowan Universität Mainz Klausurtagung des GK Eichtheorien exp. Tests... Bullay/Mosel 15 17 September, 2008 1 Outline
Optimization of tau identification in ATLAS experiment using multivariate tools
 Optimization of tau identification in ATLAS experiment using multivariate tools Marcin Wolter a, Andrzej Zemła a,b a Institute of Nuclear Physics PAN, Kraków b Jagiellonian University, Kraków ACAT 2007,
Advanced statistical methods for data analysis Lecture 1
 Advanced statistical methods for data analysis Lecture 1 RHUL Physics www.pp.rhul.ac.uk/~cowan Universität Mainz Klausurtagung des GK Eichtheorien exp. Tests... Bullay/Mosel 15 17 September, 2008 1 Outline
Machine learning comes from Bayesian decision theory in statistics. There we want to minimize the expected value of the loss function.
 Bayesian learning: Machine learning comes from Bayesian decision theory in statistics. There we want to minimize the expected value of the loss function. Let y be the true label and y be the predicted
Multivariate statistical methods and data mining in particle physics Lecture 4 (19 June, 2008)
") Multivariate statistical methods and data mining in particle physics Lecture 4 (19 June, 2008) RHUL Physics www.pp.rhul.ac.uk/~cowan Academic Training Lectures CERN 16 19 June, 2008 1 Outline Statement
Multivariate statistical methods and data mining in particle physics Lecture 4 (19 June, 2008) RHUL Physics www.pp.rhul.ac.uk/~cowan Academic Training Lectures CERN 16 19 June, 2008 1 Outline Statement
Particle Identification at LHCb. IML Workshop. April 10, 2018
 Particle Identification at LHCb Miriam Lucio, on behalf of the LHCb Collaboration IML Workshop April 10, 2018 M. Lucio Particle Identification at LHCb April 10, 2018 1 Outline 1 Introduction 2 Neutral
Multivariate Analysis Techniques in HEP
 Multivariate Analysis Techniques in HEP Jan Therhaag IKTP Institutsseminar, Dresden, January 31 st 2013 Multivariate analysis in a nutshell Neural networks: Defeating the black box Boosted Decision Trees:
Lecture 2. G. Cowan Lectures on Statistical Data Analysis Lecture 2 page 1
 Lecture 2 1 Probability (90 min.) Definition, Bayes theorem, probability densities and their properties, catalogue of pdfs, Monte Carlo 2 Statistical tests (90 min.) general concepts, test statistics,
Advanced analysis and modelling tools for spatial environmental data. Case study: indoor radon data in Switzerland
 EnviroInfo 2004 (Geneva) Sh@ring EnviroInfo 2004 Advanced analysis and modelling tools for spatial environmental data. Case study: indoor radon data in Switzerland Mikhail Kanevski 1, Michel Maignan 1
Pattern Recognition and Machine Learning
 Christopher M. Bishop Pattern Recognition and Machine Learning ÖSpri inger Contents Preface Mathematical notation Contents vii xi xiii 1 Introduction 1 1.1 Example: Polynomial Curve Fitting 4 1.2 Probability
Statistical Methods for Particle Physics Tutorial on multivariate methods
 Statistical Methods for Particle Physics Tutorial on multivariate methods http://indico.ihep.ac.cn/event/4902/ istep 2015 Shandong University, Jinan August 11-19, 2015 Glen Cowan ( 谷林 科恩 ) Physics Department
Statistical Tools in Collider Experiments. Multivariate analysis in high energy physics
 Statistical Tools in Collider Experiments Multivariate analysis in high energy physics Lecture 3 Pauli Lectures - 08/02/2012 Nicolas Chanon - ETH Zürich 1 Outline 1.Introduction 2.Multivariate methods
Lecture 4 Discriminant Analysis, k-nearest Neighbors
 Lecture 4 Discriminant Analysis, k-nearest Neighbors Fredrik Lindsten Division of Systems and Control Department of Information Technology Uppsala University. Email: fredrik.lindsten@it.uu.se fredrik.lindsten@it.uu.se
Machine Learning 2017
 Machine Learning 2017 Volker Roth Department of Mathematics & Computer Science University of Basel 21st March 2017 Volker Roth (University of Basel) Machine Learning 2017 21st March 2017 1 / 41 Section
Statistical Methods for Particle Physics Lecture 2: multivariate methods
 Statistical Methods for Particle Physics Lecture 2: multivariate methods http://indico.ihep.ac.cn/event/4902/ istep 2015 Shandong University, Jinan August 11-19, 2015 Glen Cowan ( 谷林 科恩 ) Physics Department
Nonlinear Classification
 Nonlinear Classification INFO-4604, Applied Machine Learning University of Colorado Boulder October 5-10, 2017 Prof. Michael Paul Linear Classification Most classifiers we ve seen use linear functions
Hypothesis testing:power, test statistic CMS:
 Hypothesis testing:power, test statistic The more sensitive the test, the better it can discriminate between the null and the alternative hypothesis, quantitatively, maximal power In order to achieve this
Machine Learning Lecture 5
 Machine Learning Lecture 5 Linear Discriminant Functions 26.10.2017 Bastian Leibe RWTH Aachen http://www.vision.rwth-aachen.de leibe@vision.rwth-aachen.de Course Outline Fundamentals Bayes Decision Theory
Advanced Statistical Methods: Beyond Linear Regression
 Advanced Statistical Methods: Beyond Linear Regression John R. Stevens Utah State University Notes 3. Statistical Methods II Mathematics Educators Worshop 28 March 2009 1 http://www.stat.usu.edu/~jrstevens/pcmi
Course in Data Science
 Course in Data Science About the Course: In this course you will get an introduction to the main tools and ideas which are required for Data Scientist/Business Analyst/Data Analyst. The course gives an
NONLINEAR CLASSIFICATION AND REGRESSION. J. Elder CSE 4404/5327 Introduction to Machine Learning and Pattern Recognition
 NONLINEAR CLASSIFICATION AND REGRESSION Nonlinear Classification and Regression: Outline 2 Multi-Layer Perceptrons The Back-Propagation Learning Algorithm Generalized Linear Models Radial Basis Function
Engineering Part IIB: Module 4F10 Statistical Pattern Processing Lecture 5: Single Layer Perceptrons & Estimating Linear Classifiers
 Engineering Part IIB: Module 4F0 Statistical Pattern Processing Lecture 5: Single Layer Perceptrons & Estimating Linear Classifiers Phil Woodland: pcw@eng.cam.ac.uk Michaelmas 202 Engineering Part IIB:
Machine Learning Lecture 7
 Course Outline Machine Learning Lecture 7 Fundamentals (2 weeks) Bayes Decision Theory Probability Density Estimation Statistical Learning Theory 23.05.2016 Discriminative Approaches (5 weeks) Linear Discriminant
Statistical Data Analysis Stat 2: Monte Carlo Method, Statistical Tests
 Statistical Data Analysis Stat 2: Monte Carlo Method, Statistical Tests London Postgraduate Lectures on Particle Physics; University of London MSci course PH4515 Glen Cowan Physics Department Royal Holloway,
COMS 4771 Introduction to Machine Learning. Nakul Verma
 COMS 4771 Introduction to Machine Learning Nakul Verma Announcements HW1 due next lecture Project details are available decide on the group and topic by Thursday Last time Generative vs. Discriminative
Classification: The rest of the story
 U NIVERSITY OF ILLINOIS AT URBANA-CHAMPAIGN CS598 Machine Learning for Signal Processing Classification: The rest of the story 3 October 2017 Today s lecture Important things we haven t covered yet Fisher
Contents Lecture 4. Lecture 4 Linear Discriminant Analysis. Summary of Lecture 3 (II/II) Summary of Lecture 3 (I/II)
 Summary of Lecture 3 (I/II)") Contents Lecture Lecture Linear Discriminant Analysis Fredrik Lindsten Division of Systems and Control Department of Information Technology Uppsala University Email: fredriklindsten@ituuse Summary of lecture
Contents Lecture Lecture Linear Discriminant Analysis Fredrik Lindsten Division of Systems and Control Department of Information Technology Uppsala University Email: fredriklindsten@ituuse Summary of lecture
Mining Classification Knowledge
 Mining Classification Knowledge Remarks on NonSymbolic Methods JERZY STEFANOWSKI Institute of Computing Sciences, Poznań University of Technology COST Doctoral School, Troina 2008 Outline 1. Bayesian classification
Artificial Intelligence Roman Barták
 Artificial Intelligence Roman Barták Department of Theoretical Computer Science and Mathematical Logic Introduction We will describe agents that can improve their behavior through diligent study of their
Boosted Decision Trees and Applications
 EPJ Web of Conferences, 24 (23) DOI:./ epjconf/ 2324 C Owned by the authors, published by EDP Sciences, 23 Boosted Decision Trees and Applications Yann COADOU CPPM, Aix-Marseille UniversitNRS/IN2P3, Marseille,
Algorithm-Independent Learning Issues
 Algorithm-Independent Learning Issues Selim Aksoy Department of Computer Engineering Bilkent University saksoy@cs.bilkent.edu.tr CS 551, Spring 2007 c 2007, Selim Aksoy Introduction We have seen many learning
Learning from Examples
 Learning from Examples Data fitting Decision trees Cross validation Computational learning theory Linear classifiers Neural networks Nonparametric methods: nearest neighbor Support vector machines Ensemble
Midterm Review CS 6375: Machine Learning. Vibhav Gogate The University of Texas at Dallas
 Midterm Review CS 6375: Machine Learning Vibhav Gogate The University of Texas at Dallas Machine Learning Supervised Learning Unsupervised Learning Reinforcement Learning Parametric Y Continuous Non-parametric
EXAM IN STATISTICAL MACHINE LEARNING STATISTISK MASKININLÄRNING
 EXAM IN STATISTICAL MACHINE LEARNING STATISTISK MASKININLÄRNING DATE AND TIME: June 9, 2018, 09.00 14.00 RESPONSIBLE TEACHER: Andreas Svensson NUMBER OF PROBLEMS: 5 AIDING MATERIAL: Calculator, mathematical
Data Mining und Maschinelles Lernen
 Data Mining und Maschinelles Lernen Ensemble Methods Bias-Variance Trade-off Basic Idea of Ensembles Bagging Basic Algorithm Bagging with Costs Randomization Random Forests Boosting Stacking Error-Correcting
MIRA, SVM, k-nn. Lirong Xia
 MIRA, SVM, k-nn Lirong Xia Linear Classifiers (perceptrons) Inputs are feature values Each feature has a weight Sum is the activation activation w If the activation is: Positive: output +1 Negative, output
Last updated: Oct 22, 2012 LINEAR CLASSIFIERS. J. Elder CSE 4404/5327 Introduction to Machine Learning and Pattern Recognition
 Last updated: Oct 22, 2012 LINEAR CLASSIFIERS Problems 2 Please do Problem 8.3 in the textbook. We will discuss this in class. Classification: Problem Statement 3 In regression, we are modeling the relationship
STA 414/2104: Lecture 8
 STA 414/2104: Lecture 8 6-7 March 2017: Continuous Latent Variable Models, Neural networks With thanks to Russ Salakhutdinov, Jimmy Ba and others Outline Continuous latent variable models Background PCA
ECE662: Pattern Recognition and Decision Making Processes: HW TWO
 ECE662: Pattern Recognition and Decision Making Processes: HW TWO Purdue University Department of Electrical and Computer Engineering West Lafayette, INDIANA, USA Abstract. In this report experiments are
ARTIFICIAL NEURAL NETWORKS گروه مطالعاتي 17 بهار 92
 ARTIFICIAL NEURAL NETWORKS گروه مطالعاتي 17 بهار 92 BIOLOGICAL INSPIRATIONS Some numbers The human brain contains about 10 billion nerve cells (neurons) Each neuron is connected to the others through 10000
Holdout and Cross-Validation Methods Overfitting Avoidance
 Holdout and Cross-Validation Methods Overfitting Avoidance Decision Trees Reduce error pruning Cost-complexity pruning Neural Networks Early stopping Adjusting Regularizers via Cross-Validation Nearest
Statistical Pattern Recognition
 Statistical Pattern Recognition Feature Extraction Hamid R. Rabiee Jafar Muhammadi, Alireza Ghasemi, Payam Siyari Spring 2014 http://ce.sharif.edu/courses/92-93/2/ce725-2/ Agenda Dimensionality Reduction
Statistics for the LHC Lecture 1: Introduction
 Statistics for the LHC Lecture 1: Introduction Academic Training Lectures CERN, 14 17 June, 2010 indico.cern.ch/conferencedisplay.py?confid=77830 Glen Cowan Physics Department Royal Holloway, University
Chapter 14 Combining Models
 Chapter 14 Combining Models T-61.62 Special Course II: Pattern Recognition and Machine Learning Spring 27 Laboratory of Computer and Information Science TKK April 3th 27 Outline Independent Mixing Coefficients
Introduction to machine learning and pattern recognition Lecture 2 Coryn Bailer-Jones
 Introduction to machine learning and pattern recognition Lecture 2 Coryn Bailer-Jones http://www.mpia.de/homes/calj/mlpr_mpia2008.html 1 1 Last week... supervised and unsupervised methods need adaptive
Final Exam, Machine Learning, Spring 2009
 Name: Andrew ID: Final Exam, 10701 Machine Learning, Spring 2009 - The exam is open-book, open-notes, no electronics other than calculators. - The maximum possible score on this exam is 100. You have 3
Mining Classification Knowledge
 Mining Classification Knowledge Remarks on NonSymbolic Methods JERZY STEFANOWSKI Institute of Computing Sciences, Poznań University of Technology SE lecture revision 2013 Outline 1. Bayesian classification
Numerical Learning Algorithms
 Numerical Learning Algorithms Example SVM for Separable Examples.......................... Example SVM for Nonseparable Examples....................... 4 Example Gaussian Kernel SVM...............................
Machine Learning of Environmental Spatial Data Mikhail Kanevski 1, Alexei Pozdnoukhov 2, Vasily Demyanov 3
 1 3 4 5 6 7 8 9 10 11 1 13 14 15 16 17 18 19 0 1 3 4 5 6 7 8 9 30 31 3 33 International Environmental Modelling and Software Society (iemss) 01 International Congress on Environmental Modelling and Software
Kernel Methods. Barnabás Póczos
 Kernel Methods Barnabás Póczos Outline Quick Introduction Feature space Perceptron in the feature space Kernels Mercer s theorem Finite domain Arbitrary domain Kernel families Constructing new kernels
arxiv:physics/ v1 [physics.data-an] 20 Jul 2005
![arxiv:physics/ v1 [physics.data-an] 20 Jul 2005](/thumbs/82/86788180.jpg "arxiv:physics/ v1 [physics.data-an] 20 Jul 2005") StatPatternRecognition: A C++ Package for Statistical Analysis of High Energy Physics Data Ilya Narsky arxiv:physics/57143v1 [physics.data-an] 2 Jul 25 California Institute of Technology (Dated: February
StatPatternRecognition: A C++ Package for Statistical Analysis of High Energy Physics Data Ilya Narsky arxiv:physics/57143v1 [physics.data-an] 2 Jul 25 California Institute of Technology (Dated: February
W vs. QCD Jet Tagging at the Large Hadron Collider
 W vs. QCD Jet Tagging at the Large Hadron Collider Bryan Anenberg: anenberg@stanford.edu; CS229 December 13, 2013 Problem Statement High energy collisions of protons at the Large Hadron Collider (LHC)
Statistical Rock Physics
 Statistical - Introduction Book review 3.1-3.3 Min Sun March. 13, 2009 Outline. What is Statistical. Why we need Statistical. How Statistical works Statistical Rock physics Information theory Statistics
L11: Pattern recognition principles
 L11: Pattern recognition principles Bayesian decision theory Statistical classifiers Dimensionality reduction Clustering This lecture is partly based on [Huang, Acero and Hon, 2001, ch. 4] Introduction
UNIVERSITY of PENNSYLVANIA CIS 520: Machine Learning Final, Fall 2013
 UNIVERSITY of PENNSYLVANIA CIS 520: Machine Learning Final, Fall 2013 Exam policy: This exam allows two one-page, two-sided cheat sheets; No other materials. Time: 2 hours. Be sure to write your name and
Classification for High Dimensional Problems Using Bayesian Neural Networks and Dirichlet Diffusion Trees
 Classification for High Dimensional Problems Using Bayesian Neural Networks and Dirichlet Diffusion Trees Rafdord M. Neal and Jianguo Zhang Presented by Jiwen Li Feb 2, 2006 Outline Bayesian view of feature
Machine learning for pervasive systems Classification in high-dimensional spaces
 Machine learning for pervasive systems Classification in high-dimensional spaces Department of Communications and Networking Aalto University, School of Electrical Engineering stephan.sigg@aalto.fi Version
Text Mining. Dr. Yanjun Li. Associate Professor. Department of Computer and Information Sciences Fordham University
 Text Mining Dr. Yanjun Li Associate Professor Department of Computer and Information Sciences Fordham University Outline Introduction: Data Mining Part One: Text Mining Part Two: Preprocessing Text Data
Decision Trees. Machine Learning CSEP546 Carlos Guestrin University of Washington. February 3, 2014
 Decision Trees Machine Learning CSEP546 Carlos Guestrin University of Washington February 3, 2014 17 Linear separability n A dataset is linearly separable iff there exists a separating hyperplane: Exists
Bits of Machine Learning Part 1: Supervised Learning
 Bits of Machine Learning Part 1: Supervised Learning Alexandre Proutiere and Vahan Petrosyan KTH (The Royal Institute of Technology) Outline of the Course 1. Supervised Learning Regression and Classification
PATTERN CLASSIFICATION
 PATTERN CLASSIFICATION Second Edition Richard O. Duda Peter E. Hart David G. Stork A Wiley-lnterscience Publication JOHN WILEY & SONS, INC. New York Chichester Weinheim Brisbane Singapore Toronto CONTENTS
Lecture 3: Pattern Classification. Pattern classification
 EE E68: Speech & Audio Processing & Recognition Lecture 3: Pattern Classification 3 4 5 The problem of classification Linear and nonlinear classifiers Probabilistic classification Gaussians, mitures and
Lecture 3: Pattern Classification
 EE E6820: Speech & Audio Processing & Recognition Lecture 3: Pattern Classification 1 2 3 4 5 The problem of classification Linear and nonlinear classifiers Probabilistic classification Gaussians, mixtures
CS145: INTRODUCTION TO DATA MINING
 CS145: INTRODUCTION TO DATA MINING 4: Vector Data: Decision Tree Instructor: Yizhou Sun yzsun@cs.ucla.edu October 10, 2017 Methods to Learn Vector Data Set Data Sequence Data Text Data Classification Clustering
Nonparametric Bayesian Methods (Gaussian Processes)
") [70240413 Statistical Machine Learning, Spring, 2015] Nonparametric Bayesian Methods (Gaussian Processes) Jun Zhu dcszj@mail.tsinghua.edu.cn http://bigml.cs.tsinghua.edu.cn/~jun State Key Lab of Intelligent
[70240413 Statistical Machine Learning, Spring, 2015] Nonparametric Bayesian Methods (Gaussian Processes) Jun Zhu dcszj@mail.tsinghua.edu.cn http://bigml.cs.tsinghua.edu.cn/~jun State Key Lab of Intelligent
Hierarchical models for the rainfall forecast DATA MINING APPROACH
 Hierarchical models for the rainfall forecast DATA MINING APPROACH Thanh-Nghi Do dtnghi@cit.ctu.edu.vn June - 2014 Introduction Problem large scale GCM small scale models Aim Statistical downscaling local
Support'Vector'Machines. Machine(Learning(Spring(2018 March(5(2018 Kasthuri Kannan
 Support'Vector'Machines Machine(Learning(Spring(2018 March(5(2018 Kasthuri Kannan kasthuri.kannan@nyumc.org Overview Support Vector Machines for Classification Linear Discrimination Nonlinear Discrimination
STA 414/2104: Lecture 8
 STA 414/2104: Lecture 8 6-7 March 2017: Continuous Latent Variable Models, Neural networks Delivered by Mark Ebden With thanks to Russ Salakhutdinov, Jimmy Ba and others Outline Continuous latent variable
Variable Selection and Sensitivity Analysis via Dynamic Trees with an application to Computer Code Performance Tuning
 Variable Selection and Sensitivity Analysis via Dynamic Trees with an application to Computer Code Performance Tuning Robert B. Gramacy University of Chicago Booth School of Business faculty.chicagobooth.edu/robert.gramacy
Final Overview. Introduction to ML. Marek Petrik 4/25/2017
 Final Overview Introduction to ML Marek Petrik 4/25/2017 This Course: Introduction to Machine Learning Build a foundation for practice and research in ML Basic machine learning concepts: max likelihood,
Feature selection and extraction Spectral domain quality estimation Alternatives
 Feature selection and extraction Error estimation Maa-57.3210 Data Classification and Modelling in Remote Sensing Markus Törmä markus.torma@tkk.fi Measurements Preprocessing: Remove random and systematic
Linear Classification and SVM. Dr. Xin Zhang
 Linear Classification and SVM Dr. Xin Zhang Email: eexinzhang@scut.edu.cn What is linear classification? Classification is intrinsically non-linear It puts non-identical things in the same class, so a
Chapter 6: Classification
 Chapter 6: Classification 1) Introduction Classification problem, evaluation of classifiers, prediction 2) Bayesian Classifiers Bayes classifier, naive Bayes classifier, applications 3) Linear discriminant
Reconnaissance d objetsd et vision artificielle
 Reconnaissance d objetsd et vision artificielle http://www.di.ens.fr/willow/teaching/recvis09 Lecture 6 Face recognition Face detection Neural nets Attention! Troisième exercice de programmation du le
The exam is closed book, closed notes except your one-page cheat sheet.
 CS 189 Fall 2015 Introduction to Machine Learning Final Please do not turn over the page before you are instructed to do so. You have 2 hours and 50 minutes. Please write your initials on the top-right
Neural Networks and Ensemble Methods for Classification
 Neural Networks and Ensemble Methods for Classification NEURAL NETWORKS 2 Neural Networks A neural network is a set of connected input/output units (neurons) where each connection has a weight associated
A Decision Stump. Decision Trees, cont. Boosting. Machine Learning 10701/15781 Carlos Guestrin Carnegie Mellon University. October 1 st, 2007
 Decision Trees, cont. Boosting Machine Learning 10701/15781 Carlos Guestrin Carnegie Mellon University October 1 st, 2007 1 A Decision Stump 2 1 The final tree 3 Basic Decision Tree Building Summarized
Notation. Pattern Recognition II. Michal Haindl. Outline - PR Basic Concepts. Pattern Recognition Notions
 Notation S pattern space X feature vector X = [x 1,...,x l ] l = dim{x} number of features X feature space K number of classes ω i class indicator Ω = {ω 1,...,ω K } g(x) discriminant function H decision
MLPR: Logistic Regression and Neural Networks
 MLPR: Logistic Regression and Neural Networks Machine Learning and Pattern Recognition Amos Storkey Amos Storkey MLPR: Logistic Regression and Neural Networks 1/28 Outline 1 Logistic Regression 2 Multi-layer
Artificial Neural Networks" and Nonparametric Methods" CMPSCI 383 Nov 17, 2011!
 Artificial Neural Networks" and Nonparametric Methods" CMPSCI 383 Nov 17, 2011! 1 Todayʼs lecture" How the brain works (!)! Artificial neural networks! Perceptrons! Multilayer feed-forward networks! Error
Linear vs Non-linear classifier. CS789: Machine Learning and Neural Network. Introduction
 Linear vs Non-linear classifier CS789: Machine Learning and Neural Network Support Vector Machine Jakramate Bootkrajang Department of Computer Science Chiang Mai University Linear classifier is in the
Outline. MLPR: Logistic Regression and Neural Networks Machine Learning and Pattern Recognition. Which is the correct model? Recap.
 Outline MLPR: and Neural Networks Machine Learning and Pattern Recognition 2 Amos Storkey Amos Storkey MLPR: and Neural Networks /28 Recap Amos Storkey MLPR: and Neural Networks 2/28 Which is the correct
MIDTERM: CS 6375 INSTRUCTOR: VIBHAV GOGATE October,
 MIDTERM: CS 6375 INSTRUCTOR: VIBHAV GOGATE October, 23 2013 The exam is closed book. You are allowed a one-page cheat sheet. Answer the questions in the spaces provided on the question sheets. If you run
ECE 521. Lecture 11 (not on midterm material) 13 February K-means clustering, Dimensionality reduction
 13 February K-means clustering, Dimensionality reduction") ECE 521 Lecture 11 (not on midterm material) 13 February 2017 K-means clustering, Dimensionality reduction With thanks to Ruslan Salakhutdinov for an earlier version of the slides Overview K-means clustering
ECE 521 Lecture 11 (not on midterm material) 13 February 2017 K-means clustering, Dimensionality reduction With thanks to Ruslan Salakhutdinov for an earlier version of the slides Overview K-means clustering
Analysis Techniques Multivariate Methods
 Analysis Techniques Multivariate Methods Harrison B. Prosper NEPPSR 007 Outline hintroduction hsignal/background Discrimination hfisher Discriminant hsupport Vector Machines hnaïve Bayes hbayesian Neural