Introduction to machine learning and pattern recognition Lecture 2 Coryn Bailer-Jones
|
|
|
- Barry Mosley
- 5 years ago
- Views:
Transcription


1 Introduction to machine learning and pattern recognition Lecture 2 Coryn Bailer-Jones 1 1
2 Last week... supervised and unsupervised methods need adaptive methods which learn the significance of the input data in predicting the outputs need to regularize fitting in order to achieve generalization former are fit (trained) on a labelled data set trade-off between fit bias and variance curse of dimensionality in practice must make assumptions (e.g. smoothness) and much of machine learning is about how to do this 2
3 Topics today kernels density estimation for density estimation for regression parametric as a means of classification (LDA) basis functions for structured regression e.g. splines smoothing splines 3
4 1D density estimation Given a 1D vector of measurements, how to we infer the density? 4

5 Bishop (1995) Bin the data: histograms 5
6 Kernel density estimation 1 f x = Nh n= N n=1 x x n K h K = no. neighbours N = total no. points V = volume occupied by K neighbours sum is over all points, n K() is a fixed kernel function with bandwidth h. Simple (Parzen) kernel: K u = 1 = 0 if u 1/2 otherwise 6
7 Gaussian kernel n=n n=1 x x n 2 1 exp 2 d /2 2 h 2h 2 where N is entire data set Bishop (1995) 1 f x = N 7
8 K-NN density estimation Overcome fixed kernel size: Vary search volume size, V, until reach K neighbours K NV Bishop (1995) f x = K = no. neighbours N = total no. points V = volume occupied by K neighbours 8
9 9
10 Histograms and 1D kernel density estimation From MASS4 section 5.6. See R scripts on web. 10

11 2D kernel density estimation From MASS4 section 5.6. See R scripts on web. 11
12 Classification via (parametric) density modelling Separately model PDF of each class using a specific function e.g. a p-dimensional Gaussian: p x = 2 1 C exp { 12 x T C 1 x } p/ 2 1 /2 where = E [ x] C = E [ x x T ] The quantity 2 = 12 x T 1 x is called the Mahalanobis distance from x to. Surfaces of constant probability density are constant 2 (ellipsoids). Principal axes of these are eigenvectors, u, of C and the variances in these directions are the eigenvalues, C u = u 12
13 Maximum likelihood estimate of parameters p X = Nj=1 p x j L is the likelihood, a function of the parameters, ={, C }. We maximise this w.r.t. In practice we minimize the negative log likelihood E = ln L = ln p x j For a multivariate Gaussian distribution p x = 2 1 C exp { 12 x T C 1 x } p/ 2 ln L = Np 2 1/ 2 ln 2 N 2 ln C 1 2 N i=1 x T C 1 x i.e. corresponds to least squares In this case analytic differentiation can be used and gives 1 N = N i=1 x C = 1 N N i=1 x x T (note the outer product) which are intuitive. 13
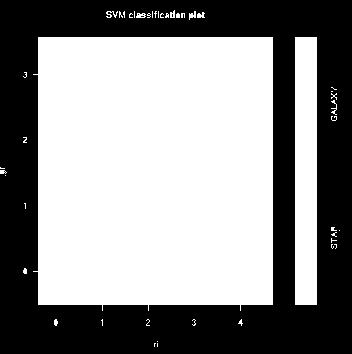
14 Example: modelling PDF with two Gaussians See R scripts on web page class 1 = (0.0, 0.0) = (0.5, 0.5) class 2 = (1.0, 1.0) = (0.7, 0.3) 14
15 likelihood of x given y Bayes' Theorem posterior probability of y given x p x y p y p y x = p x prior over y p y, x = p y x p x = p x y p y Applications: 1. Prediction: x = predictors (input), y = response(s) (output) 2. Learning: x = data, y = model parameters p x y, p y p y x, = p x p x = evidence for model p x y, p y dy p y x, = p x y, p y p x y, p y dy 15
16 Linear Discriminant Analysis (LDA) Approach: directly model the class posterior probabilities, Pr G X y k x is class conditional density of X for class G=k (likelihood) k is the prior probability of class k where Kk=1 k =1 From Bayes' theorem y k x k Pr G=k X = x = kk=1 y k x k Need form for conditional density. Many possibilities Gaussian mixture of Gaussians nonparametric density estimates (e.g. kernel) Naive Bayes (assume inputs to be conditionally independent) 16
17 Linear Discriminant Analysis (LDA) Approach: directly model the class posterior probabilities, Pr G X y k x is class conditional density of X for class G=k (likelihood) k is the prior probability of class k where Kk=1 k =1 From Bayes' theorem y k x k Pr G=k X = x = kk=1 y k x k Multivariate Gaussian case y k x = 2 1 C exp { 12 x k T C 1 k x k } p/ 2 k 1 /2 LDA is special case in which we take C k =C k To compare two classes k and l look at the odds ratio Pr G=k X = x log Pr G=l X = x = log = log y k x yl x k l log 1 2 solve using maximum likelihood. Use class frequencies as priors k l k l T C 1 k l x T C 1 k l which is linear in x 17
 LDA")
18 Hastie, Tibshirani, Friedman (2001) LDA 18
19 LDA as data compression (data description) Can also write log odds ratio as Pr G=k X = x log Pr G=l X =x = k x l x where k x = x T C 1 k Tk C 1 k log k is called the linear discriminant function. Decision rule is then G x = argmax k x k Aside: same as linear least squares for two classes when k = j For g classes have g-1 linear discriminants Gives a dimensionality reduction p original data dimensions to g-1 LDs 19

 20")
20 LDA example: Fisher's iris data 4 measurements: sepal and petal length and width 3 classes: iris setosa, versicolor, virginica 50 flowers in each class use lda in MASS package in R will get two LDs R.A. Fisher ( ) 20
21 Quadratic Discriminant Analysis (QDA) As before y k x = 1 2 p / 2 C k 1 /2 exp { 12 x T C 1 k x } Odds ratio Pr G=k X = x log Pr G=l X =x = log y k x yl x log k l = k x l x With QDA we no longer assume equal covariances, so they do not cancel. Discriminant functions are k x = 12 log C k 1/2 12 x k T C 1 k x k log k which are quadratic functions of x 21


22 Hastie, Tibshirani, Friedman (2001) LDA and QDA applied to 3-class problem in 2D. Data are non-gaussian and classes have non-equal covariances) 22
23 One-dimensional kernel smoothers: k-nn Hastie, Tibshirani, Friedman (2001) k -nn smoother: E Y X = x = f x = Ave[ y i x i N k x ] N k x is the set of k points nearest to x in (e.g.) squared distance Drawback is that the estimator is not smooth in x. k =30 23
24 One-dimensional kernel smoothers: Epanechnikov Instead give more distant points less weight, e.g. with the Nadaraya-Watson kernel-weighted average N using the Epanechnikov kernel x x 0 K x 0, x i = D where { t D t = 4 0 if t 1 otherwise Hastie, Tibshirani, Friedman (2001) f x 0 = i=1 K x0, x i yi N i=1 K x 0, xi } Could generalize kernel to have variable width x x 0 K x 0, x i = D h x 0 24

25 Hastie, Tibshirani, Friedman (2001) Kernel comparison { t Epanechnikov: D t = 4 0 if t 1 otherwise } { t Tri-cube: D t = 0 if t 1 otherwise 25 }

26 Hastie, Tibshirani, Friedman (2001) k-nn and Epanechnikov kernels k =30 =0.2 Epanechnikov kernel has fixed width (bias approx. constant, variance not) k-nn has adaptive width (constant variance, bias varies as 1/density) free parameters: k or 26

27 Hastie, Tibshirani, Friedman (2001) Locally-weighted averages can be biased at boundaries Kernel is asymmetric at the boundary 27

28 Hastie, Tibshirani, Friedman (2001) Local linear regression solve linear least squares in local region to predict at a single point green points: effective kernel 28
 Local quadratic")
29 Hastie, Tibshirani, Friedman (2001) Local quadratic regression 29
30 Kernels in higher dimensions kernel smoothing and local regression generalize to higher dimensions......but curse of dimensionality not overcome cannot simultaneously retain localness (=low bias) and sufficient sample size (=low variance) without increasing total sample exponentially with dimension In general we need to make assumptions about underlying data/true function and use structured regression/classification 30
31 Basis expansions f X = M m h m X m=1 linear model hm X = X m m=1,..., p quadratic terms hm X = X j X k higher order terms other transformations, e.g. h m X = log X j, X j split range with an indicator function h m X = I L m X j U m As higher order terms are added we need to control the complexity Restrict class of functions a priori, e.g. additive models Adaptive selection of function, e.g. variable selection, only include significant basis functions Fit complex function and regularize. Typically an integral part of nonlinear modelling 31
32 Splines (one-dimensional) Idea behind splines is that region to fit is split into subregions which are then fit separately In plots: data drawn from nonlinear function (blue line) with Gaussian noise Split region to fit into three by the knots Piecewise linear 3 constants 3 linear fits 3 linear fits forced to be continuous (2 restrictions 2 fewer free parameters) 32

33 Piecewise linear fits Hastie, Tibshirani, Friedman (2001) h1 X =1, h 2 X = X, h3 X = X 1, h 4 X = X 2, f X = M m h m X m=1 33

34 Piecewise cubic polynomial fits h1 X =1, h2 X = X, Hastie, Tibshirani, Friedman (2001) h3 X = X 2, h4 X = X 3, 3 h5 X = X 1, 3 h6 X = X 2, M f X = m h m X m=1 Subregions are fit separately but not independently 34
35 Cubic splines regression spline natural cubic splines polynomial fits near boundaries often very wild force extrapolation to be linear: frees up 4 d.o.f (i.e. adds two constraints at the two boundaries) increases variance at the boundaries must select knots fixed knots regularization controlled by number of knots and degree of polynomials not very satisfactory... See R scripts for spline examples (more next week) 35
36 Smoothing splines Avoid knot selection by using all data points as knots avoid overfitting by using regularization Minimise a penalized sum-of-squares N RSS f, = {y i f x i }2 { f ' ' t }2 dt i=1 f is the fitting function with continuous second derivatives What is the effect of varying? What fits do we get for the extreme values? 36
37 Smoothing splines Avoid knot selection by using all data points as knots avoid overfitting by using regularization Minimise a penalized sum-of-squares N RSS f, = {y i f x i }2 { f ' ' t }2 dt i=1 f is the fitting function with continuous second derivatives =0 f is any function which interpolates the data (could be wild) = straight line least squares fit (no second derivative tolerated) Solution is a cubic spline with knots at each of the {xi } i.e. N f x = h j x j j=1 37
38 Splines in R See R scripts on the web 38
39 Summary density estimation in order to fit a model or make inferences some assumptions are essential, CBJ classification via parametric density estimation (LDA) histograms ( binning is sinning, Rix) kernels ( smoothing is evil, Martin) parametric model Gaussian fit to each class. Common covariance matrix is LDA and leads to linear decision boundaries g-1 linear discriminants between g classes get QDA when relax common covariance restraint basis functions linear model of local or nonlinear terms splines (see web notes/r scripts for more) complexity control: smoothing splines taken to a higher level with neural networks...next week... 39
Cheng Soon Ong & Christian Walder. Canberra February June 2018
 Cheng Soon Ong & Christian Walder Research Group and College of Engineering and Computer Science Canberra February June 2018 (Many figures from C. M. Bishop, "Pattern Recognition and ") 1of 305 Part VII
Classification Methods II: Linear and Quadratic Discrimminant Analysis
 Classification Methods II: Linear and Quadratic Discrimminant Analysis Rebecca C. Steorts, Duke University STA 325, Chapter 4 ISL Agenda Linear Discrimminant Analysis (LDA) Classification Recall that linear
Supervised Learning: Linear Methods (1/2) Applied Multivariate Statistics Spring 2012
 Applied Multivariate Statistics Spring 2012") Supervised Learning: Linear Methods (1/2) Applied Multivariate Statistics Spring 2012 Overview Review: Conditional Probability LDA / QDA: Theory Fisher s Discriminant Analysis LDA: Example Quality control:
Supervised Learning: Linear Methods (1/2) Applied Multivariate Statistics Spring 2012 Overview Review: Conditional Probability LDA / QDA: Theory Fisher s Discriminant Analysis LDA: Example Quality control:
Multivariate statistical methods and data mining in particle physics
 Multivariate statistical methods and data mining in particle physics RHUL Physics www.pp.rhul.ac.uk/~cowan Academic Training Lectures CERN 16 19 June, 2008 1 Outline Statement of the problem Some general
ISyE 6416: Computational Statistics Spring Lecture 5: Discriminant analysis and classification
 ISyE 6416: Computational Statistics Spring 2017 Lecture 5: Discriminant analysis and classification Prof. Yao Xie H. Milton Stewart School of Industrial and Systems Engineering Georgia Institute of Technology
Non-parametric Methods
 Non-parametric Methods Machine Learning Torsten Möller Möller/Mori 1 Reading Chapter 2 of Pattern Recognition and Machine Learning by Bishop (with an emphasis on section 2.5) Möller/Mori 2 Outline Last
L11: Pattern recognition principles
 L11: Pattern recognition principles Bayesian decision theory Statistical classifiers Dimensionality reduction Clustering This lecture is partly based on [Huang, Acero and Hon, 2001, ch. 4] Introduction
University of Cambridge Engineering Part IIB Module 4F10: Statistical Pattern Processing Handout 2: Multivariate Gaussians
 Engineering Part IIB: Module F Statistical Pattern Processing University of Cambridge Engineering Part IIB Module F: Statistical Pattern Processing Handout : Multivariate Gaussians. Generative Model Decision
Pattern Recognition and Machine Learning
 Christopher M. Bishop Pattern Recognition and Machine Learning ÖSpri inger Contents Preface Mathematical notation Contents vii xi xiii 1 Introduction 1 1.1 Example: Polynomial Curve Fitting 4 1.2 Probability
Instance-based Learning CE-717: Machine Learning Sharif University of Technology. M. Soleymani Fall 2016
 Instance-based Learning CE-717: Machine Learning Sharif University of Technology M. Soleymani Fall 2016 Outline Non-parametric approach Unsupervised: Non-parametric density estimation Parzen Windows Kn-Nearest
Lecture 16: Small Sample Size Problems (Covariance Estimation) Many thanks to Carlos Thomaz who authored the original version of these slides
 Many thanks to Carlos Thomaz who authored the original version of these slides") Lecture 16: Small Sample Size Problems (Covariance Estimation) Many thanks to Carlos Thomaz who authored the original version of these slides Intelligent Data Analysis and Probabilistic Inference Lecture
Lecture 16: Small Sample Size Problems (Covariance Estimation) Many thanks to Carlos Thomaz who authored the original version of these slides Intelligent Data Analysis and Probabilistic Inference Lecture
The Bayes classifier
 The Bayes classifier Consider where is a random vector in is a random variable (depending on ) Let be a classifier with probability of error/risk given by The Bayes classifier (denoted ) is the optimal
Linear Regression and Discrimination
 Linear Regression and Discrimination Kernel-based Learning Methods Christian Igel Institut für Neuroinformatik Ruhr-Universität Bochum, Germany http://www.neuroinformatik.rub.de July 16, 2009 Christian
LEC 4: Discriminant Analysis for Classification
 LEC 4: Discriminant Analysis for Classification Dr. Guangliang Chen February 25, 2016 Outline Last time: FDA (dimensionality reduction) Today: QDA/LDA (classification) Naive Bayes classifiers Matlab/Python
University of Cambridge Engineering Part IIB Module 4F10: Statistical Pattern Processing Handout 2: Multivariate Gaussians
 University of Cambridge Engineering Part IIB Module 4F: Statistical Pattern Processing Handout 2: Multivariate Gaussians.2.5..5 8 6 4 2 2 4 6 8 Mark Gales mjfg@eng.cam.ac.uk Michaelmas 2 2 Engineering
Machine Learning Linear Classification. Prof. Matteo Matteucci
 Machine Learning Linear Classification Prof. Matteo Matteucci Recall from the first lecture 2 X R p Regression Y R Continuous Output X R p Y {Ω 0, Ω 1,, Ω K } Classification Discrete Output X R p Y (X)
CMSC858P Supervised Learning Methods
 CMSC858P Supervised Learning Methods Hector Corrada Bravo March, 2010 Introduction Today we discuss the classification setting in detail. Our setting is that we observe for each subject i a set of p predictors
Advanced statistical methods for data analysis Lecture 1
 Advanced statistical methods for data analysis Lecture 1 RHUL Physics www.pp.rhul.ac.uk/~cowan Universität Mainz Klausurtagung des GK Eichtheorien exp. Tests... Bullay/Mosel 15 17 September, 2008 1 Outline
Machine Learning. Nonparametric Methods. Space of ML Problems. Todo. Histograms. Instance-Based Learning (aka non-parametric methods)
") Machine Learning InstanceBased Learning (aka nonparametric methods) Supervised Learning Unsupervised Learning Reinforcement Learning Parametric Non parametric CSE 446 Machine Learning Daniel Weld March
Machine Learning InstanceBased Learning (aka nonparametric methods) Supervised Learning Unsupervised Learning Reinforcement Learning Parametric Non parametric CSE 446 Machine Learning Daniel Weld March
BAYESIAN DECISION THEORY
 Last updated: September 17, 2012 BAYESIAN DECISION THEORY Problems 2 The following problems from the textbook are relevant: 2.1 2.9, 2.11, 2.17 For this week, please at least solve Problem 2.3. We will
Direct Learning: Linear Classification. Donglin Zeng, Department of Biostatistics, University of North Carolina
 Direct Learning: Linear Classification Logistic regression models for classification problem We consider two class problem: Y {0, 1}. The Bayes rule for the classification is I(P(Y = 1 X = x) > 1/2) so
Cheng Soon Ong & Christian Walder. Canberra February June 2018
 Cheng Soon Ong & Christian Walder Research Group and College of Engineering and Computer Science Canberra February June 2018 (Many figures from C. M. Bishop, "Pattern Recognition and ") 1of 254 Part V
ECE521 week 3: 23/26 January 2017
 ECE521 week 3: 23/26 January 2017 Outline Probabilistic interpretation of linear regression - Maximum likelihood estimation (MLE) - Maximum a posteriori (MAP) estimation Bias-variance trade-off Linear
Curve Fitting Re-visited, Bishop1.2.5
 Curve Fitting Re-visited, Bishop1.2.5 Maximum Likelihood Bishop 1.2.5 Model Likelihood differentiation p(t x, w, β) = Maximum Likelihood N N ( t n y(x n, w), β 1). (1.61) n=1 As we did in the case of the
Recap from previous lecture
 Recap from previous lecture Learning is using past experience to improve future performance. Different types of learning: supervised unsupervised reinforcement active online... For a machine, experience
Contents Lecture 4. Lecture 4 Linear Discriminant Analysis. Summary of Lecture 3 (II/II) Summary of Lecture 3 (I/II)
 Summary of Lecture 3 (I/II)") Contents Lecture Lecture Linear Discriminant Analysis Fredrik Lindsten Division of Systems and Control Department of Information Technology Uppsala University Email: fredriklindsten@ituuse Summary of lecture
Contents Lecture Lecture Linear Discriminant Analysis Fredrik Lindsten Division of Systems and Control Department of Information Technology Uppsala University Email: fredriklindsten@ituuse Summary of lecture
PATTERN RECOGNITION AND MACHINE LEARNING CHAPTER 2: PROBABILITY DISTRIBUTIONS
 PATTERN RECOGNITION AND MACHINE LEARNING CHAPTER 2: PROBABILITY DISTRIBUTIONS Parametric Distributions Basic building blocks: Need to determine given Representation: or? Recall Curve Fitting Binary Variables
PATTERN RECOGNITION AND MACHINE LEARNING
 PATTERN RECOGNITION AND MACHINE LEARNING Chapter 1. Introduction Shuai Huang April 21, 2014 Outline 1 What is Machine Learning? 2 Curve Fitting 3 Probability Theory 4 Model Selection 5 The curse of dimensionality
Econ 582 Nonparametric Regression
 Econ 582 Nonparametric Regression Eric Zivot May 28, 2013 Nonparametric Regression Sofarwehaveonlyconsideredlinearregressionmodels = x 0 β + [ x ]=0 [ x = x] =x 0 β = [ x = x] [ x = x] x = β The assume
Ch 4. Linear Models for Classification
 Ch 4. Linear Models for Classification Pattern Recognition and Machine Learning, C. M. Bishop, 2006. Department of Computer Science and Engineering Pohang University of Science and echnology 77 Cheongam-ro,
Cheng Soon Ong & Christian Walder. Canberra February June 2018
 Cheng Soon Ong & Christian Walder Research Group and College of Engineering and Computer Science Canberra February June 2018 Outlines Overview Introduction Linear Algebra Probability Linear Regression
Lecture 4 Discriminant Analysis, k-nearest Neighbors
 Lecture 4 Discriminant Analysis, k-nearest Neighbors Fredrik Lindsten Division of Systems and Control Department of Information Technology Uppsala University. Email: fredrik.lindsten@it.uu.se fredrik.lindsten@it.uu.se
Classification techniques focus on Discriminant Analysis
 Classification techniques focus on Discriminant Analysis Seminar: Potentials of advanced image analysis technology in the cereal science research 2111 2005 Ulf Indahl/IMT - 14.06.2010 Task: Supervised
Advanced statistical methods for data analysis Lecture 2
 Advanced statistical methods for data analysis Lecture 2 RHUL Physics www.pp.rhul.ac.uk/~cowan Universität Mainz Klausurtagung des GK Eichtheorien exp. Tests... Bullay/Mosel 15 17 September, 2008 1 Outline
Gaussian Models
 Gaussian Models ddebarr@uw.edu 2016-04-28 Agenda Introduction Gaussian Discriminant Analysis Inference Linear Gaussian Systems The Wishart Distribution Inferring Parameters Introduction Gaussian Density
Machine Learning. Regression-Based Classification & Gaussian Discriminant Analysis. Manfred Huber
 Machine Learning Regression-Based Classification & Gaussian Discriminant Analysis Manfred Huber 2015 1 Logistic Regression Linear regression provides a nice representation and an efficient solution to
Lecture 5: Classification
 Lecture 5: Classification Advanced Applied Multivariate Analysis STAT 2221, Spring 2015 Sungkyu Jung Department of Statistics, University of Pittsburgh Xingye Qiao Department of Mathematical Sciences Binghamton
CMU-Q Lecture 24:
 CMU-Q 15-381 Lecture 24: Supervised Learning 2 Teacher: Gianni A. Di Caro SUPERVISED LEARNING Hypotheses space Hypothesis function Labeled Given Errors Performance criteria Given a collection of input
CS-E3210 Machine Learning: Basic Principles
 CS-E3210 Machine Learning: Basic Principles Lecture 4: Regression II slides by Markus Heinonen Department of Computer Science Aalto University, School of Science Autumn (Period I) 2017 1 / 61 Today s introduction
Machine Learning Lecture 2
 Machine Perceptual Learning and Sensory Summer Augmented 15 Computing Many slides adapted from B. Schiele Machine Learning Lecture 2 Probability Density Estimation 16.04.2015 Bastian Leibe RWTH Aachen
An Introduction to Statistical and Probabilistic Linear Models
 An Introduction to Statistical and Probabilistic Linear Models Maximilian Mozes Proseminar Data Mining Fakultät für Informatik Technische Universität München June 07, 2017 Introduction In statistical learning
Introduction to Graphical Models
 Introduction to Graphical Models The 15 th Winter School of Statistical Physics POSCO International Center & POSTECH, Pohang 2018. 1. 9 (Tue.) Yung-Kyun Noh GENERALIZATION FOR PREDICTION 2 Probabilistic
COMP 551 Applied Machine Learning Lecture 5: Generative models for linear classification
 COMP 55 Applied Machine Learning Lecture 5: Generative models for linear classification Instructor: (jpineau@cs.mcgill.ca) Class web page: www.cs.mcgill.ca/~jpineau/comp55 Unless otherwise noted, all material
Naïve Bayes Introduction to Machine Learning. Matt Gormley Lecture 18 Oct. 31, 2018
 10-601 Introduction to Machine Learning Machine Learning Department School of Computer Science Carnegie Mellon University Naïve Bayes Matt Gormley Lecture 18 Oct. 31, 2018 1 Reminders Homework 6: PAC Learning
Computer Vision Group Prof. Daniel Cremers. 3. Regression
 Prof. Daniel Cremers 3. Regression Categories of Learning (Rep.) Learnin g Unsupervise d Learning Clustering, density estimation Supervised Learning learning from a training data set, inference on the
Lecture 13: Data Modelling and Distributions. Intelligent Data Analysis and Probabilistic Inference Lecture 13 Slide No 1
 Lecture 13: Data Modelling and Distributions Intelligent Data Analysis and Probabilistic Inference Lecture 13 Slide No 1 Why data distributions? It is a well established fact that many naturally occurring
12 - Nonparametric Density Estimation
 ST 697 Fall 2017 1/49 12 - Nonparametric Density Estimation ST 697 Fall 2017 University of Alabama Density Review ST 697 Fall 2017 2/49 Continuous Random Variables ST 697 Fall 2017 3/49 1.0 0.8 F(x) 0.6
Classification via kernel regression based on univariate product density estimators
 Classification via kernel regression based on univariate product density estimators Bezza Hafidi 1, Abdelkarim Merbouha 2, and Abdallah Mkhadri 1 1 Department of Mathematics, Cadi Ayyad University, BP
Cheng Soon Ong & Christian Walder. Canberra February June 2018
 Cheng Soon Ong & Christian Walder Research Group and College of Engineering and Computer Science Canberra February June 218 Outlines Overview Introduction Linear Algebra Probability Linear Regression 1
COMP 551 Applied Machine Learning Lecture 20: Gaussian processes
 COMP 55 Applied Machine Learning Lecture 2: Gaussian processes Instructor: Ryan Lowe (ryan.lowe@cs.mcgill.ca) Slides mostly by: (herke.vanhoof@mcgill.ca) Class web page: www.cs.mcgill.ca/~hvanho2/comp55
CS 195-5: Machine Learning Problem Set 1
 CS 95-5: Machine Learning Problem Set Douglas Lanman dlanman@brown.edu 7 September Regression Problem Show that the prediction errors y f(x; ŵ) are necessarily uncorrelated with any linear function of
ECE662: Pattern Recognition and Decision Making Processes: HW TWO
 ECE662: Pattern Recognition and Decision Making Processes: HW TWO Purdue University Department of Electrical and Computer Engineering West Lafayette, INDIANA, USA Abstract. In this report experiments are
Lecture 3: Statistical Decision Theory (Part II)
") Lecture 3: Statistical Decision Theory (Part II) Hao Helen Zhang Hao Helen Zhang Lecture 3: Statistical Decision Theory (Part II) 1 / 27 Outline of This Note Part I: Statistics Decision Theory (Classical
Lecture 3: Statistical Decision Theory (Part II) Hao Helen Zhang Hao Helen Zhang Lecture 3: Statistical Decision Theory (Part II) 1 / 27 Outline of This Note Part I: Statistics Decision Theory (Classical
Semiparametric Discriminant Analysis of Mixture Populations Using Mahalanobis Distance. Probal Chaudhuri and Subhajit Dutta
 Semiparametric Discriminant Analysis of Mixture Populations Using Mahalanobis Distance Probal Chaudhuri and Subhajit Dutta Indian Statistical Institute, Kolkata. Workshop on Classification and Regression
Machine Learning Lecture 3
 Announcements Machine Learning Lecture 3 Eam dates We re in the process of fiing the first eam date Probability Density Estimation II 9.0.207 Eercises The first eercise sheet is available on L2P now First
Machine Learning (CS 567) Lecture 5
 Lecture 5") Machine Learning (CS 567) Lecture 5 Time: T-Th 5:00pm - 6:20pm Location: GFS 118 Instructor: Sofus A. Macskassy (macskass@usc.edu) Office: SAL 216 Office hours: by appointment Teaching assistant: Cheol
Machine Learning (CS 567) Lecture 5 Time: T-Th 5:00pm - 6:20pm Location: GFS 118 Instructor: Sofus A. Macskassy (macskass@usc.edu) Office: SAL 216 Office hours: by appointment Teaching assistant: Cheol
Regression, Ridge Regression, Lasso
 Regression, Ridge Regression, Lasso Fabio G. Cozman - fgcozman@usp.br October 2, 2018 A general definition Regression studies the relationship between a response variable Y and covariates X 1,..., X n.
Statistical Learning Reading Assignments
 Statistical Learning Reading Assignments S. Gong et al. Dynamic Vision: From Images to Face Recognition, Imperial College Press, 2001 (Chapt. 3, hard copy). T. Evgeniou, M. Pontil, and T. Poggio, "Statistical
Motivating the Covariance Matrix
 Motivating the Covariance Matrix Raúl Rojas Computer Science Department Freie Universität Berlin January 2009 Abstract This note reviews some interesting properties of the covariance matrix and its role
COM336: Neural Computing
 COM336: Neural Computing http://www.dcs.shef.ac.uk/ sjr/com336/ Lecture 2: Density Estimation Steve Renals Department of Computer Science University of Sheffield Sheffield S1 4DP UK email: s.renals@dcs.shef.ac.uk
Introduction to Machine Learning
 1, DATA11002 Introduction to Machine Learning Lecturer: Teemu Roos TAs: Ville Hyvönen and Janne Leppä-aho Department of Computer Science University of Helsinki (based in part on material by Patrik Hoyer
Chap 1. Overview of Statistical Learning (HTF, , 2.9) Yongdai Kim Seoul National University
 Yongdai Kim Seoul National University") Chap 1. Overview of Statistical Learning (HTF, 2.1-2.6, 2.9) Yongdai Kim Seoul National University 0. Learning vs Statistical learning Learning procedure Construct a claim by observing data or using logics
Chap 1. Overview of Statistical Learning (HTF, 2.1-2.6, 2.9) Yongdai Kim Seoul National University 0. Learning vs Statistical learning Learning procedure Construct a claim by observing data or using logics
Classification 2: Linear discriminant analysis (continued); logistic regression
; logistic regression") Classification 2: Linear discriminant analysis (continued); logistic regression Ryan Tibshirani Data Mining: 36-462/36-662 April 4 2013 Optional reading: ISL 4.4, ESL 4.3; ISL 4.3, ESL 4.4 1 Reminder:
Classification 2: Linear discriminant analysis (continued); logistic regression Ryan Tibshirani Data Mining: 36-462/36-662 April 4 2013 Optional reading: ISL 4.4, ESL 4.3; ISL 4.3, ESL 4.4 1 Reminder:
Bayesian Learning (II)
") Universität Potsdam Institut für Informatik Lehrstuhl Maschinelles Lernen Bayesian Learning (II) Niels Landwehr Overview Probabilities, expected values, variance Basic concepts of Bayesian learning MAP
Universität Potsdam Institut für Informatik Lehrstuhl Maschinelles Lernen Bayesian Learning (II) Niels Landwehr Overview Probabilities, expected values, variance Basic concepts of Bayesian learning MAP
MLE/MAP + Naïve Bayes
 10-601 Introduction to Machine Learning Machine Learning Department School of Computer Science Carnegie Mellon University MLE/MAP + Naïve Bayes MLE / MAP Readings: Estimating Probabilities (Mitchell, 2016)
The exam is closed book, closed notes except your one-page (two sides) or two-page (one side) crib sheet.
 or two-page (one side) crib sheet.") CS 189 Spring 013 Introduction to Machine Learning Final You have 3 hours for the exam. The exam is closed book, closed notes except your one-page (two sides) or two-page (one side) crib sheet. Please
CS 189 Spring 013 Introduction to Machine Learning Final You have 3 hours for the exam. The exam is closed book, closed notes except your one-page (two sides) or two-page (one side) crib sheet. Please
Introduction to Machine Learning
 Introduction to Machine Learning 3. Instance Based Learning Alex Smola Carnegie Mellon University http://alex.smola.org/teaching/cmu2013-10-701 10-701 Outline Parzen Windows Kernels, algorithm Model selection
9/26/17. Ridge regression. What our model needs to do. Ridge Regression: L2 penalty. Ridge coefficients. Ridge coefficients
 What our model needs to do regression Usually, we are not just trying to explain observed data We want to uncover meaningful trends And predict future observations Our questions then are Is β" a good estimate
On Bias, Variance, 0/1-Loss, and the Curse-of-Dimensionality. Weiqiang Dong
 On Bias, Variance, 0/1-Loss, and the Curse-of-Dimensionality Weiqiang Dong 1 The goal of the work presented here is to illustrate that classification error responds to error in the target probability estimates
Machine Learning Lecture 7
 Course Outline Machine Learning Lecture 7 Fundamentals (2 weeks) Bayes Decision Theory Probability Density Estimation Statistical Learning Theory 23.05.2016 Discriminative Approaches (5 weeks) Linear Discriminant
Machine Learning Lecture 2
 Machine Perceptual Learning and Sensory Summer Augmented 6 Computing Announcements Machine Learning Lecture 2 Course webpage http://www.vision.rwth-aachen.de/teaching/ Slides will be made available on
Learning from Data: Regression
 November 3, 2005 http://www.anc.ed.ac.uk/ amos/lfd/ Classification or Regression? Classification: want to learn a discrete target variable. Regression: want to learn a continuous target variable. Linear
Introduction. Chapter 1
 Chapter 1 Introduction In this book we will be concerned with supervised learning, which is the problem of learning input-output mappings from empirical data (the training dataset). Depending on the characteristics
CS 6375 Machine Learning
 CS 6375 Machine Learning Nicholas Ruozzi University of Texas at Dallas Slides adapted from David Sontag and Vibhav Gogate Course Info. Instructor: Nicholas Ruozzi Office: ECSS 3.409 Office hours: Tues.
Introduction to Machine Learning
 1, DATA11002 Introduction to Machine Learning Lecturer: Antti Ukkonen TAs: Saska Dönges and Janne Leppä-aho Department of Computer Science University of Helsinki (based in part on material by Patrik Hoyer,
Lecture 3. Linear Regression II Bastian Leibe RWTH Aachen
 Advanced Machine Learning Lecture 3 Linear Regression II 02.11.2015 Bastian Leibe RWTH Aachen http://www.vision.rwth-aachen.de/ leibe@vision.rwth-aachen.de This Lecture: Advanced Machine Learning Regression
Machine Learning Lecture 2
 Announcements Machine Learning Lecture 2 Eceptional number of lecture participants this year Current count: 449 participants This is very nice, but it stretches our resources to their limits Probability
Machine Learning. Lecture 4: Regularization and Bayesian Statistics. Feng Li. https://funglee.github.io
 Machine Learning Lecture 4: Regularization and Bayesian Statistics Feng Li fli@sdu.edu.cn https://funglee.github.io School of Computer Science and Technology Shandong University Fall 207 Overfitting Problem
Alternatives to Basis Expansions. Kernels in Density Estimation. Kernels and Bandwidth. Idea Behind Kernel Methods
 Alternatives to Basis Expansions Basis expansions require either choice of a discrete set of basis or choice of smoothing penalty and smoothing parameter Both of which impose prior beliefs on data. Alternatives
Classification. Chapter Introduction. 6.2 The Bayes classifier
 Chapter 6 Classification 6.1 Introduction Often encountered in applications is the situation where the response variable Y takes values in a finite set of labels. For example, the response Y could encode
STA 4273H: Sta-s-cal Machine Learning
 STA 4273H: Sta-s-cal Machine Learning Russ Salakhutdinov Department of Computer Science! Department of Statistical Sciences! rsalakhu@cs.toronto.edu! h0p://www.cs.utoronto.ca/~rsalakhu/ Lecture 2 In our
Linear Models for Classification
 Linear Models for Classification Oliver Schulte - CMPT 726 Bishop PRML Ch. 4 Classification: Hand-written Digit Recognition CHINE INTELLIGENCE, VOL. 24, NO. 24, APRIL 2002 x i = t i = (0, 0, 0, 1, 0, 0,
University of Cambridge Engineering Part IIB Module 3F3: Signal and Pattern Processing Handout 2:. The Multivariate Gaussian & Decision Boundaries
 University of Cambridge Engineering Part IIB Module 3F3: Signal and Pattern Processing Handout :. The Multivariate Gaussian & Decision Boundaries..15.1.5 1 8 6 6 8 1 Mark Gales mjfg@eng.cam.ac.uk Lent
Support Vector Machines
 Support Vector Machines Le Song Machine Learning I CSE 6740, Fall 2013 Naïve Bayes classifier Still use Bayes decision rule for classification P y x = P x y P y P x But assume p x y = 1 is fully factorized
Soft and hard models. Jiří Militky Computer assisted statistical modeling in the
 Soft and hard models Jiří Militky Computer assisted statistical s modeling in the applied research Monsters Giants Moore s law: processing capacity doubles every 18 months : CPU, cache, memory It s more
Overview c 1 What is? 2 Definition Outlines 3 Examples of 4 Related Fields Overview Linear Regression Linear Classification Neural Networks Kernel Met
 c Outlines Statistical Group and College of Engineering and Computer Science Overview Linear Regression Linear Classification Neural Networks Kernel Methods and SVM Mixture Models and EM Resources More
Pattern Recognition and Machine Learning. Bishop Chapter 6: Kernel Methods
 Pattern Recognition and Machine Learning Chapter 6: Kernel Methods Vasil Khalidov Alex Kläser December 13, 2007 Training Data: Keep or Discard? Parametric methods (linear/nonlinear) so far: learn parameter
Linear Classification: Probabilistic Generative Models
 Linear Classification: Probabilistic Generative Models Sargur N. University at Buffalo, State University of New York USA 1 Linear Classification using Probabilistic Generative Models Topics 1. Overview
5. Discriminant analysis
 5. Discriminant analysis We continue from Bayes s rule presented in Section 3 on p. 85 (5.1) where c i is a class, x isap-dimensional vector (data case) and we use class conditional probability (density
Choosing the Summary Statistics and the Acceptance Rate in Approximate Bayesian Computation
 Choosing the Summary Statistics and the Acceptance Rate in Approximate Bayesian Computation COMPSTAT 2010 Revised version; August 13, 2010 Michael G.B. Blum 1 Laboratoire TIMC-IMAG, CNRS, UJF Grenoble
Density Estimation. Seungjin Choi
 Density Estimation Seungjin Choi Department of Computer Science and Engineering Pohang University of Science and Technology 77 Cheongam-ro, Nam-gu, Pohang 37673, Korea seungjin@postech.ac.kr http://mlg.postech.ac.kr/
LDA, QDA, Naive Bayes
 LDA, QDA, Naive Bayes Generative Classification Models Marek Petrik 2/16/2017 Last Class Logistic Regression Maximum Likelihood Principle Logistic Regression Predict probability of a class: p(x) Example:
Final Overview. Introduction to ML. Marek Petrik 4/25/2017
 Final Overview Introduction to ML Marek Petrik 4/25/2017 This Course: Introduction to Machine Learning Build a foundation for practice and research in ML Basic machine learning concepts: max likelihood,
Informatics 2B: Learning and Data Lecture 10 Discriminant functions 2. Minimal misclassifications. Decision Boundaries
 Overview Gaussians estimated from training data Guido Sanguinetti Informatics B Learning and Data Lecture 1 9 March 1 Today s lecture Posterior probabilities, decision regions and minimising the probability
Bits of Machine Learning Part 1: Supervised Learning
 Bits of Machine Learning Part 1: Supervised Learning Alexandre Proutiere and Vahan Petrosyan KTH (The Royal Institute of Technology) Outline of the Course 1. Supervised Learning Regression and Classification
Probabilistic classification CE-717: Machine Learning Sharif University of Technology. M. Soleymani Fall 2016
 Probabilistic classification CE-717: Machine Learning Sharif University of Technology M. Soleymani Fall 2016 Topics Probabilistic approach Bayes decision theory Generative models Gaussian Bayes classifier
Midterm Review CS 7301: Advanced Machine Learning. Vibhav Gogate The University of Texas at Dallas
 Midterm Review CS 7301: Advanced Machine Learning Vibhav Gogate The University of Texas at Dallas Supervised Learning Issues in supervised learning What makes learning hard Point Estimation: MLE vs Bayesian
Statistical Pattern Recognition
 Statistical Pattern Recognition Feature Extraction Hamid R. Rabiee Jafar Muhammadi, Alireza Ghasemi, Payam Siyari Spring 2014 http://ce.sharif.edu/courses/92-93/2/ce725-2/ Agenda Dimensionality Reduction
Overview. Probabilistic Interpretation of Linear Regression Maximum Likelihood Estimation Bayesian Estimation MAP Estimation
 Overview Probabilistic Interpretation of Linear Regression Maximum Likelihood Estimation Bayesian Estimation MAP Estimation Probabilistic Interpretation: Linear Regression Assume output y is generated
Parametric Models. Dr. Shuang LIANG. School of Software Engineering TongJi University Fall, 2012
 Parametric Models Dr. Shuang LIANG School of Software Engineering TongJi University Fall, 2012 Today s Topics Maximum Likelihood Estimation Bayesian Density Estimation Today s Topics Maximum Likelihood