Models with qualitative explanatory variables p216
|
|
|
- Junior Montgomery
- 6 years ago
- Views:
Transcription
1 Models with qualitative explanatory variables p216 Example gen = 1 for female Row gpa hsm gen
2 gpa = hsm gen Constant hsm gen S = R-Sq = 19.1% R-Sq(adj) = 18.3% Regression Residual Error Total
3 If the qualitative variable had more than two levels (say, l levels) introduce l-1 dummy variables. Example Length = length of stay in hospital (days) Nnurses = Number of nurses Region : There are 4 regions: NC, NE, S and W Row length nnurses region NC NE S W NC S W NE NC S NC S NC S W NE S length = nnurses NC NE S Constant nnurses NC NE S S = R-Sq = 33.7% R-Sq(adj) = 31.3% Regression Residual Error Total
 Fit StDev Fit 95.")
 ( 6.350, 12.")
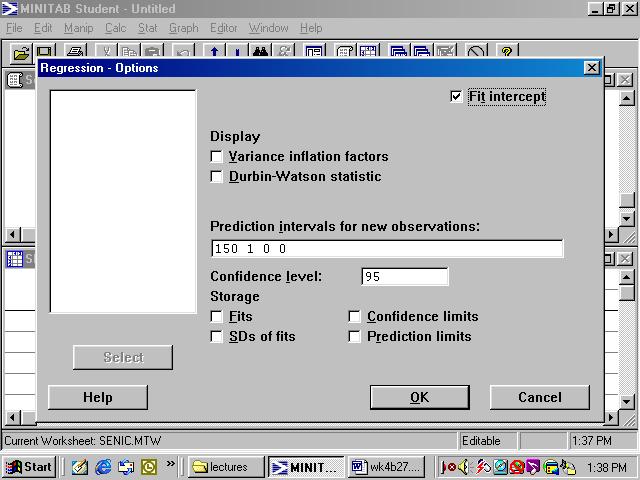
4 Predicted Values (at nnurses = 150, NC = 1, NE =0, S = 0) Fit StDev Fit 95.0% CI 95.0% PI ( 8.981, ) ( 6.350, ) MINITAB Commands 4
5 5
6 Example Row Blue Green Lemon Insects trapped Test whether some colors are more attractive than others to beetles. Insects trapped = Blue Green Lemon Constant Blue Green Lemon S = R-Sq = 82.1% R-Sq(adj) = 79.4% Regression Residual Error Total
7 A test for comparing nested models p231 Definition Two models are nested if one model contains all the terms of the second model and at least one additional term. The model with more terms is called the complete (or full) model. The model with fewer terms is called the reduced (or restricted) model. Example 4.10 p 223 (Data from Table 4.4 p214) Row wt distance cost wt*dist wt**2 diast** a) Fit a complete second order model. 7
8 cost = wt dist wt*dist wt** dist**2 Constant wt dist wt*dist wt** dist** S = R-Sq = 99.4% R-Sq(adj) = 99.2% Regression Residual Error Total Source DF Seq SS wt dist wt*dist wt** dist** Test the hypothesis that the terms wt**2 and dist**2 can be dropped from the model. 8
9 cost = wt distance wt*dist Constant wt distance wt*dist S = R-Sq = 98.5% R-Sq(adj) = 98.3% Regression Residual Error Total Ex 5.14, p270, 5.15, p271 9
10 Examples (STA221 Apr 98 Final Exam) Weight = Diameter diam**2 Constant Diameter diam** S = R-Sq = 99.9% R-Sq(adj) = 99.9% Regression Residual Error Total Source DF Seq SS Diameter diam** The test of significance for the contribution of the second order term in diameter has an F-value of (to the nearest 50) A) 7600 B) 5300 C) 2650 D) 600 E) 350 Weight = Diameter Height Constant Diameter Height S = R-Sq = 97.8% R-Sq(adj) = 97.4% Regression Residual Error Total
11 Weight = Diameter Height diam** ht**2 Constant Diameter Height diam** ht** S = R-Sq = 99.9% R-Sq(adj) = 99.9% Regression Residual Error Total Source DF Seq SS Diameter Height diam** ht** Residuals Versus Weight (response is Weight) Residual Weight
12 Residuals Versus Height (response is Weight) Residual Height Residuals Versus the Fitted Values (response is Weight) Residual Fitted Value Normal Probability Plot of the Residuals (response is Weight) 2 1 Normal Score Residual 12
13 Histogram of the Residuals (response is Weight) 4 3 Frequency Residual Weight = Diameter Height diam*ht Constant Diameter Height diam*ht S = R-Sq = 99.4% R-Sq(adj) = 99.2% Regression Residual Error Total ) Which of the following are true? I) If we test the extra contribution of both height and height squared to the model with only diameter and diameter squared, the calculated F-statistics would be lass than 2. II) If we test the extra contribution of adding both height squared and diameter squared to the to the first order model with just height and diameter, the calculated F-statistic is lass than 200 III) If we assume the appropriateness of the model with diameter, height and their product, we see that the effect on dry weight of an increase in diameter is not independent of the height of the trees. IV) Residual plots indicate problems with the second order model containing diameter, height and their respective squares. 13
14 -Sequential Sums of Squares Regression Analysis: cost versus wt, distance, wt*dist, wt**2, dist**2 cost = wt distance wt*dist wt** dist**2 Predictor Coef SE Coef T P Constant wt distance wt*dist wt** dist** S = R-Sq = 99.4% R-Sq(adj) = 99.2% Regression Residual Error Total Source DF Seq SS wt distance wt*dist wt** dist** Regression Analysis: cost versus wt cost = wt Predictor Coef SE Coef T P 14
15 Constant wt S = R-Sq = 59.8% R-Sq(adj) = 57.6% Regression Residual Error Total Regression Analysis: cost versus wt, distance cost = wt distance Predictor Coef SE Coef T P Constant wt distance S = R-Sq = 91.6% R-Sq(adj) = 90.6% Regression Residual Error Total Regression Analysis: cost versus wt, distance, wt*dist cost = wt distance wt*dist 15
16 Predictor Coef SE Coef T P Constant wt distance wt*dist S = R-Sq = 98.5% R-Sq(adj) = 98.3% Regression Residual Error Total Regression Analysis: cost versus wt, distance, wt*dist, wt**2 cost = wt distance wt*dist wt**2 Predictor Coef SE Coef T P Constant wt distance wt*dist wt** S = R-Sq = 99.4% R-Sq(adj) = 99.2% Regression Residual Error Total
17 Regression Analysis: cost versus wt, distance, wt*dist, wt**2, dist**2 cost = wt distance wt*dist wt** dist**2 Predictor Coef SE Coef T P Constant wt distance wt*dist wt** dist** S = R-Sq = 99.4% R-Sq(adj) = 99.2% Regression Residual Error Total
Model Building Chap 5 p251
 Model Building Chap 5 p251 Models with one qualitative variable, 5.7 p277 Example 4 Colours : Blue, Green, Lemon Yellow and white Row Blue Green Lemon Insects trapped 1 0 0 1 45 2 0 0 1 59 3 0 0 1 48 4
Confidence Interval for the mean response
 Week 3: Prediction and Confidence Intervals at specified x. Testing lack of fit with replicates at some x's. Inference for the correlation. Introduction to regression with several explanatory variables.
Multiple Regression Examples
 Multiple Regression Examples Example: Tree data. we have seen that a simple linear regression of usable volume on diameter at chest height is not suitable, but that a quadratic model y = β 0 + β 1 x +
Analysis of Bivariate Data
 Analysis of Bivariate Data Data Two Quantitative variables GPA and GAES Interest rates and indices Tax and fund allocation Population size and prison population Bivariate data (x,y) Case corr® 2 Independent
INFERENCE FOR REGRESSION
 CHAPTER 3 INFERENCE FOR REGRESSION OVERVIEW In Chapter 5 of the textbook, we first encountered regression. The assumptions that describe the regression model we use in this chapter are the following. We
School of Mathematical Sciences. Question 1
 School of Mathematical Sciences MTH5120 Statistical Modelling I Practical 8 and Assignment 7 Solutions Question 1 Figure 1: The residual plots do not contradict the model assumptions of normality, constant
23. Inference for regression
 23. Inference for regression The Practice of Statistics in the Life Sciences Third Edition 2014 W. H. Freeman and Company Objectives (PSLS Chapter 23) Inference for regression The regression model Confidence
STA 108 Applied Linear Models: Regression Analysis Spring Solution for Homework #6
 STA 8 Applied Linear Models: Regression Analysis Spring 011 Solution for Homework #6 6. a) = 11 1 31 41 51 1 3 4 5 11 1 31 41 51 β = β1 β β 3 b) = 1 1 1 1 1 11 1 31 41 51 1 3 4 5 β = β 0 β1 β 6.15 a) Stem-and-leaf
Predict y from (possibly) many predictors x. Model Criticism Study the importance of columns
 many predictors x. Model Criticism Study the importance of columns") Lecture Week Multiple Linear Regression Predict y from (possibly) many predictors x Including extra derived variables Model Criticism Study the importance of columns Draw on Scientific framework Experiment;
Lecture Week Multiple Linear Regression Predict y from (possibly) many predictors x Including extra derived variables Model Criticism Study the importance of columns Draw on Scientific framework Experiment;
Analysis of Covariance. The following example illustrates a case where the covariate is affected by the treatments.
 Analysis of Covariance In some experiments, the experimental units (subjects) are nonhomogeneous or there is variation in the experimental conditions that are not due to the treatments. For example, a
Orthogonal contrasts for a 2x2 factorial design Example p130
 Week 9: Orthogonal comparisons for a 2x2 factorial design. The general two-factor factorial arrangement. Interaction and additivity. ANOVA summary table, tests, CIs. Planned/post-hoc comparisons for the
Lecture 18: Simple Linear Regression
 Lecture 18: Simple Linear Regression BIOS 553 Department of Biostatistics University of Michigan Fall 2004 The Correlation Coefficient: r The correlation coefficient (r) is a number that measures the strength
Q Lecture Introduction to Regression
 Q3 2009 1 Before/After Transformation 2 Construction Role of T-ratios Formally, even under Null Hyp: H : 0, ˆ, being computed from k t k SE ˆ ˆ y values themselves containing random error, will sometimes
STAT 360-Linear Models
 STAT 360-Linear Models Instructor: Yogendra P. Chaubey Sample Test Questions Fall 004 Note: The following questions are from previous tests and exams. The final exam will be for three hours and will contain
Steps for Regression. Simple Linear Regression. Data. Example. Residuals vs. X. Scatterplot. Make a Scatter plot Does it make sense to plot a line?
 Steps for Regression Simple Linear Regression Make a Scatter plot Does it make sense to plot a line? Check Residual Plot (Residuals vs. X) Are there any patterns? Check Histogram of Residuals Is it Normal?
(4) 1. Create dummy variables for Town. Name these dummy variables A and B. These 0,1 variables now indicate the location of the house.
 1. Create dummy variables for Town. Name these dummy variables A and B. These 0,1 variables now indicate the location of the house.") Exam 3 Resource Economics 312 Introductory Econometrics Please complete all questions on this exam. The data in the spreadsheet: Exam 3- Home Prices.xls are to be used for all analyses. These data are
Exam 3 Resource Economics 312 Introductory Econometrics Please complete all questions on this exam. The data in the spreadsheet: Exam 3- Home Prices.xls are to be used for all analyses. These data are
Inferences for linear regression (sections 12.1, 12.2)
") Inferences for linear regression (sections 12.1, 12.2) Regression case history: do bigger national parks help prevent extinction? ex. area of natural reserves and extinction: 6 national parks in Tanzania
Inferences for linear regression (sections 12.1, 12.2) Regression case history: do bigger national parks help prevent extinction? ex. area of natural reserves and extinction: 6 national parks in Tanzania
SMAM 314 Exam 42 Name
 SMAM 314 Exam 42 Name Mark the following statements True (T) or False (F) (10 points) 1. F A. The line that best fits points whose X and Y values are negatively correlated should have a positive slope.
Inference for the Regression Coefficient
 Inference for the Regression Coefficient Recall, b 0 and b 1 are the estimates of the slope β 1 and intercept β 0 of population regression line. We can shows that b 0 and b 1 are the unbiased estimates
The simple linear regression model discussed in Chapter 13 was written as
 1519T_c14 03/27/2006 07:28 AM Page 614 Chapter Jose Luis Pelaez Inc/Blend Images/Getty Images, Inc./Getty Images, Inc. 14 Multiple Regression 14.1 Multiple Regression Analysis 14.2 Assumptions of the Multiple
SMAM 314 Computer Assignment 5 due Nov 8,2012 Data Set 1. For each of the following data sets use Minitab to 1. Make a scatterplot.
 SMAM 314 Computer Assignment 5 due Nov 8,2012 Data Set 1. For each of the following data sets use Minitab to 1. Make a scatterplot. 2. Fit the linear regression line. Regression Analysis: y versus x y
Correlation & Simple Regression
 Chapter 11 Correlation & Simple Regression The previous chapter dealt with inference for two categorical variables. In this chapter, we would like to examine the relationship between two quantitative variables.
PART I. (a) Describe all the assumptions for a normal error regression model with one predictor variable,
 Describe all the assumptions for a normal error regression model with one predictor variable,") Concordia University Department of Mathematics and Statistics Course Number Section Statistics 360/2 01 Examination Date Time Pages Final December 2002 3 hours 6 Instructors Course Examiner Marks Y.P.
Concordia University Department of Mathematics and Statistics Course Number Section Statistics 360/2 01 Examination Date Time Pages Final December 2002 3 hours 6 Instructors Course Examiner Marks Y.P.
Chapter 14. Multiple Regression Models. Multiple Regression Models. Multiple Regression Models
 Chapter 14 Multiple Regression Models 1 Multiple Regression Models A general additive multiple regression model, which relates a dependent variable y to k predictor variables,,, is given by the model equation
Histogram of Residuals. Residual Normal Probability Plot. Reg. Analysis Check Model Utility. (con t) Check Model Utility. Inference.
 Check Model Utility. Inference.") Steps for Regression Simple Linear Regression Make a Scatter plot Does it make sense to plot a line? Check Residual Plot (Residuals vs. X) Are there any patterns? Check Histogram of Residuals Is it Normal?
Steps for Regression Simple Linear Regression Make a Scatter plot Does it make sense to plot a line? Check Residual Plot (Residuals vs. X) Are there any patterns? Check Histogram of Residuals Is it Normal?
Simple Linear Regression. Steps for Regression. Example. Make a Scatter plot. Check Residual Plot (Residuals vs. X)
") Simple Linear Regression 1 Steps for Regression Make a Scatter plot Does it make sense to plot a line? Check Residual Plot (Residuals vs. X) Are there any patterns? Check Histogram of Residuals Is it Normal?
Simple Linear Regression 1 Steps for Regression Make a Scatter plot Does it make sense to plot a line? Check Residual Plot (Residuals vs. X) Are there any patterns? Check Histogram of Residuals Is it Normal?
[4+3+3] Q 1. (a) Describe the normal regression model through origin. Show that the least square estimator of the regression parameter is given by
![[4+3+3] Q 1. (a) Describe the normal regression model through origin. Show that the least square estimator of the regression parameter is given by](/thumbs/75/71895393.jpg "[4+3+3] Q 1. (a) Describe the normal regression model through origin. Show that the least square estimator of the regression parameter is given by") Concordia University Department of Mathematics and Statistics Course Number Section Statistics 360/1 40 Examination Date Time Pages Final June 2004 3 hours 7 Instructors Course Examiner Marks Y.P. Chaubey
Concordia University Department of Mathematics and Statistics Course Number Section Statistics 360/1 40 Examination Date Time Pages Final June 2004 3 hours 7 Instructors Course Examiner Marks Y.P. Chaubey
STA220H1F Term Test Oct 26, Last Name: First Name: Student #: TA s Name: or Tutorial Room:
 STA0HF Term Test Oct 6, 005 Last Name: First Name: Student #: TA s Name: or Tutorial Room: Time allowed: hour and 45 minutes. Aids: one sided handwritten aid sheet + non-programmable calculator Statistical
1 Introduction to Minitab
 1 Introduction to Minitab Minitab is a statistical analysis software package. The software is freely available to all students and is downloadable through the Technology Tab at my.calpoly.edu. When you
SMAM 319 Exam 1 Name. 1.Pick the best choice for the multiple choice questions below (10 points 2 each)
") SMAM 319 Exam 1 Name 1.Pick the best choice for the multiple choice questions below (10 points 2 each) A b In Metropolis there are some houses for sale. Superman and Lois Lane are interested in the average
SMAM 319 Exam 1 Name 1.Pick the best choice for the multiple choice questions below (10 points 2 each) A b In Metropolis there are some houses for sale. Superman and Lois Lane are interested in the average
Ch 13 & 14 - Regression Analysis
 Ch 3 & 4 - Regression Analysis Simple Regression Model I. Multiple Choice:. A simple regression is a regression model that contains a. only one independent variable b. only one dependent variable c. more
Interpreting the coefficients
 Lecture Week 5 Multiple Linear Regression Interpreting the coefficients Uses of Multiple Regression Predict for specified new x-vars Predict in time. Focus on one parameter Use regression to adjust variation
SMAM 314 Practice Final Examination Winter 2003
 SMAM 314 Practice Final Examination Winter 2003 You may use your textbook, one page of notes and a calculator. Please hand in the notes with your exam. 1. Mark the following statements True T or False
Apart from this page, you are not permitted to read the contents of this question paper until instructed to do so by an invigilator.
 B. Sc. Examination by course unit 2014 MTH5120 Statistical Modelling I Duration: 2 hours Date and time: 16 May 2014, 1000h 1200h Apart from this page, you are not permitted to read the contents of this
1. Least squares with more than one predictor
 Statistics 1 Lecture ( November ) c David Pollard Page 1 Read M&M Chapter (skip part on logistic regression, pages 730 731). Read M&M pages 1, for ANOVA tables. Multiple regression. 1. Least squares with
School of Mathematical Sciences. Question 1. Best Subsets Regression
 School of Mathematical Sciences MTH5120 Statistical Modelling I Practical 9 and Assignment 8 Solutions Question 1 Best Subsets Regression Response is Crime I n W c e I P a n A E P U U l e Mallows g E P
Stat 501, F. Chiaromonte. Lecture #8
 Stat 501, F. Chiaromonte Lecture #8 Data set: BEARS.MTW In the minitab example data sets (for description, get into the help option and search for "Data Set Description"). Wild bears were anesthetized,
Basic Business Statistics, 10/e
 Chapter 4 4- Basic Business Statistics th Edition Chapter 4 Introduction to Multiple Regression Basic Business Statistics, e 9 Prentice-Hall, Inc. Chap 4- Learning Objectives In this chapter, you learn:
Simple Linear Regression: A Model for the Mean. Chap 7
 Simple Linear Regression: A Model for the Mean Chap 7 An Intermediate Model (if the groups are defined by values of a numeric variable) Separate Means Model Means fall on a straight line function of the
Chapter 26 Multiple Regression, Logistic Regression, and Indicator Variables
 Chapter 26 Multiple Regression, Logistic Regression, and Indicator Variables 26.1 S 4 /IEE Application Examples: Multiple Regression An S 4 /IEE project was created to improve the 30,000-footlevel metric
Introduction to Regression
 Introduction to Regression Using Mult Lin Regression Derived variables Many alternative models Which model to choose? Model Criticism Modelling Objective Model Details Data and Residuals Assumptions 1
assumes a linear relationship between mean of Y and the X s with additive normal errors the errors are assumed to be a sample from N(0, σ 2 )
") Multiple Linear Regression is used to relate a continuous response (or dependent) variable Y to several explanatory (or independent) (or predictor) variables X 1, X 2,, X k assumes a linear relationship
Multiple Linear Regression is used to relate a continuous response (or dependent) variable Y to several explanatory (or independent) (or predictor) variables X 1, X 2,, X k assumes a linear relationship
MBA Statistics COURSE #4
 MBA Statistics 51-651-00 COURSE #4 Simple and multiple linear regression What should be the sales of ice cream? Example: Before beginning building a movie theater, one must estimate the daily number of
Contents. 2 2 factorial design 4
 Contents TAMS38 - Lecture 10 Response surface methodology Lecturer: Zhenxia Liu Department of Mathematics - Mathematical Statistics 12 December, 2017 2 2 factorial design Polynomial Regression model First
Multiple Regression. Inference for Multiple Regression and A Case Study. IPS Chapters 11.1 and W.H. Freeman and Company
 Multiple Regression Inference for Multiple Regression and A Case Study IPS Chapters 11.1 and 11.2 2009 W.H. Freeman and Company Objectives (IPS Chapters 11.1 and 11.2) Multiple regression Data for multiple
Institutionen för matematik och matematisk statistik Umeå universitet November 7, Inlämningsuppgift 3. Mariam Shirdel
 Institutionen för matematik och matematisk statistik Umeå universitet November 7, 2011 Inlämningsuppgift 3 Mariam Shirdel (mash0007@student.umu.se) Kvalitetsteknik och försöksplanering, 7.5 hp 1 Uppgift
(1) The explanatory or predictor variables may be qualitative. (We ll focus on examples where this is the case.)
 The explanatory or predictor variables may be qualitative. (We ll focus on examples where this is the case.)") Introduction to Analysis of Variance Analysis of variance models are similar to regression models, in that we re interested in learning about the relationship between a dependent variable (a response)
Introduction to Analysis of Variance Analysis of variance models are similar to regression models, in that we re interested in learning about the relationship between a dependent variable (a response)
SMAM 319 Exam1 Name. a B.The equation of a line is 3x + y =6. The slope is a. -3 b.3 c.6 d.1/3 e.-1/3
 SMAM 319 Exam1 Name 1. Pick the best choice. (10 points-2 each) _c A. A data set consisting of fifteen observations has the five number summary 4 11 12 13 15.5. For this data set it is definitely true
Conditions for Regression Inference:
 AP Statistics Chapter Notes. Inference for Linear Regression We can fit a least-squares line to any data relating two quantitative variables, but the results are useful only if the scatterplot shows a
EXAMINATIONS OF THE ROYAL STATISTICAL SOCIETY
 EXAMINATIONS OF THE ROYAL STATISTICAL SOCIETY HIGHER CERTIFICATE IN STATISTICS, 2011 MODULE 4 : Linear models Time allowed: One and a half hours Candidates should answer THREE questions. Each question
Examination paper for TMA4255 Applied statistics
 Department of Mathematical Sciences Examination paper for TMA4255 Applied statistics Academic contact during examination: Anna Marie Holand Phone: 951 38 038 Examination date: 16 May 2015 Examination time
AP Statistics Unit 6 Note Packet Linear Regression. Scatterplots and Correlation
 Scatterplots and Correlation Name Hr A scatterplot shows the relationship between two quantitative variables measured on the same individuals. variable (y) measures an outcome of a study variable (x) may
Introduction to Regression
 Introduction to Regression Using Mult Lin Regression Derived variables Many alternative models Which model to choose? Model Criticism Modelling Objective Model Details Data and Residuals Assumptions 1
AP Statistics Bivariate Data Analysis Test Review. Multiple-Choice
 Name Period AP Statistics Bivariate Data Analysis Test Review Multiple-Choice 1. The correlation coefficient measures: (a) Whether there is a relationship between two variables (b) The strength of the
28. SIMPLE LINEAR REGRESSION III
 28. SIMPLE LINEAR REGRESSION III Fitted Values and Residuals To each observed x i, there corresponds a y-value on the fitted line, y = βˆ + βˆ x. The are called fitted values. ŷ i They are the values of
Multiple Regression Methods
 Chapter 1: Multiple Regression Methods Hildebrand, Ott and Gray Basic Statistical Ideas for Managers Second Edition 1 Learning Objectives for Ch. 1 The Multiple Linear Regression Model How to interpret
EXAM IN TMA4255 EXPERIMENTAL DESIGN AND APPLIED STATISTICAL METHODS
 Norges teknisk naturvitenskapelige universitet Institutt for matematiske fag Side 1 av 8 Contact during exam: Bo Lindqvist Tel. 975 89 418 EXAM IN TMA4255 EXPERIMENTAL DESIGN AND APPLIED STATISTICAL METHODS
Multiple Linear Regression
 Andrew Lonardelli December 20, 2013 Multiple Linear Regression 1 Table Of Contents Introduction: p.3 Multiple Linear Regression Model: p.3 Least Squares Estimation of the Parameters: p.4-5 The matrix approach
TMA4255 Applied Statistics V2016 (5)
") TMA4255 Applied Statistics V2016 (5) Part 2: Regression Simple linear regression [11.1-11.4] Sum of squares [11.5] Anna Marie Holand To be lectured: January 26, 2016 wiki.math.ntnu.no/tma4255/2016v/start
TMA4255 Applied Statistics V2016 (5) Part 2: Regression Simple linear regression [11.1-11.4] Sum of squares [11.5] Anna Marie Holand To be lectured: January 26, 2016 wiki.math.ntnu.no/tma4255/2016v/start
This document contains 3 sets of practice problems.
 P RACTICE PROBLEMS This document contains 3 sets of practice problems. Correlation: 3 problems Regression: 4 problems ANOVA: 8 problems You should print a copy of these practice problems and bring them
LINEAR REGRESSION ANALYSIS. MODULE XVI Lecture Exercises
 LINEAR REGRESSION ANALYSIS MODULE XVI Lecture - 44 Exercises Dr. Shalabh Department of Mathematics and Statistics Indian Institute of Technology Kanpur Exercise 1 The following data has been obtained on
Multiple Regression: Chapter 13. July 24, 2015
 Multiple Regression: Chapter 13 July 24, 2015 Multiple Regression (MR) Response Variable: Y - only one response variable (quantitative) Several Predictor Variables: X 1, X 2, X 3,..., X p (p = # predictors)
Oregon Hill Wireless Survey Regression Model and Statistical Evaluation. Sky Huvard
 Oregon Hill Wireless Survey Regression Model and Statistical Evaluation Sky Huvard Business Statistics Dr. George Canavos 4 May 2003 Overview Huvard 2 I am interested in starting a wireless broadband project
STAB27-Winter Term test February 18,2006. There are 14 pages including this page. Please check to see you have all the pages.
 STAB27-Winter 2006 Term test February 8,2006 Last Name: First Name: Student #: Tutorial Section / Room: Dayffime (Tutorial): INSTRUCTIONS Duration: hour, 45 minutes Statistical table(s) attached at the
Chapter 12: Multiple Regression
 Chapter 12: Multiple Regression 12.1 a. A scatterplot of the data is given here: Plot of Drug Potency versus Dose Level Potency 0 5 10 15 20 25 30 0 5 10 15 20 25 30 35 Dose Level b. ŷ = 8.667 + 0.575x
STAT 212 Business Statistics II 1
 STAT 1 Business Statistics II 1 KING FAHD UNIVERSITY OF PETROLEUM & MINERALS DEPARTMENT OF MATHEMATICAL SCIENCES DHAHRAN, SAUDI ARABIA STAT 1: BUSINESS STATISTICS II Semester 091 Final Exam Thursday Feb
STATISTICS 110/201 PRACTICE FINAL EXAM
 STATISTICS 110/201 PRACTICE FINAL EXAM Questions 1 to 5: There is a downloadable Stata package that produces sequential sums of squares for regression. In other words, the SS is built up as each variable
Final Exam - Solutions
 Ecn 102 - Analysis of Economic Data University of California - Davis March 19, 2010 Instructor: John Parman Final Exam - Solutions You have until 5:30pm to complete this exam. Please remember to put your
Review of Regression Basics
 Review of Regression Basics When describing a Bivariate Relationship: Make a Scatterplot Strength, Direction, Form Model: y-hat=a+bx Interpret slope in context Make Predictions Residual = Observed-Predicted
Six Sigma Black Belt Study Guides
 Six Sigma Black Belt Study Guides 1 www.pmtutor.org Powered by POeT Solvers Limited. Analyze Correlation and Regression Analysis 2 www.pmtutor.org Powered by POeT Solvers Limited. Variables and relationships
Stat 231 Final Exam. Consider first only the measurements made on housing number 1.
 December 16, 1997 Stat 231 Final Exam Professor Vardeman 1. The first page of printout attached to this exam summarizes some data (collected by a student group) on the diameters of holes bored in certain
Chapter 10. Correlation and Regression. Lecture 1 Sections:
 Chapter 10 Correlation and Regression Lecture 1 Sections: 10.1 10. You will now be introduced to important methods for making inferences based on sample data that come in pairs. In the previous chapter,
Concordia University (5+5)Q 1.
Q 1.") (5+5)Q 1. Concordia University Department of Mathematics and Statistics Course Number Section Statistics 360/1 40 Examination Date Time Pages Mid Term Test May 26, 2004 Two Hours 3 Instructor Course Examiner
(5+5)Q 1. Concordia University Department of Mathematics and Statistics Course Number Section Statistics 360/1 40 Examination Date Time Pages Mid Term Test May 26, 2004 Two Hours 3 Instructor Course Examiner
Final Exam Bus 320 Spring 2000 Russell
 Name Final Exam Bus 320 Spring 2000 Russell Do not turn over this page until you are told to do so. You will have 3 hours minutes to complete this exam. The exam has a total of 100 points and is divided
Question Possible Points Score Total 100
 Midterm I NAME: Instructions: 1. For hypothesis testing, the significant level is set at α = 0.05. 2. This exam is open book. You may use textbooks, notebooks, and a calculator. 3. Do all your work in
Data Set 8: Laysan Finch Beak Widths
 Data Set 8: Finch Beak Widths Statistical Setting This handout describes an analysis of covariance (ANCOVA) involving one categorical independent variable (with only two levels) and one quantitative covariate.
Solution: X = , Y = = = = =
 Q1.19) Grade point average. The director of admissions of a small college selected 120 students at random from the new freshman class in a study to determine whether a student's grade point average (OPA)
Ph.D. Preliminary Examination Statistics June 2, 2014
 Ph.D. Preliminary Examination Statistics June, 04 NOTES:. The exam is worth 00 points.. Partial credit may be given for partial answers if possible.. There are 5 pages in this exam paper. I have neither
1 Use of indicator random variables. (Chapter 8)
") 1 Use of indicator random variables. (Chapter 8) let I(A) = 1 if the event A occurs, and I(A) = 0 otherwise. I(A) is referred to as the indicator of the event A. The notation I A is often used. 1 2 Fitting
1 Use of indicator random variables. (Chapter 8) let I(A) = 1 if the event A occurs, and I(A) = 0 otherwise. I(A) is referred to as the indicator of the event A. The notation I A is often used. 1 2 Fitting
Is economic freedom related to economic growth?
 Is economic freedom related to economic growth? It is an article of faith among supporters of capitalism: economic freedom leads to economic growth. The publication Economic Freedom of the World: 2003
Multiple Regression an Introduction. Stat 511 Chap 9
 Multiple Regression an Introduction Stat 511 Chap 9 1 case studies meadowfoam flowers brain size of mammals 2 case study 1: meadowfoam flowering designed experiment carried out in a growth chamber general
Inference for Regression Inference about the Regression Model and Using the Regression Line
 Inference for Regression Inference about the Regression Model and Using the Regression Line PBS Chapter 10.1 and 10.2 2009 W.H. Freeman and Company Objectives (PBS Chapter 10.1 and 10.2) Inference about
Chapter 14 Multiple Regression Analysis
 Chapter 14 Multiple Regression Analysis 1. a. Multiple regression equation b. the Y-intercept c. $374,748 found by Y ˆ = 64,1 +.394(796,) + 9.6(694) 11,6(6.) (LO 1) 2. a. Multiple regression equation b.
MULTIPLE REGRESSION METHODS
 DEPARTMENT OF POLITICAL SCIENCE AND INTERNATIONAL RELATIONS Posc/Uapp 816 MULTIPLE REGRESSION METHODS I. AGENDA: A. Residuals B. Transformations 1. A useful procedure for making transformations C. Reading:
[ ESS ESS ] / 2 [ ] / ,019.6 / Lab 10 Key. Regression Analysis: wage versus yrsed, ex
![[ ESS ESS ] / 2 [ ] / ,019.6 / Lab 10 Key. Regression Analysis: wage versus yrsed, ex](/thumbs/73/69434936.jpg "[ ESS ESS ] / 2 [ ] / ,019.6 / Lab 10 Key. Regression Analysis: wage versus yrsed, ex") Lab 1 Key Regression Analysis: wage versus yrsed, ex wage = - 4.78 + 1.46 yrsed +.126 ex Constant -4.78 2.146-2.23.26 yrsed 1.4623.153 9.73. ex.12635.2739 4.61. S = 8.9851 R-Sq = 11.9% R-Sq(adj) = 11.7%
Lab 1 Key Regression Analysis: wage versus yrsed, ex wage = - 4.78 + 1.46 yrsed +.126 ex Constant -4.78 2.146-2.23.26 yrsed 1.4623.153 9.73. ex.12635.2739 4.61. S = 8.9851 R-Sq = 11.9% R-Sq(adj) = 11.7%
EX1. One way ANOVA: miles versus Plug. a) What are the hypotheses to be tested? b) What are df 1 and df 2? Verify by hand. , y 3
 What are the hypotheses to be tested? b) What are df 1 and df 2? Verify by hand. , y 3") EX. Chapter 8 Examples In an experiment to investigate the performance of four different brands of spark plugs intended for the use on a motorcycle, plugs of each brand were tested and the number of miles
EX. Chapter 8 Examples In an experiment to investigate the performance of four different brands of spark plugs intended for the use on a motorcycle, plugs of each brand were tested and the number of miles
1. An article on peanut butter in Consumer reports reported the following scores for various brands
 SMAM 314 Review Exam 1 1. An article on peanut butter in Consumer reports reported the following scores for various brands Creamy 56 44 62 36 39 53 50 65 45 40 56 68 41 30 40 50 50 56 65 56 45 40 Crunchy
UNIVERSITY OF TORONTO SCARBOROUGH Department of Computer and Mathematical Sciences Midterm Test, October 2013
 UNIVERSITY OF TORONTO SCARBOROUGH Department of Computer and Mathematical Sciences Midterm Test, October 2013 STAC67H3 Regression Analysis Duration: One hour and fifty minutes Last Name: First Name: Student
MULTIPLE LINEAR REGRESSION IN MINITAB
 MULTIPLE LINEAR REGRESSION IN MINITAB This document shows a complicated Minitab multiple regression. It includes descriptions of the Minitab commands, and the Minitab output is heavily annotated. Comments
2.4.3 Estimatingσ Coefficient of Determination 2.4. ASSESSING THE MODEL 23
 2.4. ASSESSING THE MODEL 23 2.4.3 Estimatingσ 2 Note that the sums of squares are functions of the conditional random variables Y i = (Y X = x i ). Hence, the sums of squares are random variables as well.
LEARNING WITH MINITAB Chapter 12 SESSION FIVE: DESIGNING AN EXPERIMENT
 LEARNING WITH MINITAB Chapter 12 SESSION FIVE: DESIGNING AN EXPERIMENT Laura M Williams, RN, CLNC, MSN MOREHEAD STATE UNIVERSITY IET603: STATISTICAL QUALITY ASSURANCE IN SCIENCE AND TECHNOLOGY DR. AHMAD
STAT 212: BUSINESS STATISTICS II Third Exam Tuesday Dec 12, 6:00 PM
 STAT212_E3 KING FAHD UNIVERSITY OF PETROLEUM & MINERALS DEPARTMENT OF MATHEMATICS & STATISTICS Term 171 Page 1 of 9 STAT 212: BUSINESS STATISTICS II Third Exam Tuesday Dec 12, 2017 @ 6:00 PM Name: ID #:
STAT 213 Interactions in Two-Way ANOVA
 STAT 213 Interactions in Two-Way ANOVA Colin Reimer Dawson Oberlin College 14 April 2016 Outline Last Time: Two-Way ANOVA Interaction Terms Reading Quiz (Multiple Choice) If there is no interaction present,
Contents. TAMS38 - Lecture 10 Response surface. Lecturer: Jolanta Pielaszkiewicz. Response surface 3. Response surface, cont. 4
 Contents TAMS38 - Lecture 10 Response surface Lecturer: Jolanta Pielaszkiewicz Matematisk statistik - Matematiska institutionen Linköpings universitet Look beneath the surface; let not the several quality
Business 320, Fall 1999, Final
 Business 320, Fall 1999, Final name You may use a calculator and two cheat sheets. You have 3 hours. I pledge my honor that I have not violated the Honor Code during this examination. Obvioiusly, you may
Correlation and Linear Regression
 Correlation and Linear Regression Correlation: Relationships between Variables So far, nearly all of our discussion of inferential statistics has focused on testing for differences between group means
MISCELLANEOUS REGRESSION TOPICS
 DEPARTMENT OF POLITICAL SCIENCE AND INTERNATIONAL RELATIONS Posc/Uapp 816 MISCELLANEOUS REGRESSION TOPICS I. AGENDA: A. Example of correcting for autocorrelation. B. Regression with ordinary independent
22S39: Class Notes / November 14, 2000 back to start 1
 Model diagnostics Interpretation of fitted regression model 22S39: Class Notes / November 14, 2000 back to start 1 Model diagnostics 22S39: Class Notes / November 14, 2000 back to start 2 Model diagnostics
Stat 529 (Winter 2011) A simple linear regression (SLR) case study. Mammals brain weights and body weights
 A simple linear regression (SLR) case study. Mammals brain weights and body weights") Stat 529 (Winter 2011) A simple linear regression (SLR) case study Reading: Sections 8.1 8.4, 8.6, 8.7 Mammals brain weights and body weights Questions of interest Scatterplots of the data Log transforming
Stat 529 (Winter 2011) A simple linear regression (SLR) case study Reading: Sections 8.1 8.4, 8.6, 8.7 Mammals brain weights and body weights Questions of interest Scatterplots of the data Log transforming
MORE ON MULTIPLE REGRESSION
 DEPARTMENT OF POLITICAL SCIENCE AND INTERNATIONAL RELATIONS Posc/Uapp 816 MORE ON MULTIPLE REGRESSION I. AGENDA: A. Multiple regression 1. Categorical variables with more than two categories 2. Interaction