Simple Linear Regression: A Model for the Mean. Chap 7
|
|
|
- Lambert Ray
- 5 years ago
- Views:
Transcription
1 Simple Linear Regression: A Model for the Mean Chap 7
2 An Intermediate Model (if the groups are defined by values of a numeric variable) Separate Means Model Means fall on a straight line function of the group values Equal Means Model 2
3 Meaning of the Word Regression statistical meaning not related to the usual English definition of regression misnomer, but there s a historical reason refers to finding the best fitting (straight line) relationship between the mean of Y and values of the variable defining the groups (X) 3
4 Galton s data 75 height of son height of father 4
5 Case Study Hubble data (from 92 s) observational data each point represents a nebula Y distance of the nebula X recession velocity of the nebula 5
6 Case Study don t worry about the geometry, but Big Bang theory implies that Y = const. * X (i.e. a straight line relationship between Y and X, with intercept ) furthermore, const. should be the age of the universe 6
7 Case Study 2 DISTANCE 5 VELOCITY 7
8 Case Study Regression methods can help answer big cosmological questions: Is the Big Bang theory correct? is the intercept of the straight-line relationship? How old is the universe? what is the slope of the straight-line relationship? 8
9 Case Study 2 designed experiment response variable (Y) ph of steer carcass explanatory variable (X) log time (hours) after slaughter what is the approximate ph of a particular steer carcass 3 hours after slaughter? about how long do you have to wait after slaughter for the ph to reach 6.? 9
10 Case Study PH PH TIME log(time) 2
11 Regression Analysis statistical methods based on describing the distribution of values of one variable (Y the response variable) as a function of the other variable (X the explanatory variable) simple linear regression: the function is a straight line function
12 Regression Analysis specifically, the mean of Y is a straight line function of X µ{y X} = β + β X where β is the intercept and β is the slope the standard deviation of Y is constant σ{y X} = σ the distribution of values of Y for any value of X is normal 2

13 Simple Linear Regression Model LINEARITY The mean response, µ, has a straight-line relationship with X, (µ{y X}= β + β X). ASSUMPTIONS NORMALITY For any given X, Y is normally distributed around µ{y X}. y x µ y = β + β x EQUAL STANDARD DEVIATION The standard deviation(σ) of Y is the same for all values of X. INDEPENDENCE Observations are independent of each other. 3
14 Simple Linear Regression Model Response Explanatory µ { Y X} = β + β X Regression coefficents 4
15 Simple Linear Regression Model Response Regressor µ { Y X} = β + β X Intercept Slope 5
16 Interpretation of coefficients slope: for a -unit change in X, Y changes by β units on average intercept: when X is, the mean value of Y is β 6
17 Simple Linear Regression Model advantage relative to separate means model interpolation: making inferences about the distribution of Y for X values not actually included in the data set (but within the range of the observed X values e.g. estimating the mean ph of carcasses 2.5 hours after slaughter) danger relative to separate means model extrapolation: making inferences about the distribution of Y for X values outside the range of the observed X values (e.g. estimating the mean ph of carcasses 2 hours after slaughter) 7
18 Estimating β, β and σ we can t just calculate means to estimate β and β (like we did in ANOVA) strategy: use least squares to find best fitting line; then use slope and intercept of best fitting line as estimates true slope and intercept 8
19 Least squares find the straight line that minimizes Σ(res i ) 2 µ{y X} = β +β X fit i Y i res i = Y i -fit i 9
20 Formulas for estimators the least squares principle is just for background 2 ) ˆ ˆ ˆ ) ( ) )( ( ˆ 2 2 = = = = = n res X Y X X Y Y X X i n i i n i i i ( σ β β β 2
21 Degrees of Freedom n-2 here n-i in one way ANOVA n- in one-sample t tools in general, df = (number of observations) (number of parameters in model for the means) 2
22 Standard Errors ) ( ) ( ˆ ) ˆ ( ) ( ˆ ) ˆ ( = + = = n X X s where s n X n SE s n SE i X X X σ β σ β 22
23 Inferences with these estimators and standard errors, you can test hypotheses about and compute confidence intervals for β and β in the usual way e.g. est. +/- t (df)(-α/2) SE(est.) based on the t-distribution with n-2 degrees of freedom 23
24 Regression Software in practice you never need to hand-calculate these estimators nor their standard errors but you might have to hand-calculate tests or confidence intervals MINITAB and S-Plus Hubble data: test the null hypothesis that β = estimate β 24

25 25

26 26
27 Hubble data Regression Analysis: DISTANCE versus VELOCITY ˆ ˆβ ( ˆ β σˆ SE β ) SE( ˆ β ) The regression equation is DISTANCE = VELOCITY Predictor Coef SE Coef T P Constant VELOCITY S =.45 R-Sq = 62.4% R-Sq(adj) = 6.6% 27
28 Hubble data Regression Analysis: DISTANCE versus VELOCITY The regression equation is DISTANCE = VELOCITY Predictor Coef SE Coef T P Constant VELOCITY S =.45 R-Sq = 62.4% R-Sq(adj) = 6.6% Since p=.3, the simple Big Bang theory is not correct 28
29 Hubble data Regression Analysis: DISTANCE versus VELOCITY The regression equation is DISTANCE = VELOCITY ˆβ SE( ˆ β ) Predictor Coef SE Coef T P Constant VELOCITY S =.45 R-Sq = 62.4% R-Sq(adj) = 6.6% 29
30 Hubble data hand calculate confidence interval for β /- 2.7 (.2274) = (.98,.844) or roughly (.89,.8) billion years 3
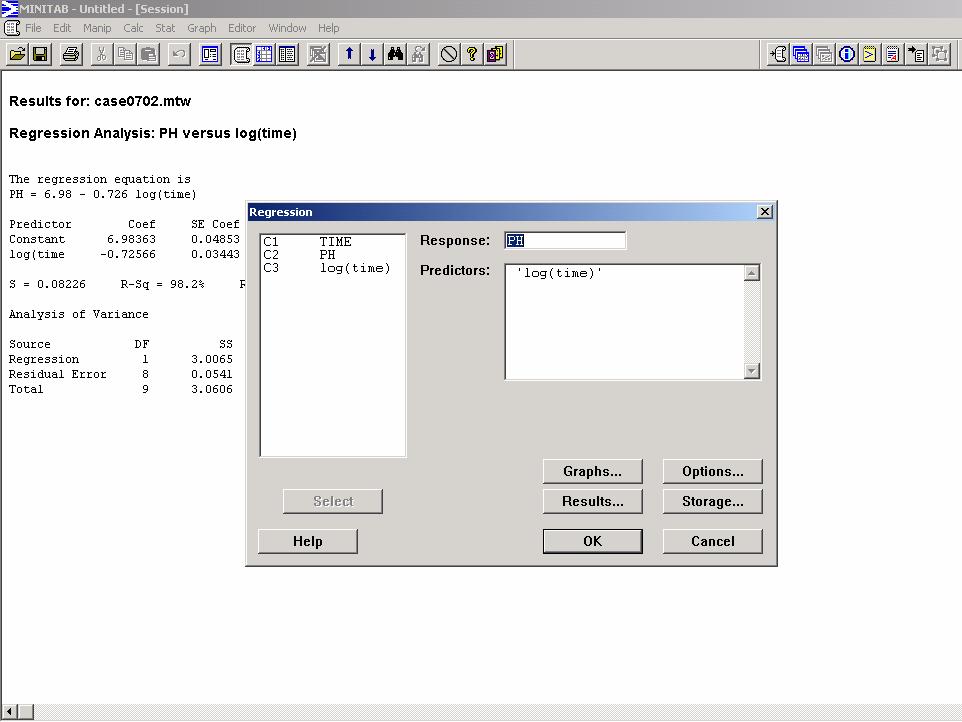
31 ph data Regression Analysis: PH versus log(time) The regression equation is PH = log(time) Predictor Coef SE Coef T P Constant log(time S =.8226 R-Sq = 98.2% R-Sq(adj) = 98.% (but these statistics don t answer the questions of interest to us) 3
32 Three New Kinds of Inference. Estimating the mean value of Y at some specified value X=X (e.g. What is the mean ph of steer carcasses 3 hours after slaughter?) ˆ{ µ Y X } = ˆ β + ˆ β X SE( ˆ{ µ Y X }) = σˆ n + ( X ( n X ) ) s 2 x 2 32
33 Three New Kinds of Inference 2. Predicting the value of Y for a specific individual at some specified value X=X (e.g. What is the ph of a particular steer s Garth s -- carcass 3 hours after slaughter?) pred{ Y X } = ˆ β + ˆ β X SE( pred{ Y X }) = ˆ σ + n + ( X ( n X ) ) s 2 x 2 = ˆ σ 2 + SE( ˆ{ µ Y X }) 2 33
34 Three New Kinds of Inference 3. Estimating the value of X that results in Y=Y (inverse prediction or calibration) (e.g. About how long do you have to wait after slaughter for the mean ph to reach 6.?) Xˆ = Y ˆ β ˆ β SE( Xˆ ) = SE( ˆ{ µ Y ˆ β Xˆ }) or SE( pred{ Y ˆ β Xˆ }) 34
35 Software for first two inferences MINITAB easy SPlus a little harder (for me) 35
36 36

37 37
38 ˆ µ { Y X } SE ( ˆ{ µ Y X }) ˆ{ Y X } ± t( n 2)(.975) SE( ˆ{ µ Y X }) µ Predicted Values for New Observations New Obs Fit SE Fit 95.% CI 95.% PI ( 6.257, ) ( 5.987, ) Values of Predictors for New Observations New Obs log(time. pred{ Y X } ± t( n 2)(.975) SE( pred{ Y X }) X = ln(3.)=.99 38
39 Hand calculations for inverse estimation for Y =6 Xˆ = Y ˆ β ˆ β = =.35 exp(.35) = 3.86 hours SE( Xˆ ) = SE( ˆ{ µ Y ˆ β Xˆ }) = =.37 39
40 Related ideas computer centering trick confidence and prediction bands multiple comparison issues 4
41 Regression Plot 7 PH 6 Regression 95% CI 5 95% PI log(time) 2 4
42 Standard Errors We have discussed six standard errors SE of the slope SE of the intercept SE of the estimated mean of Y at X SE of the predicted value of Y (new individual) at X SE of inverse estimate of X for a mean Y SE of inverse estimate of X for an individual Y 42
43 Correlation Correlation is a measure of linear association between two variables Formula on page 94 between - and + zero correlation implies no linear relation + implies on points fall exactly on a straight line with positive slope 43
INFERENCE FOR REGRESSION
 CHAPTER 3 INFERENCE FOR REGRESSION OVERVIEW In Chapter 5 of the textbook, we first encountered regression. The assumptions that describe the regression model we use in this chapter are the following. We
Lecture 18: Simple Linear Regression
 Lecture 18: Simple Linear Regression BIOS 553 Department of Biostatistics University of Michigan Fall 2004 The Correlation Coefficient: r The correlation coefficient (r) is a number that measures the strength
School of Mathematical Sciences. Question 1
 School of Mathematical Sciences MTH5120 Statistical Modelling I Practical 8 and Assignment 7 Solutions Question 1 Figure 1: The residual plots do not contradict the model assumptions of normality, constant
Inference for Regression Inference about the Regression Model and Using the Regression Line
 Inference for Regression Inference about the Regression Model and Using the Regression Line PBS Chapter 10.1 and 10.2 2009 W.H. Freeman and Company Objectives (PBS Chapter 10.1 and 10.2) Inference about
23. Inference for regression
 23. Inference for regression The Practice of Statistics in the Life Sciences Third Edition 2014 W. H. Freeman and Company Objectives (PSLS Chapter 23) Inference for regression The regression model Confidence
Lecture 2 Linear Regression: A Model for the Mean. Sharyn O Halloran
 Lecture 2 Linear Regression: A Model for the Mean Sharyn O Halloran Closer Look at: Linear Regression Model Least squares procedure Inferential tools Confidence and Prediction Intervals Assumptions Robustness
Multiple Regression an Introduction. Stat 511 Chap 9
 Multiple Regression an Introduction Stat 511 Chap 9 1 case studies meadowfoam flowers brain size of mammals 2 case study 1: meadowfoam flowering designed experiment carried out in a growth chamber general
III. Inferential Tools
 III. Inferential Tools A. Introduction to Bat Echolocation Data (10.1.1) 1. Q: Do echolocating bats expend more enery than non-echolocating bats and birds, after accounting for mass? 2. Strategy: (i) Explore
Basic Business Statistics, 10/e
 Chapter 4 4- Basic Business Statistics th Edition Chapter 4 Introduction to Multiple Regression Basic Business Statistics, e 9 Prentice-Hall, Inc. Chap 4- Learning Objectives In this chapter, you learn:
The simple linear regression model discussed in Chapter 13 was written as
 1519T_c14 03/27/2006 07:28 AM Page 614 Chapter Jose Luis Pelaez Inc/Blend Images/Getty Images, Inc./Getty Images, Inc. 14 Multiple Regression 14.1 Multiple Regression Analysis 14.2 Assumptions of the Multiple
Confidence Interval for the mean response
 Week 3: Prediction and Confidence Intervals at specified x. Testing lack of fit with replicates at some x's. Inference for the correlation. Introduction to regression with several explanatory variables.
Estimating σ 2. We can do simple prediction of Y and estimation of the mean of Y at any value of X.
 Estimating σ 2 We can do simple prediction of Y and estimation of the mean of Y at any value of X. To perform inferences about our regression line, we must estimate σ 2, the variance of the error term.
Six Sigma Black Belt Study Guides
 Six Sigma Black Belt Study Guides 1 www.pmtutor.org Powered by POeT Solvers Limited. Analyze Correlation and Regression Analysis 2 www.pmtutor.org Powered by POeT Solvers Limited. Variables and relationships
Notebook Tab 6 Pages 183 to ConteSolutions
 Notebook Tab 6 Pages 183 to 196 When the assumed relationship best fits a straight line model (r (Pearson s correlation coefficient) is close to 1 ), this approach is known as Linear Regression Analysis.
LINEAR REGRESSION ANALYSIS. MODULE XVI Lecture Exercises
 LINEAR REGRESSION ANALYSIS MODULE XVI Lecture - 44 Exercises Dr. Shalabh Department of Mathematics and Statistics Indian Institute of Technology Kanpur Exercise 1 The following data has been obtained on
Ch 13 & 14 - Regression Analysis
 Ch 3 & 4 - Regression Analysis Simple Regression Model I. Multiple Choice:. A simple regression is a regression model that contains a. only one independent variable b. only one dependent variable c. more
Inference for the Regression Coefficient
 Inference for the Regression Coefficient Recall, b 0 and b 1 are the estimates of the slope β 1 and intercept β 0 of population regression line. We can shows that b 0 and b 1 are the unbiased estimates
Objectives Simple linear regression. Statistical model for linear regression. Estimating the regression parameters
 Objectives 10.1 Simple linear regression Statistical model for linear regression Estimating the regression parameters Confidence interval for regression parameters Significance test for the slope Confidence
Multiple Regression. Inference for Multiple Regression and A Case Study. IPS Chapters 11.1 and W.H. Freeman and Company
 Multiple Regression Inference for Multiple Regression and A Case Study IPS Chapters 11.1 and 11.2 2009 W.H. Freeman and Company Objectives (IPS Chapters 11.1 and 11.2) Multiple regression Data for multiple
Multiple Regression Methods
 Chapter 1: Multiple Regression Methods Hildebrand, Ott and Gray Basic Statistical Ideas for Managers Second Edition 1 Learning Objectives for Ch. 1 The Multiple Linear Regression Model How to interpret
Basic Business Statistics 6 th Edition
 Basic Business Statistics 6 th Edition Chapter 12 Simple Linear Regression Learning Objectives In this chapter, you learn: How to use regression analysis to predict the value of a dependent variable based
Warm-up Using the given data Create a scatterplot Find the regression line
 Time at the lunch table Caloric intake 21.4 472 30.8 498 37.7 335 32.8 423 39.5 437 22.8 508 34.1 431 33.9 479 43.8 454 42.4 450 43.1 410 29.2 504 31.3 437 28.6 489 32.9 436 30.6 480 35.1 439 33.0 444
STAT Chapter 11: Regression
 STAT 515 -- Chapter 11: Regression Mostly we have studied the behavior of a single random variable. Often, however, we gather data on two random variables. We wish to determine: Is there a relationship
Stat 411/511 ESTIMATING THE SLOPE AND INTERCEPT. Charlotte Wickham. stat511.cwick.co.nz. Nov
 Stat 411/511 ESTIMATING THE SLOPE AND INTERCEPT Nov 20 2015 Charlotte Wickham stat511.cwick.co.nz Quiz #4 This weekend, don t forget. Usual format Assumptions Display 7.5 p. 180 The ideal normal, simple
Nature vs. nurture? Lecture 18 - Regression: Inference, Outliers, and Intervals. Regression Output. Conditions for inference.
 Understanding regression output from software Nature vs. nurture? Lecture 18 - Regression: Inference, Outliers, and Intervals In 1966 Cyril Burt published a paper called The genetic determination of differences
Multiple Regression Examples
 Multiple Regression Examples Example: Tree data. we have seen that a simple linear regression of usable volume on diameter at chest height is not suitable, but that a quadratic model y = β 0 + β 1 x +
Simple Linear Regression
 Simple Linear Regression ST 370 Regression models are used to study the relationship of a response variable and one or more predictors. The response is also called the dependent variable, and the predictors
Conditions for Regression Inference:
 AP Statistics Chapter Notes. Inference for Linear Regression We can fit a least-squares line to any data relating two quantitative variables, but the results are useful only if the scatterplot shows a
Linear Regression. Simple linear regression model determines the relationship between one dependent variable (y) and one independent variable (x).
 and one independent variable (x).") Linear Regression Simple linear regression model determines the relationship between one dependent variable (y) and one independent variable (x). A dependent variable is a random variable whose variation
Linear Regression Simple linear regression model determines the relationship between one dependent variable (y) and one independent variable (x). A dependent variable is a random variable whose variation
Ch 2: Simple Linear Regression
 Ch 2: Simple Linear Regression 1. Simple Linear Regression Model A simple regression model with a single regressor x is y = β 0 + β 1 x + ɛ, where we assume that the error ɛ is independent random component
STAT5044: Regression and Anova. Inyoung Kim
 STAT5044: Regression and Anova Inyoung Kim 2 / 47 Outline 1 Regression 2 Simple Linear regression 3 Basic concepts in regression 4 How to estimate unknown parameters 5 Properties of Least Squares Estimators:
SMAM 314 Computer Assignment 5 due Nov 8,2012 Data Set 1. For each of the following data sets use Minitab to 1. Make a scatterplot.
 SMAM 314 Computer Assignment 5 due Nov 8,2012 Data Set 1. For each of the following data sets use Minitab to 1. Make a scatterplot. 2. Fit the linear regression line. Regression Analysis: y versus x y
STA 108 Applied Linear Models: Regression Analysis Spring Solution for Homework #6
 STA 8 Applied Linear Models: Regression Analysis Spring 011 Solution for Homework #6 6. a) = 11 1 31 41 51 1 3 4 5 11 1 31 41 51 β = β1 β β 3 b) = 1 1 1 1 1 11 1 31 41 51 1 3 4 5 β = β 0 β1 β 6.15 a) Stem-and-leaf
assumes a linear relationship between mean of Y and the X s with additive normal errors the errors are assumed to be a sample from N(0, σ 2 )
") Multiple Linear Regression is used to relate a continuous response (or dependent) variable Y to several explanatory (or independent) (or predictor) variables X 1, X 2,, X k assumes a linear relationship
Multiple Linear Regression is used to relate a continuous response (or dependent) variable Y to several explanatory (or independent) (or predictor) variables X 1, X 2,, X k assumes a linear relationship
(4) 1. Create dummy variables for Town. Name these dummy variables A and B. These 0,1 variables now indicate the location of the house.
 1. Create dummy variables for Town. Name these dummy variables A and B. These 0,1 variables now indicate the location of the house.") Exam 3 Resource Economics 312 Introductory Econometrics Please complete all questions on this exam. The data in the spreadsheet: Exam 3- Home Prices.xls are to be used for all analyses. These data are
Exam 3 Resource Economics 312 Introductory Econometrics Please complete all questions on this exam. The data in the spreadsheet: Exam 3- Home Prices.xls are to be used for all analyses. These data are
28. SIMPLE LINEAR REGRESSION III
 28. SIMPLE LINEAR REGRESSION III Fitted Values and Residuals To each observed x i, there corresponds a y-value on the fitted line, y = βˆ + βˆ x. The are called fitted values. ŷ i They are the values of
Correlation & Simple Regression
 Chapter 11 Correlation & Simple Regression The previous chapter dealt with inference for two categorical variables. In this chapter, we would like to examine the relationship between two quantitative variables.
(ii) Scan your answer sheets INTO ONE FILE only, and submit it in the drop-box.
 Scan your answer sheets INTO ONE FILE only, and submit it in the drop-box.") FINAL EXAM ** Two different ways to submit your answer sheet (i) Use MS-Word and place it in a drop-box. (ii) Scan your answer sheets INTO ONE FILE only, and submit it in the drop-box. Deadline: December
FINAL EXAM ** Two different ways to submit your answer sheet (i) Use MS-Word and place it in a drop-box. (ii) Scan your answer sheets INTO ONE FILE only, and submit it in the drop-box. Deadline: December
Analysis of Covariance. The following example illustrates a case where the covariate is affected by the treatments.
 Analysis of Covariance In some experiments, the experimental units (subjects) are nonhomogeneous or there is variation in the experimental conditions that are not due to the treatments. For example, a
Q Lecture Introduction to Regression
 Q3 2009 1 Before/After Transformation 2 Construction Role of T-ratios Formally, even under Null Hyp: H : 0, ˆ, being computed from k t k SE ˆ ˆ y values themselves containing random error, will sometimes
TMA4255 Applied Statistics V2016 (5)
") TMA4255 Applied Statistics V2016 (5) Part 2: Regression Simple linear regression [11.1-11.4] Sum of squares [11.5] Anna Marie Holand To be lectured: January 26, 2016 wiki.math.ntnu.no/tma4255/2016v/start
TMA4255 Applied Statistics V2016 (5) Part 2: Regression Simple linear regression [11.1-11.4] Sum of squares [11.5] Anna Marie Holand To be lectured: January 26, 2016 wiki.math.ntnu.no/tma4255/2016v/start
2.4.3 Estimatingσ Coefficient of Determination 2.4. ASSESSING THE MODEL 23
 2.4. ASSESSING THE MODEL 23 2.4.3 Estimatingσ 2 Note that the sums of squares are functions of the conditional random variables Y i = (Y X = x i ). Hence, the sums of squares are random variables as well.
Mathematics for Economics MA course
 Mathematics for Economics MA course Simple Linear Regression Dr. Seetha Bandara Simple Regression Simple linear regression is a statistical method that allows us to summarize and study relationships between
STAT 3022 Spring 2007
 Simple Linear Regression Example These commands reproduce what we did in class. You should enter these in R and see what they do. Start by typing > set.seed(42) to reset the random number generator so
Chapter 10. Regression. Understandable Statistics Ninth Edition By Brase and Brase Prepared by Yixun Shi Bloomsburg University of Pennsylvania
 Chapter 10 Regression Understandable Statistics Ninth Edition By Brase and Brase Prepared by Yixun Shi Bloomsburg University of Pennsylvania Scatter Diagrams A graph in which pairs of points, (x, y), are
Simple and Multiple Linear Regression
 Sta. 113 Chapter 12 and 13 of Devore March 12, 2010 Table of contents 1 Simple Linear Regression 2 Model Simple Linear Regression A simple linear regression model is given by Y = β 0 + β 1 x + ɛ where
Chapter 9. Correlation and Regression
 Chapter 9 Correlation and Regression Lesson 9-1/9-2, Part 1 Correlation Registered Florida Pleasure Crafts and Watercraft Related Manatee Deaths 100 80 60 40 20 0 1991 1993 1995 1997 1999 Year Boats in
Simple Linear Regression. Material from Devore s book (Ed 8), and Cengagebrain.com
, and Cengagebrain.com") 12 Simple Linear Regression Material from Devore s book (Ed 8), and Cengagebrain.com The Simple Linear Regression Model The simplest deterministic mathematical relationship between two variables x and
12 Simple Linear Regression Material from Devore s book (Ed 8), and Cengagebrain.com The Simple Linear Regression Model The simplest deterministic mathematical relationship between two variables x and
This document contains 3 sets of practice problems.
 P RACTICE PROBLEMS This document contains 3 sets of practice problems. Correlation: 3 problems Regression: 4 problems ANOVA: 8 problems You should print a copy of these practice problems and bring them
Introduction to Regression
 Introduction to Regression Using Mult Lin Regression Derived variables Many alternative models Which model to choose? Model Criticism Modelling Objective Model Details Data and Residuals Assumptions 1
A discussion on multiple regression models
 A discussion on multiple regression models In our previous discussion of simple linear regression, we focused on a model in which one independent or explanatory variable X was used to predict the value
Data files & analysis PrsnLee.out Ch9.xls
 Model Based Statistics in Biology. Part III. The General Linear Model. Chapter 9.2 Regression. Explanatory Variable Fixed into Classes ReCap. Part I (Chapters 1,2,3,4) ReCap Part II (Ch 5, 6, 7) ReCap
2.1: Inferences about β 1
 Chapter 2 1 2.1: Inferences about β 1 Test of interest throughout regression: Need sampling distribution of the estimator b 1. Idea: If b 1 can be written as a linear combination of the responses (which
Review of Regression Basics
 Review of Regression Basics When describing a Bivariate Relationship: Make a Scatterplot Strength, Direction, Form Model: y-hat=a+bx Interpret slope in context Make Predictions Residual = Observed-Predicted
: The model hypothesizes a relationship between the variables. The simplest probabilistic model: or.
 Chapter Simple Linear Regression : comparing means across groups : presenting relationships among numeric variables. Probabilistic Model : The model hypothesizes an relationship between the variables.
Models with qualitative explanatory variables p216
 Models with qualitative explanatory variables p216 Example gen = 1 for female Row gpa hsm gen 1 3.32 10 0 2 2.26 6 0 3 2.35 8 0 4 2.08 9 0 5 3.38 8 0 6 3.29 10 0 7 3.21 8 0 8 2.00 3 0 9 3.18 9 0 10 2.34
appstats27.notebook April 06, 2017
 Chapter 27 Objective Students will conduct inference on regression and analyze data to write a conclusion. Inferences for Regression An Example: Body Fat and Waist Size pg 634 Our chapter example revolves
Oct Simple linear regression. Minimum mean square error prediction. Univariate. regression. Calculating intercept and slope
 Oct 2017 1 / 28 Minimum MSE Y is the response variable, X the predictor variable, E(X) = E(Y) = 0. BLUP of Y minimizes average discrepancy var (Y ux) = C YY 2u C XY + u 2 C XX This is minimized when u
MINITAB Stat Lab 3
 MINITAB Stat 20080 Lab 3. Statitical Inference In the previou lab we explained how to make prediction from a imple linear regreion model and alo examined the relationhip between the repone and predictor
Examination paper for TMA4255 Applied statistics
 Department of Mathematical Sciences Examination paper for TMA4255 Applied statistics Academic contact during examination: Anna Marie Holand Phone: 951 38 038 Examination date: 16 May 2015 Examination time
Regression. Estimation of the linear function (straight line) describing the linear component of the joint relationship between two variables X and Y.
 describing the linear component of the joint relationship between two variables X and Y.") Regression Bivariate i linear regression: Estimation of the linear function (straight line) describing the linear component of the joint relationship between two variables and. Generally describe as a
Regression Bivariate i linear regression: Estimation of the linear function (straight line) describing the linear component of the joint relationship between two variables and. Generally describe as a
SMAM 319 Exam1 Name. a B.The equation of a line is 3x + y =6. The slope is a. -3 b.3 c.6 d.1/3 e.-1/3
 SMAM 319 Exam1 Name 1. Pick the best choice. (10 points-2 each) _c A. A data set consisting of fifteen observations has the five number summary 4 11 12 13 15.5. For this data set it is definitely true
10. Alternative case influence statistics
 10. Alternative case influence statistics a. Alternative to D i : dffits i (and others) b. Alternative to studres i : externally-studentized residual c. Suggestion: use whatever is convenient with the
STAT 511. Lecture : Simple linear regression Devore: Section Prof. Michael Levine. December 3, Levine STAT 511
 STAT 511 Lecture : Simple linear regression Devore: Section 12.1-12.4 Prof. Michael Levine December 3, 2018 A simple linear regression investigates the relationship between the two variables that is not
School of Mathematical Sciences. Question 1. Best Subsets Regression
 School of Mathematical Sciences MTH5120 Statistical Modelling I Practical 9 and Assignment 8 Solutions Question 1 Best Subsets Regression Response is Crime I n W c e I P a n A E P U U l e Mallows g E P
THE ROYAL STATISTICAL SOCIETY 2008 EXAMINATIONS SOLUTIONS HIGHER CERTIFICATE (MODULAR FORMAT) MODULE 4 LINEAR MODELS
 MODULE 4 LINEAR MODELS") THE ROYAL STATISTICAL SOCIETY 008 EXAMINATIONS SOLUTIONS HIGHER CERTIFICATE (MODULAR FORMAT) MODULE 4 LINEAR MODELS The Society provides these solutions to assist candidates preparing for the examinations
THE ROYAL STATISTICAL SOCIETY 008 EXAMINATIONS SOLUTIONS HIGHER CERTIFICATE (MODULAR FORMAT) MODULE 4 LINEAR MODELS The Society provides these solutions to assist candidates preparing for the examinations
Regression. Marc H. Mehlman University of New Haven
 Regression Marc H. Mehlman marcmehlman@yahoo.com University of New Haven the statistician knows that in nature there never was a normal distribution, there never was a straight line, yet with normal and
Regression Models - Introduction
 Regression Models - Introduction In regression models there are two types of variables that are studied: A dependent variable, Y, also called response variable. It is modeled as random. An independent
Lecture 3: Inference in SLR
 Lecture 3: Inference in SLR STAT 51 Spring 011 Background Reading KNNL:.1.6 3-1 Topic Overview This topic will cover: Review of hypothesis testing Inference about 1 Inference about 0 Confidence Intervals
13 Simple Linear Regression
 B.Sc./Cert./M.Sc. Qualif. - Statistics: Theory and Practice 3 Simple Linear Regression 3. An industrial example A study was undertaken to determine the effect of stirring rate on the amount of impurity
STA 302 H1F / 1001 HF Fall 2007 Test 1 October 24, 2007
 STA 302 H1F / 1001 HF Fall 2007 Test 1 October 24, 2007 LAST NAME: SOLUTIONS FIRST NAME: STUDENT NUMBER: ENROLLED IN: (circle one) STA 302 STA 1001 INSTRUCTIONS: Time: 90 minutes Aids allowed: calculator.
Correlation Analysis
 Simple Regression Correlation Analysis Correlation analysis is used to measure strength of the association (linear relationship) between two variables Correlation is only concerned with strength of the
Statistical Techniques II EXST7015 Simple Linear Regression
 Statistical Techniques II EXST7015 Simple Linear Regression 03a_SLR 1 Y - the dependent variable 35 30 25 The objective Given points plotted on two coordinates, Y and X, find the best line to fit the data.
Simple Linear Regression. (Chs 12.1, 12.2, 12.4, 12.5)
") 10 Simple Linear Regression (Chs 12.1, 12.2, 12.4, 12.5) Simple Linear Regression Rating 20 40 60 80 0 5 10 15 Sugar 2 Simple Linear Regression Rating 20 40 60 80 0 5 10 15 Sugar 3 Simple Linear Regression
10 Simple Linear Regression (Chs 12.1, 12.2, 12.4, 12.5) Simple Linear Regression Rating 20 40 60 80 0 5 10 15 Sugar 2 Simple Linear Regression Rating 20 40 60 80 0 5 10 15 Sugar 3 Simple Linear Regression
y = a + bx 12.1: Inference for Linear Regression Review: General Form of Linear Regression Equation Review: Interpreting Computer Regression Output
 12.1: Inference for Linear Regression Review: General Form of Linear Regression Equation y = a + bx y = dependent variable a = intercept b = slope x = independent variable Section 12.1 Inference for Linear
R 2 and F -Tests and ANOVA
 R 2 and F -Tests and ANOVA December 6, 2018 1 Partition of Sums of Squares The distance from any point y i in a collection of data, to the mean of the data ȳ, is the deviation, written as y i ȳ. Definition.
Inferences for Regression
 Inferences for Regression An Example: Body Fat and Waist Size Looking at the relationship between % body fat and waist size (in inches). Here is a scatterplot of our data set: Remembering Regression In
y ˆ i = ˆ " T u i ( i th fitted value or i th fit)
") 1 2 INFERENCE FOR MULTIPLE LINEAR REGRESSION Recall Terminology: p predictors x 1, x 2,, x p Some might be indicator variables for categorical variables) k-1 non-constant terms u 1, u 2,, u k-1 Each u
1 2 INFERENCE FOR MULTIPLE LINEAR REGRESSION Recall Terminology: p predictors x 1, x 2,, x p Some might be indicator variables for categorical variables) k-1 non-constant terms u 1, u 2,, u k-1 Each u
AMS 315/576 Lecture Notes. Chapter 11. Simple Linear Regression
 AMS 315/576 Lecture Notes Chapter 11. Simple Linear Regression 11.1 Motivation A restaurant opening on a reservations-only basis would like to use the number of advance reservations x to predict the number
Inference with Simple Regression
 1 Introduction Inference with Simple Regression Alan B. Gelder 06E:071, The University of Iowa 1 Moving to infinite means: In this course we have seen one-mean problems, twomean problems, and problems
STAT 512 MidTerm I (2/21/2013) Spring 2013 INSTRUCTIONS
 Spring 2013 INSTRUCTIONS") STAT 512 MidTerm I (2/21/2013) Spring 2013 Name: Key INSTRUCTIONS 1. This exam is open book/open notes. All papers (but no electronic devices except for calculators) are allowed. 2. There are 5 pages in
STAT 512 MidTerm I (2/21/2013) Spring 2013 Name: Key INSTRUCTIONS 1. This exam is open book/open notes. All papers (but no electronic devices except for calculators) are allowed. 2. There are 5 pages in
Statistical Modelling in Stata 5: Linear Models
 Statistical Modelling in Stata 5: Linear Models Mark Lunt Arthritis Research UK Epidemiology Unit University of Manchester 07/11/2017 Structure This Week What is a linear model? How good is my model? Does
Measuring the fit of the model - SSR
 Measuring the fit of the model - SSR Once we ve determined our estimated regression line, we d like to know how well the model fits. How far/close are the observations to the fitted line? One way to do
Histogram of Residuals. Residual Normal Probability Plot. Reg. Analysis Check Model Utility. (con t) Check Model Utility. Inference.
 Check Model Utility. Inference.") Steps for Regression Simple Linear Regression Make a Scatter plot Does it make sense to plot a line? Check Residual Plot (Residuals vs. X) Are there any patterns? Check Histogram of Residuals Is it Normal?
Steps for Regression Simple Linear Regression Make a Scatter plot Does it make sense to plot a line? Check Residual Plot (Residuals vs. X) Are there any patterns? Check Histogram of Residuals Is it Normal?
Simple Linear Regression. Steps for Regression. Example. Make a Scatter plot. Check Residual Plot (Residuals vs. X)
") Simple Linear Regression 1 Steps for Regression Make a Scatter plot Does it make sense to plot a line? Check Residual Plot (Residuals vs. X) Are there any patterns? Check Histogram of Residuals Is it Normal?
Simple Linear Regression 1 Steps for Regression Make a Scatter plot Does it make sense to plot a line? Check Residual Plot (Residuals vs. X) Are there any patterns? Check Histogram of Residuals Is it Normal?
Chapter 12: Multiple Regression
 Chapter 12: Multiple Regression 12.1 a. A scatterplot of the data is given here: Plot of Drug Potency versus Dose Level Potency 0 5 10 15 20 25 30 0 5 10 15 20 25 30 35 Dose Level b. ŷ = 8.667 + 0.575x
Ch 3: Multiple Linear Regression
 Ch 3: Multiple Linear Regression 1. Multiple Linear Regression Model Multiple regression model has more than one regressor. For example, we have one response variable and two regressor variables: 1. delivery
Lecture 1 Linear Regression with One Predictor Variable.p2
 Lecture Linear Regression with One Predictor Variablep - Basics - Meaning of regression parameters p - β - the slope of the regression line -it indicates the change in mean of the probability distn of
Probability and Statistics Notes
 Probability and Statistics Notes Chapter Seven Jesse Crawford Department of Mathematics Tarleton State University Spring 2011 (Tarleton State University) Chapter Seven Notes Spring 2011 1 / 42 Outline
SMAM 314 Exam 42 Name
 SMAM 314 Exam 42 Name Mark the following statements True (T) or False (F) (10 points) 1. F A. The line that best fits points whose X and Y values are negatively correlated should have a positive slope.
Inference for Regression Simple Linear Regression
 Inference for Regression Simple Linear Regression IPS Chapter 10.1 2009 W.H. Freeman and Company Objectives (IPS Chapter 10.1) Simple linear regression p Statistical model for linear regression p Estimating
Business Statistics. Chapter 14 Introduction to Linear Regression and Correlation Analysis QMIS 220. Dr. Mohammad Zainal
 Department of Quantitative Methods & Information Systems Business Statistics Chapter 14 Introduction to Linear Regression and Correlation Analysis QMIS 220 Dr. Mohammad Zainal Chapter Goals After completing
Math Section MW 1-2:30pm SR 117. Bekki George 206 PGH
 Math 3339 Section 21155 MW 1-2:30pm SR 117 Bekki George bekki@math.uh.edu 206 PGH Office Hours: M 11-12:30pm & T,TH 10:00 11:00 am and by appointment Linear Regression (again) Consider the relationship
2. Outliers and inference for regression
 Unit6: Introductiontolinearregression 2. Outliers and inference for regression Sta 101 - Spring 2016 Duke University, Department of Statistical Science Dr. Çetinkaya-Rundel Slides posted at http://bit.ly/sta101_s16
Chapter 26 Multiple Regression, Logistic Regression, and Indicator Variables
 Chapter 26 Multiple Regression, Logistic Regression, and Indicator Variables 26.1 S 4 /IEE Application Examples: Multiple Regression An S 4 /IEE project was created to improve the 30,000-footlevel metric
Inference for Regression Inference about the Regression Model and Using the Regression Line, with Details. Section 10.1, 2, 3
 Inference for Regression Inference about the Regression Model and Using the Regression Line, with Details Section 10.1, 2, 3 Basic components of regression setup Target of inference: linear dependency
Chapter 27 Summary Inferences for Regression
 Chapter 7 Summary Inferences for Regression What have we learned? We have now applied inference to regression models. Like in all inference situations, there are conditions that we must check. We can test
Chapter 14. Multiple Regression Models. Multiple Regression Models. Multiple Regression Models
 Chapter 14 Multiple Regression Models 1 Multiple Regression Models A general additive multiple regression model, which relates a dependent variable y to k predictor variables,,, is given by the model equation
Steps for Regression. Simple Linear Regression. Data. Example. Residuals vs. X. Scatterplot. Make a Scatter plot Does it make sense to plot a line?
 Steps for Regression Simple Linear Regression Make a Scatter plot Does it make sense to plot a line? Check Residual Plot (Residuals vs. X) Are there any patterns? Check Histogram of Residuals Is it Normal?
Apart from this page, you are not permitted to read the contents of this question paper until instructed to do so by an invigilator.
 B. Sc. Examination by course unit 2014 MTH5120 Statistical Modelling I Duration: 2 hours Date and time: 16 May 2014, 1000h 1200h Apart from this page, you are not permitted to read the contents of this