Q Lecture Introduction to Regression
|
|
|
- Chloe Hodges
- 5 years ago
- Views:
Transcription
1 Q
2 Before/After Transformation 2
3 Construction Role of T-ratios Formally, even under Null Hyp: H : 0, ˆ, being computed from k t k SE ˆ ˆ y values themselves containing random error, will sometimes be large ( ) for reasons of random chance only. Also t-ratios k k 0 k In (conceptual) replications, differing from current data by chance alone, the probability of obtaining, by chance, a t-ratio larger ( ) than quoted value is quoted P value 3
4 Role of T-ratios ˆ ˆ Informally, if t is not large (>2 in mag; p ) then coeff of x can be given a value of zero - equivalently x can be dropped from model - k k with little appreciable impact. t k k SE k k Cautio n: applies one variable at a time 4
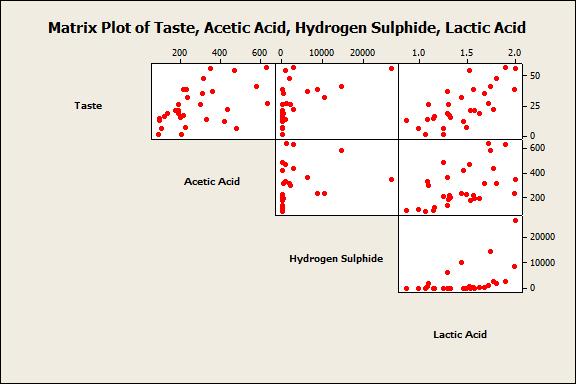
5 Residuals Regression Analysis: Taste versus Lactic Acid, LAcetic, LH2S Taste = Lactic Acid LAcetic LH2S Predictor Coef SE Coef T P Constant Lactic Acid LAcetic LH2S S = R-Sq = 65.2% R-Sq(adj) = 61.2% Unusual Observations Lactic Obs Acid Taste Fit SE Fit Residual St Resid R Analysis of Variance Source DF SS MS F P Regression Residual Error Total Source DF Seq SS Lactic Acid LAcetic LH2S


6 Residuals Unusual Observations Lactic Obs Acid Taste Fit SE Fit Residual St Resid R In fact barely outlying despite 2.63 Recall, one has to be largest!! 6
7 Options with Large Residuals Examine carefully: Why outlying? Anything special about this case/obs? Refit without does its removal change anything important? If delete, then formally Conclusions are based on something like this never happening in future Is this a meaningful statement? 7
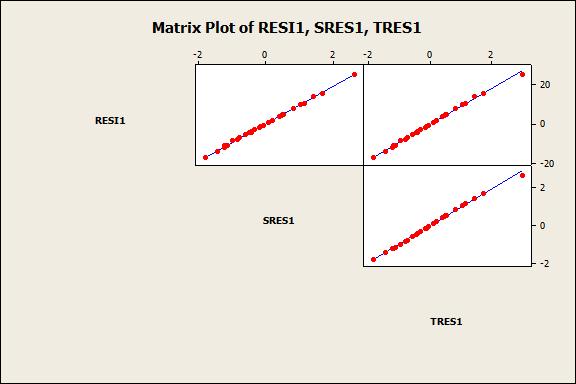
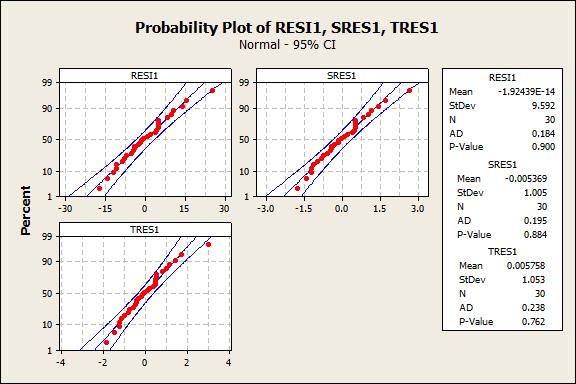

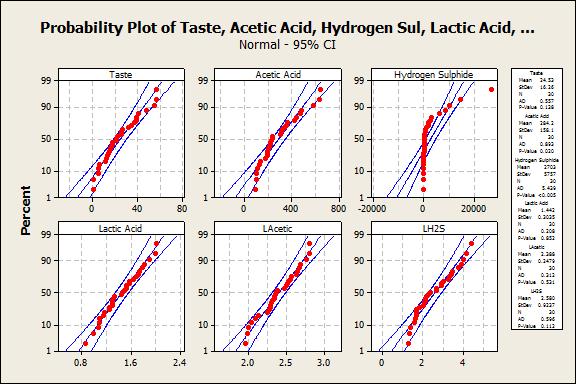
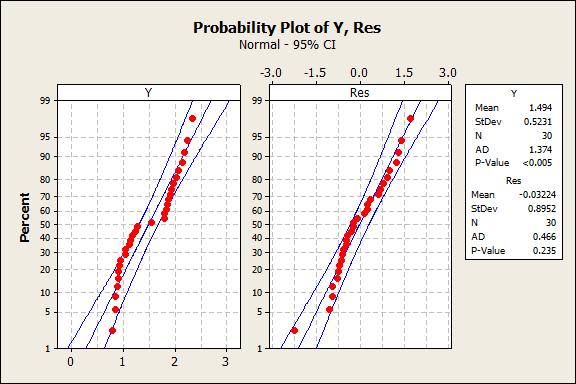
8 Residuals, Standardized Residuals, Deleted T-residuals Normal Scores 8
9 Classic Linear Model Y x x... x Transformations i 1 1i 2 2i p pi i 2 where ~ N 0, Var or N 0, SD i Statistical Theory assumes Normally Dist residuals/'errors' makes NO assumptions re dist of Y, X,.. 1 (technical) makes assumption of additivity (crucial) But non-additivity - esp multiplicative models - and non normality often occur together 9


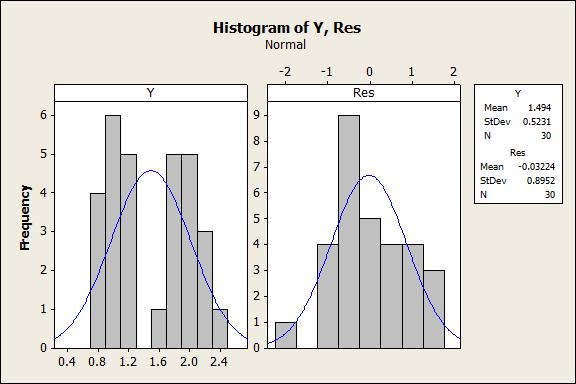
10 Normality of data or errors/resids? 10

11 Extreme example 11
12 Random Variation Additive? 6.00 Exp Decay. Random variation decreases with time Exp Decay on log scale. Random variation constant in time time t time t 12
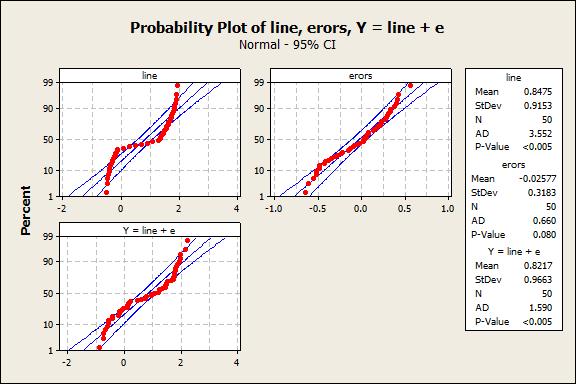
13 Artificially created data Rescaled Additive model to create data Resids by Exponentiation of line and data t line erors Y = line + e subtraction line Exp y Data created multiplicatively exhibit neither linearity nor Normality in either data or residuals Log transform solves both issues 13


14 Artificially created data Rescaled Additive model to create data Resids by constant Exponentiation by construction of line and data t line erors Y = line + e subtraction 2.5 line Exp y Linear Decay Rand variation 14
15 Artificially created data Rescaled Additive model to create data Resids by Exponentiation of line and data t line erors Y = line + e subtraction line Exp y Exp Decay. Random variation decreases with time time t Exp Decay on log scale. Random variation now seems constant in time time t 15


16 Artificially created data Distributions of obs Y under both models Additive model to create dat Exponentiation of line and data t line Y = line + e line Exp y

17 Resids for artificially created data Rescaled Residuals Exponentiation of line and data Resids by Resids by line Exp y subtraction division Erroneous Not reflecting creation 17

18 Artificially created data Exponentiation of line and data Resids by Resids by line Exp y subtraction division Now reflecting creation, but not Normal 18
19 Artificially created data Exponentiation of line and data Resids by Resids by line Exp y subtraction division Now reflecting creation, but not Normal. However Normal after log transformation 19


20 Artificially created data Exponentiation of line and data Resids by Resids by line Exp y subtraction division Now reflecting creation, but not Normal. However Normal after log transformation 20
21 Plotting Plotting Multiple Regression Fits gpm = wt hp/wt a b1 b2 Given hp/wt hp/wt wt line Fitted line vs wt when hp/wt= wt Excel plotting 21
22 Very active area of advanced research Exam Q will not ask for undiscovered network Direct/Indirect Links Causal Networks Networks Network Models No primary response variable Now can consider Regress Directed Arrows Regression has no useful role Undirected Arrows Regression has some role? Y= wt on X s hp, hp/wt, gpm hp hp/ wt wt gpm 22
23 Undirected Network Models Indicative research methodology hp hp/ wt gpm Regression Analysis: wt versus hp, hp/wt, gpm wt = hp hp/wt gpm T-ratios Deleted stuff... wt Tentative network model Source DF Seq SS hp hp/wt gpm Note order gpm adds relatively little to pred wt when hp and hp/wt already in the model Relatively weak evidence in favour of Can drop link But propose new link hp NB changing the response variable hp/ wt wt gpm Proposed new network model 23
24 Undirected Network Models Direct/Indirect Links Key: No primary response variable Network Order hp hp/ wt wt gpm Recall regression fit completely insensitive to order Both following make the same predictions Regression not the natural tool but is relevant wt = hp hp/wt gpm wt = hp/wt gpm hp 24

25 Not on the exam in 2010 ANOVA and F -tables t-tables PIs and CIs 25
Introduction to Regression
 Introduction to Regression Using Mult Lin Regression Derived variables Many alternative models Which model to choose? Model Criticism Modelling Objective Model Details Data and Residuals Assumptions 1
Confidence Interval for the mean response
 Week 3: Prediction and Confidence Intervals at specified x. Testing lack of fit with replicates at some x's. Inference for the correlation. Introduction to regression with several explanatory variables.
Models with qualitative explanatory variables p216
 Models with qualitative explanatory variables p216 Example gen = 1 for female Row gpa hsm gen 1 3.32 10 0 2 2.26 6 0 3 2.35 8 0 4 2.08 9 0 5 3.38 8 0 6 3.29 10 0 7 3.21 8 0 8 2.00 3 0 9 3.18 9 0 10 2.34
School of Mathematical Sciences. Question 1
 School of Mathematical Sciences MTH5120 Statistical Modelling I Practical 8 and Assignment 7 Solutions Question 1 Figure 1: The residual plots do not contradict the model assumptions of normality, constant
SMAM 319 Exam 1 Name. 1.Pick the best choice for the multiple choice questions below (10 points 2 each)
") SMAM 319 Exam 1 Name 1.Pick the best choice for the multiple choice questions below (10 points 2 each) A b In Metropolis there are some houses for sale. Superman and Lois Lane are interested in the average
SMAM 319 Exam 1 Name 1.Pick the best choice for the multiple choice questions below (10 points 2 each) A b In Metropolis there are some houses for sale. Superman and Lois Lane are interested in the average
1. Least squares with more than one predictor
 Statistics 1 Lecture ( November ) c David Pollard Page 1 Read M&M Chapter (skip part on logistic regression, pages 730 731). Read M&M pages 1, for ANOVA tables. Multiple regression. 1. Least squares with
Simple Linear Regression: A Model for the Mean. Chap 7
 Simple Linear Regression: A Model for the Mean Chap 7 An Intermediate Model (if the groups are defined by values of a numeric variable) Separate Means Model Means fall on a straight line function of the
Multiple Regression Examples
 Multiple Regression Examples Example: Tree data. we have seen that a simple linear regression of usable volume on diameter at chest height is not suitable, but that a quadratic model y = β 0 + β 1 x +
School of Mathematical Sciences. Question 1. Best Subsets Regression
 School of Mathematical Sciences MTH5120 Statistical Modelling I Practical 9 and Assignment 8 Solutions Question 1 Best Subsets Regression Response is Crime I n W c e I P a n A E P U U l e Mallows g E P
Chapter 12: Multiple Regression
 Chapter 12: Multiple Regression 12.1 a. A scatterplot of the data is given here: Plot of Drug Potency versus Dose Level Potency 0 5 10 15 20 25 30 0 5 10 15 20 25 30 35 Dose Level b. ŷ = 8.667 + 0.575x
Predict y from (possibly) many predictors x. Model Criticism Study the importance of columns
 many predictors x. Model Criticism Study the importance of columns") Lecture Week Multiple Linear Regression Predict y from (possibly) many predictors x Including extra derived variables Model Criticism Study the importance of columns Draw on Scientific framework Experiment;
Lecture Week Multiple Linear Regression Predict y from (possibly) many predictors x Including extra derived variables Model Criticism Study the importance of columns Draw on Scientific framework Experiment;
LINEAR REGRESSION ANALYSIS. MODULE XVI Lecture Exercises
 LINEAR REGRESSION ANALYSIS MODULE XVI Lecture - 44 Exercises Dr. Shalabh Department of Mathematics and Statistics Indian Institute of Technology Kanpur Exercise 1 The following data has been obtained on
STA 108 Applied Linear Models: Regression Analysis Spring Solution for Homework #6
 STA 8 Applied Linear Models: Regression Analysis Spring 011 Solution for Homework #6 6. a) = 11 1 31 41 51 1 3 4 5 11 1 31 41 51 β = β1 β β 3 b) = 1 1 1 1 1 11 1 31 41 51 1 3 4 5 β = β 0 β1 β 6.15 a) Stem-and-leaf
SMAM 314 Exam 42 Name
 SMAM 314 Exam 42 Name Mark the following statements True (T) or False (F) (10 points) 1. F A. The line that best fits points whose X and Y values are negatively correlated should have a positive slope.
General Linear Model (Chapter 4)
") General Linear Model (Chapter 4) Outcome variable is considered continuous Simple linear regression Scatterplots OLS is BLUE under basic assumptions MSE estimates residual variance testing regression coefficients
General Linear Model (Chapter 4) Outcome variable is considered continuous Simple linear regression Scatterplots OLS is BLUE under basic assumptions MSE estimates residual variance testing regression coefficients
Interpreting the coefficients
 Lecture Week 5 Multiple Linear Regression Interpreting the coefficients Uses of Multiple Regression Predict for specified new x-vars Predict in time. Focus on one parameter Use regression to adjust variation
Mathematical Notation Math Introduction to Applied Statistics
 Mathematical Notation Math 113 - Introduction to Applied Statistics Name : Use Word or WordPerfect to recreate the following documents. Each article is worth 10 points and should be emailed to the instructor
Analysis of Covariance. The following example illustrates a case where the covariate is affected by the treatments.
 Analysis of Covariance In some experiments, the experimental units (subjects) are nonhomogeneous or there is variation in the experimental conditions that are not due to the treatments. For example, a
Model Building Chap 5 p251
 Model Building Chap 5 p251 Models with one qualitative variable, 5.7 p277 Example 4 Colours : Blue, Green, Lemon Yellow and white Row Blue Green Lemon Insects trapped 1 0 0 1 45 2 0 0 1 59 3 0 0 1 48 4
Stat 529 (Winter 2011) A simple linear regression (SLR) case study. Mammals brain weights and body weights
 A simple linear regression (SLR) case study. Mammals brain weights and body weights") Stat 529 (Winter 2011) A simple linear regression (SLR) case study Reading: Sections 8.1 8.4, 8.6, 8.7 Mammals brain weights and body weights Questions of interest Scatterplots of the data Log transforming
Stat 529 (Winter 2011) A simple linear regression (SLR) case study Reading: Sections 8.1 8.4, 8.6, 8.7 Mammals brain weights and body weights Questions of interest Scatterplots of the data Log transforming
SMAM 319 Exam1 Name. a B.The equation of a line is 3x + y =6. The slope is a. -3 b.3 c.6 d.1/3 e.-1/3
 SMAM 319 Exam1 Name 1. Pick the best choice. (10 points-2 each) _c A. A data set consisting of fifteen observations has the five number summary 4 11 12 13 15.5. For this data set it is definitely true
10 Model Checking and Regression Diagnostics
 10 Model Checking and Regression Diagnostics The simple linear regression model is usually written as i = β 0 + β 1 i + ɛ i where the ɛ i s are independent normal random variables with mean 0 and variance
Topic 14: Inference in Multiple Regression
 Topic 14: Inference in Multiple Regression Outline Review multiple linear regression Inference of regression coefficients Application to book example Inference of mean Application to book example Inference
Lecture 3: Inference in SLR
 Lecture 3: Inference in SLR STAT 51 Spring 011 Background Reading KNNL:.1.6 3-1 Topic Overview This topic will cover: Review of hypothesis testing Inference about 1 Inference about 0 Confidence Intervals
SMAM 314 Computer Assignment 5 due Nov 8,2012 Data Set 1. For each of the following data sets use Minitab to 1. Make a scatterplot.
 SMAM 314 Computer Assignment 5 due Nov 8,2012 Data Set 1. For each of the following data sets use Minitab to 1. Make a scatterplot. 2. Fit the linear regression line. Regression Analysis: y versus x y
Correlation & Simple Regression
 Chapter 11 Correlation & Simple Regression The previous chapter dealt with inference for two categorical variables. In this chapter, we would like to examine the relationship between two quantitative variables.
Chapter 14. Multiple Regression Models. Multiple Regression Models. Multiple Regression Models
 Chapter 14 Multiple Regression Models 1 Multiple Regression Models A general additive multiple regression model, which relates a dependent variable y to k predictor variables,,, is given by the model equation
Institutionen för matematik och matematisk statistik Umeå universitet November 7, Inlämningsuppgift 3. Mariam Shirdel
 Institutionen för matematik och matematisk statistik Umeå universitet November 7, 2011 Inlämningsuppgift 3 Mariam Shirdel (mash0007@student.umu.se) Kvalitetsteknik och försöksplanering, 7.5 hp 1 Uppgift
AP Statistics Unit 6 Note Packet Linear Regression. Scatterplots and Correlation
 Scatterplots and Correlation Name Hr A scatterplot shows the relationship between two quantitative variables measured on the same individuals. variable (y) measures an outcome of a study variable (x) may
STA 302 H1F / 1001 HF Fall 2007 Test 1 October 24, 2007
 STA 302 H1F / 1001 HF Fall 2007 Test 1 October 24, 2007 LAST NAME: SOLUTIONS FIRST NAME: STUDENT NUMBER: ENROLLED IN: (circle one) STA 302 STA 1001 INSTRUCTIONS: Time: 90 minutes Aids allowed: calculator.
Is economic freedom related to economic growth?
 Is economic freedom related to economic growth? It is an article of faith among supporters of capitalism: economic freedom leads to economic growth. The publication Economic Freedom of the World: 2003
COMPREHENSIVE WRITTEN EXAMINATION, PAPER III FRIDAY AUGUST 26, 2005, 9:00 A.M. 1:00 P.M. STATISTICS 174 QUESTION
 COMPREHENSIVE WRITTEN EXAMINATION, PAPER III FRIDAY AUGUST 26, 2005, 9:00 A.M. 1:00 P.M. STATISTICS 174 QUESTION Answer all parts. Closed book, calculators allowed. It is important to show all working,
STAB27-Winter Term test February 18,2006. There are 14 pages including this page. Please check to see you have all the pages.
 STAB27-Winter 2006 Term test February 8,2006 Last Name: First Name: Student #: Tutorial Section / Room: Dayffime (Tutorial): INSTRUCTIONS Duration: hour, 45 minutes Statistical table(s) attached at the
Histogram of Residuals. Residual Normal Probability Plot. Reg. Analysis Check Model Utility. (con t) Check Model Utility. Inference.
 Check Model Utility. Inference.") Steps for Regression Simple Linear Regression Make a Scatter plot Does it make sense to plot a line? Check Residual Plot (Residuals vs. X) Are there any patterns? Check Histogram of Residuals Is it Normal?
Steps for Regression Simple Linear Regression Make a Scatter plot Does it make sense to plot a line? Check Residual Plot (Residuals vs. X) Are there any patterns? Check Histogram of Residuals Is it Normal?
Simple Linear Regression. Steps for Regression. Example. Make a Scatter plot. Check Residual Plot (Residuals vs. X)
") Simple Linear Regression 1 Steps for Regression Make a Scatter plot Does it make sense to plot a line? Check Residual Plot (Residuals vs. X) Are there any patterns? Check Histogram of Residuals Is it Normal?
Simple Linear Regression 1 Steps for Regression Make a Scatter plot Does it make sense to plot a line? Check Residual Plot (Residuals vs. X) Are there any patterns? Check Histogram of Residuals Is it Normal?
Business 320, Fall 1999, Final
 Business 320, Fall 1999, Final name You may use a calculator and two cheat sheets. You have 3 hours. I pledge my honor that I have not violated the Honor Code during this examination. Obvioiusly, you may
Multiple Linear Regression
 Andrew Lonardelli December 20, 2013 Multiple Linear Regression 1 Table Of Contents Introduction: p.3 Multiple Linear Regression Model: p.3 Least Squares Estimation of the Parameters: p.4-5 The matrix approach
" M A #M B. Standard deviation of the population (Greek lowercase letter sigma) σ 2
 σ 2") Notation and Equations for Final Exam Symbol Definition X The variable we measure in a scientific study n The size of the sample N The size of the population M The mean of the sample µ The mean of the
Notation and Equations for Final Exam Symbol Definition X The variable we measure in a scientific study n The size of the sample N The size of the population M The mean of the sample µ The mean of the
Ch 13 & 14 - Regression Analysis
 Ch 3 & 4 - Regression Analysis Simple Regression Model I. Multiple Choice:. A simple regression is a regression model that contains a. only one independent variable b. only one dependent variable c. more
Steps for Regression. Simple Linear Regression. Data. Example. Residuals vs. X. Scatterplot. Make a Scatter plot Does it make sense to plot a line?
 Steps for Regression Simple Linear Regression Make a Scatter plot Does it make sense to plot a line? Check Residual Plot (Residuals vs. X) Are there any patterns? Check Histogram of Residuals Is it Normal?
Introduction to Regression
 Introduction to Regression Using Mult Lin Regression Derived variables Many alternative models Which model to choose? Model Criticism Modelling Objective Model Details Data and Residuals Assumptions 1
INFERENCE FOR REGRESSION
 CHAPTER 3 INFERENCE FOR REGRESSION OVERVIEW In Chapter 5 of the textbook, we first encountered regression. The assumptions that describe the regression model we use in this chapter are the following. We
23. Inference for regression
 23. Inference for regression The Practice of Statistics in the Life Sciences Third Edition 2014 W. H. Freeman and Company Objectives (PSLS Chapter 23) Inference for regression The regression model Confidence
9 Correlation and Regression
 9 Correlation and Regression SW, Chapter 12. Suppose we select n = 10 persons from the population of college seniors who plan to take the MCAT exam. Each takes the test, is coached, and then retakes the
(1) The explanatory or predictor variables may be qualitative. (We ll focus on examples where this is the case.)
 The explanatory or predictor variables may be qualitative. (We ll focus on examples where this is the case.)") Introduction to Analysis of Variance Analysis of variance models are similar to regression models, in that we re interested in learning about the relationship between a dependent variable (a response)
Introduction to Analysis of Variance Analysis of variance models are similar to regression models, in that we re interested in learning about the relationship between a dependent variable (a response)
Analysis of Bivariate Data
 Analysis of Bivariate Data Data Two Quantitative variables GPA and GAES Interest rates and indices Tax and fund allocation Population size and prison population Bivariate data (x,y) Case corr® 2 Independent
Six Sigma Black Belt Study Guides
 Six Sigma Black Belt Study Guides 1 www.pmtutor.org Powered by POeT Solvers Limited. Analyze Correlation and Regression Analysis 2 www.pmtutor.org Powered by POeT Solvers Limited. Variables and relationships
STATISTICS 110/201 PRACTICE FINAL EXAM
 STATISTICS 110/201 PRACTICE FINAL EXAM Questions 1 to 5: There is a downloadable Stata package that produces sequential sums of squares for regression. In other words, the SS is built up as each variable
Business Statistics. Lecture 10: Course Review
 Business Statistics Lecture 10: Course Review 1 Descriptive Statistics for Continuous Data Numerical Summaries Location: mean, median Spread or variability: variance, standard deviation, range, percentiles,
SMAM 314 Practice Final Examination Winter 2003
 SMAM 314 Practice Final Examination Winter 2003 You may use your textbook, one page of notes and a calculator. Please hand in the notes with your exam. 1. Mark the following statements True T or False
Ph.D. Preliminary Examination Statistics June 2, 2014
 Ph.D. Preliminary Examination Statistics June, 04 NOTES:. The exam is worth 00 points.. Partial credit may be given for partial answers if possible.. There are 5 pages in this exam paper. I have neither
1 Introduction to Minitab
 1 Introduction to Minitab Minitab is a statistical analysis software package. The software is freely available to all students and is downloadable through the Technology Tab at my.calpoly.edu. When you
28. SIMPLE LINEAR REGRESSION III
 28. SIMPLE LINEAR REGRESSION III Fitted Values and Residuals To each observed x i, there corresponds a y-value on the fitted line, y = βˆ + βˆ x. The are called fitted values. ŷ i They are the values of
STA441: Spring Multiple Regression. This slide show is a free open source document. See the last slide for copyright information.
 STA441: Spring 2018 Multiple Regression This slide show is a free open source document. See the last slide for copyright information. 1 Least Squares Plane 2 Statistical MODEL There are p-1 explanatory
22S39: Class Notes / November 14, 2000 back to start 1
 Model diagnostics Interpretation of fitted regression model 22S39: Class Notes / November 14, 2000 back to start 1 Model diagnostics 22S39: Class Notes / November 14, 2000 back to start 2 Model diagnostics
MULTIPLE LINEAR REGRESSION IN MINITAB
 MULTIPLE LINEAR REGRESSION IN MINITAB This document shows a complicated Minitab multiple regression. It includes descriptions of the Minitab commands, and the Minitab output is heavily annotated. Comments
Lecture 1 Linear Regression with One Predictor Variable.p2
 Lecture Linear Regression with One Predictor Variablep - Basics - Meaning of regression parameters p - β - the slope of the regression line -it indicates the change in mean of the probability distn of
Final Exam Bus 320 Spring 2000 Russell
 Name Final Exam Bus 320 Spring 2000 Russell Do not turn over this page until you are told to do so. You will have 3 hours minutes to complete this exam. The exam has a total of 100 points and is divided
Mathematical Notation Math Introduction to Applied Statistics
 Mathematical Notation Math 113 - Introduction to Applied Statistics Name : Use Word or WordPerfect to recreate the following documents. Each article is worth 10 points and can be printed and given to the
Lecture 18: Simple Linear Regression
 Lecture 18: Simple Linear Regression BIOS 553 Department of Biostatistics University of Michigan Fall 2004 The Correlation Coefficient: r The correlation coefficient (r) is a number that measures the strength
2.4.3 Estimatingσ Coefficient of Determination 2.4. ASSESSING THE MODEL 23
 2.4. ASSESSING THE MODEL 23 2.4.3 Estimatingσ 2 Note that the sums of squares are functions of the conditional random variables Y i = (Y X = x i ). Hence, the sums of squares are random variables as well.
STAT 212 Business Statistics II 1
 STAT 1 Business Statistics II 1 KING FAHD UNIVERSITY OF PETROLEUM & MINERALS DEPARTMENT OF MATHEMATICAL SCIENCES DHAHRAN, SAUDI ARABIA STAT 1: BUSINESS STATISTICS II Semester 091 Final Exam Thursday Feb
(4) 1. Create dummy variables for Town. Name these dummy variables A and B. These 0,1 variables now indicate the location of the house.
 1. Create dummy variables for Town. Name these dummy variables A and B. These 0,1 variables now indicate the location of the house.") Exam 3 Resource Economics 312 Introductory Econometrics Please complete all questions on this exam. The data in the spreadsheet: Exam 3- Home Prices.xls are to be used for all analyses. These data are
Exam 3 Resource Economics 312 Introductory Econometrics Please complete all questions on this exam. The data in the spreadsheet: Exam 3- Home Prices.xls are to be used for all analyses. These data are
10. Alternative case influence statistics
 10. Alternative case influence statistics a. Alternative to D i : dffits i (and others) b. Alternative to studres i : externally-studentized residual c. Suggestion: use whatever is convenient with the
Inference for Regression Inference about the Regression Model and Using the Regression Line
 Inference for Regression Inference about the Regression Model and Using the Regression Line PBS Chapter 10.1 and 10.2 2009 W.H. Freeman and Company Objectives (PBS Chapter 10.1 and 10.2) Inference about
Difference in two or more average scores in different groups
 ANOVAs Analysis of Variance (ANOVA) Difference in two or more average scores in different groups Each participant tested once Same outcome tested in each group Simplest is one-way ANOVA (one variable as
The simple linear regression model discussed in Chapter 13 was written as
 1519T_c14 03/27/2006 07:28 AM Page 614 Chapter Jose Luis Pelaez Inc/Blend Images/Getty Images, Inc./Getty Images, Inc. 14 Multiple Regression 14.1 Multiple Regression Analysis 14.2 Assumptions of the Multiple
Variance. Standard deviation VAR = = value. Unbiased SD = SD = 10/23/2011. Functional Connectivity Correlation and Regression.
 10/3/011 Functional Connectivity Correlation and Regression Variance VAR = Standard deviation Standard deviation SD = Unbiased SD = 1 10/3/011 Standard error Confidence interval SE = CI = = t value for
Apart from this page, you are not permitted to read the contents of this question paper until instructed to do so by an invigilator.
 B. Sc. Examination by course unit 2014 MTH5120 Statistical Modelling I Duration: 2 hours Date and time: 16 May 2014, 1000h 1200h Apart from this page, you are not permitted to read the contents of this
Orthogonal contrasts for a 2x2 factorial design Example p130
 Week 9: Orthogonal comparisons for a 2x2 factorial design. The general two-factor factorial arrangement. Interaction and additivity. ANOVA summary table, tests, CIs. Planned/post-hoc comparisons for the
OHSU OGI Class ECE-580-DOE :Design of Experiments Steve Brainerd
 Why We Use Analysis of Variance to Compare Group Means and How it Works The question of how to compare the population means of more than two groups is an important one to researchers. Let us suppose that
Concordia University (5+5)Q 1.
Q 1.") (5+5)Q 1. Concordia University Department of Mathematics and Statistics Course Number Section Statistics 360/1 40 Examination Date Time Pages Mid Term Test May 26, 2004 Two Hours 3 Instructor Course Examiner
(5+5)Q 1. Concordia University Department of Mathematics and Statistics Course Number Section Statistics 360/1 40 Examination Date Time Pages Mid Term Test May 26, 2004 Two Hours 3 Instructor Course Examiner
Multiple Regression Methods
 Chapter 1: Multiple Regression Methods Hildebrand, Ott and Gray Basic Statistical Ideas for Managers Second Edition 1 Learning Objectives for Ch. 1 The Multiple Linear Regression Model How to interpret
Estimating σ 2. We can do simple prediction of Y and estimation of the mean of Y at any value of X.
 Estimating σ 2 We can do simple prediction of Y and estimation of the mean of Y at any value of X. To perform inferences about our regression line, we must estimate σ 2, the variance of the error term.
In Class Review Exercises Vartanian: SW 540
 In Class Review Exercises Vartanian: SW 540 1. Given the following output from an OLS model looking at income, what is the slope and intercept for those who are black and those who are not black? b SE
STA220H1F Term Test Oct 26, Last Name: First Name: Student #: TA s Name: or Tutorial Room:
 STA0HF Term Test Oct 6, 005 Last Name: First Name: Student #: TA s Name: or Tutorial Room: Time allowed: hour and 45 minutes. Aids: one sided handwritten aid sheet + non-programmable calculator Statistical
III. Inferential Tools
 III. Inferential Tools A. Introduction to Bat Echolocation Data (10.1.1) 1. Q: Do echolocating bats expend more enery than non-echolocating bats and birds, after accounting for mass? 2. Strategy: (i) Explore
Stat 231 Final Exam. Consider first only the measurements made on housing number 1.
 December 16, 1997 Stat 231 Final Exam Professor Vardeman 1. The first page of printout attached to this exam summarizes some data (collected by a student group) on the diameters of holes bored in certain
Answer Keys to Homework#10
 Answer Keys to Homework#10 Problem 1 Use either restricted or unrestricted mixed models. Problem 2 (a) First, the respective means for the 8 level combinations are listed in the following table A B C Mean
Assignment 9 Answer Keys
 Assignment 9 Answer Keys Problem 1 (a) First, the respective means for the 8 level combinations are listed in the following table A B C Mean 26.00 + 34.67 + 39.67 + + 49.33 + 42.33 + + 37.67 + + 54.67
Lecture 10: F -Tests, ANOVA and R 2
 Lecture 10: F -Tests, ANOVA and R 2 1 ANOVA We saw that we could test the null hypothesis that β 1 0 using the statistic ( β 1 0)/ŝe. (Although I also mentioned that confidence intervals are generally
PART I. (a) Describe all the assumptions for a normal error regression model with one predictor variable,
 Describe all the assumptions for a normal error regression model with one predictor variable,") Concordia University Department of Mathematics and Statistics Course Number Section Statistics 360/2 01 Examination Date Time Pages Final December 2002 3 hours 6 Instructors Course Examiner Marks Y.P.
Concordia University Department of Mathematics and Statistics Course Number Section Statistics 360/2 01 Examination Date Time Pages Final December 2002 3 hours 6 Instructors Course Examiner Marks Y.P.
Chapter 14. Simple Linear Regression Preliminary Remarks The Simple Linear Regression Model
 Chapter 14 Simple Linear Regression 14.1 Preliminary Remarks We have only three lectures to introduce the ideas of regression. Worse, they are the last three lectures when you have many other things academic
Residual Analysis for two-way ANOVA The twoway model with K replicates, including interaction,
 Residual Analysis for two-way ANOVA The twoway model with K replicates, including interaction, is Y ijk = µ ij + ɛ ijk = µ + α i + β j + γ ij + ɛ ijk with i = 1,..., I, j = 1,..., J, k = 1,..., K. In carrying
Business Statistics. Lecture 9: Simple Regression
 Business Statistics Lecture 9: Simple Regression 1 On to Model Building! Up to now, class was about descriptive and inferential statistics Numerical and graphical summaries of data Confidence intervals
Chapter 26 Multiple Regression, Logistic Regression, and Indicator Variables
 Chapter 26 Multiple Regression, Logistic Regression, and Indicator Variables 26.1 S 4 /IEE Application Examples: Multiple Regression An S 4 /IEE project was created to improve the 30,000-footlevel metric
Disadvantages of using many pooled t procedures. The sampling distribution of the sample means. The variability between the sample means
 Stat 529 (Winter 2011) Analysis of Variance (ANOVA) Reading: Sections 5.1 5.3. Introduction and notation Birthweight example Disadvantages of using many pooled t procedures The analysis of variance procedure
Applied Regression Analysis. Section 2: Multiple Linear Regression
 Applied Regression Analysis Section 2: Multiple Linear Regression 1 The Multiple Regression Model Many problems involve more than one independent variable or factor which affects the dependent or response
ACOVA and Interactions
 Chapter 15 ACOVA and Interactions Analysis of covariance (ACOVA) incorporates one or more regression variables into an analysis of variance. As such, we can think of it as analogous to the two-way ANOVA
Inference for the Regression Coefficient
 Inference for the Regression Coefficient Recall, b 0 and b 1 are the estimates of the slope β 1 and intercept β 0 of population regression line. We can shows that b 0 and b 1 are the unbiased estimates
Quantitative Techniques - Lecture 8: Estimation
 Quantitative Techniques - Lecture 8: Estimation Key words: Estimation, hypothesis testing, bias, e ciency, least squares Hypothesis testing when the population variance is not known roperties of estimates
EXAM IN TMA4255 EXPERIMENTAL DESIGN AND APPLIED STATISTICAL METHODS
 Norges teknisk naturvitenskapelige universitet Institutt for matematiske fag Side 1 av 8 Contact during exam: Bo Lindqvist Tel. 975 89 418 EXAM IN TMA4255 EXPERIMENTAL DESIGN AND APPLIED STATISTICAL METHODS
Keppel, G. & Wickens, T.D. Design and Analysis Chapter 2: Sources of Variability and Sums of Squares
 Keppel, G. & Wickens, T.D. Design and Analysis Chapter 2: Sources of Variability and Sums of Squares K&W introduce the notion of a simple experiment with two conditions. Note that the raw data (p. 16)
AP Statistics Cumulative AP Exam Study Guide
 AP Statistics Cumulative AP Eam Study Guide Chapters & 3 - Graphs Statistics the science of collecting, analyzing, and drawing conclusions from data. Descriptive methods of organizing and summarizing statistics
Basic Business Statistics, 10/e
 Chapter 4 4- Basic Business Statistics th Edition Chapter 4 Introduction to Multiple Regression Basic Business Statistics, e 9 Prentice-Hall, Inc. Chap 4- Learning Objectives In this chapter, you learn:
STAT 3A03 Applied Regression With SAS Fall 2017
 STAT 3A03 Applied Regression With SAS Fall 2017 Assignment 2 Solution Set Q. 1 I will add subscripts relating to the question part to the parameters and their estimates as well as the errors and residuals.
Review of Multiple Regression
 Ronald H. Heck 1 Let s begin with a little review of multiple regression this week. Linear models [e.g., correlation, t-tests, analysis of variance (ANOVA), multiple regression, path analysis, multivariate
Stats fest Analysis of variance. Single factor ANOVA. Aims. Single factor ANOVA. Data
 1 Stats fest 2007 Analysis of variance murray.logan@sci.monash.edu.au Single factor ANOVA 2 Aims Description Investigate differences between population means Explanation How much of the variation in response
Table of z values and probabilities for the standard normal distribution. z is the first column plus the top row. Each cell shows P(X z).
.") Table of z values and probabilities for the standard normal distribution. z is the first column plus the top row. Each cell shows P(X z). For example P(X 1.04) =.8508. For z < 0 subtract the value from
Table of z values and probabilities for the standard normal distribution. z is the first column plus the top row. Each cell shows P(X z). For example P(X 1.04) =.8508. For z < 0 subtract the value from
CRP 272 Introduction To Regression Analysis
 CRP 272 Introduction To Regression Analysis 30 Relationships Among Two Variables: Interpretations One variable is used to explain another variable X Variable Independent Variable Explaining Variable Exogenous