Solution: X = , Y = = = = =
|
|
|
- Adela Day
- 6 years ago
- Views:
Transcription
1 Q1.19) Grade point average. The director of admissions of a small college selected 120 students at random from the new freshman class in a study to determine whether a student's grade point average (OPA) at the end of the freshman year (Y) can be predicted from the ACT test score (X). The results of the study follow. Assume that first-order regression model (1.1) is appropriate. a. Obtain the least squares estimates of β 0 and β 1, and state the estimated regression function. b. Plot the estimated regression function and the data."does the estimated regression function appear to fit the data well? c. Obtain a point estimate of the mean freshman OPA for students with ACT test score X = 30. d. What is the point estimate of the change in the mean response when the entrance test score increases by one point?
2 Solution: X = , Y = n=120 (X i X ) (Y i Y ) = n=120 (X i X ) 2 n=120 (Y i Y ) 2 b 1 = β 1 = n=120 = = (X i X )(Y i Y ) n=120(x i X ) 2 = = b 0 = β 0 = Y b 1 X = = Y = X
3 At X=30 Y ĥ = (30) = when the entrance test score increases by one point, the mean response increase by Q2.4. Refer to Grade point average Problem a. Obtain a 99 percent confidence interval for β 1. Interpret your confidence interval. Does it include zero? Why might the director of admissions be interested in whether the confidence interval includes zero? Solution: By using Minitab: Stat Regression Regression Fit Regression Mode
4
5
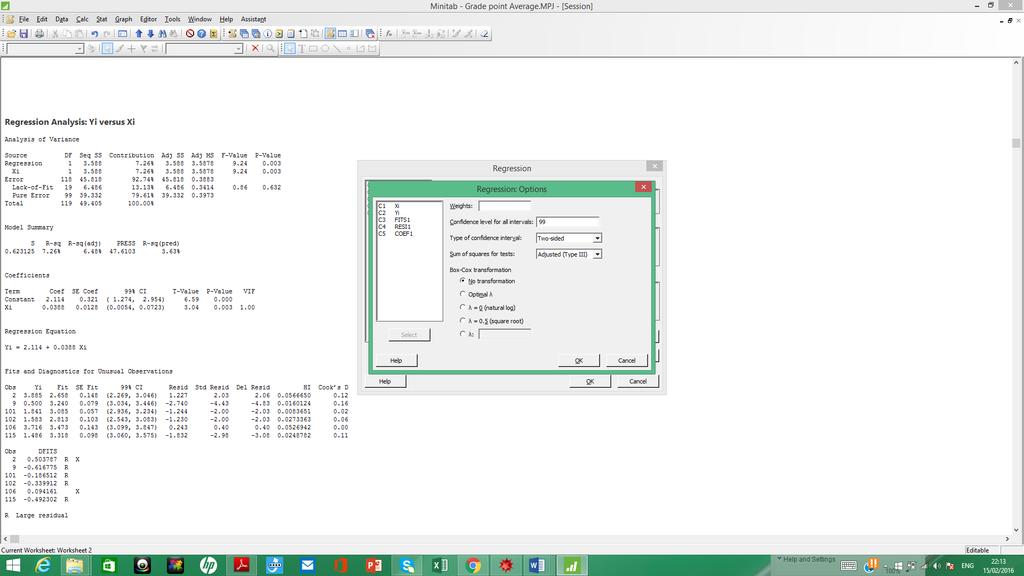
6 Regression Analysis: Yi versus Xi Analysis of Variance Source DF Seq SS Contribution Adj SS Adj MS F-Value P-Value Regression % Xi % Error n-2= % SSE=45.818MSE= Lack-of-Fit % Pure Error % Total % Model Summary S R-sq R-sq(adj) PRESS R-sq(pred) % 6.48% %
7 Coefficients Term Coef SECoef 99% CI T-Value P-Value VIF Constant ( 1.274, 2.954) Xi (0.0054, ) Regression Equation Yi = Xi 99% C.I for β 1 : b 1 t (1 α 2,n 2)s(b 1 ) β 1 b 1 + t (1 α/2,n 2) s(b 1 ) β Interpret your confidence interval. Does it include zero? No Why might the director of admissions be interested in whether the confidence interval includes zero? If the C.I of β 1 include zero, then β 1 can tack zero and β 1 = 0
8 b. Test, using the test statistic t*, whether or not a linear association exists between student's ACT score (X) and GPA at the end of the freshman year (Y). Use a level of significance of 0.01 State the alternatives, decision rule, and conclusion. α = Hypothesis H 0 : β 1 = 0 H 1 : β Test statistic T 0 = b 1 β 10 = b 1 s(b 1 ) s(b 1 ) = = Decision: Reject H 0 if T 0 > t α (1,n 2), 3.04 > t (0.995,118) = Then reject H 0 c. What is the P-value of your test in part (b)? How does it support the conclusion reached in part (b)? p-value= 0.003<0.01, then we reject H 0.
9 2.13 Refer to Grade point average. Calculate R 2. What proportion of the variation in Y is accounted for by introducing X into the regression model? From page 98 X = , n=120 (X i X ) 2 = Analysis of Variance Source DF Adj SS Adj MS F-Value P-Value Regression 1 SSR= Xi Error 118 SSE= MSE= Lack-of-Fit Pure Error Total 119 SSTo= Model Summary S R-sq R-sq(adj) R-sq(pred) % 6.48% 3.63%
10 R 2 = SSR SSTo = = R 2 = 1 SSE SSTo = = = This means that 7.26% of change in the mean freshman OPA for students is by ACT test score a. Obtain a 95 percent interval estimate of the mean freshman OPA for students whose ACT test score is 28. Interpret your confidence interval. From page 76- to 79 Y ĥ = b 0 + b 1 X h s 2 (Y ĥ ) = MSE ( 1 n + (X h X ) 2 n (X i X ) 2 ) Y ĥ ± t (1 α 2 ; n 2) s(y ĥ) α = 0.05, α 2 = 0.025
11 At X h = 28 Y ĥ = (28) = s 2 (Y ĥ ) = MSE ( 1 n + (X h X ) 2 n (X i X ) 2 ) s 2 (Y ĥ ) = MSE ( 1 n + (X h X ) 2 n (X i X ) 2 = s(y ĥ ) = = ) = ( ( )2 + ) t (1 α 2 ; n 2) = t(0.975; 118) = ± (0.0706) < E(Y h ) <
12 b. Mary Jones obtained a score of 28 on the entrance test. Predict her freshman OPAusing a 95 percent prediction interval. Interpret your prediction interval. s 2 (Y ) new = MSE (1 + 1 n + (X h X ) 2 n (X i X ) 2 = ) = s(y new ± (0.6271) s 2 (Y ) new = MSE (1 + 1 n + (X h X ) 2 n (X i X ) 2 ) Y ĥ ± t (1 α 2 ; n 2) s(y ) new ) = ( < Y h(new) < ( )2 + ) c. Is the prediction interval in part (b) wider than the confidence interval in part (a)? Should it be? هل فترة الثقة للتنبؤ في الجزء )ب( أوسع من فترة الثقة في الجزء )أ( هل يجب أن تكون Yes, Yes
13 Q1.20) Copier maintenance. The Tri-City Office Equipment Corporation sells an imported copier on a franchise basis and performs preventive maintenance and repair service on this copier. The data below have been collected from 45 recent calls on users to perform routine preventive maintenance service; for each call, X is the number of copiers serviced and Y is the total number of minutes spent by the service person. Assume that first-order regression model (1.1) is appropriate. )مصنع يعمل على الصنعة الوقائية( هوعددالناسخ اتالخدمات X.هوالعدداإلجماليللدقائقالتييقضيهاالشخصالخدمة Y a. Obtain the estimated regression function. b. Plot the estimated regression function and the data. How well does the estimated regression function fit the data? c. Interpret b 0 in your estimated regression function. Does b 0 provide any relevant information here? Explain. d. Obtiun a poim estimate of the mean service time when X = 5 copiers are serviced.
14 Solution: X = , Y = n=120 (X i X ) (Y i Y ) = n=120 (X i X ) 2 n=120 (Y i Y ) 2 b 1 = β 1 = n=120 = = (X i X )(Y i Y ) n=120(x i X ) 2 = b 0 = β 0 = Y b 1 X = Y = X
15 At X=5 Y ĥ = (5) = Q2.5. Refer to Copier maintenance Problem n=45 n = 45, X i 45 = 230, Y i 45 = 3432, X i 2 45 = 1516, X i Y i = SSE = a. Estimate the change in the mean service time when the number of copiers serviced increases by one. Use a 90 percent confidence interval. Interpret your confidence interval. 90% C.I for β 1 : b 1 t (1 α 2,n 2)s(b 1 ) β 1 b 1 + t (1 α/2,n 2) s(b 1 ) α = = 0.1
16 n b 1 = (X i X )(Y i Y ) n (X i X ) 2 = (X iy i X Y i X i Y + X Y ) n (X 2 i 2X X i + X 2 ) = = s 2 MSE /(45 2) (b 1 ) = n (X i X ) 2 = = s(b 1 ) = = n = n X iy i n 2 X i nx Y nx 2 t α (1 2,n 2) = t (0.95,43) = b 1 t α (1 2,n 2)s(b 1 ) = = b 1 + t α (1 2,n 2)s(b 1 ) = = β
17 b. Conduct a t test to determine whether or not there is a linear association between X and Y here; control the α a risk at State the alternatives, decision rule, and conclusion. What is the P-value of your test? α = Hypothesis H 0 : β 1 = 0 H 1 : β Test statistic T 0 = b 1 β 10 = b 1 s(b 1 ) s(b 1 ) = = Decision: Reject H 0 if T 0 > t α (1,n 2), > t (0.995,43) = Then reject H 0 p-value=2p(t (n 2) > T 0 ) = 2 (1 P(t (n 2) < )) = 2(1 1) 0.00 < 0.01, then we reject H 0. c. Are your results in parts (a) and (b) consistent? Explain. Yes, the C.I of β 1 does not include zero, and we reject H 0.
18 d. The manufacturer has suggested that the mean required time should not increase by more than 14 minutes for each additional copier that is serviced on a service call. Conduct a test to decide whether this standard is being satisfied by Tri-City. Control the risk of a Type I error at State the alternatives, decision rule, and conclusion. What is the P-value of the test? α = Hypothesis H 0 : β 1 14 H 1 : β 1 > Test statistic T 0 = b 1 β 10 = b = = s(b 1 ) s(b 1 ) Decision: Reject H 0 if T 0 > t (1 α,n 2), > t (0.95,43) = Then reject H 0 p-value=p(t (n 2) > T 0 ) = (1 P(t (n 2) < 2.143)) = ( ) = < 0.05, then we reject H 0.
Solution: X = , Y = = =
 Chapter 1 Q1.19) Grade poit average. The director of admissios of a small college selected 120 studets at radom from the ew freshma class i a study to determie whether a studet's grade poit average (OPA)
Solution: X = , Y = = =
 Chapter 1 Q1.19) Grade poit average. The director of admissios of a small college selected 120 studets at radom from the ew freshma class i a study to determie whether a studet's grade poit average (OPA)
Exercises on Chapter 2: Linear Regression with one independent variable:
 Exercises on Chapter 2: Linear Regression with one independent variable: Summary: Simple Linear Regression Model: (distribution of error terms unspecified) (2.1) where, value of the response variable in
STA 108 Applied Linear Models: Regression Analysis Spring Solution for Homework #6
 STA 8 Applied Linear Models: Regression Analysis Spring 011 Solution for Homework #6 6. a) = 11 1 31 41 51 1 3 4 5 11 1 31 41 51 β = β1 β β 3 b) = 1 1 1 1 1 11 1 31 41 51 1 3 4 5 β = β 0 β1 β 6.15 a) Stem-and-leaf
STAT 360-Linear Models
 STAT 360-Linear Models Instructor: Yogendra P. Chaubey Sample Test Questions Fall 004 Note: The following questions are from previous tests and exams. The final exam will be for three hours and will contain
Model Building Chap 5 p251
 Model Building Chap 5 p251 Models with one qualitative variable, 5.7 p277 Example 4 Colours : Blue, Green, Lemon Yellow and white Row Blue Green Lemon Insects trapped 1 0 0 1 45 2 0 0 1 59 3 0 0 1 48 4
STA 302 H1F / 1001 HF Fall 2007 Test 1 October 24, 2007
 STA 302 H1F / 1001 HF Fall 2007 Test 1 October 24, 2007 LAST NAME: SOLUTIONS FIRST NAME: STUDENT NUMBER: ENROLLED IN: (circle one) STA 302 STA 1001 INSTRUCTIONS: Time: 90 minutes Aids allowed: calculator.
Analysis of Covariance. The following example illustrates a case where the covariate is affected by the treatments.
 Analysis of Covariance In some experiments, the experimental units (subjects) are nonhomogeneous or there is variation in the experimental conditions that are not due to the treatments. For example, a
The simple linear regression model discussed in Chapter 13 was written as
 1519T_c14 03/27/2006 07:28 AM Page 614 Chapter Jose Luis Pelaez Inc/Blend Images/Getty Images, Inc./Getty Images, Inc. 14 Multiple Regression 14.1 Multiple Regression Analysis 14.2 Assumptions of the Multiple
Lecture 10 Multiple Linear Regression
 Lecture 10 Multiple Linear Regression STAT 512 Spring 2011 Background Reading KNNL: 6.1-6.5 10-1 Topic Overview Multiple Linear Regression Model 10-2 Data for Multiple Regression Y i is the response variable
[4+3+3] Q 1. (a) Describe the normal regression model through origin. Show that the least square estimator of the regression parameter is given by
![[4+3+3] Q 1. (a) Describe the normal regression model through origin. Show that the least square estimator of the regression parameter is given by](/thumbs/75/71895393.jpg "[4+3+3] Q 1. (a) Describe the normal regression model through origin. Show that the least square estimator of the regression parameter is given by") Concordia University Department of Mathematics and Statistics Course Number Section Statistics 360/1 40 Examination Date Time Pages Final June 2004 3 hours 7 Instructors Course Examiner Marks Y.P. Chaubey
Concordia University Department of Mathematics and Statistics Course Number Section Statistics 360/1 40 Examination Date Time Pages Final June 2004 3 hours 7 Instructors Course Examiner Marks Y.P. Chaubey
Correlation Analysis
 Simple Regression Correlation Analysis Correlation analysis is used to measure strength of the association (linear relationship) between two variables Correlation is only concerned with strength of the
Inference for Regression
 Inference for Regression Section 9.4 Cathy Poliak, Ph.D. cathy@math.uh.edu Office in Fleming 11c Department of Mathematics University of Houston Lecture 13b - 3339 Cathy Poliak, Ph.D. cathy@math.uh.edu
Basic Business Statistics, 10/e
 Chapter 4 4- Basic Business Statistics th Edition Chapter 4 Introduction to Multiple Regression Basic Business Statistics, e 9 Prentice-Hall, Inc. Chap 4- Learning Objectives In this chapter, you learn:
Multiple Regression Examples
 Multiple Regression Examples Example: Tree data. we have seen that a simple linear regression of usable volume on diameter at chest height is not suitable, but that a quadratic model y = β 0 + β 1 x +
Figure 1: The fitted line using the shipment route-number of ampules data. STAT5044: Regression and ANOVA The Solution of Homework #2 Inyoung Kim
 0.0 1.0 1.5 2.0 2.5 3.0 8 10 12 14 16 18 20 22 y x Figure 1: The fitted line using the shipment route-number of ampules data STAT5044: Regression and ANOVA The Solution of Homework #2 Inyoung Kim Problem#
Confidence Interval for the mean response
 Week 3: Prediction and Confidence Intervals at specified x. Testing lack of fit with replicates at some x's. Inference for the correlation. Introduction to regression with several explanatory variables.
PART I. (a) Describe all the assumptions for a normal error regression model with one predictor variable,
 Describe all the assumptions for a normal error regression model with one predictor variable,") Concordia University Department of Mathematics and Statistics Course Number Section Statistics 360/2 01 Examination Date Time Pages Final December 2002 3 hours 6 Instructors Course Examiner Marks Y.P.
Concordia University Department of Mathematics and Statistics Course Number Section Statistics 360/2 01 Examination Date Time Pages Final December 2002 3 hours 6 Instructors Course Examiner Marks Y.P.
Chapter 14 Multiple Regression Analysis
 Chapter 14 Multiple Regression Analysis 1. a. Multiple regression equation b. the Y-intercept c. $374,748 found by Y ˆ = 64,1 +.394(796,) + 9.6(694) 11,6(6.) (LO 1) 2. a. Multiple regression equation b.
W&M CSCI 688: Design of Experiments Homework 2. Megan Rose Bryant
 W&M CSCI 688: Design of Experiments Homework 2 Megan Rose Bryant September 25, 201 3.5 The tensile strength of Portland cement is being studied. Four different mixing techniques can be used economically.
Lecture 18 MA Applied Statistics II D 2004
 Lecture 18 MA 2612 - Applied Statistics II D 2004 Today 1. Examples of multiple linear regression 2. The modeling process (PNC 8.4) 3. The graphical exploration of multivariable data (PNC 8.5) 4. Fitting
Multiple Regression Methods
 Chapter 1: Multiple Regression Methods Hildebrand, Ott and Gray Basic Statistical Ideas for Managers Second Edition 1 Learning Objectives for Ch. 1 The Multiple Linear Regression Model How to interpret
2.1: Inferences about β 1
 Chapter 2 1 2.1: Inferences about β 1 Test of interest throughout regression: Need sampling distribution of the estimator b 1. Idea: If b 1 can be written as a linear combination of the responses (which
Chapter 15 Multiple Regression
 Multiple Regression Learning Objectives 1. Understand how multiple regression analysis can be used to develop relationships involving one dependent variable and several independent variables. 2. Be able
Basic Business Statistics 6 th Edition
 Basic Business Statistics 6 th Edition Chapter 12 Simple Linear Regression Learning Objectives In this chapter, you learn: How to use regression analysis to predict the value of a dependent variable based
Table 1: Fish Biomass data set on 26 streams
 Math 221: Multiple Regression S. K. Hyde Chapter 27 (Moore, 5th Ed.) The following data set contains observations on the fish biomass of 26 streams. The potential regressors from which we wish to explain
Ch 13 & 14 - Regression Analysis
 Ch 3 & 4 - Regression Analysis Simple Regression Model I. Multiple Choice:. A simple regression is a regression model that contains a. only one independent variable b. only one dependent variable c. more
Concordia University (5+5)Q 1.
Q 1.") (5+5)Q 1. Concordia University Department of Mathematics and Statistics Course Number Section Statistics 360/1 40 Examination Date Time Pages Mid Term Test May 26, 2004 Two Hours 3 Instructor Course Examiner
(5+5)Q 1. Concordia University Department of Mathematics and Statistics Course Number Section Statistics 360/1 40 Examination Date Time Pages Mid Term Test May 26, 2004 Two Hours 3 Instructor Course Examiner
Lecture 18: Simple Linear Regression
 Lecture 18: Simple Linear Regression BIOS 553 Department of Biostatistics University of Michigan Fall 2004 The Correlation Coefficient: r The correlation coefficient (r) is a number that measures the strength
UNIVERSITY OF TORONTO SCARBOROUGH Department of Computer and Mathematical Sciences Midterm Test, October 2013
 UNIVERSITY OF TORONTO SCARBOROUGH Department of Computer and Mathematical Sciences Midterm Test, October 2013 STAC67H3 Regression Analysis Duration: One hour and fifty minutes Last Name: First Name: Student
Ch 2: Simple Linear Regression
 Ch 2: Simple Linear Regression 1. Simple Linear Regression Model A simple regression model with a single regressor x is y = β 0 + β 1 x + ɛ, where we assume that the error ɛ is independent random component
Lecture 1 Linear Regression with One Predictor Variable.p2
 Lecture Linear Regression with One Predictor Variablep - Basics - Meaning of regression parameters p - β - the slope of the regression line -it indicates the change in mean of the probability distn of
Homework 2: Simple Linear Regression
 STAT 4385 Applied Regression Analysis Homework : Simple Linear Regression (Simple Linear Regression) Thirty (n = 30) College graduates who have recently entered the job market. For each student, the CGPA
Chapter 6 Multiple Regression
 STAT 525 FALL 2018 Chapter 6 Multiple Regression Professor Min Zhang The Data and Model Still have single response variable Y Now have multiple explanatory variables Examples: Blood Pressure vs Age, Weight,
Biostatistics 380 Multiple Regression 1. Multiple Regression
 Biostatistics 0 Multiple Regression ORIGIN 0 Multiple Regression Multiple Regression is an extension of the technique of linear regression to describe the relationship between a single dependent (response)
This document contains 3 sets of practice problems.
 P RACTICE PROBLEMS This document contains 3 sets of practice problems. Correlation: 3 problems Regression: 4 problems ANOVA: 8 problems You should print a copy of these practice problems and bring them
ECO220Y Simple Regression: Testing the Slope
 ECO220Y Simple Regression: Testing the Slope Readings: Chapter 18 (Sections 18.3-18.5) Winter 2012 Lecture 19 (Winter 2012) Simple Regression Lecture 19 1 / 32 Simple Regression Model y i = β 0 + β 1 x
(4) 1. Create dummy variables for Town. Name these dummy variables A and B. These 0,1 variables now indicate the location of the house.
 1. Create dummy variables for Town. Name these dummy variables A and B. These 0,1 variables now indicate the location of the house.") Exam 3 Resource Economics 312 Introductory Econometrics Please complete all questions on this exam. The data in the spreadsheet: Exam 3- Home Prices.xls are to be used for all analyses. These data are
Exam 3 Resource Economics 312 Introductory Econometrics Please complete all questions on this exam. The data in the spreadsheet: Exam 3- Home Prices.xls are to be used for all analyses. These data are
Apart from this page, you are not permitted to read the contents of this question paper until instructed to do so by an invigilator.
 B. Sc. Examination by course unit 2014 MTH5120 Statistical Modelling I Duration: 2 hours Date and time: 16 May 2014, 1000h 1200h Apart from this page, you are not permitted to read the contents of this
Formal Statement of Simple Linear Regression Model
 Formal Statement of Simple Linear Regression Model Y i = β 0 + β 1 X i + ɛ i Y i value of the response variable in the i th trial β 0 and β 1 are parameters X i is a known constant, the value of the predictor
Multiple Linear Regression
 Multiple Linear Regression Simple linear regression tries to fit a simple line between two variables Y and X. If X is linearly related to Y this explains some of the variability in Y. In most cases, there
Chapter 12 - Lecture 2 Inferences about regression coefficient
 Chapter 12 - Lecture 2 Inferences about regression coefficient April 19th, 2010 Facts about slope Test Statistic Confidence interval Hypothesis testing Test using ANOVA Table Facts about slope In previous
Chapter 14. Multiple Regression Models. Multiple Regression Models. Multiple Regression Models
 Chapter 14 Multiple Regression Models 1 Multiple Regression Models A general additive multiple regression model, which relates a dependent variable y to k predictor variables,,, is given by the model equation
Models with qualitative explanatory variables p216
 Models with qualitative explanatory variables p216 Example gen = 1 for female Row gpa hsm gen 1 3.32 10 0 2 2.26 6 0 3 2.35 8 0 4 2.08 9 0 5 3.38 8 0 6 3.29 10 0 7 3.21 8 0 8 2.00 3 0 9 3.18 9 0 10 2.34
Ch 3: Multiple Linear Regression
 Ch 3: Multiple Linear Regression 1. Multiple Linear Regression Model Multiple regression model has more than one regressor. For example, we have one response variable and two regressor variables: 1. delivery
Math 3330: Solution to midterm Exam
 Math 3330: Solution to midterm Exam Question 1: (14 marks) Suppose the regression model is y i = β 0 + β 1 x i + ε i, i = 1,, n, where ε i are iid Normal distribution N(0, σ 2 ). a. (2 marks) Compute the
Six Sigma Black Belt Study Guides
 Six Sigma Black Belt Study Guides 1 www.pmtutor.org Powered by POeT Solvers Limited. Analyze Correlation and Regression Analysis 2 www.pmtutor.org Powered by POeT Solvers Limited. Variables and relationships
STAT Chapter 11: Regression
 STAT 515 -- Chapter 11: Regression Mostly we have studied the behavior of a single random variable. Often, however, we gather data on two random variables. We wish to determine: Is there a relationship
Inference in Normal Regression Model. Dr. Frank Wood
 Inference in Normal Regression Model Dr. Frank Wood Remember We know that the point estimator of b 1 is b 1 = (Xi X )(Y i Ȳ ) (Xi X ) 2 Last class we derived the sampling distribution of b 1, it being
STAT420 Midterm Exam. University of Illinois Urbana-Champaign October 19 (Friday), :00 4:15p. SOLUTIONS (Yellow)
, :00 4:15p. SOLUTIONS (Yellow)") STAT40 Midterm Exam University of Illinois Urbana-Champaign October 19 (Friday), 018 3:00 4:15p SOLUTIONS (Yellow) Question 1 (15 points) (10 points) 3 (50 points) extra ( points) Total (77 points) Points
STAT40 Midterm Exam University of Illinois Urbana-Champaign October 19 (Friday), 018 3:00 4:15p SOLUTIONS (Yellow) Question 1 (15 points) (10 points) 3 (50 points) extra ( points) Total (77 points) Points
6. Multiple Linear Regression
 6. Multiple Linear Regression SLR: 1 predictor X, MLR: more than 1 predictor Example data set: Y i = #points scored by UF football team in game i X i1 = #games won by opponent in their last 10 games X
Lecture 3: Inference in SLR
 Lecture 3: Inference in SLR STAT 51 Spring 011 Background Reading KNNL:.1.6 3-1 Topic Overview This topic will cover: Review of hypothesis testing Inference about 1 Inference about 0 Confidence Intervals
CHAPTER 13: F PROBABILITY DISTRIBUTION
 CHAPTER 13: F PROBABILITY DISTRIBUTION continuous probability distribution skewed to the right variable values on horizontal axis are 0 area under the curve represents probability horizontal asymptote
Simple Regression Model Setup Estimation Inference Prediction. Model Diagnostic. Multiple Regression. Model Setup and Estimation.
 Statistical Computation Math 475 Jimin Ding Department of Mathematics Washington University in St. Louis www.math.wustl.edu/ jmding/math475/index.html October 10, 2013 Ridge Part IV October 10, 2013 1
STAT 212 Business Statistics II 1
 STAT 1 Business Statistics II 1 KING FAHD UNIVERSITY OF PETROLEUM & MINERALS DEPARTMENT OF MATHEMATICAL SCIENCES DHAHRAN, SAUDI ARABIA STAT 1: BUSINESS STATISTICS II Semester 091 Final Exam Thursday Feb
School of Mathematical Sciences. Question 1. Best Subsets Regression
 School of Mathematical Sciences MTH5120 Statistical Modelling I Practical 9 and Assignment 8 Solutions Question 1 Best Subsets Regression Response is Crime I n W c e I P a n A E P U U l e Mallows g E P
AP Statistics Unit 6 Note Packet Linear Regression. Scatterplots and Correlation
 Scatterplots and Correlation Name Hr A scatterplot shows the relationship between two quantitative variables measured on the same individuals. variable (y) measures an outcome of a study variable (x) may
Statistics for Managers using Microsoft Excel 6 th Edition
 Statistics for Managers using Microsoft Excel 6 th Edition Chapter 13 Simple Linear Regression 13-1 Learning Objectives In this chapter, you learn: How to use regression analysis to predict the value of
Multiple Linear Regression
 Andrew Lonardelli December 20, 2013 Multiple Linear Regression 1 Table Of Contents Introduction: p.3 Multiple Linear Regression Model: p.3 Least Squares Estimation of the Parameters: p.4-5 The matrix approach
Chapter 2 Inferences in Simple Linear Regression
 STAT 525 SPRING 2018 Chapter 2 Inferences in Simple Linear Regression Professor Min Zhang Testing for Linear Relationship Term β 1 X i defines linear relationship Will then test H 0 : β 1 = 0 Test requires
Chapter 26 Multiple Regression, Logistic Regression, and Indicator Variables
 Chapter 26 Multiple Regression, Logistic Regression, and Indicator Variables 26.1 S 4 /IEE Application Examples: Multiple Regression An S 4 /IEE project was created to improve the 30,000-footlevel metric
CSCI 688 Homework 6. Megan Rose Bryant Department of Mathematics William and Mary
 CSCI 688 Homework 6 Megan Rose Bryant Department of Mathematics William and Mary November 12, 2014 7.1 Consider the experiment described in Problem 6.1. Analyze this experiment assuming that each replicate
Analysis of Variance. Source DF Squares Square F Value Pr > F. Model <.0001 Error Corrected Total
 Math 221: Linear Regression and Prediction Intervals S. K. Hyde Chapter 23 (Moore, 5th Ed.) (Neter, Kutner, Nachsheim, and Wasserman) The Toluca Company manufactures refrigeration equipment as well as
Table of z values and probabilities for the standard normal distribution. z is the first column plus the top row. Each cell shows P(X z).
.") Table of z values and probabilities for the standard normal distribution. z is the first column plus the top row. Each cell shows P(X z). For example P(X.04) =.8508. For z < 0 subtract the value from,
Table of z values and probabilities for the standard normal distribution. z is the first column plus the top row. Each cell shows P(X z). For example P(X.04) =.8508. For z < 0 subtract the value from,
Applied Regression. Applied Regression. Chapter 2 Simple Linear Regression. Hongcheng Li. April, 6, 2013
 Applied Regression Chapter 2 Simple Linear Regression Hongcheng Li April, 6, 2013 Outline 1 Introduction of simple linear regression 2 Scatter plot 3 Simple linear regression model 4 Test of Hypothesis
EXAM IN TMA4255 EXPERIMENTAL DESIGN AND APPLIED STATISTICAL METHODS
 Norges teknisk naturvitenskapelige universitet Institutt for matematiske fag Side 1 av 8 Contact during exam: Bo Lindqvist Tel. 975 89 418 EXAM IN TMA4255 EXPERIMENTAL DESIGN AND APPLIED STATISTICAL METHODS
Contents. 2 2 factorial design 4
 Contents TAMS38 - Lecture 10 Response surface methodology Lecturer: Zhenxia Liu Department of Mathematics - Mathematical Statistics 12 December, 2017 2 2 factorial design Polynomial Regression model First
LEARNING WITH MINITAB Chapter 12 SESSION FIVE: DESIGNING AN EXPERIMENT
 LEARNING WITH MINITAB Chapter 12 SESSION FIVE: DESIGNING AN EXPERIMENT Laura M Williams, RN, CLNC, MSN MOREHEAD STATE UNIVERSITY IET603: STATISTICAL QUALITY ASSURANCE IN SCIENCE AND TECHNOLOGY DR. AHMAD
TMA4255 Applied Statistics V2016 (5)
") TMA4255 Applied Statistics V2016 (5) Part 2: Regression Simple linear regression [11.1-11.4] Sum of squares [11.5] Anna Marie Holand To be lectured: January 26, 2016 wiki.math.ntnu.no/tma4255/2016v/start
TMA4255 Applied Statistics V2016 (5) Part 2: Regression Simple linear regression [11.1-11.4] Sum of squares [11.5] Anna Marie Holand To be lectured: January 26, 2016 wiki.math.ntnu.no/tma4255/2016v/start
Inference for Regression Inference about the Regression Model and Using the Regression Line
 Inference for Regression Inference about the Regression Model and Using the Regression Line PBS Chapter 10.1 and 10.2 2009 W.H. Freeman and Company Objectives (PBS Chapter 10.1 and 10.2) Inference about
STAT 511. Lecture : Simple linear regression Devore: Section Prof. Michael Levine. December 3, Levine STAT 511
 STAT 511 Lecture : Simple linear regression Devore: Section 12.1-12.4 Prof. Michael Levine December 3, 2018 A simple linear regression investigates the relationship between the two variables that is not
Data Set 8: Laysan Finch Beak Widths
 Data Set 8: Finch Beak Widths Statistical Setting This handout describes an analysis of covariance (ANCOVA) involving one categorical independent variable (with only two levels) and one quantitative covariate.
Institutionen för matematik och matematisk statistik Umeå universitet November 7, Inlämningsuppgift 3. Mariam Shirdel
 Institutionen för matematik och matematisk statistik Umeå universitet November 7, 2011 Inlämningsuppgift 3 Mariam Shirdel (mash0007@student.umu.se) Kvalitetsteknik och försöksplanering, 7.5 hp 1 Uppgift
23. Inference for regression
 23. Inference for regression The Practice of Statistics in the Life Sciences Third Edition 2014 W. H. Freeman and Company Objectives (PSLS Chapter 23) Inference for regression The regression model Confidence
STA 303 H1S / 1002 HS Winter 2011 Test March 7, ab 1cde 2abcde 2fghij 3
 STA 303 H1S / 1002 HS Winter 2011 Test March 7, 2011 LAST NAME: FIRST NAME: STUDENT NUMBER: ENROLLED IN: (circle one) STA 303 STA 1002 INSTRUCTIONS: Time: 90 minutes Aids allowed: calculator. Some formulae
Inference for the Regression Coefficient
 Inference for the Regression Coefficient Recall, b 0 and b 1 are the estimates of the slope β 1 and intercept β 0 of population regression line. We can shows that b 0 and b 1 are the unbiased estimates
STAT Final Practice Problems
 STAT 48 -- Final Practice Problems.Out of 5 women who had uterine cancer, 0 claimed to have used estrogens. Out of 30 women without uterine cancer 5 claimed to have used estrogens. Exposure Outcome (Cancer)
EX1. One way ANOVA: miles versus Plug. a) What are the hypotheses to be tested? b) What are df 1 and df 2? Verify by hand. , y 3
 What are the hypotheses to be tested? b) What are df 1 and df 2? Verify by hand. , y 3") EX. Chapter 8 Examples In an experiment to investigate the performance of four different brands of spark plugs intended for the use on a motorcycle, plugs of each brand were tested and the number of miles
EX. Chapter 8 Examples In an experiment to investigate the performance of four different brands of spark plugs intended for the use on a motorcycle, plugs of each brand were tested and the number of miles
Chapter 7 Student Lecture Notes 7-1
 Chapter 7 Student Lecture Notes 7- Chapter Goals QM353: Business Statistics Chapter 7 Multiple Regression Analysis and Model Building After completing this chapter, you should be able to: Explain model
LINEAR REGRESSION ANALYSIS. MODULE XVI Lecture Exercises
 LINEAR REGRESSION ANALYSIS MODULE XVI Lecture - 44 Exercises Dr. Shalabh Department of Mathematics and Statistics Indian Institute of Technology Kanpur Exercise 1 The following data has been obtained on
STA 4210 Practise set 2a
 STA 410 Practise set a For all significance tests, use = 0.05 significance level. S.1. A multiple linear regression model is fit, relating household weekly food expenditures (Y, in $100s) to weekly income
SMAM 314 Practice Final Examination Winter 2003
 SMAM 314 Practice Final Examination Winter 2003 You may use your textbook, one page of notes and a calculator. Please hand in the notes with your exam. 1. Mark the following statements True T or False
STAT763: Applied Regression Analysis. Multiple linear regression. 4.4 Hypothesis testing
 STAT763: Applied Regression Analysis Multiple linear regression 4.4 Hypothesis testing Chunsheng Ma E-mail: cma@math.wichita.edu 4.4.1 Significance of regression Null hypothesis (Test whether all β j =
CHAPTER 13: F PROBABILITY DISTRIBUTION
 CHAPTER 13: F PROBABILITY DISTRIBUTION continuous probability distribution skewed to the right variable values on horizontal axis are 0 area under the curve represents probability horizontal asymptote
28. SIMPLE LINEAR REGRESSION III
 28. SIMPLE LINEAR REGRESSION III Fitted Values and Residuals To each observed x i, there corresponds a y-value on the fitted line, y = βˆ + βˆ x. The are called fitted values. ŷ i They are the values of
2.4.3 Estimatingσ Coefficient of Determination 2.4. ASSESSING THE MODEL 23
 2.4. ASSESSING THE MODEL 23 2.4.3 Estimatingσ 2 Note that the sums of squares are functions of the conditional random variables Y i = (Y X = x i ). Hence, the sums of squares are random variables as well.
School of Mathematical Sciences. Question 1
 School of Mathematical Sciences MTH5120 Statistical Modelling I Practical 8 and Assignment 7 Solutions Question 1 Figure 1: The residual plots do not contradict the model assumptions of normality, constant
BNAD 276 Lecture 10 Simple Linear Regression Model
 1 / 27 BNAD 276 Lecture 10 Simple Linear Regression Model Phuong Ho May 30, 2017 2 / 27 Outline 1 Introduction 2 3 / 27 Outline 1 Introduction 2 4 / 27 Simple Linear Regression Model Managerial decisions
Lecture 14. Analysis of Variance * Correlation and Regression. The McGraw-Hill Companies, Inc., 2000
 Lecture 14 Analysis of Variance * Correlation and Regression Outline Analysis of Variance (ANOVA) 11-1 Introduction 11-2 Scatter Plots 11-3 Correlation 11-4 Regression Outline 11-5 Coefficient of Determination
Lecture 14. Outline. Outline. Analysis of Variance * Correlation and Regression Analysis of Variance (ANOVA)
") Outline Lecture 14 Analysis of Variance * Correlation and Regression Analysis of Variance (ANOVA) 11-1 Introduction 11- Scatter Plots 11-3 Correlation 11-4 Regression Outline 11-5 Coefficient of Determination
Outline Lecture 14 Analysis of Variance * Correlation and Regression Analysis of Variance (ANOVA) 11-1 Introduction 11- Scatter Plots 11-3 Correlation 11-4 Regression Outline 11-5 Coefficient of Determination
Table of z values and probabilities for the standard normal distribution. z is the first column plus the top row. Each cell shows P(X z).
.") Table of z values and probabilities for the standard normal distribution. z is the first column plus the top row. Each cell shows P(X z). For example P(X 1.04) =.8508. For z < 0 subtract the value from
Table of z values and probabilities for the standard normal distribution. z is the first column plus the top row. Each cell shows P(X z). For example P(X 1.04) =.8508. For z < 0 subtract the value from
EXAM 3 Math 1342 Elementary Statistics 6-7
 EXAM 3 Math 1342 Elementary Statistics 6-7 Name Date ********************************************************************************************************************************************** MULTIPLE
Linear models and their mathematical foundations: Simple linear regression
 Linear models and their mathematical foundations: Simple linear regression Steffen Unkel Department of Medical Statistics University Medical Center Göttingen, Germany Winter term 2018/19 1/21 Introduction
STAT 212: BUSINESS STATISTICS II Third Exam Tuesday Dec 12, 6:00 PM
 STAT212_E3 KING FAHD UNIVERSITY OF PETROLEUM & MINERALS DEPARTMENT OF MATHEMATICS & STATISTICS Term 171 Page 1 of 9 STAT 212: BUSINESS STATISTICS II Third Exam Tuesday Dec 12, 2017 @ 6:00 PM Name: ID #:
Stat 231 Final Exam. Consider first only the measurements made on housing number 1.
 December 16, 1997 Stat 231 Final Exam Professor Vardeman 1. The first page of printout attached to this exam summarizes some data (collected by a student group) on the diameters of holes bored in certain
Oregon Hill Wireless Survey Regression Model and Statistical Evaluation. Sky Huvard
 Oregon Hill Wireless Survey Regression Model and Statistical Evaluation Sky Huvard Business Statistics Dr. George Canavos 4 May 2003 Overview Huvard 2 I am interested in starting a wireless broadband project
Inferences for Regression
 Inferences for Regression An Example: Body Fat and Waist Size Looking at the relationship between % body fat and waist size (in inches). Here is a scatterplot of our data set: Remembering Regression In
STAT 512 MidTerm I (2/21/2013) Spring 2013 INSTRUCTIONS
 Spring 2013 INSTRUCTIONS") STAT 512 MidTerm I (2/21/2013) Spring 2013 Name: Key INSTRUCTIONS 1. This exam is open book/open notes. All papers (but no electronic devices except for calculators) are allowed. 2. There are 5 pages in
STAT 512 MidTerm I (2/21/2013) Spring 2013 Name: Key INSTRUCTIONS 1. This exam is open book/open notes. All papers (but no electronic devices except for calculators) are allowed. 2. There are 5 pages in
Objectives Simple linear regression. Statistical model for linear regression. Estimating the regression parameters
 Objectives 10.1 Simple linear regression Statistical model for linear regression Estimating the regression parameters Confidence interval for regression parameters Significance test for the slope Confidence
Correlation & Simple Regression
 Chapter 11 Correlation & Simple Regression The previous chapter dealt with inference for two categorical variables. In this chapter, we would like to examine the relationship between two quantitative variables.