Biochip informatics-(i)
|
|
|
- Gladys Lewis
- 6 years ago
- Views:
Transcription
1 Biochip informatics-(i) : biochip normalization & differential expression Ju Han Kim, M.D., Ph.D. SNUBI: SNUBiomedical Informatics snubi.org/ Biochip Informatics - (I) Biochip basics Preprocessing Episodes 1 and 2 Global normalization Intensity dependent normalization Controlling regional variation Alternatives Differential expression Multiple hypothesis testing Classification
: rectangular matrix of spots printed using the same print-tip (or pin), aka print-tip-group Slide, Array: printed microarray Batch: collection of microarrays with the same probe layout.")
2 Biochip basics Bioinformatics pipeline Terminology Sample (Target): RNA (cdna) hybridized to the array, aka target, mobile substrate. Probe: DNA spotted on the array, aka spot, immobile substrate. Sector (Block): rectangular matrix of spots printed using the same print-tip (or pin), aka print-tip-group Slide, Array: printed microarray Batch: collection of microarrays with the same probe layout. Channel: data from one color (Cy3 = cyanine 3 = green, Cy5 = cyanine 5 = red).


3 A Biochip Informatics Strategy Interesting Patients Interesting Animals Interesting Cell Cell Lines Make Biochip Appropriate Tissue Appropriate Conditions Extract RNA Hybridize Biochip Access Significance Functional Clustering Data Preprocessing Pre- Scan Biochip Biological Validation Post-cluster Analysis & Integration Informatical Validation??? Clinical relevance of Biochip informatics Dx. Discovery Tx. Px.
4 Biochip informatics: challenges Pre-processing: technology variation noise & data filtering missing / negative values / P & A calls data scaling Can I assume normality? chip quality, other artifacts Functional Clusters: clustering quality, consistency, & robustness Statistical Issues: study design / # of replicates / multiple testing Integrative Biochip Informatics Can we get more out of it? Why integrative approach? Variables(10 s s) Variables( ) ) Case (1000 s s) Case (10 s s) High-dimensionality systems with insufficient data are extremely underdetermined Largely unlabelled data Not tractable by standard biostatistical techniques

5 Preprocessing technology variation noise & outlier detection missing / negative values / P & A calls data scaling Can I assume normality? chip quality, other artifacts Preprocessing: Noise Weighted average difference ~ ( PM MM N n θ = N n ) φ n
6 Preprocessing: missing values put in zeros row average values weighted KNN SVD (requires iteration) Preprocessing: Filtering intensity-based filter floors or cut-offs: min. expression level 2 s.d above (local) background percentage-based cut-offs also consider saturation low variance filter (across conditions) statistical filter (with replicates) low entropy filter / jackknife clustering target ambiguity filter (databases)


7 Filtering: Low entropy filter * Jackknife clustering Filtering: Low entropy filter


8 Chip quality Debris Data structure Gene expression level of gene 10 on slide 4 = Log2(Red intensity / Green intensity)
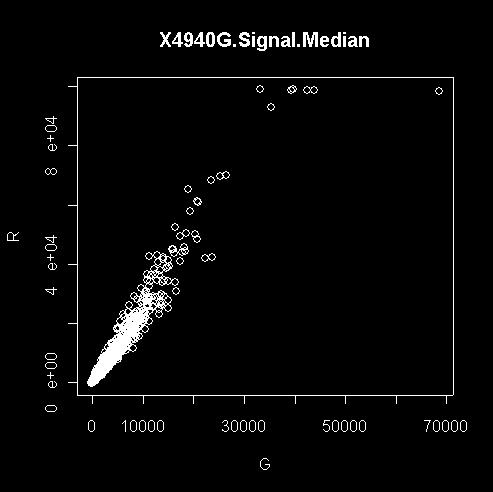
9 density plots of intensities Intensity vs. intensity plot For the same, equally-treated samples, I(R i ) = I(G i )
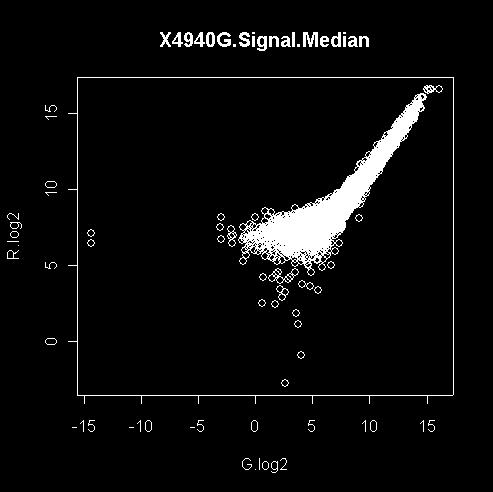
10 Intensity vs. intensity plot For different sample, what about R/G ratios? What possibly are the problems? Log transformations Pros Cons constant c.v., i.e., mean s.d. useful way of handling ratio values symmetry for up or down level of expressions & significance, low < high non-positive values only linear calibration transformations Alternatives
11 Episode - I a frequency pattern Is it typical or an artefact? Episode - II a frequency pattern Is it typical or an artifact?


12 Episode - II a frequency pattern Is it typical or an artifact? Pin tips
13 Normalization Correcting systematic variation Simple additive and multiplicative Linear vs. non-linear Sources of error Kinds? dye spotting experiment, slide scale, scanning
14 Sources of error tissue contamination mrna preparation and RNA degradation amplification efficiency reverse transcription efficiency hybridization efficiency and specificity clone identification and mapping PCR yield, contamination spotting efficiency Pin geometry DNA-support binding Dye labeling Slide variation other array manufacturing-related issues scanning image segmentation signal quantification background correction Why normalize? To correct systematic variations such as To balance the fluorescence intensities of the two dyes (green( Cy3 and red Cy5 dye) To allow the comparison of expression levels across experiments (slides) To adjust scale of the relative gene expression levels (as measured by log ratios) across replicate experiments
15 Normalization issues, cdna chips Within-slide What genes to use Location Scale Paired-slides (dye swap) Self-normalization Between slides Which genes to use? All genes Constantly expressed genes Controls Spiked controls Genomic DNA titration series Other useful set of genes
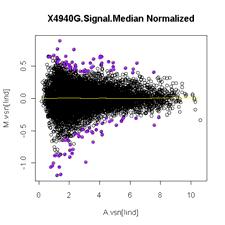
16 Global normalization Total amount of mrna measured is constant log 2 R/G log 2 R/G c = log 2 R/( /(kg) Set mean or median to zero. Assumes R and G are related by a constant factor Ignoring intensity-and and-space-dependent variations Non-parametric smoothing: lowess Spread is a function of intensity Regression without parametric assumption on a X-Y X Y plot with a kernel function and bandwidth M=log2R/G A=log2 (R/G) 1/2
17 Geometric transformations: translation Geometric transformations: translation = = = y x T T T y x P y x P, ' ' ', x y x y (b) (a) P P = ' ' y x T T y x y x y x T y y', T x x' + = + = Geometric transformations: Geometric transformations: rotation rotation x = r cos φ, y = r sin φ x = r cos (φ + θ) = r cos φ cos θ - r sin φ sin θ y = r sin (φ + θ) = r cos φ sin θ + r sin φ cos θ x = x cos θ -y sin θ, y = x sin θ + y cos θ P = R P θ θ θ θ = y x y x cos sin sin cos ' ' (x,y) r φ (x,y ) r θ
18 Geometric transformations: Geometric transformations: scaling scaling x = x sx, y = y sy Scaling factor : sx (x 축으로크기조정 ), sy (y 축으로크기조정 ) P = S P Uniform Scaling: sx = sy = y x s s y x y x 0 0 ' ' P T P + = ' P S P = ' P R P = ' P T S R T P =...) ( ' M Variance is a function of intensity Variance is a function of intensity
19 The M vs. A plot x' cos( π / 2) = y' sin( π / 2) sin( π / 2) x = cos( π / 2) y x 1 y M=log2R/G A=log2 (R/G) 1/2 M = log 2 (R/G) : log intensity-ratio A = log 2 (R*G)/2 : mean log-intensity Intensity-dependent normalization Dye bias is dependent on spot intensity! log 2 R/G log 2 R/G c(a) = log 2 R/(k(A)G) Apply a robust scatter-plot smoother, lowess The lowess() function in R with f=20% Assumes roughly symmetric up- and downs at all intensity levels
20 Nonparametric smoothing Smoothing Consider X Y plot Draw a regression line which requires no parametric assumptions The regression line is not linear The regression line is totally dependent on the data Two components of smoothing Kernel function, calculating weighted mean Bandwidth, a window span determining smoothness of the regression line Nonparametric smoothing Types of kernel functions Uniform, Triangular, Normal, Others Bandwidth The wider, the smoother Bigger impact than the kernel function
21 Global vs. print-tip tip-group lowess Roughly equal number of genes are up- or down-regulated at all intensity levels (or only few genes are expected to change)
22 Global vs. print-tip tip-group lowess For every print-tip tip group, changes roughly symmetric at all intensity levels Within print-tip tip-group box plots for print-tip tip-group normalized M

23 Taking scale into account Assumptions: all print-tip tip-group have the same spread Location / scale calibration

24 Location + scale normalization Effect of normalization
25 Location + scale normalization Biochip Informatics - (I) Biochip basics Preprocessing Episodes 1 and 2 Global normalization Intensity dependent normalization Controlling regional variation Alternatives Differential expression Multiple hypothesis testing Classification
26 Non-linear normalization RECOMB2002 Robust Non-linear Normalization A rank score for more robust identification of non-differentially expressed genes R k = p ( xki xkj ) i i, j j = 1 Assumption: there are non-differentially expressed genes at all range of median expression level 2
27
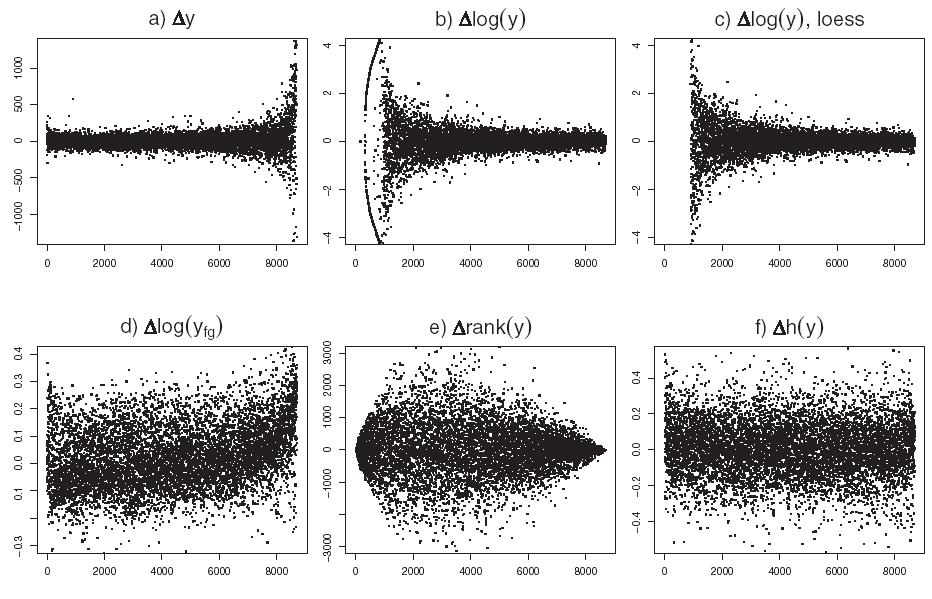
28 ---log u arsinh((u+u o )/c) intensity 2 ( ) arsinh( x) = log x + x + 1 lim x ( x x ) arsinh log log 2 = 0 Differential expression Form a statistic from the central value and spread. deviation, sum of deviation, variance, standard deviation
29 Statistical testing Form a statistic (such as T) (for each gene) from the data Calculate the null distribution(s) for the statistic Choose the rejection region Compare the statistic to the null distribution(s) of the statistic Assigning a score Form a statistic u jk jk (i) : the log 2 R/G value of the j-th gene on the k-th array in the two groups(i=1,2) log fold-change: ū j (2) - ū j (1) T: (ū j (2) - ū j (1))/s j Wilcoxon (rank sum): r j = Σr jk SAM (shrunken centroid): (ū j (2) - ū j (1))/(s j +s 0 ) Baldi s (Bayesian): (ū j (2) - ū j (1))/sqrt sqrt((1-w)s j2 +ws 02 ) * Depends on the way how the pop. variability is accounted and how to borrow strength across genes.
30 Diagnostic test characteristics D + D T + a b (α) a+b T - c (β) d c+d a+c b+d a+b+c+d Sensitivity = a / (a+c) = p(t+ D+) Specificity = d / (b+d) = p(t- D D-) Positive Predictive Value = a / (a+b) = p(d+ T+) = 1-1 FDR Negative Predictive Value = d / (c+d) = p(d- T T-) ) = power (α)) rejected a true null, (β)( ) fail to reject a false null Diagnostic test characteristics 예제 ) Sensitivity=99.99%, specificity=99.9% 인최신의에이즈검사가개발되었다. 철수는이검사에양성반응을보였다. 철수가에이즈에감염되었을확률은얼마인가? ( 현재한국인의에이즈유병율은 이라고한다.) 1. 99% 2. 95% 3. 80% 4. 50% 5. 10%
31 Diagnostic test characteristics Sensitivity=99.99% Specificity=99.9% Prevalence= T + T - AIDS 9, ,000 no AIDS 1 00, , , ,999 99,900, ,010,000 Positive predictive value = 9,999 / 109,999 < 10% Negative predictive value = 1.0 Diagnostic test characteristics T+ (TP) T- (FN) T+ (FP) T- (TN) T+ (TP) T- (FN) T+ (FP) T- (TN)
32 ROC curve Multiple testing problem Thousands of hypotheses are tested simultaneously The gene is not differentially expressed vs. there is no gene that is differentially expressed. increased chance of false positives (α,, Type-I) should adjust your p-valuesp FWER (Family-wise error rate): prob. of at least one false positive FWER = Pr(α > 0) FDR (False discovery rate): expected proportion of false positives among the rejected hypotheses ( 95)( FDR = E(α / rejected) Pr(rejected > 0) positive FDR, pfdr = E(α / rejected rejected >0)
33 Multiple hypothesis testing Biochip Informatics - (I) Biochip basics Preprocessing Episodes 1 and 2 Global normalization Intensity dependent normalization Controlling regional variation Alternatives Differential expression Multiple hypothesis testing Classification
34 Multiple testing in microarray Microarray experiments are large and exploratory 5% of FDR says that, among the 100 genes said significant about 95 may be truly significant. What dose 5% of FWER in microarray experiments? and compared to the top (arbitrary) 100 list? What about symmetric vs. asymmetric rejection regions? Robustness against the kind of dependence?. Control of the FWER Bonferroni correction complete null hypothesis that there is no gene that is differentially expressed (i.e., a+c = a+b+c+d) weak control of type-i I error FWER = Pr(α > 0) = Pr(at least one adjusted p g < c H 0 )? dependence structure Westfall/Young s minp adjusted p-valuesp by re-sampling strong control of type-i I error (i.e., regardless of a+c) step-down procedure maxt
35 Control of the FWER Golub s leukemia data FDR and SAM Statistic: d j = (ū( j (2) - ū j (1))/(s j +s 0 ) s 0 : fudge factor a small positive number choosen as the percentile of the s i values that makes the C.V. of d j approximately constant as a function of s i. Also dampens large values of that arise from genes with low expression Estimate the number m 0 of invariant genes. Taking B permutations, compute the mean number of significant genes in B. Ê(V) = #{d j : gene j unchanged and d j t 2 or d j t 1 } m * 0 /m Estimated FDR = Ê(V)/R
36 The SAM procedure Compute the ordered statistics d (1) d (2) d (J) For b=1,,, B (randomly) permute the class labels, compute test statistic d *b j and the corresponding order statistics d *b (1) d *b (2) d (J) *b (J) From the set of B permutations, estimate the expected order statistics by đ (j) = (1/B)Σ b d *b (j) for j=1,,j,j Plot the d (J) values versus the đ (j). For fixed threshold determine t 1 ( )) and t 2 ( ). Estimate the FDR


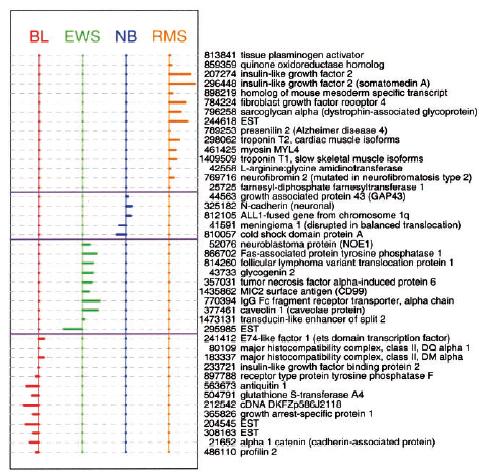
37 Molecular Classification of Cancer Golbe,, et al., Science 1999;403:
38 Machine Learning Approach in Bioinformatics Supervised Machine Learning Linear Discriminant Analysis / Logistic Regression / PCA Classification Tree Artificial Neural Network Support Vector Machine Rough Sets Reinforcement Learning Hidden Markov Model Unsupervised Machine Learning Hierarchical Tree Clustering Partitional Clustering Self-Organizing Feature Maps Matrix Incision Algorithms Supervised vs unsupervised classifications Classification Conditional Densities known known unknown Bayes Decision Theory Density-based Parametric Parametric Supervised Learning Nonparametric Nonparametric geometric Unsupervised Learning Parametric Parametric Nonparametric Nonparametric Optimal Rules Rules Plug-in Rules Rules Density Estimation Decision Boundary Building Mixture Resolving Cluster Analysis Jain et al. 2000, IEEE Transactions

39 Artificial Neural Network A Universal Function Approximator
40 Classification tree as an ex. of classification Sunburn at the Beach Classification tree as an ex. of classification

41 Classification tree as an ex. of classification Classification tree as an ex. of classification

42 Classification tree as an ex. of classification Classification by the shrunken centroids For the K class problem, i genes and j slides - n k : number of samples in class k - C k : indices of the n k samples The mean expression value of gene i in class k

43 shrunken centroids classification exercise
44 Feature selection K-fold cross-validation

45 Cross-validation probabilities Thank you!
Class 4: Classification. Quaid Morris February 11 th, 2011 ML4Bio
 Class 4: Classification Quaid Morris February 11 th, 211 ML4Bio Overview Basic concepts in classification: overfitting, cross-validation, evaluation. Linear Discriminant Analysis and Quadratic Discriminant
cdna Microarray Analysis
 cdna Microarray Analysis with BioConductor packages Nolwenn Le Meur Copyright 2007 Outline Data acquisition Pre-processing Quality assessment Pre-processing background correction normalization summarization
Advanced Statistical Methods: Beyond Linear Regression
 Advanced Statistical Methods: Beyond Linear Regression John R. Stevens Utah State University Notes 3. Statistical Methods II Mathematics Educators Worshop 28 March 2009 1 http://www.stat.usu.edu/~jrstevens/pcmi
SPOTTED cdna MICROARRAYS
 SPOTTED cdna MICROARRAYS Spot size: 50um - 150um SPOTTED cdna MICROARRAYS Compare the genetic expression in two samples of cells PRINT cdna from one gene on each spot SAMPLES cdna labelled red/green e.g.
High-Throughput Sequencing Course. Introduction. Introduction. Multiple Testing. Biostatistics and Bioinformatics. Summer 2018
 High-Throughput Sequencing Course Multiple Testing Biostatistics and Bioinformatics Summer 2018 Introduction You have previously considered the significance of a single gene Introduction You have previously
Single gene analysis of differential expression
 Single gene analysis of differential expression Giorgio Valentini DSI Dipartimento di Scienze dell Informazione Università degli Studi di Milano valentini@dsi.unimi.it Comparing two conditions Each condition
Non-specific filtering and control of false positives
 Non-specific filtering and control of false positives Richard Bourgon 16 June 2009 bourgon@ebi.ac.uk EBI is an outstation of the European Molecular Biology Laboratory Outline Multiple testing I: overview
Normalization. Example of Replicate Data. Biostatistics Rafael A. Irizarry
 This work is licensed under a Creative Commons Attribution-NonCommercial-ShareAlike License. Your use of this material constitutes acceptance of that license and the conditions of use of materials on this
Performance Evaluation and Comparison
 Outline Hong Chang Institute of Computing Technology, Chinese Academy of Sciences Machine Learning Methods (Fall 2012) Outline Outline I 1 Introduction 2 Cross Validation and Resampling 3 Interval Estimation
Experimental Design and Data Analysis for Biologists
 Experimental Design and Data Analysis for Biologists Gerry P. Quinn Monash University Michael J. Keough University of Melbourne CAMBRIDGE UNIVERSITY PRESS Contents Preface page xv I I Introduction 1 1.1
Expression arrays, normalization, and error models
 1 Epression arrays, normalization, and error models There are a number of different array technologies available for measuring mrna transcript levels in cell populations, from spotted cdna arrays to in
SUPERVISED LEARNING: INTRODUCTION TO CLASSIFICATION
 SUPERVISED LEARNING: INTRODUCTION TO CLASSIFICATION 1 Outline Basic terminology Features Training and validation Model selection Error and loss measures Statistical comparison Evaluation measures 2 Terminology
Multiple testing: Intro & FWER 1
 Multiple testing: Intro & FWER 1 Mark van de Wiel mark.vdwiel@vumc.nl Dep of Epidemiology & Biostatistics,VUmc, Amsterdam Dep of Mathematics, VU 1 Some slides courtesy of Jelle Goeman 1 Practical notes
Optimal normalization of DNA-microarray data
 Optimal normalization of DNA-microarray data Daniel Faller 1, HD Dr. J. Timmer 1, Dr. H. U. Voss 1, Prof. Dr. Honerkamp 1 and Dr. U. Hobohm 2 1 Freiburg Center for Data Analysis and Modeling 1 F. Hoffman-La
GS Analysis of Microarray Data
 GS01 0163 Analysis of Microarray Data Keith Baggerly and Kevin Coombes Section of Bioinformatics Department of Biostatistics and Applied Mathematics UT M. D. Anderson Cancer Center kabagg@mdanderson.org
Single gene analysis of differential expression. Giorgio Valentini
 Single gene analysis of differential expression Giorgio Valentini valenti@disi.unige.it Comparing two conditions Each condition may be represented by one or more RNA samples. Using cdna microarrays, samples
GS Analysis of Microarray Data
 GS01 0163 Analysis of Microarray Data Keith Baggerly and Kevin Coombes Section of Bioinformatics Department of Biostatistics and Applied Mathematics UT M. D. Anderson Cancer Center kabagg@mdanderson.org
10-810: Advanced Algorithms and Models for Computational Biology. Optimal leaf ordering and classification
 10-810: Advanced Algorithms and Models for Computational Biology Optimal leaf ordering and classification Hierarchical clustering As we mentioned, its one of the most popular methods for clustering gene
Introduction to Gaussian Process
 Introduction to Gaussian Process CS 778 Chris Tensmeyer CS 478 INTRODUCTION 1 What Topic? Machine Learning Regression Bayesian ML Bayesian Regression Bayesian Non-parametric Gaussian Process (GP) GP Regression
GS Analysis of Microarray Data
 GS01 0163 Analysis of Microarray Data Keith Baggerly and Kevin Coombes Section of Bioinformatics Department of Biostatistics and Applied Mathematics UT M. D. Anderson Cancer Center kabagg@mdanderson.org
Design of Microarray Experiments. Xiangqin Cui
 Design of Microarray Experiments Xiangqin Cui Experimental design Experimental design: is a term used about efficient methods for planning the collection of data, in order to obtain the maximum amount
Chapter 5: Microarray Techniques
 Chapter 5: Microarray Techniques 5.2 Analysis of Microarray Data Prof. Yechiam Yemini (YY) Computer Science Department Columbia University Normalization Clustering Overview 2 1 Processing Microarray Data
Chapter 3: Statistical methods for estimation and testing. Key reference: Statistical methods in bioinformatics by Ewens & Grant (2001).
.") Chapter 3: Statistical methods for estimation and testing Key reference: Statistical methods in bioinformatics by Ewens & Grant (2001). Chapter 3: Statistical methods for estimation and testing Key reference:
Chapter 3: Statistical methods for estimation and testing Key reference: Statistical methods in bioinformatics by Ewens & Grant (2001). Chapter 3: Statistical methods for estimation and testing Key reference:
Unsupervised machine learning
 Chapter 9 Unsupervised machine learning Unsupervised machine learning (a.k.a. cluster analysis) is a set of methods to assign objects into clusters under a predefined distance measure when class labels
Sta$s$cs for Genomics ( )
") Sta$s$cs for Genomics (140.688) Instructor: Jeff Leek Slide Credits: Rafael Irizarry, John Storey No announcements today. Hypothesis testing Once you have a given score for each gene, how do you decide
Sta$s$cs for Genomics (140.688) Instructor: Jeff Leek Slide Credits: Rafael Irizarry, John Storey No announcements today. Hypothesis testing Once you have a given score for each gene, how do you decide
Inferential Statistical Analysis of Microarray Experiments 2007 Arizona Microarray Workshop
 Inferential Statistical Analysis of Microarray Experiments 007 Arizona Microarray Workshop μ!! Robert J Tempelman Department of Animal Science tempelma@msuedu HYPOTHESIS TESTING (as if there was only one
University of California, Berkeley
 University of California, Berkeley U.C. Berkeley Division of Biostatistics Working Paper Series Year 2004 Paper 147 Multiple Testing Methods For ChIP-Chip High Density Oligonucleotide Array Data Sunduz
Use of Agilent Feature Extraction Software (v8.1) QC Report to Evaluate Microarray Performance
 QC Report to Evaluate Microarray Performance") Use of Agilent Feature Extraction Software (v8.1) QC Report to Evaluate Microarray Performance Anthea Dokidis Glenda Delenstarr Abstract The performance of the Agilent microarray system can now be evaluated
Use of Agilent Feature Extraction Software (v8.1) QC Report to Evaluate Microarray Performance Anthea Dokidis Glenda Delenstarr Abstract The performance of the Agilent microarray system can now be evaluated
6.047 / Computational Biology: Genomes, Networks, Evolution Fall 2008
 MIT OpenCourseWare http://ocw.mit.edu 6.047 / 6.878 Computational Biology: Genomes, Networks, Evolution Fall 2008 For information about citing these materials or our Terms of Use, visit: http://ocw.mit.edu/terms.
Regularization. CSCE 970 Lecture 3: Regularization. Stephen Scott and Vinod Variyam. Introduction. Outline
 Other Measures 1 / 52 sscott@cse.unl.edu learning can generally be distilled to an optimization problem Choose a classifier (function, hypothesis) from a set of functions that minimizes an objective function
Session 06 (A): Microarray Basic Data Analysis
: Microarray Basic Data Analysis") 1 SJTU-Bioinformatics Summer School 2017 Session 06 (A): Microarray Basic Data Analysis Maoying,Wu ricket.woo@gmail.com Dept. of Bioinformatics & Biostatistics Shanghai Jiao Tong University Summer, 2017
1 SJTU-Bioinformatics Summer School 2017 Session 06 (A): Microarray Basic Data Analysis Maoying,Wu ricket.woo@gmail.com Dept. of Bioinformatics & Biostatistics Shanghai Jiao Tong University Summer, 2017
GS Analysis of Microarray Data
 GS01 0163 Analysis of Microarray Data Keith Baggerly and Kevin Coombes Section of Bioinformatics Department of Biostatistics and Applied Mathematics UT M. D. Anderson Cancer Center kabagg@mdanderson.org
GS Analysis of Microarray Data
 GS01 0163 Analysis of Microarray Data Keith Baggerly and Kevin Coombes Section of Bioinformatics Department of Biostatistics and Applied Mathematics UT M. D. Anderson Cancer Center kabagg@mdanderson.org
Part I. Linear Discriminant Analysis. Discriminant analysis. Discriminant analysis
 Week 5 Based in part on slides from textbook, slides of Susan Holmes Part I Linear Discriminant Analysis October 29, 2012 1 / 1 2 / 1 Nearest centroid rule Suppose we break down our data matrix as by the
Mathematics, Genomics, and Cancer
 School of Informatics IUB April 6, 2009 Outline Introduction Class Comparison Class Discovery Class Prediction Example Biological states and state modulation Software Tools Research directions Math & Biology
Sample Size Estimation for Studies of High-Dimensional Data
 Sample Size Estimation for Studies of High-Dimensional Data James J. Chen, Ph.D. National Center for Toxicological Research Food and Drug Administration June 3, 2009 China Medical University Taichung,
False discovery rate and related concepts in multiple comparisons problems, with applications to microarray data
 False discovery rate and related concepts in multiple comparisons problems, with applications to microarray data Ståle Nygård Trial Lecture Dec 19, 2008 1 / 35 Lecture outline Motivation for not using
Microarray data analysis
 Microarray data analysis September 20, 2006 Jonathan Pevsner, Ph.D. Introduction to Bioinformatics pevsner@kennedykrieger.org Johns Hopkins School of Public Health (260.602.01) Copyright notice Many of
Predicting Protein Functions and Domain Interactions from Protein Interactions
 Predicting Protein Functions and Domain Interactions from Protein Interactions Fengzhu Sun, PhD Center for Computational and Experimental Genomics University of Southern California Outline High-throughput
GS Analysis of Microarray Data
 GS01 0163 Analysis of Microarray Data Keith Baggerly and Bradley Broom Department of Bioinformatics and Computational Biology UT M. D. Anderson Cancer Center kabagg@mdanderson.org bmbroom@mdanderson.org
Bioconductor Project Working Papers
 Bioconductor Project Working Papers Bioconductor Project Year 2004 Paper 6 Error models for microarray intensities Wolfgang Huber Anja von Heydebreck Martin Vingron Department of Molecular Genome Analysis,
Statistical Applications in Genetics and Molecular Biology
 Statistical Applications in Genetics and Molecular Biology Volume 5, Issue 1 2006 Article 28 A Two-Step Multiple Comparison Procedure for a Large Number of Tests and Multiple Treatments Hongmei Jiang Rebecca
Microarray Data Analysis: Discovery
 Microarray Data Analysis: Discovery Lecture 5 Classification Classification vs. Clustering Classification: Goal: Placing objects (e.g. genes) into meaningful classes Supervised Clustering: Goal: Discover
Statistical testing. Samantha Kleinberg. October 20, 2009
 October 20, 2009 Intro to significance testing Significance testing and bioinformatics Gene expression: Frequently have microarray data for some group of subjects with/without the disease. Want to find
Stephen Scott.
 1 / 35 (Adapted from Ethem Alpaydin and Tom Mitchell) sscott@cse.unl.edu In Homework 1, you are (supposedly) 1 Choosing a data set 2 Extracting a test set of size > 30 3 Building a tree on the training
L11: Pattern recognition principles
 L11: Pattern recognition principles Bayesian decision theory Statistical classifiers Dimensionality reduction Clustering This lecture is partly based on [Huang, Acero and Hon, 2001, ch. 4] Introduction
Fundamentals to Biostatistics. Prof. Chandan Chakraborty Associate Professor School of Medical Science & Technology IIT Kharagpur
 Fundamentals to Biostatistics Prof. Chandan Chakraborty Associate Professor School of Medical Science & Technology IIT Kharagpur Statistics collection, analysis, interpretation of data development of new
hsnim: Hyper Scalable Network Inference Machine for Scale-Free Protein-Protein Interaction Networks Inference
 CS 229 Project Report (TR# MSB2010) Submitted 12/10/2010 hsnim: Hyper Scalable Network Inference Machine for Scale-Free Protein-Protein Interaction Networks Inference Muhammad Shoaib Sehgal Computer Science
Review of some concepts in predictive modeling
 Harvard-MIT Division of Health Sciences and Technology HST.951J: Medical Decision Support, Fall 2005 Instructors: Professor Lucila Ohno-Machado and Professor Staal Vinterbo Review of some concepts in predictive
Machine Learning Linear Classification. Prof. Matteo Matteucci
 Machine Learning Linear Classification Prof. Matteo Matteucci Recall from the first lecture 2 X R p Regression Y R Continuous Output X R p Y {Ω 0, Ω 1,, Ω K } Classification Discrete Output X R p Y (X)
A Sequential Bayesian Approach with Applications to Circadian Rhythm Microarray Gene Expression Data
 A Sequential Bayesian Approach with Applications to Circadian Rhythm Microarray Gene Expression Data Faming Liang, Chuanhai Liu, and Naisyin Wang Texas A&M University Multiple Hypothesis Testing Introduction
Lesson 11. Functional Genomics I: Microarray Analysis
 Lesson 11 Functional Genomics I: Microarray Analysis Transcription of DNA and translation of RNA vary with biological conditions 3 kinds of microarray platforms Spotted Array - 2 color - Pat Brown (Stanford)
Comparison of Shannon, Renyi and Tsallis Entropy used in Decision Trees
 Comparison of Shannon, Renyi and Tsallis Entropy used in Decision Trees Tomasz Maszczyk and W lodzis law Duch Department of Informatics, Nicolaus Copernicus University Grudzi adzka 5, 87-100 Toruń, Poland
Tools and topics for microarray analysis
 Tools and topics for microarray analysis USSES Conference, Blowing Rock, North Carolina, June, 2005 Jason A. Osborne, osborne@stat.ncsu.edu Department of Statistics, North Carolina State University 1 Outline
REPRODUCIBLE ANALYSIS OF HIGH-THROUGHPUT EXPERIMENTS
 REPRODUCIBLE ANALYSIS OF HIGH-THROUGHPUT EXPERIMENTS Ying Liu Department of Biostatistics, Columbia University Summer Intern at Research and CMC Biostats, Sanofi, Boston August 26, 2015 OUTLINE 1 Introduction
Design and Analysis of Gene Expression Experiments
 Design and Analysis of Gene Expression Experiments Guilherme J. M. Rosa Department of Animal Sciences Department of Biostatistics & Medical Informatics University of Wisconsin - Madison OUTLINE Æ Linear
Statistical Learning and Behrens Fisher Distribution Methods for Heteroscedastic Data in Microarray Analysis
 University of South Florida Scholar Commons Graduate Theses and Dissertations Graduate School 3-29-2010 Statistical Learning and Behrens Fisher Distribution Methods for Heteroscedastic Data in Microarray
Cross model validation and multiple testing in latent variable models
 Cross model validation and multiple testing in latent variable models Frank Westad GE Healthcare Oslo, Norway 2nd European User Meeting on Multivariate Analysis Como, June 22, 2006 Outline Introduction
Statistics Applied to Bioinformatics. Tests of homogeneity
 Statistics Applied to Bioinformatics Tests of homogeneity Two-tailed test of homogeneity Two-tailed test H 0 :m = m Principle of the test Estimate the difference between m and m Compare this estimation
Announcements. Proposals graded
 Announcements Proposals graded Kevin Jamieson 2018 1 Hypothesis testing Machine Learning CSE546 Kevin Jamieson University of Washington October 30, 2018 2018 Kevin Jamieson 2 Anomaly detection You are
The Bayes Theorema. Converting pre-diagnostic odds into post-diagnostic odds. Prof. Dr. F. Vanstapel, MD PhD Laboratoriumgeneeskunde UZ KULeuven
 slide 1 The Bayes Theorema Converting pre-diagnostic odds into post-diagnostic odds Prof. Dr. F. Vanstapel, MD PhD Laboratoriumgeneeskunde UZ KULeuven slide 2 Problem * The yearly incidence of TBC infections
High-throughput Testing
 High-throughput Testing Noah Simon and Richard Simon July 2016 1 / 29 Testing vs Prediction On each of n patients measure y i - single binary outcome (eg. progression after a year, PCR) x i - p-vector
Microarray Preprocessing
 Microarray Preprocessing Normaliza$on Normaliza$on is needed to ensure that differences in intensi$es are indeed due to differen$al expression, and not some prin$ng, hybridiza$on, or scanning ar$fact.
Data Preprocessing. Data Preprocessing
 Data Preprocessing 1 Data Preprocessing Normalization: the process of removing sampleto-sample variations in the measurements not due to differential gene expression. Bringing measurements from the different
The miss rate for the analysis of gene expression data
 Biostatistics (2005), 6, 1,pp. 111 117 doi: 10.1093/biostatistics/kxh021 The miss rate for the analysis of gene expression data JONATHAN TAYLOR Department of Statistics, Stanford University, Stanford,
Optimal design of microarray experiments
 University of Groningen e.c.wit@rug.nl http://www.math.rug.nl/ ernst 7 June 2011 What is a cdna Microarray Experiment? GREEN (Cy3) Cancer Tissue mrna Mix tissues in equal amounts G G G R R R R R G R G
9/12/17. Types of learning. Modeling data. Supervised learning: Classification. Supervised learning: Regression. Unsupervised learning: Clustering
 Types of learning Modeling data Supervised: we know input and targets Goal is to learn a model that, given input data, accurately predicts target data Unsupervised: we know the input only and want to make
Bioinformatics. Transcriptome
 Bioinformatics Transcriptome Jacques.van.Helden@ulb.ac.be Université Libre de Bruxelles, Belgique Laboratoire de Bioinformatique des Génomes et des Réseaux (BiGRe) http://www.bigre.ulb.ac.be/ Bioinformatics
Data Mining: Concepts and Techniques. (3 rd ed.) Chapter 8. Chapter 8. Classification: Basic Concepts
 Chapter 8. Chapter 8. Classification: Basic Concepts") Data Mining: Concepts and Techniques (3 rd ed.) Chapter 8 1 Chapter 8. Classification: Basic Concepts Classification: Basic Concepts Decision Tree Induction Bayes Classification Methods Rule-Based Classification
Data Mining: Concepts and Techniques (3 rd ed.) Chapter 8 1 Chapter 8. Classification: Basic Concepts Classification: Basic Concepts Decision Tree Induction Bayes Classification Methods Rule-Based Classification
SPH 247 Statistical Analysis of Laboratory Data. April 28, 2015 SPH 247 Statistics for Laboratory Data 1
 SPH 247 Statistical Analysis of Laboratory Data April 28, 2015 SPH 247 Statistics for Laboratory Data 1 Outline RNA-Seq for differential expression analysis Statistical methods for RNA-Seq: Structure and
Introduction to Machine Learning Midterm Exam
 10-701 Introduction to Machine Learning Midterm Exam Instructors: Eric Xing, Ziv Bar-Joseph 17 November, 2015 There are 11 questions, for a total of 100 points. This exam is open book, open notes, but
Error models and normalization. Wolfgang Huber DKFZ Heidelberg
 Error models and normalization Wolfgang Huber DKFZ Heidelberg Acknowledgements Anja von Heydebreck, Martin Vingron Andreas Buness, Markus Ruschhaupt, Klaus Steiner, Jörg Schneider, Katharina Finis, Anke
Statistics Toolbox 6. Apply statistical algorithms and probability models
 Statistics Toolbox 6 Apply statistical algorithms and probability models Statistics Toolbox provides engineers, scientists, researchers, financial analysts, and statisticians with a comprehensive set of
Introduction to clustering methods for gene expression data analysis
 Introduction to clustering methods for gene expression data analysis Giorgio Valentini e-mail: valentini@dsi.unimi.it Outline Levels of analysis of DNA microarray data Clustering methods for functional
Classification: The rest of the story
 U NIVERSITY OF ILLINOIS AT URBANA-CHAMPAIGN CS598 Machine Learning for Signal Processing Classification: The rest of the story 3 October 2017 Today s lecture Important things we haven t covered yet Fisher
Pattern Recognition and Machine Learning
 Christopher M. Bishop Pattern Recognition and Machine Learning ÖSpri inger Contents Preface Mathematical notation Contents vii xi xiii 1 Introduction 1 1.1 Example: Polynomial Curve Fitting 4 1.2 Probability
Statistical analysis of microarray data: a Bayesian approach
 Biostatistics (003), 4, 4,pp. 597 60 Printed in Great Britain Statistical analysis of microarray data: a Bayesian approach RAPHAEL GTTARD University of Washington, Department of Statistics, Box 3543, Seattle,
Introduction to Supervised Learning. Performance Evaluation
 Introduction to Supervised Learning Performance Evaluation Marcelo S. Lauretto Escola de Artes, Ciências e Humanidades, Universidade de São Paulo marcelolauretto@usp.br Lima - Peru Performance Evaluation
Statistical Methods for Analysis of Genetic Data
 Statistical Methods for Analysis of Genetic Data Christopher R. Cabanski A dissertation submitted to the faculty of the University of North Carolina at Chapel Hill in partial fulfillment of the requirements
Inferring Transcriptional Regulatory Networks from High-throughput Data
 Inferring Transcriptional Regulatory Networks from High-throughput Data Lectures 9 Oct 26, 2011 CSE 527 Computational Biology, Fall 2011 Instructor: Su-In Lee TA: Christopher Miles Monday & Wednesday 12:00-1:20
Final Overview. Introduction to ML. Marek Petrik 4/25/2017
 Final Overview Introduction to ML Marek Petrik 4/25/2017 This Course: Introduction to Machine Learning Build a foundation for practice and research in ML Basic machine learning concepts: max likelihood,
Discovering Correlation in Data. Vinh Nguyen Research Fellow in Data Science Computing and Information Systems DMD 7.
 Discovering Correlation in Data Vinh Nguyen (vinh.nguyen@unimelb.edu.au) Research Fellow in Data Science Computing and Information Systems DMD 7.14 Discovering Correlation Why is correlation important?
Multiple Hypothesis Testing in Microarray Data Analysis
 Multiple Hypothesis Testing in Microarray Data Analysis Sandrine Dudoit jointly with Mark van der Laan and Katie Pollard Division of Biostatistics, UC Berkeley www.stat.berkeley.edu/~sandrine Short Course:
FEATURE SELECTION COMBINED WITH RANDOM SUBSPACE ENSEMBLE FOR GENE EXPRESSION BASED DIAGNOSIS OF MALIGNANCIES
 FEATURE SELECTION COMBINED WITH RANDOM SUBSPACE ENSEMBLE FOR GENE EXPRESSION BASED DIAGNOSIS OF MALIGNANCIES Alberto Bertoni, 1 Raffaella Folgieri, 1 Giorgio Valentini, 1 1 DSI, Dipartimento di Scienze
Should all Machine Learning be Bayesian? Should all Bayesian models be non-parametric?
 Should all Machine Learning be Bayesian? Should all Bayesian models be non-parametric? Zoubin Ghahramani Department of Engineering University of Cambridge, UK zoubin@eng.cam.ac.uk http://learning.eng.cam.ac.uk/zoubin/
Anomaly Detection for the CERN Large Hadron Collider injection magnets
 Anomaly Detection for the CERN Large Hadron Collider injection magnets Armin Halilovic KU Leuven - Department of Computer Science In cooperation with CERN 2018-07-27 0 Outline 1 Context 2 Data 3 Preprocessing
PATTERN CLASSIFICATION
 PATTERN CLASSIFICATION Second Edition Richard O. Duda Peter E. Hart David G. Stork A Wiley-lnterscience Publication JOHN WILEY & SONS, INC. New York Chichester Weinheim Brisbane Singapore Toronto CONTENTS
Seminar Microarray-Datenanalyse
 Seminar Microarray- Normalization Hans-Ulrich Klein Christian Ruckert Institut für Medizinische Informatik WWU Münster SS 2011 Organisation 1 09.05.11 Normalisierung 2 10.05.11 Bestimmen diff. expr. Gene,
Machine Learning, Midterm Exam
 10-601 Machine Learning, Midterm Exam Instructors: Tom Mitchell, Ziv Bar-Joseph Wednesday 12 th December, 2012 There are 9 questions, for a total of 100 points. This exam has 20 pages, make sure you have
Lecture Slides for INTRODUCTION TO. Machine Learning. ETHEM ALPAYDIN The MIT Press,
 Lecture Slides for INTRODUCTION TO Machine Learning ETHEM ALPAYDIN The MIT Press, 2004 alpaydin@boun.edu.tr http://www.cmpe.boun.edu.tr/~ethem/i2ml CHAPTER 14: Assessing and Comparing Classification Algorithms
Gene Expression an Overview of Problems & Solutions: 3&4. Utah State University Bioinformatics: Problems and Solutions Summer 2006
 Gene Expression an Overview of Problems & Solutions: 3&4 Utah State University Bioinformatics: Problems and Solutions Summer 006 Review Considering several problems & solutions with gene expression data
Chapter 10. Semi-Supervised Learning
 Chapter 10. Semi-Supervised Learning Wei Pan Division of Biostatistics, School of Public Health, University of Minnesota, Minneapolis, MN 55455 Email: weip@biostat.umn.edu PubH 7475/8475 c Wei Pan Outline
Introduction to clustering methods for gene expression data analysis
 Introduction to clustering methods for gene expression data analysis Giorgio Valentini e-mail: valentini@dsi.unimi.it Outline Levels of analysis of DNA microarray data Clustering methods for functional
Computational Biology: Basics & Interesting Problems
 Computational Biology: Basics & Interesting Problems Summary Sources of information Biological concepts: structure & terminology Sequencing Gene finding Protein structure prediction Sources of information
Bioinformatics 2. Yeast two hybrid. Proteomics. Proteomics
 GENOME Bioinformatics 2 Proteomics protein-gene PROTEOME protein-protein METABOLISM Slide from http://www.nd.edu/~networks/ Citrate Cycle Bio-chemical reactions What is it? Proteomics Reveal protein Protein
Hypothesis Testing with the Bootstrap. Noa Haas Statistics M.Sc. Seminar, Spring 2017 Bootstrap and Resampling Methods
 Hypothesis Testing with the Bootstrap Noa Haas Statistics M.Sc. Seminar, Spring 2017 Bootstrap and Resampling Methods Bootstrap Hypothesis Testing A bootstrap hypothesis test starts with a test statistic
(134/ !"#!$%&%' ()*)$+,-.)//01*$2*345/0/ M<39$N1$;<)5$")3/B.)O ;).C0*141=5 " /7$83.9$:
*)$+,-.)//01*$2*345/0/ M<39$N1$;<)5$)3/B.)O ;).C0*141=5 /7$83.9$:") (134/!"#!$%&%' ()*)$+,-)//01*$2*345/0/ "061335/7$839$: ;$9
(134/!"#!$%&%' ()*)$+,-)//01*$2*345/0/ "061335/7$839$: ;$9
PATTERN RECOGNITION AND MACHINE LEARNING
 PATTERN RECOGNITION AND MACHINE LEARNING Chapter 1. Introduction Shuai Huang April 21, 2014 Outline 1 What is Machine Learning? 2 Curve Fitting 3 Probability Theory 4 Model Selection 5 The curse of dimensionality
Resampling and the Bootstrap
 Resampling and the Bootstrap Axel Benner Biostatistics, German Cancer Research Center INF 280, D-69120 Heidelberg benner@dkfz.de Resampling and the Bootstrap 2 Topics Estimation and Statistical Testing
Final Exam, Machine Learning, Spring 2009
 Name: Andrew ID: Final Exam, 10701 Machine Learning, Spring 2009 - The exam is open-book, open-notes, no electronics other than calculators. - The maximum possible score on this exam is 100. You have 3