Design of Microarray Experiments. Xiangqin Cui
|
|
|
- Dylan Weaver
- 6 years ago
- Views:
Transcription
1 Design of Microarray Experiments Xiangqin Cui
2 Experimental design Experimental design: is a term used about efficient methods for planning the collection of data, in order to obtain the maximum amount of information for the least amount of work. Anyone collecting and analyzing data, be it in the lab, the field or the production plant, can benefit from knowledge about experimental design.
3 Experimental Design Principles Randomization Replication Blocking Use of factorial experiments instead of the one-factor-at-a-time methods. Orthogonality
4 Randomization The experimental treatments are assigned to the experimental units (subjects) in a random fashion. It helps to eliminate effect of "lurking variables", uncontrolled factors which might vary over the length of the experiment.
5 Commonly Used Randomization Methods Number the subjects to be randomized and then randomly draw the numbers using paper pieces in a hat or computer random number generator Hormone treatment : (1,3,4); (1,2,6) Control : (2,5,6); (3,4,5) Plan 1 plan 2
6 Randomization in Microarray Experiments Randomize arrays in respect to samples Randomize samples in respect to treatments Randomize the order of performing the labeling, hybridizations, scanning
7 Replication Replication is repeating the creation of a phenomenon, so that the variability associated with the phenomenon can be estimated. Replications should not be confused with repeated measurements which refer to literally taking several measurements of a single occurrence of a phenomenon.
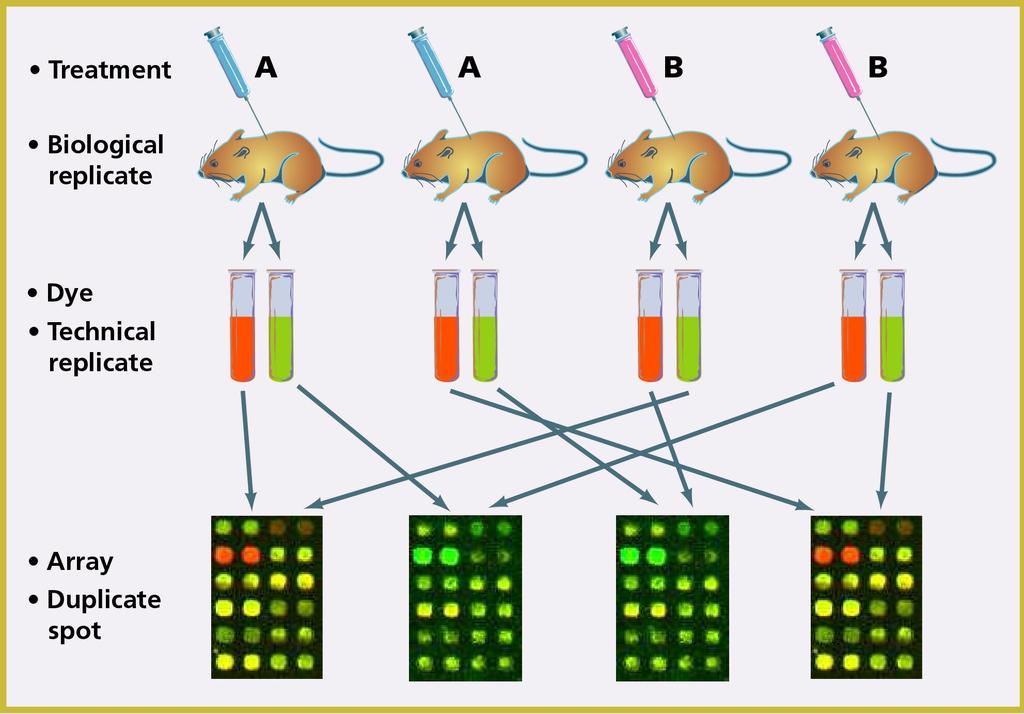
8 Replication in microarray experiments What to replicate? Biological replicates (replicates at the experimental unit level, e.g. mouse, plant, pot of plants ) Experimental unit is the unit that the experiment treatment or condition is directly applied to, e.g. a plant if hormone is sprayed to individual plants; a pot of seedlings if different fertilizers are applied to different pots. Technical replicates Any replicates below the experimental unit, e.g. different leaves from the same plant sprayed with one hormone level; different seedlings from the same pot; Different aliquots of the same RNA extraction; multiple arrays hybridized to the same RNA; multiple spots on the same array.
9
10 How Many Replicates Power: the probability for a real positive to be identified It depends on: 1) The size of difference (log ratio) to be detected The bigger the difference, the higher the power. 2) The sample size The larger the sample size, the higher the power. 3) The error variance of the treatment The bigger the error variance, the lower the power.
11 How Many Replicates * Minimum number of replication (r) per group: 3 5 (two groups) (reliable variance estimates, permutation test, df error, etc.) Factorial 2 x 2 A1 B1 r B2 r A2 r r S.V. A B A*B Error (r=1) (r=2) (r=3) Total
12 * Sample size calculation for experiments with two groups REFERENCE: n = # arrays (total) 4 ( z + z ) (1 α / 2) ( δ / σ) log(fc) (1 β) 2 2 SD BALANCED BLOCK: n = ( z + z ) (1 α / 2) ( δ / τ) (1 β) 2 2 (in general, τ > σ) Example (Dobbin and Simon, 2003): δ=1, α=0.001, β=0.05: σ 0.50 n = 30 (i.e. 15A + 15B + 30R) τ 0.67 n = 17 (i.e. 17A + 17B)
13 Error variance (EV) of the estimated treatment effect: TrtA TrtB Reference Design M1 M2 M3 M4 EV = σ m 2 M 2 σ e + mn R R R R Error variance of the estimated treatment effect: Approximately EV = σ e 2 2mn( σ 2 2 σ M σ + e m mn 4 A + σ m : number of mice per treatment n : number of array pairs per mouse 2 e )
14 Resource allocation: 2 2 σ M σ e EV = + m mn Cost = mc + m M nc A m n C M C A mice / trt array pairs / mouse cost / mouse cost / array pair The optimum number of array pairs per mouse: n σ 2 e = 2 σ M C C M A
15 Examples for resource allocation Using variance components estimated from kidney in Project Normal data. r = 1 ( no replicated spots on array ) Reference design Mouse price Array price/pair # of array pairs per mouse $15 $600 1 $300 $600 1 $1500 $600 2 More efficient array level designs, such as direct comparisons and loop designs, can reduce the optimum number of arrays per mouse.
16 Pooling Samples Pooling can reduce the biological variance but not the technical variances. The biological variance will be replaced by: σ 2 1 pool = α k : pool size k σ 2 M α : constant for the effect of pooling. 0 < α < 1 α = 0, pooling has no effect. α = 1, pooling has maximum effect. Note: More pools with fewer arrays per pool is better than fewer pools with more arrays per pools when fixed number of arrays and mice are to be used.
17 Power Increase to Detect 2 fold change by Pooling ( Pool size k = 3, α = 1 ) 2 pools / trt 4 pools / trt 6 pools / trt 8 pools / trt 2 mice / trt 4 mice / trt 6 mice / trt 8 mice / trt Significance level: 0.05 after Bonferroni correction
18 PowerAtlas It is an online tool to calculate sample size based on similar data set in GEO or user provided pilot data. Page et al., BMC Bioinformatics Feb 22;7:84. Gadbury GL, et al. Stat Meth Med Res 13: , 2004.
19 EDR is the proportion of genes that are truly differentially expressed that will be called significant at the significance level of This is analogous to average power. TP is the proportion of genes called 'significant' that are truly differentially expressed. TN is the proportion of genes called 'not significant' that are truly not differentially expressed between the conditions.
20 Blocking Some identified uninteresting but varying factors can be controlled through blocking. Completely randomized design Complete block design Incompletely block designs
21 Completely Randomized Design There is no blocking Example Compare two hormone treatments (trt and control) using 6 Arabidopsis plants Hormone trt: (1,3,4); (1,2,6) Control : (2,5,6); (3,4,5) Note: Design with one-color microarrays is often completely randomized design.
22 Complete Block Design There is blocking and the block size is equal to the number of treatments. Example: Compare two hormone treatments (trt and control) using 6 Arabidopsis plants. For some reason plant 1 and 2 are taller, plant 5 and 6 are thinner Hormone treatment: (1,4,5); (1,3,6) Control : (2,3,6); (2,4,5) Randomization within blocks
23 Incomplete Block Design There is blocking and the block size is smaller than the number of treatments. Example: Compare three hormone treatments (hormone level 1, hormone level 2, and control) using 6 Arabidopsis plants. For some reason plant 1 and 2 are taller, plant 5 and 6 are thinner Hormone level1: (1,4); (2,4) Hormone level2: (2,5); (1,6) Control : (3,6); (3.5) Randomization within blocks
24 Designs for two-color microarrays Experimental design for one color microarray array is straight forward with out the required blocking at the array level. For two color microarrays, we need to pair the samples and label then with Cy3 and Cy5 for hybridization to one array. How do we pair?
25 Blocking in microarray experiments In two-color platform, the arrays vary due to the loading of DNA quantity, spot morphology, hybridization condition, scanning setting It is treated as a block of size 2, the samples are compared within each array. If there are two lots of chips in the experiment and there is large variation across chip lots. We can treat chip lots as a blocking factor. Example: compare three samples: A, B, C A B B C C A Block (array) 1 Block (array) 2 Block (array) 3
26 A1 Cy5 Cy3 B1
27 Dye-swap A1 B1 Dye swapping Separates the dye effect from the sample effect. Results are less sensitive to the data transformation processes Kerr and Churchill(2001) Biostatistics, 2:
28 Replicated Dye-Swap A1 B1 A2 B2
29 Reference design All samples are compared to a single reference sample. Single reference Double reference A B C A B C R R
30 Example Microarray Experiment comparing 3 treatments T1 T2 T3 M1 M2 M3 M4 M5 M6 M7 M8 M9 M10 M11 M12 M13 M14 M15 R R R R R R R R R R R R R R R Note: Arrows are used to represent a two-color microarray. The arrow head represents the red channel and the tail represents the green channel. T1 to T3, the three treatments; M1 to M15, the 15 plants; R, reference sample.
31 Loop Design A D B C
32 Basic types of loop designs Single loop Double loop A B A B C C
33 Complex loop designs Two-factor factorial design at the high level Pera I DBA High fat A B C Low fat E F D A1 B1 A2 B2 C1 F1 C2 F2 D1 E1 D2 E2
34 Reference or Loop Reference design: It has lower overall efficiency, but it has equal efficiency for all sample comparisons, and is easy to extend. Loop design: higher overall efficiency, harder to extend, unequal efficiency for all comparisons,
 Nat. Rev.")
35 Comparing the efficiency of reference versus loop designs Yang and Speed (2002) Nat. Rev. Genet 3:579
36 Alternative Designs Loop: A 1 B 1 Connected Loop A B C 1 A A 1 B 2 2 B 1 C Regular Loop C 1 C 2 Reference: A A B B Classical Reference A 1 A 2 B 1 B 2 A 1 A 2 B 1 B 2 R R R R R 1 R 2 R 3 R 4 R 1 R 1 R 1 R 1 Common Reference
37 Experiments With Two Groups A 1 A 2 B 1 B 2 R R R R Reference with dye-swap A 1 A 2 A 3 B 1 B 2 B 3 A 4 B 4 Reference with R R R R R R R R alternating dye Is alternating dye really necessary?
38 Experiments with Two Groups (Direct comparison) A 1 A 2 B 1 B 2 A 3 A 4 B 3 B 4 Complete block with dye-swap Complete block design; Row-column design A 1 A 2 A 3 A 4 A 5 A 6 A 7 A 8 B 1 B 2 B 3 B 4 B 5 B 6 B 7 B 8
39 Experiments with Three Groups A 1 A 2 B 1 B 2 C 1 R R R R R C 2 R Reference with dye-swap Reference with alternating dye A 1 A 2 A 3 A 4 B 1 B 2 B 3 B 4 C 1 C 2 C 3 C 4 R R R R R R R R R R R R
40 Experiments With Three Groups Multiple connected loops A 1 B 1 A 2 B 2 A 3 B 3 A 4 B 4 C 1 C 2 C 3 C 4 Multiple regular loops = Incomplete block structure A A 1 B 2 2 B A 1 1 B 1 = C 1 C 1 C 2 B 2 C 2 A 2
41 Pooling mice Pooling can reduce the mouse variance but not the technical variances. The mouse variance will be replaced by: σ 2 1 pool = α k : pool size k σ 2 M α : constant for the effect of pooling. 0 < α < 1 α = 0, pooling has no effect. α = 1, pooling has maximum effect. Note: More pools with fewer arrays per pool is better than fewer pools with more arrays per pools when fixed number of arrays and mice are to be used.
42 Power Increase to Detect 2 fold change by Pooling ( Pool size k = 3, α = 1 ) 2 pools / trt 4 pools / trt 6 pools / trt 8 pools / trt 2 mice / trt 4 mice / trt 6 mice / trt 8 mice / trt Significance level: 0.05 after Bonferroni correction
43 Design Principle Continues Use of factorial experiments instead of the one-factor-at-a-time methods. Orthogonality: each level of one factor has all levels of the other factor. Example: To compare two treatments (T1, T2) and two strains (S1, S2) S1 S2 T1 T1S1 T1S2 T2 T2S1 T2S2
44 References Churchill GA. Fundamentals of experimental design for cdna microarrays. Nature Genet. 32: , Cui X and Churchill GA. How many mice and how many arrays? Replication in mouse cdna microarray experiments, in "Methods of Microarray Data Analysis III", Edited by KF Johnson and SM Lin. Kluwer Academic Publishers, Norwell, MA. pp , Gadbury GL, et al. Power and sample size estimation in high dimensional biology. Stat Meth Med Res 13: , Kerr MK. Design considerations for efficient and effective microarray studies. Biometrics 59: , Kerr MK and Churchill GA. Statistical design and the analysis of gene expression microarray data. Genet. Res. 77: , Kuehl RO. Design of experiments: statistical principles of research design and analysis, 2 nd ed., 1994, (Brooks/cole) Duxbry Press, Pacific Grove, CA. Page GP et al. The PowerAtlas: a power and sample size atlas for microarray experimental design and research. BMC Bioinformatics Feb 22;7:84. Rosa GJM, et al. Reassessing design and analysis of two-colour microarray experiments using mixed effects models. Comp. Funct. Genomics 6: Wit E, et al. Near-optimal designs for dual channel microarray studies. Appl. Statist. 54: , Yand YH and Speed T. Design issues for cdna microarray experiments. Nat. Rev. Genet. 3: , 2002.
Design and Analysis of Gene Expression Experiments
 Design and Analysis of Gene Expression Experiments Guilherme J. M. Rosa Department of Animal Sciences Department of Biostatistics & Medical Informatics University of Wisconsin - Madison OUTLINE Æ Linear
Chapter 3: Statistical methods for estimation and testing. Key reference: Statistical methods in bioinformatics by Ewens & Grant (2001).
.") Chapter 3: Statistical methods for estimation and testing Key reference: Statistical methods in bioinformatics by Ewens & Grant (2001). Chapter 3: Statistical methods for estimation and testing Key reference:
Chapter 3: Statistical methods for estimation and testing Key reference: Statistical methods in bioinformatics by Ewens & Grant (2001). Chapter 3: Statistical methods for estimation and testing Key reference:
Topics on statistical design and analysis. of cdna microarray experiment
 Topics on statistical design and analysis of cdna microarray experiment Ximin Zhu A Dissertation Submitted to the University of Glasgow for the degree of Doctor of Philosophy Department of Statistics May
Experimental Design. Experimental design. Outline. Choice of platform Array design. Target samples
 Experimental Design Credit for some of today s materials: Jean Yang, Terry Speed, and Christina Kendziorski Experimental design Choice of platform rray design Creation of probes Location on the array Controls
DIRECT VERSUS INDIRECT DESIGNS FOR edna MICROARRAY EXPERIMENTS
 Sankhyā : The Indian Journal of Statistics Special issue in memory of D. Basu 2002, Volume 64, Series A, Pt. 3, pp 706-720 DIRECT VERSUS INDIRECT DESIGNS FOR edna MICROARRAY EXPERIMENTS By TERENCE P. SPEED
changes in gene expression, we developed and tested several models. Each model was
 Additional Files Additional File 1 File format: PDF Title: Experimental design and linear models Description: This additional file describes in detail the experimental design and linear models used to
Optimal design of microarray experiments
 University of Groningen e.c.wit@rug.nl http://www.math.rug.nl/ ernst 7 June 2011 What is a cdna Microarray Experiment? GREEN (Cy3) Cancer Tissue mrna Mix tissues in equal amounts G G G R R R R R G R G
Design of microarray experiments
 Design of microarray experiments Ulrich Mansmann mansmann@imbi.uni-heidelberg.de Practical microarray analysis March 23 Heidelberg Heidelberg, March 23 Experiments Scientists deal mostly with experiments
Example 1: Two-Treatment CRD
 Introduction to Mixed Linear Models in Microarray Experiments //0 Copyright 0 Dan Nettleton Statistical Models A statistical model describes a formal mathematical data generation mechanism from which an
GS Analysis of Microarray Data
 GS01 0163 Analysis of Microarray Data Keith Baggerly and Kevin Coombes Section of Bioinformatics Department of Biostatistics and Applied Mathematics UT M. D. Anderson Cancer Center kabagg@mdanderson.org
GS Analysis of Microarray Data
 GS01 0163 Analysis of Microarray Data Keith Baggerly and Kevin Coombes Section of Bioinformatics Department of Biostatistics and Applied Mathematics UT M. D. Anderson Cancer Center kabagg@mdanderson.org
Improving the identification of differentially expressed genes in cdna microarray experiments
 Improving the identification of differentially expressed genes in cdna microarray experiments Databionics Research Group University of Marburg 33 Marburg, Germany Alfred Ultsch Abstract. The identification
SPOTTED cdna MICROARRAYS
 SPOTTED cdna MICROARRAYS Spot size: 50um - 150um SPOTTED cdna MICROARRAYS Compare the genetic expression in two samples of cells PRINT cdna from one gene on each spot SAMPLES cdna labelled red/green e.g.
DEGseq: an R package for identifying differentially expressed genes from RNA-seq data
 DEGseq: an R package for identifying differentially expressed genes from RNA-seq data Likun Wang Zhixing Feng i Wang iaowo Wang * and uegong Zhang * MOE Key Laboratory of Bioinformatics and Bioinformatics
Inferential Statistical Analysis of Microarray Experiments 2007 Arizona Microarray Workshop
 Inferential Statistical Analysis of Microarray Experiments 007 Arizona Microarray Workshop μ!! Robert J Tempelman Department of Animal Science tempelma@msuedu HYPOTHESIS TESTING (as if there was only one
Sample Size and Power Calculation in Microarray Studies Using the sizepower package.
 Sample Size and Power Calculation in Microarray Studies Using the sizepower package. Weiliang Qiu email: weiliang.qiu@gmail.com Mei-Ling Ting Lee email: meilinglee@sph.osu.edu George Alex Whitmore email:
Improved Statistical Tests for Differential Gene Expression by Shrinking Variance Components Estimates
 Improved Statistical Tests for Differential Gene Expression by Shrinking Variance Components Estimates September 4, 2003 Xiangqin Cui, J. T. Gene Hwang, Jing Qiu, Natalie J. Blades, and Gary A. Churchill
Sample Size Estimation for Studies of High-Dimensional Data
 Sample Size Estimation for Studies of High-Dimensional Data James J. Chen, Ph.D. National Center for Toxicological Research Food and Drug Administration June 3, 2009 China Medical University Taichung,
Biochip informatics-(i)
") Biochip informatics-(i) : biochip normalization & differential expression Ju Han Kim, M.D., Ph.D. SNUBI: SNUBiomedical Informatics http://www.snubi snubi.org/ Biochip Informatics - (I) Biochip basics Preprocessing
Biochip informatics-(i) : biochip normalization & differential expression Ju Han Kim, M.D., Ph.D. SNUBI: SNUBiomedical Informatics http://www.snubi snubi.org/ Biochip Informatics - (I) Biochip basics Preprocessing
Quick Calculation for Sample Size while Controlling False Discovery Rate with Application to Microarray Analysis
 Statistics Preprints Statistics 11-2006 Quick Calculation for Sample Size while Controlling False Discovery Rate with Application to Microarray Analysis Peng Liu Iowa State University, pliu@iastate.edu
Expression arrays, normalization, and error models
 1 Epression arrays, normalization, and error models There are a number of different array technologies available for measuring mrna transcript levels in cell populations, from spotted cdna arrays to in
Bioconductor Project Working Papers
 Bioconductor Project Working Papers Bioconductor Project Year 2004 Paper 6 Error models for microarray intensities Wolfgang Huber Anja von Heydebreck Martin Vingron Department of Molecular Genome Analysis,
Statistical Applications in Genetics and Molecular Biology
 Statistical Applications in Genetics and Molecular Biology Volume 6, Issue 1 2007 Article 28 A Comparison of Methods to Control Type I Errors in Microarray Studies Jinsong Chen Mark J. van der Laan Martyn
Normalization. Example of Replicate Data. Biostatistics Rafael A. Irizarry
 This work is licensed under a Creative Commons Attribution-NonCommercial-ShareAlike License. Your use of this material constitutes acceptance of that license and the conditions of use of materials on this
Abstract. comment reviews reports deposited research refereed research interactions information
 http://genomebiology.com/2002/3/5/research/0022.1 Research How many replicates of arrays are required to detect gene expression changes in microarray experiments? A mixture model approach Wei Pan*, Jizhen
Lesson 11. Functional Genomics I: Microarray Analysis
 Lesson 11 Functional Genomics I: Microarray Analysis Transcription of DNA and translation of RNA vary with biological conditions 3 kinds of microarray platforms Spotted Array - 2 color - Pat Brown (Stanford)
Statistical Applications in Genetics and Molecular Biology
 Statistical Applications in Genetics and Molecular Biology Volume 6, Issue 007 Article 0 Experimental Design for Two-Color Microarrays Applied in a Pre-Existing Split-Plot Experiment G. A. Milliken K.
Design of microarray experiments
 Design of microarray experiments Ulrich ansmann mansmann@imbi.uni-heidelberg.de Practical microarray analysis September Heidelberg Heidelberg, September otivation The lab biologist and theoretician need
Two-Color Microarray Experimental Design Notation. Simple Examples of Analysis for a Single Gene. Microarray Experimental Design Notation
 Simple Examples of Analysis for a Single Gene wo-olor Microarray Experimental Design Notation /3/0 opyright 0 Dan Nettleton Microarray Experimental Design Notation Microarray Experimental Design Notation
Mixture models for analysing transcriptome and ChIP-chip data
 Mixture models for analysing transcriptome and ChIP-chip data Marie-Laure Martin-Magniette French National Institute for agricultural research (INRA) Unit of Applied Mathematics and Informatics at AgroParisTech,
Linear Models and Empirical Bayes Methods for. Assessing Differential Expression in Microarray Experiments
 Linear Models and Empirical Bayes Methods for Assessing Differential Expression in Microarray Experiments by Gordon K. Smyth (as interpreted by Aaron J. Baraff) STAT 572 Intro Talk April 10, 2014 Microarray
GS Analysis of Microarray Data
 GS01 0163 Analysis of Microarray Data Keith Baggerly and Bradley Broom Department of Bioinformatics and Computational Biology UT M. D. Anderson Cancer Center kabagg@mdanderson.org bmbroom@mdanderson.org
Chapter 10. Design of Experiments and Analysis of Variance
 Chapter 10 Design of Experiments and Analysis of Variance Elements of a Designed Experiment Response variable Also called the dependent variable Factors (quantitative and qualitative) Also called the independent
Review Article Statistical Analysis of Efficient Unbalanced Factorial Designs for Two-Color Microarray Experiments
 International Journal of Plant Genomics Volume 2008, Article ID 584360, 16 pages doi:10.1155/2008/584360 Review Article Statistical Analysis of Efficient Unbalanced Factorial Designs for Two-Color Microarray
GS Analysis of Microarray Data
 GS01 0163 Analysis of Microarray Data Keith Baggerly and Bradley Broom Department of Bioinformatics and Computational Biology UT M. D. Anderson Cancer Center kabagg@mdanderson.org bmbroom@mdanderson.org
Single gene analysis of differential expression. Giorgio Valentini
 Single gene analysis of differential expression Giorgio Valentini valenti@disi.unige.it Comparing two conditions Each condition may be represented by one or more RNA samples. Using cdna microarrays, samples
ABSSeq: a new RNA-Seq analysis method based on modelling absolute expression differences
 ABSSeq: a new RNA-Seq analysis method based on modelling absolute expression differences Wentao Yang October 30, 2018 1 Introduction This vignette is intended to give a brief introduction of the ABSSeq
Single gene analysis of differential expression
 Single gene analysis of differential expression Giorgio Valentini DSI Dipartimento di Scienze dell Informazione Università degli Studi di Milano valentini@dsi.unimi.it Comparing two conditions Each condition
Genomic Medicine HT 512. Data representation, transformation & modeling in genomics
 Harvard-MIT Division of Health Sciences and Technology HST.512: Genomic Medicine Prof. Alvin T.Kho Genomic Medicine HT 512 Data representation, transformation & modeling in genomics Lecture 11, Mar 18,
OPTIMAL DESIGN OF EXPERIMENTS FOR EMERGING BIOLOGICAL AND COMPUTATIONAL APPLICATIONS
 OPTIMAL DESIGN OF EXPERIMENTS FOR EMERGING BIOLOGICAL AND COMPUTATIONAL APPLICATIONS DISSERTATION Presented in Partial Fulfillment of the Requirements for The Degree Doctor of Philosophy In the Graduate
Chapter 4: Randomized Blocks and Latin Squares
 Chapter 4: Randomized Blocks and Latin Squares 1 Design of Engineering Experiments The Blocking Principle Blocking and nuisance factors The randomized complete block design or the RCBD Extension of the
Technologie w skali genomowej 2/ Algorytmiczne i statystyczne aspekty sekwencjonowania DNA
 Technologie w skali genomowej 2/ Algorytmiczne i statystyczne aspekty sekwencjonowania DNA Expression analysis for RNA-seq data Ewa Szczurek Instytut Informatyki Uniwersytet Warszawski 1/35 The problem
Package dama. November 25, 2017
 Package dama November 25, 2017 Title Efficient design and analysis of factorial two-colour microarray data Version 1.50.0 Date 1. October 2003 Author Jobst Landgrebe and Frank Bretz
Data Preprocessing. Data Preprocessing
 Data Preprocessing 1 Data Preprocessing Normalization: the process of removing sampleto-sample variations in the measurements not due to differential gene expression. Bringing measurements from the different
Investigation 3: Comparing DNA Sequences to Understand Evolutionary Relationships with BLAST
 Investigation 3: Comparing DNA Sequences to Understand Evolutionary Relationships with BLAST Introduction Bioinformatics is a powerful tool which can be used to determine evolutionary relationships and
microrna pseudo-targets
 microrna pseudo-targets Natalia Pinzón Restrepo Institut de Génétique Humaine (CNRS), Montpellier, France August, 2012 microrna target identification mir: target: 2 7 5 N NNNNNNNNNNNNNN NNNNNN 3 the seed
Introduction to Bioinformatics. Shifra Ben-Dor Irit Orr
 Introduction to Bioinformatics Shifra Ben-Dor Irit Orr Lecture Outline: Technical Course Items Introduction to Bioinformatics Introduction to Databases This week and next week What is bioinformatics? A
A variance-stabilizing transformation for gene-expression microarray data
 BIOINFORMATICS Vol. 18 Suppl. 1 00 Pages S105 S110 A variance-stabilizing transformation for gene-expression microarray data B. P. Durbin 1, J. S. Hardin, D. M. Hawins 3 and D. M. Roce 4 1 Department of
Use of Agilent Feature Extraction Software (v8.1) QC Report to Evaluate Microarray Performance
 QC Report to Evaluate Microarray Performance") Use of Agilent Feature Extraction Software (v8.1) QC Report to Evaluate Microarray Performance Anthea Dokidis Glenda Delenstarr Abstract The performance of the Agilent microarray system can now be evaluated
Use of Agilent Feature Extraction Software (v8.1) QC Report to Evaluate Microarray Performance Anthea Dokidis Glenda Delenstarr Abstract The performance of the Agilent microarray system can now be evaluated
Clustering & microarray technology
 Clustering & microarray technology A large scale way to measure gene expression levels. Thanks to Kevin Wayne, Matt Hibbs, & SMD for a few of the slides 1 Why is expression important? Proteins Gene Expression
The gpca Package for Identifying Batch Effects in High-Throughput Genomic Data
 The gpca Package for Identifying Batch Effects in High-Throughput Genomic Data Sarah Reese July 31, 2013 Batch effects are commonly observed systematic non-biological variation between groups of samples
PROGRESS in plant and animal breeding is often
 Copyright Ó 5 by the Genetics Society of America DOI:.534/genetics.4.38448 Optimal Allocation in Designs for Assessing Heterosis From cdna Gene Expression Data Hans-Peter Piepho Institut für Pflanzenbau
Low-Level Analysis of High- Density Oligonucleotide Microarray Data
 Low-Level Analysis of High- Density Oligonucleotide Microarray Data Ben Bolstad http://www.stat.berkeley.edu/~bolstad Biostatistics, University of California, Berkeley UC Berkeley Feb 23, 2004 Outline
Network Biology-part II
 Network Biology-part II Jun Zhu, Ph. D. Professor of Genomics and Genetic Sciences Icahn Institute of Genomics and Multi-scale Biology The Tisch Cancer Institute Icahn Medical School at Mount Sinai New
GS Analysis of Microarray Data
 GS01 0163 Analysis of Microarray Data Keith Baggerly and Kevin Coombes Section of Bioinformatics Department of Biostatistics and Applied Mathematics UT M. D. Anderson Cancer Center kabagg@mdanderson.org
Bioinformatics. Transcriptome
 Bioinformatics Transcriptome Jacques.van.Helden@ulb.ac.be Université Libre de Bruxelles, Belgique Laboratoire de Bioinformatique des Génomes et des Réseaux (BiGRe) http://www.bigre.ulb.ac.be/ Bioinformatics
GS Analysis of Microarray Data
 GS01 0163 Analysis of Microarray Data Keith Baggerly and Kevin Coombes Department of Bioinformatics and Computational Biology UT M. D. Anderson Cancer Center kabagg@mdanderson.org kcoombes@mdanderson.org
Biology EOC Review Study Questions
 Biology EOC Review Study Questions Microscopes and Characteristics of Life 1. How do you calculate total magnification on a compound light microscope? 2. What is the basic building block of all living
Exploratory statistical analysis of multi-species time course gene expression
 Exploratory statistical analysis of multi-species time course gene expression data Eng, Kevin H. University of Wisconsin, Department of Statistics 1300 University Avenue, Madison, WI 53706, USA. E-mail:
Chapter 1 Statistical Inference
 Chapter 1 Statistical Inference causal inference To infer causality, you need a randomized experiment (or a huge observational study and lots of outside information). inference to populations Generalizations
Systematic Variation in Genetic Microarray Data
 Biostatistics (2004), 1, 1, pp 1 47 Printed in Great Britain Systematic Variation in Genetic Microarray Data By KIMBERLY F SELLERS, JEFFREY MIECZNIKOWSKI, andwilliam F EDDY Department of Statistics, Carnegie
Estimation of Transformations for Microarray Data Using Maximum Likelihood and Related Methods
 Estimation of Transformations for Microarray Data Using Maximum Likelihood and Related Methods Blythe Durbin, Department of Statistics, UC Davis, Davis, CA 95616 David M. Rocke, Department of Applied Science,
cdna Microarray Analysis
 cdna Microarray Analysis with BioConductor packages Nolwenn Le Meur Copyright 2007 Outline Data acquisition Pre-processing Quality assessment Pre-processing background correction normalization summarization
Protocol S1. Replicate Evolution Experiment
 Protocol S Replicate Evolution Experiment 30 lines were initiated from the same ancestral stock (BMN, BMN, BM4N) and were evolved for 58 asexual generations using the same batch culture evolution methodology
Mixtures and Hidden Markov Models for analyzing genomic data
 Mixtures and Hidden Markov Models for analyzing genomic data Marie-Laure Martin-Magniette UMR AgroParisTech/INRA Mathématique et Informatique Appliquées, Paris UMR INRA/UEVE ERL CNRS Unité de Recherche
Supplemental Data. Perea-Resa et al. Plant Cell. (2012) /tpc
 /tpc") Supplemental Data. Perea-Resa et al. Plant Cell. (22)..5/tpc.2.3697 Sm Sm2 Supplemental Figure. Sequence alignment of Arabidopsis LSM proteins. Alignment of the eleven Arabidopsis LSM proteins. Sm and
Supplemental Data. Perea-Resa et al. Plant Cell. (22)..5/tpc.2.3697 Sm Sm2 Supplemental Figure. Sequence alignment of Arabidopsis LSM proteins. Alignment of the eleven Arabidopsis LSM proteins. Sm and
High-Throughput Sequencing Course. Introduction. Introduction. Multiple Testing. Biostatistics and Bioinformatics. Summer 2018
 High-Throughput Sequencing Course Multiple Testing Biostatistics and Bioinformatics Summer 2018 Introduction You have previously considered the significance of a single gene Introduction You have previously
Multiple QTL mapping
 Multiple QTL mapping Karl W Broman Department of Biostatistics Johns Hopkins University www.biostat.jhsph.edu/~kbroman [ Teaching Miscellaneous lectures] 1 Why? Reduce residual variation = increased power
Mean Comparisons PLANNED F TESTS
 Mean Comparisons F-tests provide information on significance of treatment effects, but no information on what the treatment effects are. Comparisons of treatment means provide information on what the treatment
Error analysis in biology
 Error analysis in biology Marek Gierliński Division of Computational Biology Hand-outs available at http://is.gd/statlec Errors, like straws, upon the surface flow; He who would search for pearls must
GS Analysis of Microarray Data
 GS01 0163 Analysis of Microarray Data Keith Baggerly and Kevin Coombes Section of Bioinformatics Department of Biostatistics and Applied Mathematics UT M. D. Anderson Cancer Center kabagg@mdanderson.org
GS Analysis of Microarray Data
 GS01 0163 Analysis of Microarray Data Keith Baggerly and Kevin Coombes Section of Bioinformatics Department of Biostatistics and Applied Mathematics UT M. D. Anderson Cancer Center kabagg@mdanderson.org
Full versus incomplete cross-validation: measuring the impact of imperfect separation between training and test sets in prediction error estimation
 cross-validation: measuring the impact of imperfect separation between training and test sets in prediction error estimation IIM Joint work with Christoph Bernau, Caroline Truntzer, Thomas Stadler and
Topic 9: Factorial treatment structures. Introduction. Terminology. Example of a 2x2 factorial
 Topic 9: Factorial treatment structures Introduction A common objective in research is to investigate the effect of each of a number of variables, or factors, on some response variable. In earlier times,
Bioinformatics 2. Yeast two hybrid. Proteomics. Proteomics
 GENOME Bioinformatics 2 Proteomics protein-gene PROTEOME protein-protein METABOLISM Slide from http://www.nd.edu/~networks/ Citrate Cycle Bio-chemical reactions What is it? Proteomics Reveal protein Protein
Genome Assembly. Sequencing Output. High Throughput Sequencing
 Genome High Throughput Sequencing Sequencing Output Example applications: Sequencing a genome (DNA) Sequencing a transcriptome and gene expression studies (RNA) ChIP (chromatin immunoprecipitation) Example
Proteomics. Yeast two hybrid. Proteomics - PAGE techniques. Data obtained. What is it?
 Proteomics What is it? Reveal protein interactions Protein profiling in a sample Yeast two hybrid screening High throughput 2D PAGE Automatic analysis of 2D Page Yeast two hybrid Use two mating strains
Blocks are formed by grouping EUs in what way? How are experimental units randomized to treatments?
 VI. Incomplete Block Designs A. Introduction What is the purpose of block designs? Blocks are formed by grouping EUs in what way? How are experimental units randomized to treatments? 550 What if we have
Tools and topics for microarray analysis
 Tools and topics for microarray analysis USSES Conference, Blowing Rock, North Carolina, June, 2005 Jason A. Osborne, osborne@stat.ncsu.edu Department of Statistics, North Carolina State University 1 Outline
Experimental Design, Data, and Data Summary
 Chapter Six Experimental Design, Data, and Data Summary Tests of Hypotheses Because science advances by tests of hypotheses, scientists spend much of their time devising ways to test hypotheses. There
Implementing contrasts using SAS Proc GLM is a relatively straightforward process. A SAS Proc GLM contrast statement has the following form:
 Contrasts for Comparison of Means If the analysis of variance produces a significant F-statistic, this signals the need for further analyses. The most common post ANOVA analysis is the comparison of means.
g A n(a, g) n(a, ḡ) = n(a) n(a, g) n(a) B n(b, g) n(a, ḡ) = n(b) n(b, g) n(b) g A,B A, B 2 RNA-seq (D) RNA mrna [3] RNA 2. 2 NGS 2 A, B NGS n(
![g A n(a, g) n(a, ḡ) = n(a) n(a, g) n(a) B n(b, g) n(a, ḡ) = n(b) n(b, g) n(b) g A,B A, B 2 RNA-seq (D) RNA mrna [3] RNA 2. 2 NGS 2 A, B NGS n(](/thumbs/77/74495778.jpg "g A n(a, g) n(a, ḡ) = n(a) n(a, g) n(a) B n(b, g) n(a, ḡ) = n(b) n(b, g) n(b) g A,B A, B 2 RNA-seq (D) RNA mrna [3] RNA 2. 2 NGS 2 A, B NGS n(") ,a) RNA-seq RNA-seq Cuffdiff, edger, DESeq Sese Jun,a) Abstract: Frequently used biological experiment technique for observing comprehensive gene expression has been changed from microarray using cdna
,a) RNA-seq RNA-seq Cuffdiff, edger, DESeq Sese Jun,a) Abstract: Frequently used biological experiment technique for observing comprehensive gene expression has been changed from microarray using cdna
Introduction to clustering methods for gene expression data analysis
 Introduction to clustering methods for gene expression data analysis Giorgio Valentini e-mail: valentini@dsi.unimi.it Outline Levels of analysis of DNA microarray data Clustering methods for functional
Statistics for Differential Expression in Sequencing Studies. Naomi Altman
 Statistics for Differential Expression in Sequencing Studies Naomi Altman naomi@stat.psu.edu Outline Preliminaries what you need to do before the DE analysis Stat Background what you need to know to understand
FORESTRY 601 RESEARCH CONCEPTS FALL 2009
 FORSTRY 60 RSRH ONPTS FLL 009 dvanced esigned xperiments OMPLTLY RNOMIZ SIGN the simplest and least restrictive dvantages with p treatments and n > p experimental units >>> we can assign each treatment
robustness: revisting the significance of mirna-mediated regulation
 : revisting the significance of mirna-mediated regulation Hervé Seitz IGH (CNRS), Montpellier, France October 13, 2012 microrna target identification .. microrna target identification mir: target: 2 7
Predicting Protein Functions and Domain Interactions from Protein Interactions
 Predicting Protein Functions and Domain Interactions from Protein Interactions Fengzhu Sun, PhD Center for Computational and Experimental Genomics University of Southern California Outline High-throughput
Smart pooling for interactome mapping
 Smart pooling for interactome mapping Nicolas Thierry Mieg CNRS / TIMC IMAG / TIMB, Grenoble collaboration with Marc Vidal, CCSB / DFCI, Boston TSB Workshop, Grenoble 10/10/2007 Rual et al, Nature 2005
A calibration method for estimating absolute expression levels from microarray data
 BIOINFORMATICS ORIGINAL PAPER Vol. 22 no. 10 2006, pages 1251 1258 doi:10.1093/bioinformatics/btl068 Gene expression A calibration method for estimating absolute expression levels from microarray data
Balanced Treatment-Control Row-Column Designs
 International Journal of Theoretical & Applied Sciences, 5(2): 64-68(2013) ISSN No. (Print): 0975-1718 ISSN No. (Online): 2249-3247 Balanced Treatment-Control Row-Column Designs Kallol Sarkar, Cini Varghese,
Stat 890 Design of computer experiments
 Stat 890 Design of computer experiments Will introduce design concepts for computer experiments Will look at more elaborate constructions next day Experiment design In computer experiments, as in many
GS Analysis of Microarray Data
 GS01 0163 Analysis of Microarray Data Keith Baggerly and Bradley Broom Department of Bioinformatics and Computational Biology UT M. D. Anderson Cancer Center kabagg@mdanderson.org bmbroom@mdanderson.org
CONJOINT 541. Translating a Transcriptome at Specific Times and Places. David Morris. Department of Biochemistry
 CONJOINT 541 Translating a Transcriptome at Specific Times and Places David Morris Department of Biochemistry http://faculty.washington.edu/dmorris/ Lecture 1 The Biology and Experimental Analysis of mrna
MEMORIAL UNIVERSITY OF NEWFOUNDLAND DEPARTMENT OF MATHEMATICS AND STATISTICS FINAL EXAM - STATISTICS FALL 1999
 MEMORIAL UNIVERSITY OF NEWFOUNDLAND DEPARTMENT OF MATHEMATICS AND STATISTICS FINAL EXAM - STATISTICS 350 - FALL 1999 Instructor: A. Oyet Date: December 16, 1999 Name(Surname First): Student Number INSTRUCTIONS
BIOL Biometry LAB 6 - SINGLE FACTOR ANOVA and MULTIPLE COMPARISON PROCEDURES
 BIOL 458 - Biometry LAB 6 - SINGLE FACTOR ANOVA and MULTIPLE COMPARISON PROCEDURES PART 1: INTRODUCTION TO ANOVA Purpose of ANOVA Analysis of Variance (ANOVA) is an extremely useful statistical method
Multiplicative background correction for spotted. microarrays to improve reproducibility
 Multiplicative background correction for spotted microarrays to improve reproducibility DABAO ZHANG,, MIN ZHANG, MARTIN T. WELLS, March 12, 2006 Department of Statistics, Purdue University, West Lafayette,
6.047 / Computational Biology: Genomes, Networks, Evolution Fall 2008
 MIT OpenCourseWare http://ocw.mit.edu 6.047 / 6.878 Computational Biology: Genomes, Networks, Evolution Fall 2008 For information about citing these materials or our Terms of Use, visit: http://ocw.mit.edu/terms.
BIOINFORMATICS LAB AP BIOLOGY
 BIOINFORMATICS LAB AP BIOLOGY Bioinformatics is the science of collecting and analyzing complex biological data. Bioinformatics combines computer science, statistics and biology to allow scientists to
Hidden Markov Models and some applications
 Oleg Makhnin New Mexico Tech Dept. of Mathematics November 11, 2011 HMM description Application to genetic analysis Applications to weather and climate modeling Discussion HMM description Application to