Tools and topics for microarray analysis
|
|
|
- Richard Cunningham
- 5 years ago
- Views:
Transcription
1 Tools and topics for microarray analysis USSES Conference, Blowing Rock, North Carolina, June, 2005 Jason A. Osborne, Department of Statistics, North Carolina State University 1
2 Outline Introduction. An example from NCSU Forest Biotechnology program using SAS Scientific Discovery Systems along with JMP for visualization activities. A discussion of the False Discovery Rate including Bioconductor s qvalue() for its estimation. 2
3 Microarray experiments Use emerging technology to observe expression intensity for thousands of genes at once across different exptl. conditions. Analysis of data from these expts. presents many challenges. Terminology, communication Information technology Various platforms, continually developing Many sources of error: effects of individual organisms, arrays, spots, dye, RNA extraction and amplification, dynamic range of expression. Many different things to look at, investigate: The search for differentially expressed genes and the identification of significance The clustering of genes with similar behavior across different experimental conditions... 3
4 A cartoon would be nice. 4
5 An example The fungus Cronartium quercuum fusiforme is the known causal agent of fusiform rust disease in southern pine trees. A microarray experiment was undertaken to study, at the molecular level, the effects of the agent, as well as differences in resistance among genotypes over various stages of development in loblolly pine (Pinus taeda L.). The experiment involved 56 spotted 2-color slides and approximately 3000 genes, each spotted twice on each array. Carried out by H. Myburg, L. van Zyl, et al, Forest Biotechnology Program, NCSU Supported by USDA Forest Service Grant 5

6 Background on the fungal agent This image taken from comes with an explanation of how the fungus prospers. This 5 year old 20-foot Loblolly, with the swollen item at about 10 feet, will probably die. 6
7 Design The treatment factors in a complete crossed layout with two satellite design points: Genotype: Heterozygous (Fr1/fr1) or homozygous (fr1/fr1) (i.e. resistant R or susceptible r). Inoculated with fungus (I) or with water (C). Time. (Tissue harvested at seven time points.) RNA extracted from harvested tissue from 700 seedlings 30 seedlings for each of the 14 challenged timepoints 20 seedlings for each of the 14 controls timepoints One time point (28 days) discarded (insuff. RNA) RNA pooled over 30 (or 20) seedlings, then sampled for comparisons. 7
8 Difficult to claim that this expt. accounts for biological variation due to pooling. Units are pools of RNA, not individual seedlings. 8
, design file, annotation")
9 Processing and analysis of data from the experiment intensity files (one per array), design file, annotation file. 9

10 Quality control: background signal (Data from an expt. conducted by Katrin Wuennenburg-Stapleton, Ngai Lab at UC Berkeley, with four 2-color slides to study zebrafish.) 10

11 Quality control: array group correlation plots One matrix per treatment, one column per array channel 11

12 Screenshot from SAS Scientific Discovery Solutions 12
13 Normalization The idea is to correct for array and dye (and array dye) effects across whole genome. Could center all gene intensities about zero for each combination of array and dye. LOESS: Nonparametric regression of log 2 intensity for a channel against a baseline, which may be taken as average for that channel across all arrays. An observation for each spot on scatterplot. 13

14 Loess-normalization plots 14
15 Gene model: mixed model for signals from individual channels proc mixed; by new_cloneid; /* new_cloneid is the gene id */ class water host inoc age array spot_number; model y=host(water) inoc(water) age(water) host*inoc(water) host*age(water) inoc*age(water) host*inoc*age(water) water dye; random array spot_number(array); run; 15
16 Parameterizing the mean response Y (g) ijktdmn normalized log 2-intensity for gene (g) with indices i, j, k index samples (or treatment combinations): i indexes host j indexes inoculum k indexes control/treatment ( satellite design points) d indexes dye t indexes time m denotes array, n spot within array 16
17 Mixed model Y (g) ijkdtmn = µ (g) ijkt + δ(g) d + A (g) m + S (g) n(m) }{{} + E(g) ijkdtm }{{} fixed factorial effects random effects µ + α i(1) + β j + τ t when k = 1 µ ijkt = +(αβ) ij + (ατ) it + (βτ) jt + (αβτ) ijt µ + α i(2) + ω when k = 2 for g = 1,...,

18 F -tests for factorial effects Histograms of p-values from F -tests 18
 versus")
19 Volcano Plots Plots of fold-changes (log 2 ratios) versus p-values. 19

20 Heat map, two-way clustering of multivariate genes, treatments 20

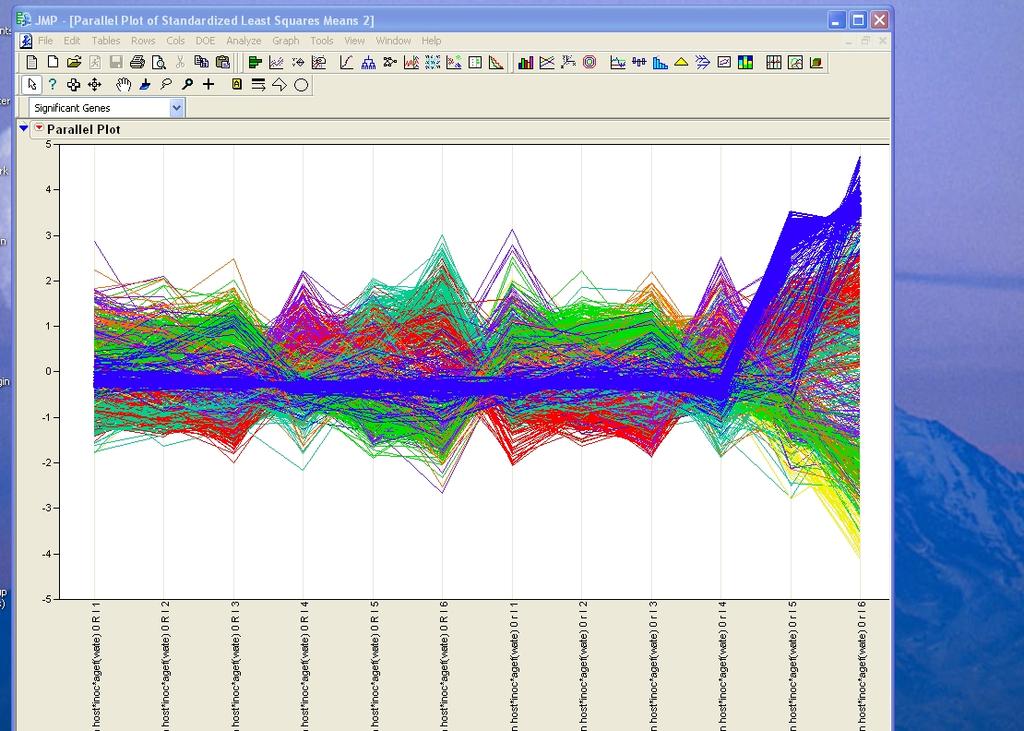
21 Parallel plots of mean response across treatments 21
22 22
)")
23 R 2 histogram R 2 (g) = 1 variance(resid(g)) variance(log2in(g)) 23
24 Some conclusions Many genes exhibit significant differential expression across these treatments. The average estimated variance components were ˆσ 2 =.033, ˆσ S(A) 2 = 0.037, ˆσ2 A = but we don t have any assessment of variability among individuals due to pooling of RNA samples over seedlings. Clear time effects, with high fold-changes occurring at the later time points, particularly for the susceptible seedlings inoculated with the fungus. 24

25 False Discovery Rates Consider an expt with many tests of significance p (1) p (2) p (m) denote ordered, unadjusted p-values. A volcano plot, with ( log 10 (p)) on the vertical axis: 25
26 Truth table: Outcome from multiple tests Truth Declared Significant Not significant Total Null is true F m 0 F m 0 Alternative is true S m 1 S m 1 Total R = F + S m R m Some quantifications of error: comparisonwise (CER), familwise (FWE) and false discovery (pfdr): ( F CER = E m 0 ) F W E = Pr(F > 0) ( ) F F DR = E R R > 0 Appealing, straightforward interpretation of FDR in microarray: if these genes investigated further (e.g. by PCR), FDR is proportion that will result in a dead-end. 26
27 To control FDR at α, How does the BH step-up procedure work? 1. Order the raw p-values: p (1) p (m) 2. Find ˆk = max{k : p (k) kα/m} 3. If ˆk exists, reject tests corresponding to p (1),..., p (ˆk) Equivalently, the BH-adjusted p-values are defined as p (m) = p (m) p (m 1) = min{ p (m),.. p (1) = min{ p (2), mp (1) } m m 1 p (m 1)} 27
28 FDR option in PROC MULTTEST with variable raw p in dataset. (Taken from Westfall, et al, (1999)) The SAS System The Multtest Procedure p-values False Discovery Test Raw Bonferroni Rate
29 A different approach to multiple testing The stepup BH procedure estimates the rejection region, i.e. ˆk, so that on average, F DR < α. Alternatively, Storey (2002) advocates fixing the critical region, and then estimating the FDR. Information in the p-values about π 0 = m 0 /m may be used to obtain an estimator and to construct a more powerful procedure that may still be used to control FDR. 29
30 Estimation of FDR Consider fixing the critical region by rejecting hypotheses with p-values less than t. From the truth table F DR(t) E[F (t)] E[R(t)] = tm 0 E[#{p i < t}] F DR(t) (Need an estimator ˆπ 0 of m 0 /m.) t ˆm 0 #{p i < t} = tˆπ 0m #{p i < t} 30
31 Estimation of ˆπ 0 π 0 = m 0 m Introduce a tuning parameter, 0 < λ < 1: ˆπ 0 (λ) = #{p i > λ} m(1 λ) Choose the best λ then substitute ˆπ 0 into the expression for F DR(t) for the fixed critical region (0, t). 31
32 Estimation of ˆπ 0 Storey (2002) considered a simulation with m = 1000 tests of H 0 : µ = 0 against H 1 : µ > 0 two random samples of size π 0 m from N(0, 1) and (1 π 0 )m from N(2, 1) (for a variety of π 0 ). p i = 1 Φ(y i ), i = 1,..., 1000 For the case π 0 = 0.8, some plots on next slide,... 32
33 33
34 Estimation of π 0 continued λ #{p i > λ} ˆπ 0 (λ) = = =.92 (Positive bias of ˆπ 0 for λ near 0, high variance for λ near 1.) qvalue() procedure in R fits smooth function, π(λ) and considers limit as λ 1. A bootstrap procedure is also available. 34
35 35
36 Estimation of FDR, contd Consider a rejection region of (0,.01) for the m = 1000 normal mixture. ˆπ 0 = 0.807(smoother estimate from software) R(.01) = 85(number of tests rejected) F DR(0.01) = ˆπ 0 mt #{p i < t} = 0.807(1000)(0.01) 85 = Intepretations: The proportion of the 85 rejected tests that are false leads is estimated to be about 10%. Bonferroni correction with α = 0.1 leads to 6 rejected tests, and we re able to say that Pr( 1 false lead) 0.1. If CER = 0.1 (no multiplicity adjustment), 229 tests are rejected, and type I error among the m = 1000 tests is 10% 36
37 q-values and their interpretation q value(p i ) = min t p i F DR(t) A measure of significance in terms of the FDR. The smallest FDR at which the statistic may be declared significant. 37
38 References Benjamini, Y. and Hochberg, Y. (1995) Controlling the false discovery rate: a practical and powerful approach to multiple testing. JRSSB, 57: Storey JD. (2002) A direct approach to false discovery rates. JRSSB, 64: Storey JD and Tibshirani R. (2003) Statistical significance for genome-wide studies. PNAS, 100: Storey JD. (2003) The positive false discovery rate: A Bayesian interpretation and the q-value. Annals of Statistics, 31: Storey JD, Taylor JE, and Siegmund D. (2004) Strong control, conservative point estimation, and simultaneous conservative consistency of false discovery rates: A unified approach. JRSSB, 66:
Estimation of the False Discovery Rate
 Estimation of the False Discovery Rate Coffee Talk, Bioinformatics Research Center, Sept, 2005 Jason A. Osborne, osborne@stat.ncsu.edu Department of Statistics, North Carolina State University 1 Outline
Table of Outcomes. Table of Outcomes. Table of Outcomes. Table of Outcomes. Table of Outcomes. Table of Outcomes. T=number of type 2 errors
 The Multiple Testing Problem Multiple Testing Methods for the Analysis of Microarray Data 3/9/2009 Copyright 2009 Dan Nettleton Suppose one test of interest has been conducted for each of m genes in a
Inferential Statistical Analysis of Microarray Experiments 2007 Arizona Microarray Workshop
 Inferential Statistical Analysis of Microarray Experiments 007 Arizona Microarray Workshop μ!! Robert J Tempelman Department of Animal Science tempelma@msuedu HYPOTHESIS TESTING (as if there was only one
False discovery rate and related concepts in multiple comparisons problems, with applications to microarray data
 False discovery rate and related concepts in multiple comparisons problems, with applications to microarray data Ståle Nygård Trial Lecture Dec 19, 2008 1 / 35 Lecture outline Motivation for not using
Statistical Applications in Genetics and Molecular Biology
 Statistical Applications in Genetics and Molecular Biology Volume 5, Issue 1 2006 Article 28 A Two-Step Multiple Comparison Procedure for a Large Number of Tests and Multiple Treatments Hongmei Jiang Rebecca
Advanced Statistical Methods: Beyond Linear Regression
 Advanced Statistical Methods: Beyond Linear Regression John R. Stevens Utah State University Notes 3. Statistical Methods II Mathematics Educators Worshop 28 March 2009 1 http://www.stat.usu.edu/~jrstevens/pcmi
BTRY 7210: Topics in Quantitative Genomics and Genetics
 BTRY 7210: Topics in Quantitative Genomics and Genetics Jason Mezey Biological Statistics and Computational Biology (BSCB) Department of Genetic Medicine jgm45@cornell.edu February 12, 2015 Lecture 3:
A Sequential Bayesian Approach with Applications to Circadian Rhythm Microarray Gene Expression Data
 A Sequential Bayesian Approach with Applications to Circadian Rhythm Microarray Gene Expression Data Faming Liang, Chuanhai Liu, and Naisyin Wang Texas A&M University Multiple Hypothesis Testing Introduction
High-Throughput Sequencing Course. Introduction. Introduction. Multiple Testing. Biostatistics and Bioinformatics. Summer 2018
 High-Throughput Sequencing Course Multiple Testing Biostatistics and Bioinformatics Summer 2018 Introduction You have previously considered the significance of a single gene Introduction You have previously
Sample Size Estimation for Studies of High-Dimensional Data
 Sample Size Estimation for Studies of High-Dimensional Data James J. Chen, Ph.D. National Center for Toxicological Research Food and Drug Administration June 3, 2009 China Medical University Taichung,
Biostatistics Advanced Methods in Biostatistics IV
 Biostatistics 140.754 Advanced Methods in Biostatistics IV Jeffrey Leek Assistant Professor Department of Biostatistics jleek@jhsph.edu Lecture 11 1 / 44 Tip + Paper Tip: Two today: (1) Graduate school
The miss rate for the analysis of gene expression data
 Biostatistics (2005), 6, 1,pp. 111 117 doi: 10.1093/biostatistics/kxh021 The miss rate for the analysis of gene expression data JONATHAN TAYLOR Department of Statistics, Stanford University, Stanford,
Aliaksandr Hubin University of Oslo Aliaksandr Hubin (UIO) Bayesian FDR / 25
 Bayesian FDR / 25") Presentation of The Paper: The Positive False Discovery Rate: A Bayesian Interpretation and the q-value, J.D. Storey, The Annals of Statistics, Vol. 31 No.6 (Dec. 2003), pp 2013-2035 Aliaksandr Hubin University
Presentation of The Paper: The Positive False Discovery Rate: A Bayesian Interpretation and the q-value, J.D. Storey, The Annals of Statistics, Vol. 31 No.6 (Dec. 2003), pp 2013-2035 Aliaksandr Hubin University
Non-specific filtering and control of false positives
 Non-specific filtering and control of false positives Richard Bourgon 16 June 2009 bourgon@ebi.ac.uk EBI is an outstation of the European Molecular Biology Laboratory Outline Multiple testing I: overview
Quick Calculation for Sample Size while Controlling False Discovery Rate with Application to Microarray Analysis
 Statistics Preprints Statistics 11-2006 Quick Calculation for Sample Size while Controlling False Discovery Rate with Application to Microarray Analysis Peng Liu Iowa State University, pliu@iastate.edu
Statistical testing. Samantha Kleinberg. October 20, 2009
 October 20, 2009 Intro to significance testing Significance testing and bioinformatics Gene expression: Frequently have microarray data for some group of subjects with/without the disease. Want to find
Lesson 11. Functional Genomics I: Microarray Analysis
 Lesson 11 Functional Genomics I: Microarray Analysis Transcription of DNA and translation of RNA vary with biological conditions 3 kinds of microarray platforms Spotted Array - 2 color - Pat Brown (Stanford)
Sta$s$cs for Genomics ( )
") Sta$s$cs for Genomics (140.688) Instructor: Jeff Leek Slide Credits: Rafael Irizarry, John Storey No announcements today. Hypothesis testing Once you have a given score for each gene, how do you decide
Sta$s$cs for Genomics (140.688) Instructor: Jeff Leek Slide Credits: Rafael Irizarry, John Storey No announcements today. Hypothesis testing Once you have a given score for each gene, how do you decide
High-throughput Testing
 High-throughput Testing Noah Simon and Richard Simon July 2016 1 / 29 Testing vs Prediction On each of n patients measure y i - single binary outcome (eg. progression after a year, PCR) x i - p-vector
Improving the Performance of the FDR Procedure Using an Estimator for the Number of True Null Hypotheses
 Improving the Performance of the FDR Procedure Using an Estimator for the Number of True Null Hypotheses Amit Zeisel, Or Zuk, Eytan Domany W.I.S. June 5, 29 Amit Zeisel, Or Zuk, Eytan Domany (W.I.S.)Improving
Empirical Bayes Moderation of Asymptotically Linear Parameters
 Empirical Bayes Moderation of Asymptotically Linear Parameters Nima Hejazi Division of Biostatistics University of California, Berkeley stat.berkeley.edu/~nhejazi nimahejazi.org twitter/@nshejazi github/nhejazi
Lecture 28. Ingo Ruczinski. December 3, Department of Biostatistics Johns Hopkins Bloomberg School of Public Health Johns Hopkins University
 Lecture 28 Department of Biostatistics Johns Hopkins Bloomberg School of Public Health Johns Hopkins University December 3, 2015 1 2 3 4 5 1 Familywise error rates 2 procedure 3 Performance of with multiple
DEGseq: an R package for identifying differentially expressed genes from RNA-seq data
 DEGseq: an R package for identifying differentially expressed genes from RNA-seq data Likun Wang Zhixing Feng i Wang iaowo Wang * and uegong Zhang * MOE Key Laboratory of Bioinformatics and Bioinformatics
Resampling-Based Control of the FDR
 Resampling-Based Control of the FDR Joseph P. Romano 1 Azeem S. Shaikh 2 and Michael Wolf 3 1 Departments of Economics and Statistics Stanford University 2 Department of Economics University of Chicago
Linear Combinations. Comparison of treatment means. Bruce A Craig. Department of Statistics Purdue University. STAT 514 Topic 6 1
 Linear Combinations Comparison of treatment means Bruce A Craig Department of Statistics Purdue University STAT 514 Topic 6 1 Linear Combinations of Means y ij = µ + τ i + ǫ ij = µ i + ǫ ij Often study
Biochip informatics-(i)
") Biochip informatics-(i) : biochip normalization & differential expression Ju Han Kim, M.D., Ph.D. SNUBI: SNUBiomedical Informatics http://www.snubi snubi.org/ Biochip Informatics - (I) Biochip basics Preprocessing
Biochip informatics-(i) : biochip normalization & differential expression Ju Han Kim, M.D., Ph.D. SNUBI: SNUBiomedical Informatics http://www.snubi snubi.org/ Biochip Informatics - (I) Biochip basics Preprocessing
arxiv: v1 [math.st] 31 Mar 2009
![arxiv: v1 [math.st] 31 Mar 2009](/thumbs/72/66691762.jpg "arxiv: v1 [math.st] 31 Mar 2009") The Annals of Statistics 2009, Vol. 37, No. 2, 619 629 DOI: 10.1214/07-AOS586 c Institute of Mathematical Statistics, 2009 arxiv:0903.5373v1 [math.st] 31 Mar 2009 AN ADAPTIVE STEP-DOWN PROCEDURE WITH PROVEN
The Annals of Statistics 2009, Vol. 37, No. 2, 619 629 DOI: 10.1214/07-AOS586 c Institute of Mathematical Statistics, 2009 arxiv:0903.5373v1 [math.st] 31 Mar 2009 AN ADAPTIVE STEP-DOWN PROCEDURE WITH PROVEN
Chapter 3: Statistical methods for estimation and testing. Key reference: Statistical methods in bioinformatics by Ewens & Grant (2001).
.") Chapter 3: Statistical methods for estimation and testing Key reference: Statistical methods in bioinformatics by Ewens & Grant (2001). Chapter 3: Statistical methods for estimation and testing Key reference:
Chapter 3: Statistical methods for estimation and testing Key reference: Statistical methods in bioinformatics by Ewens & Grant (2001). Chapter 3: Statistical methods for estimation and testing Key reference:
Two-stage stepup procedures controlling FDR
 Journal of Statistical Planning and Inference 38 (2008) 072 084 www.elsevier.com/locate/jspi Two-stage stepup procedures controlling FDR Sanat K. Sarar Department of Statistics, Temple University, Philadelphia,
Summary and discussion of: Controlling the False Discovery Rate: A Practical and Powerful Approach to Multiple Testing
 Summary and discussion of: Controlling the False Discovery Rate: A Practical and Powerful Approach to Multiple Testing Statistics Journal Club, 36-825 Beau Dabbs and Philipp Burckhardt 9-19-2014 1 Paper
DETECTING DIFFERENTIALLY EXPRESSED GENES WHILE CONTROLLING THE FALSE DISCOVERY RATE FOR MICROARRAY DATA
 University of Nebraska - Lincoln DigitalCommons@University of Nebraska - Lincoln Dissertations and Theses in Statistics Statistics, Department of 2009 DETECTING DIFFERENTIALLY EXPRESSED GENES WHILE CONTROLLING
Dr. Junchao Xia Center of Biophysics and Computational Biology. Fall /8/2016 1/38
 BIO5312 Biostatistics Lecture 11: Multisample Hypothesis Testing II Dr. Junchao Xia Center of Biophysics and Computational Biology Fall 2016 11/8/2016 1/38 Outline In this lecture, we will continue to
Probabilistic Inference for Multiple Testing
 This is the title page! This is the title page! Probabilistic Inference for Multiple Testing Chuanhai Liu and Jun Xie Department of Statistics, Purdue University, West Lafayette, IN 47907. E-mail: chuanhai,
Overview - MS Proteomics in One Slide. MS masses of peptides. MS/MS fragments of a peptide. Results! Match to sequence database
 Overview - MS Proteomics in One Slide Obtain protein Digest into peptides Acquire spectra in mass spectrometer MS masses of peptides MS/MS fragments of a peptide Results! Match to sequence database 2 But
The optimal discovery procedure: a new approach to simultaneous significance testing
 J. R. Statist. Soc. B (2007) 69, Part 3, pp. 347 368 The optimal discovery procedure: a new approach to simultaneous significance testing John D. Storey University of Washington, Seattle, USA [Received
Exam: high-dimensional data analysis January 20, 2014
 Exam: high-dimensional data analysis January 20, 204 Instructions: - Write clearly. Scribbles will not be deciphered. - Answer each main question not the subquestions on a separate piece of paper. - Finish
Multiple Testing. Hoang Tran. Department of Statistics, Florida State University
 Multiple Testing Hoang Tran Department of Statistics, Florida State University Large-Scale Testing Examples: Microarray data: testing differences in gene expression between two traits/conditions Microbiome
Low-Level Analysis of High- Density Oligonucleotide Microarray Data
 Low-Level Analysis of High- Density Oligonucleotide Microarray Data Ben Bolstad http://www.stat.berkeley.edu/~bolstad Biostatistics, University of California, Berkeley UC Berkeley Feb 23, 2004 Outline
Controlling the False Discovery Rate: Understanding and Extending the Benjamini-Hochberg Method
 Controlling the False Discovery Rate: Understanding and Extending the Benjamini-Hochberg Method Christopher R. Genovese Department of Statistics Carnegie Mellon University joint work with Larry Wasserman
University of California, Berkeley
 University of California, Berkeley U.C. Berkeley Division of Biostatistics Working Paper Series Year 2004 Paper 164 Multiple Testing Procedures: R multtest Package and Applications to Genomics Katherine
Outline. Topic 19 - Inference. The Cell Means Model. Estimates. Inference for Means Differences in cell means Contrasts. STAT Fall 2013
 Topic 19 - Inference - Fall 2013 Outline Inference for Means Differences in cell means Contrasts Multiplicity Topic 19 2 The Cell Means Model Expressed numerically Y ij = µ i + ε ij where µ i is the theoretical
Empirical Bayes Moderation of Asymptotically Linear Parameters
 Empirical Bayes Moderation of Asymptotically Linear Parameters Nima Hejazi Division of Biostatistics University of California, Berkeley stat.berkeley.edu/~nhejazi nimahejazi.org twitter/@nshejazi github/nhejazi
Lecture 27. December 13, Department of Biostatistics Johns Hopkins Bloomberg School of Public Health Johns Hopkins University.
 This work is licensed under a Creative Commons Attribution-NonCommercial-ShareAlike License. Your use of this material constitutes acceptance of that license and the conditions of use of materials on this
A GENERAL DECISION THEORETIC FORMULATION OF PROCEDURES CONTROLLING FDR AND FNR FROM A BAYESIAN PERSPECTIVE
 A GENERAL DECISION THEORETIC FORMULATION OF PROCEDURES CONTROLLING FDR AND FNR FROM A BAYESIAN PERSPECTIVE Sanat K. Sarkar 1, Tianhui Zhou and Debashis Ghosh Temple University, Wyeth Pharmaceuticals and
STAT 263/363: Experimental Design Winter 2016/17. Lecture 1 January 9. Why perform Design of Experiments (DOE)? There are at least two reasons:
? There are at least two reasons:") STAT 263/363: Experimental Design Winter 206/7 Lecture January 9 Lecturer: Minyong Lee Scribe: Zachary del Rosario. Design of Experiments Why perform Design of Experiments (DOE)? There are at least two
STAT 263/363: Experimental Design Winter 206/7 Lecture January 9 Lecturer: Minyong Lee Scribe: Zachary del Rosario. Design of Experiments Why perform Design of Experiments (DOE)? There are at least two
Step-down FDR Procedures for Large Numbers of Hypotheses
 Step-down FDR Procedures for Large Numbers of Hypotheses Paul N. Somerville University of Central Florida Abstract. Somerville (2004b) developed FDR step-down procedures which were particularly appropriate
Controlling Bayes Directional False Discovery Rate in Random Effects Model 1
 Controlling Bayes Directional False Discovery Rate in Random Effects Model 1 Sanat K. Sarkar a, Tianhui Zhou b a Temple University, Philadelphia, PA 19122, USA b Wyeth Pharmaceuticals, Collegeville, PA
Single gene analysis of differential expression
 Single gene analysis of differential expression Giorgio Valentini DSI Dipartimento di Scienze dell Informazione Università degli Studi di Milano valentini@dsi.unimi.it Comparing two conditions Each condition
The Pennsylvania State University The Graduate School Eberly College of Science GENERALIZED STEPWISE PROCEDURES FOR
 The Pennsylvania State University The Graduate School Eberly College of Science GENERALIZED STEPWISE PROCEDURES FOR CONTROLLING THE FALSE DISCOVERY RATE A Dissertation in Statistics by Scott Roths c 2011
On Procedures Controlling the FDR for Testing Hierarchically Ordered Hypotheses
 On Procedures Controlling the FDR for Testing Hierarchically Ordered Hypotheses Gavin Lynch Catchpoint Systems, Inc., 228 Park Ave S 28080 New York, NY 10003, U.S.A. Wenge Guo Department of Mathematical
Package aspi. R topics documented: September 20, 2016
 Type Package Title Analysis of Symmetry of Parasitic Infections Version 0.2.0 Date 2016-09-18 Author Matt Wayland Maintainer Matt Wayland Package aspi September 20, 2016 Tools for the
Topics on statistical design and analysis. of cdna microarray experiment
 Topics on statistical design and analysis of cdna microarray experiment Ximin Zhu A Dissertation Submitted to the University of Glasgow for the degree of Doctor of Philosophy Department of Statistics May
A Large-Sample Approach to Controlling the False Discovery Rate
 A Large-Sample Approach to Controlling the False Discovery Rate Christopher R. Genovese Department of Statistics Carnegie Mellon University Larry Wasserman Department of Statistics Carnegie Mellon University
cdna Microarray Analysis
 cdna Microarray Analysis with BioConductor packages Nolwenn Le Meur Copyright 2007 Outline Data acquisition Pre-processing Quality assessment Pre-processing background correction normalization summarization
Exam: high-dimensional data analysis February 28, 2014
 Exam: high-dimensional data analysis February 28, 2014 Instructions: - Write clearly. Scribbles will not be deciphered. - Answer each main question (not the subquestions) on a separate piece of paper.
FDR and ROC: Similarities, Assumptions, and Decisions
 EDITORIALS 8 FDR and ROC: Similarities, Assumptions, and Decisions. Why FDR and ROC? It is a privilege to have been asked to introduce this collection of papers appearing in Statistica Sinica. The papers
CHL 5225H Advanced Statistical Methods for Clinical Trials: Multiplicity
 CHL 5225H Advanced Statistical Methods for Clinical Trials: Multiplicity Prof. Kevin E. Thorpe Dept. of Public Health Sciences University of Toronto Objectives 1. Be able to distinguish among the various
Gene Ontology and Functional Enrichment. Genome 559: Introduction to Statistical and Computational Genomics Elhanan Borenstein
 Gene Ontology and Functional Enrichment Genome 559: Introduction to Statistical and Computational Genomics Elhanan Borenstein The parsimony principle: A quick review Find the tree that requires the fewest
Multiple testing: Intro & FWER 1
 Multiple testing: Intro & FWER 1 Mark van de Wiel mark.vdwiel@vumc.nl Dep of Epidemiology & Biostatistics,VUmc, Amsterdam Dep of Mathematics, VU 1 Some slides courtesy of Jelle Goeman 1 Practical notes
EMPIRICAL BAYES METHODS FOR ESTIMATION AND CONFIDENCE INTERVALS IN HIGH-DIMENSIONAL PROBLEMS
 Statistica Sinica 19 (2009), 125-143 EMPIRICAL BAYES METHODS FOR ESTIMATION AND CONFIDENCE INTERVALS IN HIGH-DIMENSIONAL PROBLEMS Debashis Ghosh Penn State University Abstract: There is much recent interest
University of California, Berkeley
 University of California, Berkeley U.C. Berkeley Division of Biostatistics Working Paper Series Year 2004 Paper 147 Multiple Testing Methods For ChIP-Chip High Density Oligonucleotide Array Data Sunduz
Effects of dependence in high-dimensional multiple testing problems. Kyung In Kim and Mark van de Wiel
 Effects of dependence in high-dimensional multiple testing problems Kyung In Kim and Mark van de Wiel Department of Mathematics, Vrije Universiteit Amsterdam. Contents 1. High-dimensional multiple testing
On adaptive procedures controlling the familywise error rate
 , pp. 3 On adaptive procedures controlling the familywise error rate By SANAT K. SARKAR Temple University, Philadelphia, PA 922, USA sanat@temple.edu Summary This paper considers the problem of developing
CHOOSING THE LESSER EVIL: TRADE-OFF BETWEEN FALSE DISCOVERY RATE AND NON-DISCOVERY RATE
 Statistica Sinica 18(2008), 861-879 CHOOSING THE LESSER EVIL: TRADE-OFF BETWEEN FALSE DISCOVERY RATE AND NON-DISCOVERY RATE Radu V. Craiu and Lei Sun University of Toronto Abstract: The problem of multiple
Estimation of a Two-component Mixture Model
 Estimation of a Two-component Mixture Model Bodhisattva Sen 1,2 University of Cambridge, Cambridge, UK Columbia University, New York, USA Indian Statistical Institute, Kolkata, India 6 August, 2012 1 Joint
Selection-adjusted estimation of effect sizes
 Selection-adjusted estimation of effect sizes with an application in eqtl studies Snigdha Panigrahi 19 October, 2017 Stanford University Selective inference - introduction Selective inference Statistical
Exceedance Control of the False Discovery Proportion Christopher Genovese 1 and Larry Wasserman 2 Carnegie Mellon University July 10, 2004
 Exceedance Control of the False Discovery Proportion Christopher Genovese 1 and Larry Wasserman 2 Carnegie Mellon University July 10, 2004 Multiple testing methods to control the False Discovery Rate (FDR),
Androgen-independent prostate cancer
 The following tutorial walks through the identification of biological themes in a microarray dataset examining androgen-independent. Visit the GeneSifter Data Center (www.genesifter.net/web/datacenter.html)
Post-Selection Inference
 Classical Inference start end start Post-Selection Inference selected end model data inference data selection model data inference Post-Selection Inference Todd Kuffner Washington University in St. Louis
Hunting for significance with multiple testing
 Hunting for significance with multiple testing Etienne Roquain 1 1 Laboratory LPMA, Université Pierre et Marie Curie (Paris 6), France Séminaire MODAL X, 19 mai 216 Etienne Roquain Hunting for significance
Multiple Hypothesis Testing in Microarray Data Analysis
 Multiple Hypothesis Testing in Microarray Data Analysis Sandrine Dudoit jointly with Mark van der Laan and Katie Pollard Division of Biostatistics, UC Berkeley www.stat.berkeley.edu/~sandrine Short Course:
REPRODUCIBLE ANALYSIS OF HIGH-THROUGHPUT EXPERIMENTS
 REPRODUCIBLE ANALYSIS OF HIGH-THROUGHPUT EXPERIMENTS Ying Liu Department of Biostatistics, Columbia University Summer Intern at Research and CMC Biostats, Sanofi, Boston August 26, 2015 OUTLINE 1 Introduction
Tweedie s Formula and Selection Bias. Bradley Efron Stanford University
 Tweedie s Formula and Selection Bias Bradley Efron Stanford University Selection Bias Observe z i N(µ i, 1) for i = 1, 2,..., N Select the m biggest ones: z (1) > z (2) > z (3) > > z (m) Question: µ values?
Power and Sample Size Estimation for Microarray Studies
 Power and Sample Size Estimation for Microarray Studies Maarten van Iterson 1, José Ferreira 2, Judith Boer 3 and Renée Menezes 4 1 Center for Human and Clinical Genetics, Leiden University Medical Center,
22s:152 Applied Linear Regression. Take random samples from each of m populations.
 22s:152 Applied Linear Regression Chapter 8: ANOVA NOTE: We will meet in the lab on Monday October 10. One-way ANOVA Focuses on testing for differences among group means. Take random samples from each
False discovery rate procedures for high-dimensional data Kim, K.I.
 False discovery rate procedures for high-dimensional data Kim, K.I. DOI: 10.6100/IR637929 Published: 01/01/2008 Document Version Publisher s PDF, also known as Version of Record (includes final page, issue
Procedures controlling generalized false discovery rate
 rocedures controlling generalized false discovery rate By SANAT K. SARKAR Department of Statistics, Temple University, hiladelphia, A 922, U.S.A. sanat@temple.edu AND WENGE GUO Department of Environmental
FALSE DISCOVERY AND FALSE NONDISCOVERY RATES IN SINGLE-STEP MULTIPLE TESTING PROCEDURES 1. BY SANAT K. SARKAR Temple University
 The Annals of Statistics 2006, Vol. 34, No. 1, 394 415 DOI: 10.1214/009053605000000778 Institute of Mathematical Statistics, 2006 FALSE DISCOVERY AND FALSE NONDISCOVERY RATES IN SINGLE-STEP MULTIPLE TESTING
Doing Cosmology with Balls and Envelopes
 Doing Cosmology with Balls and Envelopes Christopher R. Genovese Department of Statistics Carnegie Mellon University http://www.stat.cmu.edu/ ~ genovese/ Larry Wasserman Department of Statistics Carnegie
Research Article Sample Size Calculation for Controlling False Discovery Proportion
 Probability and Statistics Volume 2012, Article ID 817948, 13 pages doi:10.1155/2012/817948 Research Article Sample Size Calculation for Controlling False Discovery Proportion Shulian Shang, 1 Qianhe Zhou,
Large-Scale Hypothesis Testing
 Chapter 2 Large-Scale Hypothesis Testing Progress in statistics is usually at the mercy of our scientific colleagues, whose data is the nature from which we work. Agricultural experimentation in the early
22s:152 Applied Linear Regression. There are a couple commonly used models for a one-way ANOVA with m groups. Chapter 8: ANOVA
 22s:152 Applied Linear Regression Chapter 8: ANOVA NOTE: We will meet in the lab on Monday October 10. One-way ANOVA Focuses on testing for differences among group means. Take random samples from each
Bayesian ANalysis of Variance for Microarray Analysis
 Bayesian ANalysis of Variance for Microarray Analysis c These notes are copyrighted by the authors. Unauthorized use is not permitted. Bayesian ANalysis of Variance p.1/19 Normalization Nuisance effects,
Bayesian Aspects of Classification Procedures
 University of Pennsylvania ScholarlyCommons Publicly Accessible Penn Dissertations --203 Bayesian Aspects of Classification Procedures Igar Fuki University of Pennsylvania, igarfuki@wharton.upenn.edu Follow
SIGNAL RANKING-BASED COMPARISON OF AUTOMATIC DETECTION METHODS IN PHARMACOVIGILANCE
 SIGNAL RANKING-BASED COMPARISON OF AUTOMATIC DETECTION METHODS IN PHARMACOVIGILANCE A HYPOTHESIS TEST APPROACH Ismaïl Ahmed 1,2, Françoise Haramburu 3,4, Annie Fourrier-Réglat 3,4,5, Frantz Thiessard 4,5,6,
Statistical Applications in Genetics and Molecular Biology
 Statistical Applications in Genetics and Molecular Biology Volume 3, Issue 1 2004 Article 13 Multiple Testing. Part I. Single-Step Procedures for Control of General Type I Error Rates Sandrine Dudoit Mark
STAT 5200 Handout #7a Contrasts & Post hoc Means Comparisons (Ch. 4-5)
") STAT 5200 Handout #7a Contrasts & Post hoc Means Comparisons Ch. 4-5) Recall CRD means and effects models: Y ij = µ i + ϵ ij = µ + α i + ϵ ij i = 1,..., g ; j = 1,..., n ; ϵ ij s iid N0, σ 2 ) If we reject
STAT 5200 Handout #7a Contrasts & Post hoc Means Comparisons Ch. 4-5) Recall CRD means and effects models: Y ij = µ i + ϵ ij = µ + α i + ϵ ij i = 1,..., g ; j = 1,..., n ; ϵ ij s iid N0, σ 2 ) If we reject
Heterogeneity and False Discovery Rate Control
 Heterogeneity and False Discovery Rate Control Joshua D Habiger Oklahoma State University jhabige@okstateedu URL: jdhabigerokstateedu August, 2014 Motivating Data: Anderson and Habiger (2012) M = 778 bacteria
Incorporation of Sparsity Information in Large-scale Multiple Two-sample t Tests
 Incorporation of Sparsity Information in Large-scale Multiple Two-sample t Tests Weidong Liu October 19, 2014 Abstract Large-scale multiple two-sample Student s t testing problems often arise from the
Hypes and Other Important Developments in Statistics
 Hypes and Other Important Developments in Statistics Aad van der Vaart Vrije Universiteit Amsterdam May 2009 The Hype Sparsity For decades we taught students that to estimate p parameters one needs n p
A NEW APPROACH FOR LARGE SCALE MULTIPLE TESTING WITH APPLICATION TO FDR CONTROL FOR GRAPHICALLY STRUCTURED HYPOTHESES
 A NEW APPROACH FOR LARGE SCALE MULTIPLE TESTING WITH APPLICATION TO FDR CONTROL FOR GRAPHICALLY STRUCTURED HYPOTHESES By Wenge Guo Gavin Lynch Joseph P. Romano Technical Report No. 2018-06 September 2018
PROCEDURES CONTROLLING THE k-fdr USING. BIVARIATE DISTRIBUTIONS OF THE NULL p-values. Sanat K. Sarkar and Wenge Guo
 PROCEDURES CONTROLLING THE k-fdr USING BIVARIATE DISTRIBUTIONS OF THE NULL p-values Sanat K. Sarkar and Wenge Guo Temple University and National Institute of Environmental Health Sciences Abstract: Procedures
DIRECT VERSUS INDIRECT DESIGNS FOR edna MICROARRAY EXPERIMENTS
 Sankhyā : The Indian Journal of Statistics Special issue in memory of D. Basu 2002, Volume 64, Series A, Pt. 3, pp 706-720 DIRECT VERSUS INDIRECT DESIGNS FOR edna MICROARRAY EXPERIMENTS By TERENCE P. SPEED
Design of Microarray Experiments. Xiangqin Cui
 Design of Microarray Experiments Xiangqin Cui Experimental design Experimental design: is a term used about efficient methods for planning the collection of data, in order to obtain the maximum amount
BIOINFORMATICS ORIGINAL PAPER
 BIOINFORMATICS ORIGINAL PAPER Vol 21 no 11 2005, pages 2684 2690 doi:101093/bioinformatics/bti407 Gene expression A practical false discovery rate approach to identifying patterns of differential expression
Model Identification for Wireless Propagation with Control of the False Discovery Rate
 Model Identification for Wireless Propagation with Control of the False Discovery Rate Christoph F. Mecklenbräuker (TU Wien) Joint work with Pei-Jung Chung (Univ. Edinburgh) Dirk Maiwald (Atlas Elektronik)
Cluster Analysis of Gene Expression Microarray Data. BIOL 495S/ CS 490B/ MATH 490B/ STAT 490B Introduction to Bioinformatics April 8, 2002
 Cluster Analysis of Gene Expression Microarray Data BIOL 495S/ CS 490B/ MATH 490B/ STAT 490B Introduction to Bioinformatics April 8, 2002 1 Data representations Data are relative measurements log 2 ( red
1. (Rao example 11.15) A study measures oxygen demand (y) (on a log scale) and five explanatory variables (see below). Data are available as
 A study measures oxygen demand (y) (on a log scale) and five explanatory variables (see below). Data are available as") ST 51, Summer, Dr. Jason A. Osborne Homework assignment # - Solutions 1. (Rao example 11.15) A study measures oxygen demand (y) (on a log scale) and five explanatory variables (see below). Data are available
ST 51, Summer, Dr. Jason A. Osborne Homework assignment # - Solutions 1. (Rao example 11.15) A study measures oxygen demand (y) (on a log scale) and five explanatory variables (see below). Data are available
Multiple Testing. Tim Hanson. January, Modified from originals by Gary W. Oehlert. Department of Statistics University of South Carolina
 Multiple Testing Tim Hanson Department of Statistics University of South Carolina January, 2017 Modified from originals by Gary W. Oehlert Type I error A Type I error is to wrongly reject the null hypothesis
False discovery control for multiple tests of association under general dependence
 False discovery control for multiple tests of association under general dependence Nicolai Meinshausen Seminar für Statistik ETH Zürich December 2, 2004 Abstract We propose a confidence envelope for false