Design and Analysis of Gene Expression Experiments
|
|
|
- Teresa Strickland
- 5 years ago
- Views:
Transcription

1 Design and Analysis of Gene Expression Experiments Guilherme J. M. Rosa Department of Animal Sciences Department of Biostatistics & Medical Informatics University of Wisconsin - Madison
2 OUTLINE Æ Linear Models for Microarray Data w Log-ratio vs. intensities; mixed effects w Shrinkage estimation of variance components w Multiple testing Æ Basic Principles of Experimental Design w Some concepts and definitions w Guidelines for designing experiments Æ Microarray Experiments w Reference and loop designs w Biological and technical replication w Pooling mrna samples Æ Sample Size w Basics, Cost, FDR Æ Additional Topics w Optimal designs, Genetical genomics, RNA-Seq
3 Biological question! Differentially expressed genes! Sample class prediction etc.! Experimental design! Microarray experiment! Image analysis! Normalization! Estimation! Testing! Clustering! Discrimination! Biological verification! and interpretation!
4 Linear Models for Microarray Data
5 Linear Models for Log Ratios (Yang and Speed, 23) A B logg logr G R log y = = A B ; [y] E µ µ β = β A B β = y y E 2 y y 2 β β = y y y E R A B R A µ µ β B A 2 µ µ β y y 2 y 3
6 Linear Models for Log Ratios (Yang and Speed, 23) A B C β β = y y y E y y 2 y 3 A B µ µ β A C 2 µ µ β ð Interest: d AB, d BC and d CA = d AB + d BC 2 g g g g W ] Var[y, X ] [y E σ = β = (Generalized) Least squares or Robust regression
7 Linear Models for Log Ratios (Yang and Speed, 23) T T 3 T 4 T 2 α 2 - α α 3 - α 2 α 4 - α 3 α - α 4 α 3 - α α 2 - α 4 α i : intensity (log scale) on treatment i. θ = α 2 - α θ 2 = α 3 - α θ 3 = α 4 - α y X' X) (X' ˆ θ = ε ε ε ε ε ε + θ θ θ = y y y y y y 2 X) (X' (ˆ) Var σ = θ y y y y 2y ˆ + + = θ ) ~ N(, 2 ε i σ G R log
8 ANOVA Models for Microarray Experiments ð Sources of variation (fixed and random effects) to be considered: Dye Slide (array) Patch or print-tip within slide Spot within patch Print batch of slides Biological variability (individuals or pools) Gene Treatments (experimental groups) Interactions between factors Etc.
9 ANOVA Models (Kerr et al., 2; Kerr and Churchill, 2) log( s adgt ) = y adgt = µ + A a + D d + AD ad + G g + TG tg + AG ag + DG dg + ε adgt Signal (pixels) ε adgt ~ N(, σ 2 ) Array Global Effects Dye Interaction Array Dye Gene Gene-specific Treatment effect Gene-specific Dye effect Gene-specific Array effect Gene-specific Effects
 st Step: GLOBAL NORMALIZATION y adgt = µ + A a + D d + AD ad + G g + TG tg + AG ag + DG dg + ε adgt y = µ + A + D + AD + e adgt a d ad adgt 2 nd Step: GENE MODELS Predicted")
10 Two-Step Mixed Effects Models (Wolfinger et al., 2) st Step: GLOBAL NORMALIZATION y adgt = µ + A a + D d + AD ad + G g + TG tg + AG ag + DG dg + ε adgt y = µ + A + D + AD + e adgt a d ad adgt 2 nd Step: GENE MODELS Predicted Residuals: ê adgt = (y adgt ŷ adgt ) ê adgt = µ g + A ag + D dg + T tg + ε adgt Gene-specific treatment effects 2 ε adgt ~ N(, σ g )
11 ANOVA vs. Two-Step Mixed Effects Models Kerr and Churchill (2): y Xβ + ε = X β + X β + ε = 2 2 ε ~ N(, R), R = I N 2 σ ε, n = k g= n g Note: Independence across genes; homogeneous variances; fixed effects model. Wolfinger et al. (2): y = X β + + e eˆ g = Xgβg + Zgug εg u g ~ N(, G ), G = I σ g g q g 2 u(g) ε g 2 ~ N( g, Rg), Rg = In σε(g) g Note: Independent analyses across genes; gene-specific variances; additional random effects may be necessary (Rosa et al., 25).
12 Single Step Mixed Effects Models (Hoeschele and Li, 25) y X β + Z u + X β + Z u + ε = u ~ N(, G ), G = Iσ 2 u u ~ N(, G ), G = = I σ k g na u2 (g) ε k 2 ~ N(, R), R = g = In σε(g) g Note: Independence across genes; Similar results with two-step implementation if: a) balanced data for each gene, b) R = Iσ 2, and c) large number of genes.
13 Shrinkage Estimators of Variance Components Complete shrinkage (homogeneous variances): y 2 = Xβ + Zu + ε, with u ~ N(, I σ ) and ε ~ N(, I q u N σ 2 ε ) Note: Ranking of genes based on fold-change (consequence: selection of more variable genes ) No shrinkage at all (gene specific variances): y ind 2 = Xβ + Zu + ε, with u ~ N(, I σ ) and ε ~ N(, I g q u(g) g ind n(g) σ 2 ε(g) ) Note: Poor estimates of variance components, especially for smaller experiments Intermediate methods: Combining information across genes (e.g. regularized t-test; empirical Bayes approaches, etc.)
14 SHRINKAGE APPROACHES ð Efron et al. (2): E.g.: 9 th percentile of standard deviations t * = n M a + s something midway between a common and a gene specific standard error SAM: Significance Analysis of Microarrays ð Lönnstedt and Speed (2): Data from all genes are combined into estimates of a prior distribution These parameters are then combined at the gene level with mean and standard deviation to form a statistic B (Bayes log posterior odds)
15 SHRINKAGE APPROACHES ð LIMMA: Linear Models for Microarray Data Smyth GK (24) Linear models and empirical Bayes methods for assessing differential expression in microarray experiments. Statistical Applications in Genetics and Molecular Biology 3, No., Article 3. ð MAANOVA: MicroArray ANalysis Of VAriance Cui XG, Hwang JTG, Qiu J, Blades NJ and Churchill GA (25) Improved statistical tests for differential gene expression by shrinking variance components. Biostatistics 6(): ð Variance Component Models: (Wolfinger and Kass, 2) Feng S, Wolfinger RD, Chu TM, Gibson GC and McGraw LA (26) Empirical Bayes analysis of variance component models for microarray data. Journal of Agricultural Biological and Environmental Statistics (2):

16 Graphical Display of the Baseball Data Observed Values EB Estimates Final Values Observed Mean (Casella 985)
17 Improved Statistical Tests for Differential Gene Expression by Shrinking Variance Components Cui X et al. Biostatistics 6(): 59-75, 25 Test Statistics (F Statistics): F S : Shrinkage estimator of error variance F : Gene-specific F test F 2 : Hybrid statistic using averages of the individual and pooled variances F 3 : Pooled-variance F statistic
18 Constructing F like Statistics General F statistic for a linear mixed model: Linear mixed model: residuals observations design matrices fixed and random effects The variance-covariance matrix of (BLUE) and (BLUP) can be estimated as: Linear combinations of the fixed effects can be tested using an F statistics constructed as:
19 Constructing F -like Statistics General linear mixed model for gene g: F : Gene-specific F; variance components estimates using data only from gene g F 3 : Uses the pooled variance estimator for each variance component F 2 : Uses the average of and for each component F S : Uses from the shrinkage estimator given before as the variance component estimator for each gene

20 MULTIPLE TESTING PROBLEM
21 HYPOTHESIS TESTING (Statistical Errors) Significance level H is not rejected H is rejected H is true No error (-α) Type I error (α) H is false Type II error (β) No error (-β) Æ Standard approach: Power Specify an acceptable type I error rate (α) Seek tests that minimize the type II error rate (β), i.e., maximize power ( - β)
22 THE PROBLEM OF MULTIPLE TESTING Suppose you carry out hypothesis tests at the 5% level (assume independent tests ) The probability of declaring a particular test significant under its null hypothesis is.5 But the probability of declaring at least of the tests significant is If you perform 2 hypothesis tests, this probability increases to.642 Æ Typically thousands of genes simultaneously Æ Type I error rate (α) Suppose: Self-self hybridization with g = genes; and α = 5% (for each test) Expected.5 = 5 false positives
23 DISTRIBUTION OF P-VALUES Under H Mixture of H and H a
24 Biological question! Differentially expressed genes! Sample class prediction etc.! Experimental design! Microarray experiment! Image analysis! Normalization! Estimation! Testing! Clustering! Discrimination! Biological verification! and interpretation!
25 To consult the statistician after an experiment is finished is often merely to ask him to conduct a post mortem examination. He can perhaps say what the experiment died of. Fisher (938)
26 GUIDELINES FOR DESIGNING EXPERIMENTS (Montgomery, 25). Recognition of and statement of the problem 2. Selection of the response variable 3. Choice of factors, levels, and ranges 4. Choice of experimental design 5. Performing the experiment 6. Statistical analysis of the data 7. Conclusions and recommendations
27 DESIGN OF MICROARRAY EXPERIMENTS Legend: Treatment A, Treatment B Treatment A, Treatment B Block Block 2 Block 3 ANOVA Table Source of Variation DF Block 2 Trt 3 Residual 6 Total
28 SINGLE CHANNEL MICROARRAY EXPERIMENT Block Block 2 Block 3 ANOVA table for each gene SV Block Trt Residual Total DF 2 3 6
29 TWO COLOR MICROARRAY EXPERIMENT Block Block 2 Block 3 ANOVA (mixed effects model) will depend on both the preexisting and the microarray designs (Rosa et al. 25): y = µ + Dye + Block + Array(Block) + Trt + Sample(Trt) + ε Additional effects can be included in the model depending also on the array structure (print-tip, replicated spots per clone, etc.) and other systematic nuisance effects
30 BASIC PRINCIPLES OF EXPERIMENTAL DESIGN Randomization Averaging out extraneous, non-controlled factors Replication Assessing experimental error Blocking Restriction on randomization
31 Fictitious Greenhouse Experiment Goal: To compare total leaf area of plants in two experimental conditions (Control and Treatment) Null Hypothesis: Similar leaf area in both groups Single plant in each group, three leaves per plant Control Treatment Control Treatment t = 4.82 (p =.85)
32 Fictitious Greenhouse Experiment Randomization within blocks s T s C xc xt Biological replication Blocking side of greenhouse
on")
on Blocking (mul)ple")
33 EXPERIMENTAL DESIGN PRINCIPLES IN GENE EXPRESSION PROFILING Randomiza)on Biological vs. technical replica)on Blocking (mul)ple samples per slide/flow cell)
34 BIOLOGICAL VS. TECHNICAL REPLICATION Consider an experiment where two groups are compared, and n subjects within each treatment are measured m times. Assume that the data generation process can be described as: observed trait general constant treatment effect residual term, with variance random effect of subjects within treatments, with variance (Rosa et al., 25)

35 BIOLOGICAL VS. TECHNICAL REPLICATION Analysis I: Ignoring the two different levels of replication

36 BIOLOGICAL VS. TECHNICAL REPLICATION Analysis II: Considering V v as fixed

37 Multiple Subjects Multiple Samples Multiple Slides Multiple Spots
38
39 Figure : Alternative reference designs with three treatments (A, B and C) and 2 arrays: a) Common reference design (CRD) with four replicates (subindexes); reference sample (R) is the same in all arrays; b) Classical reference design (ClRD) with four replicates (subindexes) in 2 arrays; reference sample (R) is replicated; and c) Replicated reference design (RRD), in which six replications of treatments B and C are hybridized together with independent replicates of a control treatment (A).
40 Figure 2. Relative efficiency of the replicated reference design (RRD) as compared to the common reference design (CRD), considering: a) the same number of replicates (r), and b) the same number of arrays (n). X-axis is the log2 of the variance ratio; curves correspond to different numbers of treatments (K).
41
42 BLOCKING (Restriction on Randomization) Æ COMPLETELY RANDOMIZED DESIGN Æ COMPLETE BLOCK DESIGN Æ INCOMPLETE BLOCK DESIGNS
43 COMPLETELY RANDOMIZED DESIGN Æ Example: w Three crop varieties (A, B and C) to be compared w Six homogeneous plots A B B C A C
44 COMPLETE BLOCK DESIGN Æ Example: w Three crop varieties (A, B and C) to be compared w Two blocks of three homogeneous plots each A B C C A B ð Randomization within blocks ð Block size equal to number of varieties
45 What if block size not equal the number of treatments Æ Example: w Three crop varieties (A, B and C) to be compared w Three blocks of two homogeneous plots each A vs B A B C Indirect Comparison R R R ð R: Additional variety (Reference) ð Indirect comparison between varieties A, B and C
46 What if block size not equal the number of treatments Æ Example: w Three crop varieties (A, B and C) to be compared w Three blocks of two homogeneous plots each A B C A vs B Direct Comparison B C A A vs B Indirect Comparison ð Two replications for each variety ð Smaller variances of variety differences (2/3 relatively to reference design)
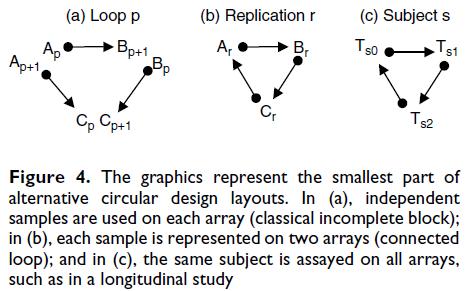
47 REFERENCE AND LOOP STRUCTURES Target samples: experimental groups REFERENCE A R B R C R D R E R Reference sample LOOP, CIRCULAR A B B C C D D E E A
48 USUAL GRAPHICAL REPRESENTATION Hybridization (slide) A B A B ð Comparisons: C mrna samples Cy3 (Green) Cy5 (Red) Direct (more precise) A B log 2 (A/B) Indirect (less precise) A C B log 2 (A/C) - log 2 (C/B)
49 USUAL GRAPHICAL REPRESENTATION REFERENCE A B C D E LOOP A E B R R R R R D C

50 (Yang and Speed, 22)
51 ALTERNATIVE DESIGNS Loop: A B Connected Loop A B C A A B 2 2 B C Regular Loop C C 2 Reference: A A B B Classical Reference A A 2 B B 2 A A 2 B B 2 R R R R R R 2 R 3 R 4 R R R R Common Reference
52 EXPERIMENTS WITH TWO GROUPS A A 2 B B 2 R R R R Reference with dye-swap A A 2 A 3 B B 2 B 3 A 4 B 4 Reference with R R R R R R R R alternating dye Is alternating dye really necessary?
53 EXPERIMENTS WITH TWO GROUPS A Single loop B 4 B A 4 A 2 B 3 A 3 B 2 Notice: Direct comparisons between the two groups
54 EXPERIMENTS WITH TWO GROUPS A A 2 B B 2 A 3 A 4 B 3 B 4 Complete block with dye-swap Complete block design; Row-column design A A 2 A 3 A 4 A 5 A 6 A 7 A 8 B B 2 B 3 B 4 B 5 B 6 B 7 B 8
55 EXPERIMENTS WITH THREE GROUPS A A 2 B B 2 C R R R R R C 2 R Reference with dye-swap Reference with alternating dye A A 2 A 3 A 4 B B 2 B 3 B 4 C C 2 C 3 C 4 R R R R R R R R R R R R
56 EXPERIMENTS WITH THREE GROUPS A B C C 2 B 2 A 2 Notice: Still direct comparisons between each group
57 EXPERIMENTS WITH THREE GROUPS Multiple connected loops A B A 2 B 2 A 3 B 3 A 4 B 4 C C 2 C 3 C 4 Multiple regular loops = Incomplete block structure A A B 2 2 B A B = C C C 2 B 2 C 2 A 2
58 EXPERIMENTS WITH MORE THAN THREE GROUPS A B Notice: May not have all possible direct comparisons C A 2 E D May want to include interwoven connections
59 A 2 x 2 x 2 A-optimal design allowing for biological replication 2 ages (A and a) x 2 sexes (B and b) x 2 strains (D and d) = 8 groups 2 biological / group 6 samples (pools) 32 arrays Power considerations may dictate need of another 6 samples with reverse fluor. (Churchill and Oliver, 2)
60 Sweetpotato Plant Response to Sweet Potato Virus Disease Treatments: T: uninfected plants T2: plants infected with SPFMV-RC alone T3: plants infected with SPFMV-C alone T4: plants infected with SPCSV alone T5: plants infected with SPFMV-RC and SPCSV together T6: plants infected with SPFMV-C and SPCSV together (McGregor et al., 29) Such treatment structure can be viewed as a 2 x 3 factorial, as following: Virus Virus 2 (SPCSV) None SPFMV-RC SPFMV-C No T T2 T3 Yes T4 T5 T6
61 Repeated measurements (longitudinal study) with 5 time points: Days After Infection (DAI) Treatment T T2 T3 T4 T5 T6 3 biological replications per treatment x time combination
62 6 slides available; contrasts of interest: ) treatments within time points, and 2) time points within treatment Possible Alternative: DAI Treatment T T2 T3 T4 T5 T6
63 EXPERIMENTS WITH MORE THAN THREE GROUPS BALANCED INCOMPLETE BLOCK DESIGNS (BIBD) - All pair of treatments occur together the same number of times - Let a: number of treatments, b: number of blocks, k: block size a = k a! k!(a k)! - BIBD: blocks with different combinations of treatments to each block. - But balance can be obtained with fewer blocks as well - Total number of observations = bk = ar, r: # observations/trt - Number of times each pair of trt appear in the same block: λ = r(k ) a
64 POOLING OF mrna SAMPLES s Not enough RNA available from each subject (unit) s Limited number of arrays Fixed number of subjects (r = 3) 2 3 better than better than Fixed number of slides (n = 3) better than α B 2 F Issues: outliers; clustering analysis; σ = σ ( α ) pool k
65 SAMPLE SIZE HYPOTHESIS TESTING H is not rejected H is rejected Significance level H is true No error (-α) Type I error (α) H is false Type II error (β) No error (-β) Æ Standard approach: Power Specify an acceptable type I error rate (α) Seek tests that minimize the type II error rate (β), i.e., maximize power ( - β)
66 SAMPLE SIZE * Minimum number of replication (r) per group: 3-5 (two groups) (reliable SD estimates, permutation test, df error, etc.) Factorial 2 x 2 A A2 B r r B2 r r S.V. (r=) (r=2) (r=3) A B A*B Error 4 8 Total 3 7
67 SAMPLE SIZE * Sample size calculation for experiments with two groups REFERENCE: n = # arrays (total) 4 ( z + z ) ( α / 2) ( δ / σ) log(fc) 2 ( β) 2 SD BALANCED BLOCK: n = ( z + z ) ( α / 2) ( δ / τ) ( β) 2 2 (in general, τ > σ) Example (Dobbin and Simon, 23): δ=, α=., β=.5: σ.5 n = 3 (i.e. 5A + 5B + 3R) τ.67 n = 7 (i.e. 7A + 7B)
68 SAMPLE SIZE COST (Cui and Churchill, 23): * m technical replicates (measurements) on n pools of k subjects each: MSE σ n k 2 B = α + ( σ 2 A + σ m 2 e / r) Biological variance Technical variance Residual variance Cost = n k C U + n m C M Cost of each experimental unit cost of each measurement
69 Æ Set-up: Testing m null hypothesis H j (j =,,m) (m o true and m false null hypothesis; R: n o H rejected (false positives) N o H not rejected N o H rejected N o true H A B m N o false H C D m m R R m Observable quantity (n o rejected H ) known quantity Family-wise error rate (FWER): FWER = Pr(B ) = Pr(B = ) False discovery rate (FDR): FDR = E[B/ R R > ]Pr(R > ) Positive FDR (pfdr); Storey (22)
 TP D =, TN = C + D D EDR = B + D A, A + B n n* τ p-value t t * p-value * TP TN EDR Other methods")
70 SAMPLE SIZE * In the context of multiple testing: Gadbury et al. (24) TP D =, TN = C + D D EDR = B + D A, A + B n n* τ p-value t t * p-value * TP TN EDR Other methods (FDR-based): Muller et al. (24), Hu et al. (25) and Jung (25)
71 FDR * Liu and Hwang (27): Prior specification of: Maximal FDR (α) Required power ( - β) Proportion of non-differentially expressed genes (π ) Noncentrality parameter (λ) Unit variance (σ 2 ) Then a constant c is chosen to satisfy: where F k;d(n) (c) : cdf of the F distribution with k and d(n) degrees of freedom F : cdf of the noncentral F distribution with noncentrality parameter λ k;d(n); λ (c) k: number of treatment contrasts of interest d(n): residual degrees of freedom F F k;d(n) k;d(n); λ n: number of sets used (set is a partial treatment design which will be replicated to produce the complete design) Using this c, the expected power is: β = Fk ;d(n); λ (c) and n can be chosen to achieve the required expected power. (c) (c) α( π) = ( α) π
72 GENERAL STATISTICAL PRINCIPLES OF THE DESIGN OF EXPERIMENTS General procedure for choosing a good design: (Bailey 98, 998 and Mead 99). Choice of a set of treatments (groups to compare) given the objectives of the experiment. 2. Identification of the experimental units and choice of blocking structure based on expected pattern of variability among them. 3. Identification of any restrictions on which treatments can be applied to units. 4. Construction of design using a combinatorial, algorithmic or ad hoc method.
73 OPTIMAL DESIGNS w Model: y = Xθ + e w Information on θ is proportional to X X, thus, some suitable function of this information should be optimized. w Kiefer (959) alphabetic optimality criteria
74 Var[ˆ] θ = ( X' X) σ 2 = M σ 2 w A: Minimize the average of the variances (Trace of M - ) w D: Minimize the hypervolume of the C.R. for θ (Determinant of M - ) w E: Minimize the variance of the worst estimated estimable function of θ (First Eigenvalue of M - ) w Others: Subset θ s of θ: A s or D s ; Decision Theoretic Approach: Lindley (972), Tiao and Afonja (978), Chaloner and Verdinelli (995)
75 n = v + 2 A-optimal designs (Kerr and Churchill, 2) n = 2v

76 (Yang and Speed, 22)

77 (Yang and Speed, 22)
78 DYE-SWAP vs. DYE BALANCE Wit et al. (25)
")
79 half sib families of size 3 = A Design for Genetically Related Treatments (Example with Hierarchical Mating)

80 Briefings in Bioinformatics 2(3): , 2. RNA-SEQ SPECIFIC EFFECTS AND BLOCKING Nuisance factors: processing date, technician, and reagent batch Others: library preparation effect; variation between flow cell, and variation between lanes within flow
: >9% transcripts sampled with 6 sequence reads General recommendation:")
81 SEQUENCING DEPTH Sequencing depth vs. sample size Power law: Bashir et al (2): >9% transcripts sampled with 6 sequence reads General recommendation: run small pilot sequencing to estimate the distribution of all transcripts
 Total number")
, replicate (lane) j (j=,2,,n i ), for")
82 SAMPLE SIZE CALCULATION Technical replicates, with negligible library preparation and lane effects (Poisson model) Total number of mapped reads transcript frequency for this gene X ijk: count from treatment i (i=,2), replicate (lane) j (j=,2,,n i ), for gene k.
83 SAMPLE SIZE CALCULATION To obtain a power (- β) under the alterna)ve hypothesis at the level of significance α, by using a Wald- type Z- sta)s)cs, we can have the rela)on: where, and are normal quan)les.
84 SAMPLE SIZE CALCULATION Approximate sample sizes equal to: Note: values of α, β and ρ are pre-selected values of d and, and can be determined using preliminary data Warning: sample size calculation based on the Poisson model above is the most optimistic scenario
85 SAMPLE SIZE CALCULATION Calculations with biological replication: over-dispersion issue, Negative Binomial distributions No analytical derivation and Monte Carlo simulation necessary Calculation discussed for a single gene; Potential alternatives in the context of multiple testing: - Obtain sample sizes for one gene and then determine the overall sample size based on the overall average power - Set effect size, number of non-differential genes, and the expected number of false positives - Model P-values as a mixture of distribution from genes that are not differentially expressed and genes that are differentially expressed
 using different technology, e.g. qrt-pcr")
86 VALIDATION Validation with independent samples and (not necessary) using different technology, e.g. qrt-pcr
Design of Microarray Experiments. Xiangqin Cui
 Design of Microarray Experiments Xiangqin Cui Experimental design Experimental design: is a term used about efficient methods for planning the collection of data, in order to obtain the maximum amount
Quick Calculation for Sample Size while Controlling False Discovery Rate with Application to Microarray Analysis
 Statistics Preprints Statistics 11-2006 Quick Calculation for Sample Size while Controlling False Discovery Rate with Application to Microarray Analysis Peng Liu Iowa State University, pliu@iastate.edu
Statistical Applications in Genetics and Molecular Biology
 Statistical Applications in Genetics and Molecular Biology Volume 5, Issue 1 2006 Article 28 A Two-Step Multiple Comparison Procedure for a Large Number of Tests and Multiple Treatments Hongmei Jiang Rebecca
Biochip informatics-(i)
") Biochip informatics-(i) : biochip normalization & differential expression Ju Han Kim, M.D., Ph.D. SNUBI: SNUBiomedical Informatics http://www.snubi snubi.org/ Biochip Informatics - (I) Biochip basics Preprocessing
Biochip informatics-(i) : biochip normalization & differential expression Ju Han Kim, M.D., Ph.D. SNUBI: SNUBiomedical Informatics http://www.snubi snubi.org/ Biochip Informatics - (I) Biochip basics Preprocessing
Linear Models and Empirical Bayes Methods for. Assessing Differential Expression in Microarray Experiments
 Linear Models and Empirical Bayes Methods for Assessing Differential Expression in Microarray Experiments by Gordon K. Smyth (as interpreted by Aaron J. Baraff) STAT 572 Intro Talk April 10, 2014 Microarray
Improved Statistical Tests for Differential Gene Expression by Shrinking Variance Components Estimates
 Improved Statistical Tests for Differential Gene Expression by Shrinking Variance Components Estimates September 4, 2003 Xiangqin Cui, J. T. Gene Hwang, Jing Qiu, Natalie J. Blades, and Gary A. Churchill
DEGseq: an R package for identifying differentially expressed genes from RNA-seq data
 DEGseq: an R package for identifying differentially expressed genes from RNA-seq data Likun Wang Zhixing Feng i Wang iaowo Wang * and uegong Zhang * MOE Key Laboratory of Bioinformatics and Bioinformatics
Empirical Bayes Moderation of Asymptotically Linear Parameters
 Empirical Bayes Moderation of Asymptotically Linear Parameters Nima Hejazi Division of Biostatistics University of California, Berkeley stat.berkeley.edu/~nhejazi nimahejazi.org twitter/@nshejazi github/nhejazi
Inferential Statistical Analysis of Microarray Experiments 2007 Arizona Microarray Workshop
 Inferential Statistical Analysis of Microarray Experiments 007 Arizona Microarray Workshop μ!! Robert J Tempelman Department of Animal Science tempelma@msuedu HYPOTHESIS TESTING (as if there was only one
Advanced Statistical Methods: Beyond Linear Regression
 Advanced Statistical Methods: Beyond Linear Regression John R. Stevens Utah State University Notes 3. Statistical Methods II Mathematics Educators Worshop 28 March 2009 1 http://www.stat.usu.edu/~jrstevens/pcmi
Statistics Applied to Bioinformatics. Tests of homogeneity
 Statistics Applied to Bioinformatics Tests of homogeneity Two-tailed test of homogeneity Two-tailed test H 0 :m = m Principle of the test Estimate the difference between m and m Compare this estimation
Gene Expression an Overview of Problems & Solutions: 3&4. Utah State University Bioinformatics: Problems and Solutions Summer 2006
 Gene Expression an Overview of Problems & Solutions: 3&4 Utah State University Bioinformatics: Problems and Solutions Summer 006 Review Considering several problems & solutions with gene expression data
Topics on statistical design and analysis. of cdna microarray experiment
 Topics on statistical design and analysis of cdna microarray experiment Ximin Zhu A Dissertation Submitted to the University of Glasgow for the degree of Doctor of Philosophy Department of Statistics May
SPH 247 Statistical Analysis of Laboratory Data. April 28, 2015 SPH 247 Statistics for Laboratory Data 1
 SPH 247 Statistical Analysis of Laboratory Data April 28, 2015 SPH 247 Statistics for Laboratory Data 1 Outline RNA-Seq for differential expression analysis Statistical methods for RNA-Seq: Structure and
Exam: high-dimensional data analysis January 20, 2014
 Exam: high-dimensional data analysis January 20, 204 Instructions: - Write clearly. Scribbles will not be deciphered. - Answer each main question not the subquestions on a separate piece of paper. - Finish
Statistical analysis of microarray data: a Bayesian approach
 Biostatistics (003), 4, 4,pp. 597 60 Printed in Great Britain Statistical analysis of microarray data: a Bayesian approach RAPHAEL GTTARD University of Washington, Department of Statistics, Box 3543, Seattle,
Comparative analysis of RNA- Seq data with DESeq2
 Comparative analysis of RNA- Seq data with DESeq2 Simon Anders EMBL Heidelberg Two applications of RNA- Seq Discovery Eind new transcripts Eind transcript boundaries Eind splice junctions Comparison Given
Chapter 3: Statistical methods for estimation and testing. Key reference: Statistical methods in bioinformatics by Ewens & Grant (2001).
.") Chapter 3: Statistical methods for estimation and testing Key reference: Statistical methods in bioinformatics by Ewens & Grant (2001). Chapter 3: Statistical methods for estimation and testing Key reference:
Chapter 3: Statistical methods for estimation and testing Key reference: Statistical methods in bioinformatics by Ewens & Grant (2001). Chapter 3: Statistical methods for estimation and testing Key reference:
changes in gene expression, we developed and tested several models. Each model was
 Additional Files Additional File 1 File format: PDF Title: Experimental design and linear models Description: This additional file describes in detail the experimental design and linear models used to
David M. Rocke Division of Biostatistics and Department of Biomedical Engineering University of California, Davis
 David M. Rocke Division of Biostatistics and Department of Biomedical Engineering University of California, Davis March 18, 2016 UVA Seminar RNA Seq 1 RNA Seq Gene expression is the transcription of the
Mixtures of Negative Binomial distributions for modelling overdispersion in RNA-Seq data
 Mixtures of Negative Binomial distributions for modelling overdispersion in RNA-Seq data Cinzia Viroli 1 joint with E. Bonafede 1, S. Robin 2 & F. Picard 3 1 Department of Statistical Sciences, University
Experimental Design and Data Analysis for Biologists
 Experimental Design and Data Analysis for Biologists Gerry P. Quinn Monash University Michael J. Keough University of Melbourne CAMBRIDGE UNIVERSITY PRESS Contents Preface page xv I I Introduction 1 1.1
Sample Size Estimation for Studies of High-Dimensional Data
 Sample Size Estimation for Studies of High-Dimensional Data James J. Chen, Ph.D. National Center for Toxicological Research Food and Drug Administration June 3, 2009 China Medical University Taichung,
Empirical Bayes Moderation of Asymptotically Linear Parameters
 Empirical Bayes Moderation of Asymptotically Linear Parameters Nima Hejazi Division of Biostatistics University of California, Berkeley stat.berkeley.edu/~nhejazi nimahejazi.org twitter/@nshejazi github/nhejazi
Lesson 11. Functional Genomics I: Microarray Analysis
 Lesson 11 Functional Genomics I: Microarray Analysis Transcription of DNA and translation of RNA vary with biological conditions 3 kinds of microarray platforms Spotted Array - 2 color - Pat Brown (Stanford)
Statistical tests for differential expression in count data (1)
") Statistical tests for differential expression in count data (1) NBIC Advanced RNA-seq course 25-26 August 2011 Academic Medical Center, Amsterdam The analysis of a microarray experiment Pre-process image
Statistical tests for differential expression in count data (1) NBIC Advanced RNA-seq course 25-26 August 2011 Academic Medical Center, Amsterdam The analysis of a microarray experiment Pre-process image
Stat/F&W Ecol/Hort 572 Review Points Ané, Spring 2010
 1 Linear models Y = Xβ + ɛ with ɛ N (0, σ 2 e) or Y N (Xβ, σ 2 e) where the model matrix X contains the information on predictors and β includes all coefficients (intercept, slope(s) etc.). 1. Number of
Non-specific filtering and control of false positives
 Non-specific filtering and control of false positives Richard Bourgon 16 June 2009 bourgon@ebi.ac.uk EBI is an outstation of the European Molecular Biology Laboratory Outline Multiple testing I: overview
Optimal Tests Shrinking Both Means and Variances Applicable to Microarray Data Analysis
 Statistics Preprints Statistics 4-2007 Optimal Tests Shrinking Both Means and Variances Applicable to Microarray Data Analysis J.T. Gene Hwang Cornell University Peng Liu Iowa State University, pliu@iastate.edu
Confounder Adjustment in Multiple Hypothesis Testing
 in Multiple Hypothesis Testing Department of Statistics, Stanford University January 28, 2016 Slides are available at http://web.stanford.edu/~qyzhao/. Collaborators Jingshu Wang Trevor Hastie Art Owen
Design of microarray experiments
 Design of microarray experiments Ulrich ansmann mansmann@imbi.uni-heidelberg.de Practical microarray analysis September Heidelberg Heidelberg, September otivation The lab biologist and theoretician need
GS Analysis of Microarray Data
 GS01 0163 Analysis of Microarray Data Keith Baggerly and Kevin Coombes Section of Bioinformatics Department of Biostatistics and Applied Mathematics UT M. D. Anderson Cancer Center kabagg@mdanderson.org
Normalization. Example of Replicate Data. Biostatistics Rafael A. Irizarry
 This work is licensed under a Creative Commons Attribution-NonCommercial-ShareAlike License. Your use of this material constitutes acceptance of that license and the conditions of use of materials on this
Statistics for Differential Expression in Sequencing Studies. Naomi Altman
 Statistics for Differential Expression in Sequencing Studies Naomi Altman naomi@stat.psu.edu Outline Preliminaries what you need to do before the DE analysis Stat Background what you need to know to understand
Statistical Applications in Genetics and Molecular Biology
 Statistical Applications in Genetics and Molecular Biology Volume 6, Issue 1 2007 Article 28 A Comparison of Methods to Control Type I Errors in Microarray Studies Jinsong Chen Mark J. van der Laan Martyn
SPOTTED cdna MICROARRAYS
 SPOTTED cdna MICROARRAYS Spot size: 50um - 150um SPOTTED cdna MICROARRAYS Compare the genetic expression in two samples of cells PRINT cdna from one gene on each spot SAMPLES cdna labelled red/green e.g.
Research Article Sample Size Calculation for Controlling False Discovery Proportion
 Probability and Statistics Volume 2012, Article ID 817948, 13 pages doi:10.1155/2012/817948 Research Article Sample Size Calculation for Controlling False Discovery Proportion Shulian Shang, 1 Qianhe Zhou,
Design of microarray experiments
 Design of microarray experiments Ulrich Mansmann mansmann@imbi.uni-heidelberg.de Practical microarray analysis March 23 Heidelberg Heidelberg, March 23 Experiments Scientists deal mostly with experiments
cdna Microarray Analysis
 cdna Microarray Analysis with BioConductor packages Nolwenn Le Meur Copyright 2007 Outline Data acquisition Pre-processing Quality assessment Pre-processing background correction normalization summarization
Expression arrays, normalization, and error models
 1 Epression arrays, normalization, and error models There are a number of different array technologies available for measuring mrna transcript levels in cell populations, from spotted cdna arrays to in
Lecture 2: Linear Models. Bruce Walsh lecture notes Seattle SISG -Mixed Model Course version 23 June 2011
 Lecture 2: Linear Models Bruce Walsh lecture notes Seattle SISG -Mixed Model Course version 23 June 2011 1 Quick Review of the Major Points The general linear model can be written as y = X! + e y = vector
Practical Statistics for the Analytical Scientist Table of Contents
 Practical Statistics for the Analytical Scientist Table of Contents Chapter 1 Introduction - Choosing the Correct Statistics 1.1 Introduction 1.2 Choosing the Right Statistical Procedures 1.2.1 Planning
DESAIN EKSPERIMEN BLOCKING FACTORS. Semester Genap 2017/2018 Jurusan Teknik Industri Universitas Brawijaya
 DESAIN EKSPERIMEN BLOCKING FACTORS Semester Genap Jurusan Teknik Industri Universitas Brawijaya Outline The Randomized Complete Block Design The Latin Square Design The Graeco-Latin Square Design Balanced
Single gene analysis of differential expression
 Single gene analysis of differential expression Giorgio Valentini DSI Dipartimento di Scienze dell Informazione Università degli Studi di Milano valentini@dsi.unimi.it Comparing two conditions Each condition
High-Throughput Sequencing Course. Introduction. Introduction. Multiple Testing. Biostatistics and Bioinformatics. Summer 2018
 High-Throughput Sequencing Course Multiple Testing Biostatistics and Bioinformatics Summer 2018 Introduction You have previously considered the significance of a single gene Introduction You have previously
Chapter 1 Statistical Inference
 Chapter 1 Statistical Inference causal inference To infer causality, you need a randomized experiment (or a huge observational study and lots of outside information). inference to populations Generalizations
REPRODUCIBLE ANALYSIS OF HIGH-THROUGHPUT EXPERIMENTS
 REPRODUCIBLE ANALYSIS OF HIGH-THROUGHPUT EXPERIMENTS Ying Liu Department of Biostatistics, Columbia University Summer Intern at Research and CMC Biostats, Sanofi, Boston August 26, 2015 OUTLINE 1 Introduction
A Sequential Bayesian Approach with Applications to Circadian Rhythm Microarray Gene Expression Data
 A Sequential Bayesian Approach with Applications to Circadian Rhythm Microarray Gene Expression Data Faming Liang, Chuanhai Liu, and Naisyin Wang Texas A&M University Multiple Hypothesis Testing Introduction
Optimal design of microarray experiments
 University of Groningen e.c.wit@rug.nl http://www.math.rug.nl/ ernst 7 June 2011 What is a cdna Microarray Experiment? GREEN (Cy3) Cancer Tissue mrna Mix tissues in equal amounts G G G R R R R R G R G
Dr. Junchao Xia Center of Biophysics and Computational Biology. Fall /8/2016 1/38
 BIO5312 Biostatistics Lecture 11: Multisample Hypothesis Testing II Dr. Junchao Xia Center of Biophysics and Computational Biology Fall 2016 11/8/2016 1/38 Outline In this lecture, we will continue to
Impact of serial correlation structures on random effect misspecification with the linear mixed model.
 Impact of serial correlation structures on random effect misspecification with the linear mixed model. Brandon LeBeau University of Iowa file:///c:/users/bleb/onedrive%20 %20University%20of%20Iowa%201/JournalArticlesInProgress/Diss/Study2/Pres/pres.html#(2)
Multiple Testing. Hoang Tran. Department of Statistics, Florida State University
 Multiple Testing Hoang Tran Department of Statistics, Florida State University Large-Scale Testing Examples: Microarray data: testing differences in gene expression between two traits/conditions Microbiome
Multiple testing: Intro & FWER 1
 Multiple testing: Intro & FWER 1 Mark van de Wiel mark.vdwiel@vumc.nl Dep of Epidemiology & Biostatistics,VUmc, Amsterdam Dep of Mathematics, VU 1 Some slides courtesy of Jelle Goeman 1 Practical notes
Unit 12: Analysis of Single Factor Experiments
 Unit 12: Analysis of Single Factor Experiments Statistics 571: Statistical Methods Ramón V. León 7/16/2004 Unit 12 - Stat 571 - Ramón V. León 1 Introduction Chapter 8: How to compare two treatments. Chapter
g A n(a, g) n(a, ḡ) = n(a) n(a, g) n(a) B n(b, g) n(a, ḡ) = n(b) n(b, g) n(b) g A,B A, B 2 RNA-seq (D) RNA mrna [3] RNA 2. 2 NGS 2 A, B NGS n(
![g A n(a, g) n(a, ḡ) = n(a) n(a, g) n(a) B n(b, g) n(a, ḡ) = n(b) n(b, g) n(b) g A,B A, B 2 RNA-seq (D) RNA mrna [3] RNA 2. 2 NGS 2 A, B NGS n(](/thumbs/77/74495778.jpg "g A n(a, g) n(a, ḡ) = n(a) n(a, g) n(a) B n(b, g) n(a, ḡ) = n(b) n(b, g) n(b) g A,B A, B 2 RNA-seq (D) RNA mrna [3] RNA 2. 2 NGS 2 A, B NGS n(") ,a) RNA-seq RNA-seq Cuffdiff, edger, DESeq Sese Jun,a) Abstract: Frequently used biological experiment technique for observing comprehensive gene expression has been changed from microarray using cdna
,a) RNA-seq RNA-seq Cuffdiff, edger, DESeq Sese Jun,a) Abstract: Frequently used biological experiment technique for observing comprehensive gene expression has been changed from microarray using cdna
Bayesian ANalysis of Variance for Microarray Analysis
 Bayesian ANalysis of Variance for Microarray Analysis c These notes are copyrighted by the authors. Unauthorized use is not permitted. Bayesian ANalysis of Variance p.1/19 Normalization Nuisance effects,
Statistical inference (estimation, hypothesis tests, confidence intervals) Oct 2018
 Oct 2018") Statistical inference (estimation, hypothesis tests, confidence intervals) Oct 2018 Sampling A trait is measured on each member of a population. f(y) = propn of individuals in the popn with measurement
Statistical inference (estimation, hypothesis tests, confidence intervals) Oct 2018 Sampling A trait is measured on each member of a population. f(y) = propn of individuals in the popn with measurement
Zhiguang Huo 1, Chi Song 2, George Tseng 3. July 30, 2018
 Bayesian latent hierarchical model for transcriptomic meta-analysis to detect biomarkers with clustered meta-patterns of differential expression signals BayesMP Zhiguang Huo 1, Chi Song 2, George Tseng
Introduc)on to RNA- Seq Data Analysis. Dr. Benilton S Carvalho Department of Medical Gene)cs Faculty of Medical Sciences State University of Campinas
on to RNA- Seq Data Analysis. Dr. Benilton S Carvalho Department of Medical Gene)cs Faculty of Medical Sciences State University of Campinas") Introduc)on to RNA- Seq Data Analysis Dr. Benilton S Carvalho Department of Medical Gene)cs Faculty of Medical Sciences State University of Campinas Material: hep://)ny.cc/rnaseq Slides: hep://)ny.cc/slidesrnaseq
Introduc)on to RNA- Seq Data Analysis Dr. Benilton S Carvalho Department of Medical Gene)cs Faculty of Medical Sciences State University of Campinas Material: hep://)ny.cc/rnaseq Slides: hep://)ny.cc/slidesrnaseq
Regression Model In The Analysis Of Micro Array Data-Gene Expression Detection
 Jamal Fathima.J.I 1 and P.Venkatesan 1. Research Scholar -Department of statistics National Institute For Research In Tuberculosis, Indian Council For Medical Research,Chennai,India,.Department of statistics
Chapter 4: Randomized Blocks and Latin Squares
 Chapter 4: Randomized Blocks and Latin Squares 1 Design of Engineering Experiments The Blocking Principle Blocking and nuisance factors The randomized complete block design or the RCBD Extension of the
Exploratory statistical analysis of multi-species time course gene expression
 Exploratory statistical analysis of multi-species time course gene expression data Eng, Kevin H. University of Wisconsin, Department of Statistics 1300 University Avenue, Madison, WI 53706, USA. E-mail:
Multiple QTL mapping
 Multiple QTL mapping Karl W Broman Department of Biostatistics Johns Hopkins University www.biostat.jhsph.edu/~kbroman [ Teaching Miscellaneous lectures] 1 Why? Reduce residual variation = increased power
Experimental Design. Experimental design. Outline. Choice of platform Array design. Target samples
 Experimental Design Credit for some of today s materials: Jean Yang, Terry Speed, and Christina Kendziorski Experimental design Choice of platform rray design Creation of probes Location on the array Controls
Probabilistic Inference for Multiple Testing
 This is the title page! This is the title page! Probabilistic Inference for Multiple Testing Chuanhai Liu and Jun Xie Department of Statistics, Purdue University, West Lafayette, IN 47907. E-mail: chuanhai,
Limma = linear models for microarray data. Linear models and Limma. Expression measures. Questions of Interest. y ga = log 2 (R/G) y ga =
 y ga =") Linear models and Limma Københavns Universitet, 19 August 2009 Mark D. Robinson Bioinformatics, Walter+Eliza Hall Institute Epigenetics Laboratory, Garvan Institute (with many slides taken from Gordon
Linear models and Limma Københavns Universitet, 19 August 2009 Mark D. Robinson Bioinformatics, Walter+Eliza Hall Institute Epigenetics Laboratory, Garvan Institute (with many slides taken from Gordon
Low-Level Analysis of High- Density Oligonucleotide Microarray Data
 Low-Level Analysis of High- Density Oligonucleotide Microarray Data Ben Bolstad http://www.stat.berkeley.edu/~bolstad Biostatistics, University of California, Berkeley UC Berkeley Feb 23, 2004 Outline
Lecture 16: Small Sample Size Problems (Covariance Estimation) Many thanks to Carlos Thomaz who authored the original version of these slides
 Many thanks to Carlos Thomaz who authored the original version of these slides") Lecture 16: Small Sample Size Problems (Covariance Estimation) Many thanks to Carlos Thomaz who authored the original version of these slides Intelligent Data Analysis and Probabilistic Inference Lecture
Lecture 16: Small Sample Size Problems (Covariance Estimation) Many thanks to Carlos Thomaz who authored the original version of these slides Intelligent Data Analysis and Probabilistic Inference Lecture
Normalization and differential analysis of RNA-seq data
 Normalization and differential analysis of RNA-seq data Nathalie Villa-Vialaneix INRA, Toulouse, MIAT (Mathématiques et Informatique Appliquées de Toulouse) nathalie.villa@toulouse.inra.fr http://www.nathalievilla.org
ABSSeq: a new RNA-Seq analysis method based on modelling absolute expression differences
 ABSSeq: a new RNA-Seq analysis method based on modelling absolute expression differences Wentao Yang October 30, 2018 1 Introduction This vignette is intended to give a brief introduction of the ABSSeq
Parametric Empirical Bayes Methods for Microarrays
 Parametric Empirical Bayes Methods for Microarrays Ming Yuan, Deepayan Sarkar, Michael Newton and Christina Kendziorski April 30, 2018 Contents 1 Introduction 1 2 General Model Structure: Two Conditions
Confidence Intervals, Testing and ANOVA Summary
 Confidence Intervals, Testing and ANOVA Summary 1 One Sample Tests 1.1 One Sample z test: Mean (σ known) Let X 1,, X n a r.s. from N(µ, σ) or n > 30. Let The test statistic is H 0 : µ = µ 0. z = x µ 0
Tools and topics for microarray analysis
 Tools and topics for microarray analysis USSES Conference, Blowing Rock, North Carolina, June, 2005 Jason A. Osborne, osborne@stat.ncsu.edu Department of Statistics, North Carolina State University 1 Outline
Sta$s$cs for Genomics ( )
") Sta$s$cs for Genomics (140.688) Instructor: Jeff Leek Slide Credits: Rafael Irizarry, John Storey No announcements today. Hypothesis testing Once you have a given score for each gene, how do you decide
Sta$s$cs for Genomics (140.688) Instructor: Jeff Leek Slide Credits: Rafael Irizarry, John Storey No announcements today. Hypothesis testing Once you have a given score for each gene, how do you decide
Single gene analysis of differential expression. Giorgio Valentini
 Single gene analysis of differential expression Giorgio Valentini valenti@disi.unige.it Comparing two conditions Each condition may be represented by one or more RNA samples. Using cdna microarrays, samples
Fall 2017 STAT 532 Homework Peter Hoff. 1. Let P be a probability measure on a collection of sets A.
 1. Let P be a probability measure on a collection of sets A. (a) For each n N, let H n be a set in A such that H n H n+1. Show that P (H n ) monotonically converges to P ( k=1 H k) as n. (b) For each n
Biostatistics 533 Classical Theory of Linear Models Spring 2007 Final Exam. Please choose ONE of the following options.
 1 Biostatistics 533 Classical Theory of Linear Models Spring 2007 Final Exam Name: Problems do not have equal value and some problems will take more time than others. Spend your time wisely. You do not
Generalized Linear Models (1/29/13)
") STA613/CBB540: Statistical methods in computational biology Generalized Linear Models (1/29/13) Lecturer: Barbara Engelhardt Scribe: Yangxiaolu Cao When processing discrete data, two commonly used probability
STA613/CBB540: Statistical methods in computational biology Generalized Linear Models (1/29/13) Lecturer: Barbara Engelhardt Scribe: Yangxiaolu Cao When processing discrete data, two commonly used probability
Lecture 9. ANOVA: Random-effects model, sample size
 Lecture 9. ANOVA: Random-effects model, sample size Jesper Rydén Matematiska institutionen, Uppsala universitet jesper@math.uu.se Regressions and Analysis of Variance fall 2015 Fixed or random? Is it reasonable
STAT 5200 Handout #7a Contrasts & Post hoc Means Comparisons (Ch. 4-5)
") STAT 5200 Handout #7a Contrasts & Post hoc Means Comparisons Ch. 4-5) Recall CRD means and effects models: Y ij = µ i + ϵ ij = µ + α i + ϵ ij i = 1,..., g ; j = 1,..., n ; ϵ ij s iid N0, σ 2 ) If we reject
STAT 5200 Handout #7a Contrasts & Post hoc Means Comparisons Ch. 4-5) Recall CRD means and effects models: Y ij = µ i + ϵ ij = µ + α i + ϵ ij i = 1,..., g ; j = 1,..., n ; ϵ ij s iid N0, σ 2 ) If we reject
MULTIVARIATE ANALYSIS OF VARIANCE
 MULTIVARIATE ANALYSIS OF VARIANCE RAJENDER PARSAD AND L.M. BHAR Indian Agricultural Statistics Research Institute Library Avenue, New Delhi - 0 0 lmb@iasri.res.in. Introduction In many agricultural experiments,
Exam: high-dimensional data analysis February 28, 2014
 Exam: high-dimensional data analysis February 28, 2014 Instructions: - Write clearly. Scribbles will not be deciphered. - Answer each main question (not the subquestions) on a separate piece of paper.
Lecture 1. Overview and Basic Principles
 Lecture 1 Overview and Basic Principles Montgomery: Chapter 1 Fall, 2013 Page 1 Fall, 2013 Page 2 Why Using Statistical Methods for Design and Analysis of Experiments 1 Experimental error 2 Confusion of
Dispersion modeling for RNAseq differential analysis
 Dispersion modeling for RNAseq differential analysis E. Bonafede 1, F. Picard 2, S. Robin 3, C. Viroli 1 ( 1 ) univ. Bologna, ( 3 ) CNRS/univ. Lyon I, ( 3 ) INRA/AgroParisTech, Paris IBC, Victoria, July
Lecture 3: Mixture Models for Microbiome data. Lecture 3: Mixture Models for Microbiome data
 Lecture 3: Mixture Models for Microbiome data 1 Lecture 3: Mixture Models for Microbiome data Outline: - Mixture Models (Negative Binomial) - DESeq2 / Don t Rarefy. Ever. 2 Hypothesis Tests - reminder
Lecture 9 Multi-Trait Models, Binary and Count Traits
 Lecture 9 Multi-Trait Models, Binary and Count Traits Guilherme J. M. Rosa University of Wisconsin-Madison Mixed Models in Quantitative Genetics SISG, Seattle 18 0 September 018 OUTLINE Multiple-trait
Class 4: Classification. Quaid Morris February 11 th, 2011 ML4Bio
 Class 4: Classification Quaid Morris February 11 th, 211 ML4Bio Overview Basic concepts in classification: overfitting, cross-validation, evaluation. Linear Discriminant Analysis and Quadratic Discriminant
22s:152 Applied Linear Regression. Chapter 8: 1-Way Analysis of Variance (ANOVA) 2-Way Analysis of Variance (ANOVA)
 2-Way Analysis of Variance (ANOVA)") 22s:152 Applied Linear Regression Chapter 8: 1-Way Analysis of Variance (ANOVA) 2-Way Analysis of Variance (ANOVA) We now consider an analysis with only categorical predictors (i.e. all predictors are
22s:152 Applied Linear Regression Chapter 8: 1-Way Analysis of Variance (ANOVA) 2-Way Analysis of Variance (ANOVA) We now consider an analysis with only categorical predictors (i.e. all predictors are
Technologie w skali genomowej 2/ Algorytmiczne i statystyczne aspekty sekwencjonowania DNA
 Technologie w skali genomowej 2/ Algorytmiczne i statystyczne aspekty sekwencjonowania DNA Expression analysis for RNA-seq data Ewa Szczurek Instytut Informatyki Uniwersytet Warszawski 1/35 The problem
Linear Models and Empirical Bayes Methods for Microarrays
 Methods for Microarrays by Gordon Smyth Alex Sánchez and Carme Ruíz de Villa Department d Estadística Universitat de Barcelona 16-12-2004 Outline 1 An introductory example Paper overview 2 3 Lönnsted and
High-throughput Testing
 High-throughput Testing Noah Simon and Richard Simon July 2016 1 / 29 Testing vs Prediction On each of n patients measure y i - single binary outcome (eg. progression after a year, PCR) x i - p-vector
Lecture: Mixture Models for Microbiome data
 Lecture: Mixture Models for Microbiome data Lecture 3: Mixture Models for Microbiome data Outline: - - Sequencing thought experiment Mixture Models (tangent) - (esp. Negative Binomial) - Differential abundance
False discovery rate and related concepts in multiple comparisons problems, with applications to microarray data
 False discovery rate and related concepts in multiple comparisons problems, with applications to microarray data Ståle Nygård Trial Lecture Dec 19, 2008 1 / 35 Lecture outline Motivation for not using
Statistical testing. Samantha Kleinberg. October 20, 2009
 October 20, 2009 Intro to significance testing Significance testing and bioinformatics Gene expression: Frequently have microarray data for some group of subjects with/without the disease. Want to find
STAT 525 Fall Final exam. Tuesday December 14, 2010
 STAT 525 Fall 2010 Final exam Tuesday December 14, 2010 Time: 2 hours Name (please print): Show all your work and calculations. Partial credit will be given for work that is partially correct. Points will
Model Accuracy Measures
 Model Accuracy Measures Master in Bioinformatics UPF 2017-2018 Eduardo Eyras Computational Genomics Pompeu Fabra University - ICREA Barcelona, Spain Variables What we can measure (attributes) Hypotheses
Multiple Change-Point Detection and Analysis of Chromosome Copy Number Variations
 Multiple Change-Point Detection and Analysis of Chromosome Copy Number Variations Yale School of Public Health Joint work with Ning Hao, Yue S. Niu presented @Tsinghua University Outline 1 The Problem
Two-Color Microarray Experimental Design Notation. Simple Examples of Analysis for a Single Gene. Microarray Experimental Design Notation
 Simple Examples of Analysis for a Single Gene wo-olor Microarray Experimental Design Notation /3/0 opyright 0 Dan Nettleton Microarray Experimental Design Notation Microarray Experimental Design Notation
Review of Statistics 101
 Review of Statistics 101 We review some important themes from the course 1. Introduction Statistics- Set of methods for collecting/analyzing data (the art and science of learning from data). Provides methods
Resampling-based Multiple Testing with Applications to Microarray Data Analysis
 Resampling-based Multiple Testing with Applications to Microarray Data Analysis DISSERTATION Presented in Partial Fulfillment of the Requirements for the Degree Doctor of Philosophy in the Graduate School