Introduc)on to RNA- Seq Data Analysis. Dr. Benilton S Carvalho Department of Medical Gene)cs Faculty of Medical Sciences State University of Campinas
|
|
|
- Ralph Porter
- 5 years ago
- Views:
Transcription
1 Introduc)on to RNA- Seq Data Analysis Dr. Benilton S Carvalho Department of Medical Gene)cs Faculty of Medical Sciences State University of Campinas
2 Material: hep://)ny.cc/rnaseq Slides: hep://)ny.cc/slidesrnaseq


3 Tools of Choice R and BioConductor: Both created by Robert Gentleman; Open- source tools; Easy to prototype; Communicate with C/C++/Fortran;
4 About R Cross- plataform; Data analysis and visualiza)on; Fast deployment to users; Able to interact with C/C++/Fortran; Thousands of packages: Descrip)ve analyses; Clustering and classifica)on; Regression Models and Trees; Visualiza)on; Reproducible research; Etc;
5 About Bioconductor SoSware infra- structure that uses R; Designed for biological data; Hundreds of packages: Mass spectrometry; Microarrays; Next Genera)on Sequencing (NGS); Ac)ve community: Heavily used by industry; Releases in April and October; CuXng- edge methods.


6 Illumina Products MiSeq HiSeq
7 Illumina Products MiSeq 2 x 75bp ~ 24h : 3.8Gb 2 x 300bp ~ 65h : 15Gb HiSeq 1 x 36bp ~ 29h : 144Gb 2 x 50bp ~ 60h : 400Gb 2 x 100bp ~ 120h : 800Gb 2 x 150bp ~ 144h : 1Tb
8 Illumina HiSeq X Ten Considering the Human 30x; 320 Genomes per week; 1500 Genomes per month; Genomes per year; Note: HiSeq 2500 ~ 10 Genomes per week
9 How does RNA- Seq work? Pepke et. al. (2009)

10 How does RNA- Seq work?

")


11 Pipeline for Analysis Raw Data (ShortRead) Quality Assessment (Rqc) to be published Mapping (Rsubread/gmapr) Aligned Reads Non- aligned Reads Downstream Analysis goseq Sta)s)cal Modelling DESeq2 edger Count Table Rsubread GenomicFeatures
12 Rela)vely Large Files In our pilot experiment (per sample): FastQ: 20GB per strand; BAM: 8GB; Counts: 250KB; Temporary Files: 2 x 20GB per strand; Total: ~ 130GB! The example above: RNA- Seq on Rats; For Human samples, when sequencing DNA, files are in average 10x bigger;
13 RAW DATA
14 Inside a FASTQ File Instrument Run ID Flowcell ID Lane Tile number X in )le Y in )le Mate Fail filter Control bits Index seq

15 The Mistery of the Quality Scores
16 The Mistery of Quality Scores Base = 31 PHRED = 31-10*log10(1- P) = 31 P =
17 QUALITY ASSESSMENT
18 FastQC We have experience with FastQC, but we are developing our own tool; FastQC is Java- based; Includes the op)on of poin)ng and clicking; hep:// projects/fastqc/help/3%20analysis %20Modules/


19 FastQC Per Base Seq Quality Good Poor


20 FastQC Quality Score over All Seqs Good Poor


21 FastQC Sequence Content Good Poor


22 FastQC Sequence Duplica)on Good Poor
23 MAPPING
24 Principles of Mapping Obtain the reference (genome or transcriptome) for the organism of interest: Mapping to the genome: Allows for iden)fica)on of novel genes/isoforms Must allow for gaps (really hard) Mapping to the transcriptome: Fast(er) No need for spliced alignments Can t find novel genes/isoforms
25 Principles of Mapping

26 Result of Mapping: SAM/BAM
27 COUNT TABLE
28 The BAM isn t the final file BAM files give the loca)on of mapped reads; But, per individual, how many reads should be considered as from any par)cular gene? The count table represents this; It can be obtained through GenomicAlignments, HTSeq, Rsubread and EasyRNASeq;

29 Count- table Example
30 STATISTICAL MODELING


31 What is a model?
32 p Different Transcripts, Rates and Probabili)es λp λp p λ λ λp Number of fragments: Poisson Distribu)on p λ
on p λ")
33 p Different Transcripts, Rates and Probabili)es λp λp p λ λ λp Number of fragments: Poisson Distribu)on p λ
34 X ~ Poisson(λp) Mean: λp Variance: λp Characteris)cs of a Poisson Distribu)on P (X = k) = ( p)k e k! λ p p p λ p λ

al) effect for")
35 Analysis method: GLM Noise Part Expected count of region i in sample j Determinis)c Part Library size effect Design matrix (Differen)al) effect for region i
36 Need to account for extra variability technical rep consistent with Poison biol. rep not consistent with Poison Based on the data of Nagalakshmi et al. Science 2008; slide adapted from Huber;
37 Characteris)cs of a Nega)ve Binomial (NB) Distribu)on X λp ~ Poisson(λp) λp ~ Gamma(a, b) Mean: μ Variance: μ/ν 0 < ν < 1 λ Allow these to change!!! p p λ Current methods for DE use NB model! p λ
38 Sequencing Ra)onale Biological Replicates For subject j, on transcript i: Y ij ij P ( ij ) Different subjects have different rates, which we can model through: ij (, ) This hierarchy changes the distribu)on of Y: Y ij NB, 1 1+
on α")
al) effect")
39 An addi)onal source of varia)on Smooth dispersion- mean rela)on α Determinis)c Part Library size effect Design matrix (Differen)al) effect for region i
40 Summary of the Poisson and Nega)ve Binomial Models Poisson(λ): Mean: λ Variance: λ Nega)ve Binomial (α, 1/(1+β)): Mean: α/β Variance: α(1+β)/β 2 = α/β + α/β 2 = mean + 1/α * mean 2 Shot noise Biological noise
41 Example: DE / DEU
ve Exon Usage / DEXSeq Change for treatment 0 i + il E x E j + ijx T T j + ijl ET x E l x T j Frac)on of reads falling onto exon l in control Change to frac)on of reads for exon l due to")
42 Expression in control Summary of Models Treatment (x j ) as Covariate N ij NB(s j µ ij, (µ ij )) log µ ij 0 i + T i x T j N ijl NB(s j µ ijl, (µ ijl )) log µ ijl Gene Expression / DESeq Alterna)ve Exon Usage / DEXSeq Change for treatment 0 i + il E x E j + ijx T T j + ijl ET x E l x T j Frac)on of reads falling onto exon l in control Change to frac)on of reads for exon l due to treatment
43 Variance Shrinkage
44 Downstream Effect of Shrinkage
45 Remember the variance effect! Variance changes as mean changes This seriously affects visualiza)on; It also interferes with comparisons; One needs to adjust variance before performing clustering, visualiza)on, PCA; DESeq2 has a regularized log- transforma)on method designed for that.
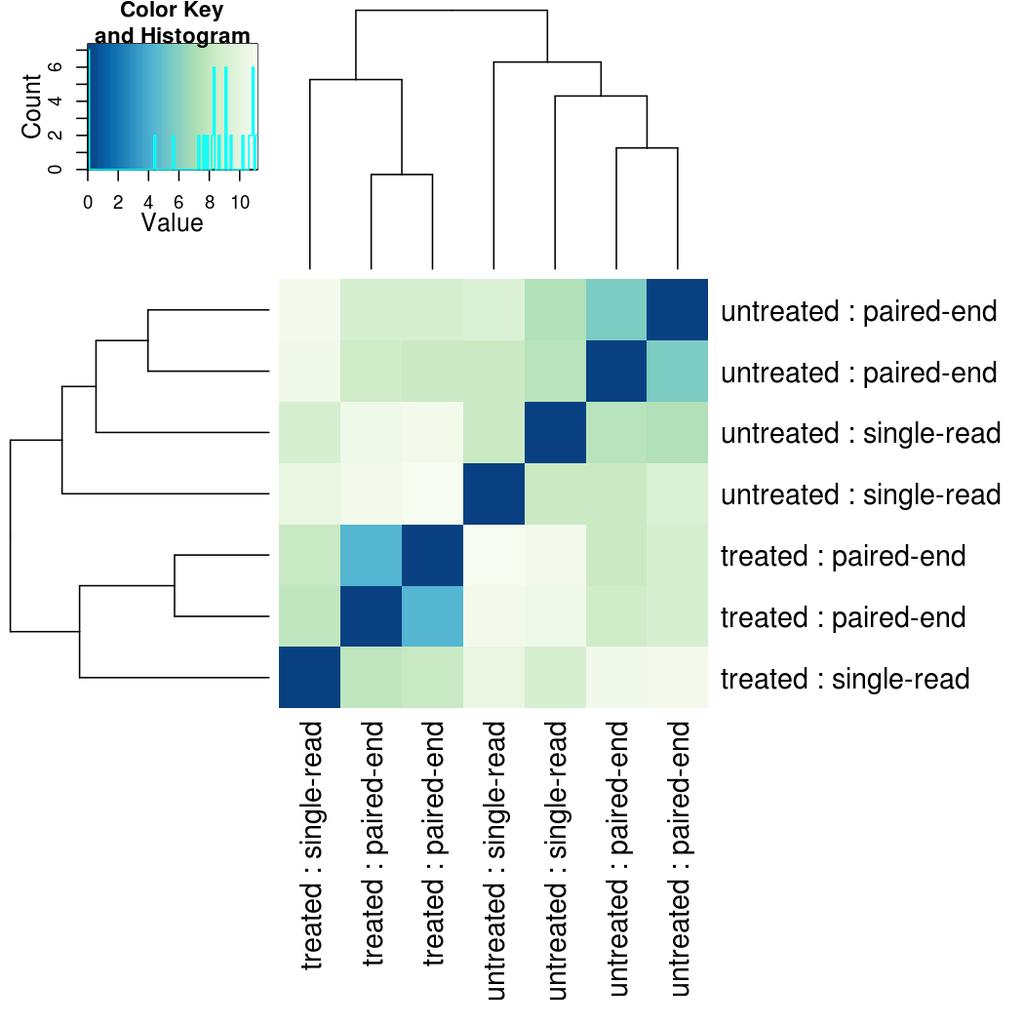
46 Clustering
47 PCA
48 The Truth Sta)s)cal Models There is no correct model ; Models are approxima)ons of the truth; There is a useful model ; Understand the mechanisms of the system for beeer choices of model alterna)ves;
49 THINGS THAT STATISTICIAN SAYS
50 The Experiment A procedure used to answer the ques)ons; Comprised of mul)ple items: Popula)on; Sample; Hypotheses; Test sta)s)c; Rejec)on criteria;
51 Popula)on Superset of subjects of interest; Ideally, every subject in the popula)on is surveyed; Issues with the census approach ;
52 Sample Select some subjects from the popula)on; We refer to this subset as sample; Subject in a sample can be called replicate; Replicate: technical vs. biological;
53 Hypotheses Sets that define the underlying truth ; Null Hypothesis (H0): default situa)on. Cannot be proven; Reject (in favor of H1) vs. fail to reject; Alterna)ve Hypothesis (H1): alterna)ve (duh!) Complements H0 on the parametric space; Assists on the defini)on of the rejec)on criteria.
54 Examples of Hypotheses Comparing expression: Tumor vs. Normal: Expressions on tumor and normal are the same; Expressions on tumor and normal are different; H 0 : µ T = µ N H a 1 : µ T >µ N H b 1 : µ T <µ N H 0 : µ T = µ N H 1 : µ T 6= µ N
55 Test Sta)s)c Summary of the data; Built under H0 ; Independent of unknown parameters; Known distribu)ons; Compa)bility between data and H0;
56 Test Sta)s)c What the sta)s)cian see X T,i N(µ T, 2 ) X T N(µ T, 2 /n) X N,i N(µ N, 2 ) X N N(µ N, 2 /n) If H 0 : µ T = µ N Then X XN T Z = p 2 2 /n N(0, 1)
57 Rejec)on Criteria Func)on of three factors: Test sta)s)c; Hypotheses; Type I Error (False Posi)ve), α; Determines thresholds used to reject H0: Defines what is extreme for the experiment;
58 Rejec)on Criteria H 0 : µ T = µ N H 1 : µ T 6= µ N Density X XN T Z = p 2 2 /n N(0, 1) Test Statistic


59 From Rejec)on Criteria to P- value! p- value H 0 : µ T = µ N H 1 : µ T 6= µ N Density X XN T Z = p 2 2 /n N(0, 1) Test Statistic
60 What if we look at mul)ple p- values at a )me? On a Gene Expression study, we test osen 20K genes for differen)al expression; Each test leads to one p- value; Should we trust the p- values in order to make decisions?
61 What if we look at mul)ple p- values at a )me? Can we simulate this? Choose an α-level; Generate two popula)ons with the same pars; Run t- test; Is the result smaller than α? Yes: reject; No: don t reject;
62 Mul)ple Tes)ng We are doing high- throughput experiments; Comparing thousands of units simultaneously; At this scale, we can observe several instances of rare events just by chance: Event A: 1 in 1000 chance of happening; Event B: 999 in 1000 chance of happening; And the experiment is tried 20,000 )mes; We expect 20 occurrences of Event A to be observed, although Event B is much more likely;
63 Mul)ple Tes)ng Similar scenario, for example, with DE; Most genes are not differen)ally expressed; High- throughput experiments; Differen)al expression is tested for 20K genes; Need to protect against false posi)ves; Sugges)on: use non- specific filtering; use adjusted p- values;

64 Type I and Type II Errors
65 Non- Specific Filtering The majority of the genes are not differen)ally expressed this is the basic hypothesis for normaliza)on; If we reduce the number of genes to be tested, the chance of making a wrong decision is reduced; Non- Specific filtering refers to removing genes that are clearly not DE without looking at the phenotypic informa)on of the samples;


66 Using Variance as a Filter DifferenHally Expressed Not- DifferenHally Expressed
67 FDR Benjamini Hochberg (BH) Sort the p- values by magnitude; Get the adjusted values by j = max j : p j apple j m
68 ADDITIONAL STUFF TO REMEMBER!
69 Useful Facts The Law of the Large Numbers guarantees that the larger the sample size is, the closer the sample average is to the actual mean; Normality assump)on isn t that important with large sample size; The Central Limit Theorem states that the average is asympto)cally normal;
70 Useful Facts The Z- score depends on the precise knowledge of the variance term: Z = X µ 0 p 2 /n N(0, 1) Es)ma)ng the variance changes the distribu)on of the test sta)s)c: T = X µ 0 pˆ2/n t n
71 Useful Facts The Student s t distribu)on is similar to the Normal distribu)on, but has heavier tails; Larger sample size, more d.f.; More d.f., closer to Normal;
72 DO I REALLY NEED A STATISTICIAN BEFORE I EVEN RUN MY EXPERIMENT?
73 Sample size is crucial The larger, the beeer; Ideal N = ($$ I have) / ($$ it costs) With differen)al expression, one can observe this more easily; RNASeqPower BioConductor package;
74 About Technology Is RNA- Seq really worth it when we consider: Cost, Strategies for analysis, and Technical requirements?
75 Can my experiment answer the ques)on of interest? Flow Cell 1 Flow Cell 2 Flow Cell 3 Flow Cell 4 Group A Group B Group C Group D
76 Differen)al Expression Across Groups Flow Cell Confounded With Group Flow Cell 1 Flow Cell 2 Flow Cell 3 Flow Cell 4 Group A Group B Group C Group D
77 Differen)al Expression Across Groups Randomize Samples wrt Flow Cell Flow Cell 1 Flow Cell 2 Flow Cell 3 Flow Cell 4
78 Differen)al Expression Across Groups Barcoding vs. Lane Effect Flow Cell 1 Flow Cell 2 Flow Cell 3 Flow Cell 4
DEXSeq paper discussion
 DEXSeq paper discussion L Collado-Torres December 10th, 2012 1 / 23 1 Background 2 DEXSeq paper 3 Results 2 / 23 Gene Expression 1 Background 1 Source: http://www.ncbi.nlm.nih.gov/projects/genome/probe/doc/applexpression.shtml
Comparative analysis of RNA- Seq data with DESeq2
 Comparative analysis of RNA- Seq data with DESeq2 Simon Anders EMBL Heidelberg Two applications of RNA- Seq Discovery Eind new transcripts Eind transcript boundaries Eind splice junctions Comparison Given
Statistical Models for sequencing data: from Experimental Design to Generalized Linear Models
 Best practices in the analysis of RNA-Seq and CHiP-Seq data 4 th -5 th May 2017 University of Cambridge, Cambridge, UK Statistical Models for sequencing data: from Experimental Design to Generalized Linear
Sta$s$cs for Genomics ( )
") Sta$s$cs for Genomics (140.688) Instructor: Jeff Leek Slide Credits: Rafael Irizarry, John Storey No announcements today. Hypothesis testing Once you have a given score for each gene, how do you decide
Sta$s$cs for Genomics (140.688) Instructor: Jeff Leek Slide Credits: Rafael Irizarry, John Storey No announcements today. Hypothesis testing Once you have a given score for each gene, how do you decide
Statistics for Differential Expression in Sequencing Studies. Naomi Altman
 Statistics for Differential Expression in Sequencing Studies Naomi Altman naomi@stat.psu.edu Outline Preliminaries what you need to do before the DE analysis Stat Background what you need to know to understand
Analyses biostatistiques de données RNA-seq
 Analyses biostatistiques de données RNA-seq Ignacio Gonzàlez, Annick Moisan & Nathalie Villa-Vialaneix prenom.nom@toulouse.inra.fr Toulouse, 18/19 mai 2017 IG, AM, NV 2 (INRA) Biostatistique RNA-seq Toulouse,
Sta$s$cal Significance Tes$ng In Theory and In Prac$ce
 Sta$s$cal Significance Tes$ng In Theory and In Prac$ce Ben Cartere8e University of Delaware h8p://ir.cis.udel.edu/ictir13tutorial Hypotheses and Experiments Hypothesis: Using an SVM for classifica$on will
Technologie w skali genomowej 2/ Algorytmiczne i statystyczne aspekty sekwencjonowania DNA
 Technologie w skali genomowej 2/ Algorytmiczne i statystyczne aspekty sekwencjonowania DNA Expression analysis for RNA-seq data Ewa Szczurek Instytut Informatyki Uniwersytet Warszawski 1/35 The problem
Class Notes. Examining Repeated Measures Data on Individuals
 Ronald Heck Week 12: Class Notes 1 Class Notes Examining Repeated Measures Data on Individuals Generalized linear mixed models (GLMM) also provide a means of incorporang longitudinal designs with categorical
Differential expression analysis for sequencing count data. Simon Anders
 Differential expression analysis for sequencing count data Simon Anders RNA-Seq Count data in HTS RNA-Seq Tag-Seq Gene 13CDNA73 A2BP1 A2M A4GALT AAAS AACS AADACL1 [...] ChIP-Seq Bar-Seq... GliNS1 4 19
Data Processing Techniques
 Universitas Gadjah Mada Department of Civil and Environmental Engineering Master in Engineering in Natural Disaster Management Data Processing Techniques Hypothesis Tes,ng 1 Hypothesis Testing Mathema,cal
Two sample Test. Paired Data : Δ = 0. Lecture 3: Comparison of Means. d s d where is the sample average of the differences and is the
 Gene$cs 300: Sta$s$cal Analysis of Biological Data Lecture 3: Comparison of Means Two sample t test Analysis of variance Type I and Type II errors Power More R commands September 23, 2010 Two sample Test
Some Review and Hypothesis Tes4ng. Friday, March 15, 13
 Some Review and Hypothesis Tes4ng Outline Discussing the homework ques4ons from Joey and Phoebe Review of Sta4s4cal Inference Proper4es of OLS under the normality assump4on Confidence Intervals, T test,
RNASeq Differential Expression
 12/06/2014 RNASeq Differential Expression Le Corguillé v1.01 1 Introduction RNASeq No previous genomic sequence information is needed In RNA-seq the expression signal of a transcript is limited by the
Statistical tests for differential expression in count data (1)
") Statistical tests for differential expression in count data (1) NBIC Advanced RNA-seq course 25-26 August 2011 Academic Medical Center, Amsterdam The analysis of a microarray experiment Pre-process image
Statistical tests for differential expression in count data (1) NBIC Advanced RNA-seq course 25-26 August 2011 Academic Medical Center, Amsterdam The analysis of a microarray experiment Pre-process image
Mixtures of Negative Binomial distributions for modelling overdispersion in RNA-Seq data
 Mixtures of Negative Binomial distributions for modelling overdispersion in RNA-Seq data Cinzia Viroli 1 joint with E. Bonafede 1, S. Robin 2 & F. Picard 3 1 Department of Statistical Sciences, University
g A n(a, g) n(a, ḡ) = n(a) n(a, g) n(a) B n(b, g) n(a, ḡ) = n(b) n(b, g) n(b) g A,B A, B 2 RNA-seq (D) RNA mrna [3] RNA 2. 2 NGS 2 A, B NGS n(
![g A n(a, g) n(a, ḡ) = n(a) n(a, g) n(a) B n(b, g) n(a, ḡ) = n(b) n(b, g) n(b) g A,B A, B 2 RNA-seq (D) RNA mrna [3] RNA 2. 2 NGS 2 A, B NGS n(](/thumbs/77/74495778.jpg "g A n(a, g) n(a, ḡ) = n(a) n(a, g) n(a) B n(b, g) n(a, ḡ) = n(b) n(b, g) n(b) g A,B A, B 2 RNA-seq (D) RNA mrna [3] RNA 2. 2 NGS 2 A, B NGS n(") ,a) RNA-seq RNA-seq Cuffdiff, edger, DESeq Sese Jun,a) Abstract: Frequently used biological experiment technique for observing comprehensive gene expression has been changed from microarray using cdna
,a) RNA-seq RNA-seq Cuffdiff, edger, DESeq Sese Jun,a) Abstract: Frequently used biological experiment technique for observing comprehensive gene expression has been changed from microarray using cdna
Short introduc,on to the
 OXFORD NEUROIMAGING PRIMERS Short introduc,on to the An General Introduction Linear Model to Neuroimaging for Neuroimaging Analysis Mark Jenkinson Mark Jenkinson Janine Michael Bijsterbosch Chappell Michael
CS 6140: Machine Learning Spring What We Learned Last Week 2/26/16
 Logis@cs CS 6140: Machine Learning Spring 2016 Instructor: Lu Wang College of Computer and Informa@on Science Northeastern University Webpage: www.ccs.neu.edu/home/luwang Email: luwang@ccs.neu.edu Sign
Our typical RNA quantification pipeline
 RNA-Seq primer Our typical RNA quantification pipeline Upload your sequence data (fastq) Align to the ribosome (Bow>e) Align remaining reads to genome (TopHat) or transcriptome (RSEM) Make report of quality
Normalization and differential analysis of RNA-seq data
 Normalization and differential analysis of RNA-seq data Nathalie Villa-Vialaneix INRA, Toulouse, MIAT (Mathématiques et Informatique Appliquées de Toulouse) nathalie.villa@toulouse.inra.fr http://www.nathalievilla.org
DEGseq: an R package for identifying differentially expressed genes from RNA-seq data
 DEGseq: an R package for identifying differentially expressed genes from RNA-seq data Likun Wang Zhixing Feng i Wang iaowo Wang * and uegong Zhang * MOE Key Laboratory of Bioinformatics and Bioinformatics
David M. Rocke Division of Biostatistics and Department of Biomedical Engineering University of California, Davis
 David M. Rocke Division of Biostatistics and Department of Biomedical Engineering University of California, Davis March 18, 2016 UVA Seminar RNA Seq 1 RNA Seq Gene expression is the transcription of the
Networks. Can (John) Bruce Keck Founda7on Biotechnology Lab Bioinforma7cs Resource
 Bruce Keck Founda7on Biotechnology Lab Bioinforma7cs Resource") Networks Can (John) Bruce Keck Founda7on Biotechnology Lab Bioinforma7cs Resource Networks in biology Protein-Protein Interaction Network of Yeast Transcriptional regulatory network of E.coli Experimental
Networks Can (John) Bruce Keck Founda7on Biotechnology Lab Bioinforma7cs Resource Networks in biology Protein-Protein Interaction Network of Yeast Transcriptional regulatory network of E.coli Experimental
Garvan Ins)tute Biosta)s)cal Workshop 16/7/2015. Tuan V. Nguyen. Garvan Ins)tute of Medical Research Sydney, Australia
tute Biosta)s)cal Workshop 16/7/2015. Tuan V. Nguyen. Garvan Ins)tute of Medical Research Sydney, Australia") Garvan Ins)tute Biosta)s)cal Workshop 16/7/2015 Tuan V. Nguyen Tuan V. Nguyen Garvan Ins)tute of Medical Research Sydney, Australia Analysis of variance Between- group and within- group varia)on explained
Garvan Ins)tute Biosta)s)cal Workshop 16/7/2015 Tuan V. Nguyen Tuan V. Nguyen Garvan Ins)tute of Medical Research Sydney, Australia Analysis of variance Between- group and within- group varia)on explained
Statistical testing. Samantha Kleinberg. October 20, 2009
 October 20, 2009 Intro to significance testing Significance testing and bioinformatics Gene expression: Frequently have microarray data for some group of subjects with/without the disease. Want to find
High-Throughput Sequencing Course
 High-Throughput Sequencing Course DESeq Model for RNA-Seq Biostatistics and Bioinformatics Summer 2017 Outline Review: Standard linear regression model (e.g., to model gene expression as function of an
Lecture: Mixture Models for Microbiome data
 Lecture: Mixture Models for Microbiome data Lecture 3: Mixture Models for Microbiome data Outline: - - Sequencing thought experiment Mixture Models (tangent) - (esp. Negative Binomial) - Differential abundance
REGRESSION AND CORRELATION ANALYSIS
 Problem 1 Problem 2 A group of 625 students has a mean age of 15.8 years with a standard devia>on of 0.6 years. The ages are normally distributed. How many students are younger than 16.2 years? REGRESSION
Linear Regression and Correla/on. Correla/on and Regression Analysis. Three Ques/ons 9/14/14. Chapter 13. Dr. Richard Jerz
 Linear Regression and Correla/on Chapter 13 Dr. Richard Jerz 1 Correla/on and Regression Analysis Correla/on Analysis is the study of the rela/onship between variables. It is also defined as group of techniques
Linear Regression and Correla/on
 Linear Regression and Correla/on Chapter 13 Dr. Richard Jerz 1 Correla/on and Regression Analysis Correla/on Analysis is the study of the rela/onship between variables. It is also defined as group of techniques
SPH 247 Statistical Analysis of Laboratory Data. April 28, 2015 SPH 247 Statistics for Laboratory Data 1
 SPH 247 Statistical Analysis of Laboratory Data April 28, 2015 SPH 247 Statistics for Laboratory Data 1 Outline RNA-Seq for differential expression analysis Statistical methods for RNA-Seq: Structure and
Differen'al Privacy with Bounded Priors: Reconciling U+lity and Privacy in Genome- Wide Associa+on Studies
 Differen'al Privacy with Bounded Priors: Reconciling U+lity and Privacy in Genome- Wide Associa+on Studies Florian Tramèr, Zhicong Huang, Erman Ayday, Jean- Pierre Hubaux ACM CCS 205 Denver, Colorado,
Lecture 3: Mixture Models for Microbiome data. Lecture 3: Mixture Models for Microbiome data
 Lecture 3: Mixture Models for Microbiome data 1 Lecture 3: Mixture Models for Microbiome data Outline: - Mixture Models (Negative Binomial) - DESeq2 / Don t Rarefy. Ever. 2 Hypothesis Tests - reminder
An Introduc+on to Sta+s+cs and Machine Learning for Quan+ta+ve Biology. Anirvan Sengupta Dept. of Physics and Astronomy Rutgers University
 An Introduc+on to Sta+s+cs and Machine Learning for Quan+ta+ve Biology Anirvan Sengupta Dept. of Physics and Astronomy Rutgers University Why Do We Care? Necessity in today s labs Principled approach:
Gene Regulatory Networks II Computa.onal Genomics Seyoung Kim
 Gene Regulatory Networks II 02-710 Computa.onal Genomics Seyoung Kim Goal: Discover Structure and Func;on of Complex systems in the Cell Identify the different regulators and their target genes that are
RNA-seq. Differential analysis
 RNA-seq Differential analysis DESeq2 DESeq2 http://bioconductor.org/packages/release/bioc/vignettes/deseq 2/inst/doc/DESeq2.html Input data Why un-normalized counts? As input, the DESeq2 package expects
COMP 562: Introduction to Machine Learning
 COMP 562: Introduction to Machine Learning Lecture 20 : Support Vector Machines, Kernels Mahmoud Mostapha 1 Department of Computer Science University of North Carolina at Chapel Hill mahmoudm@cs.unc.edu
Experimental Designs for Planning Efficient Accelerated Life Tests
 Experimental Designs for Planning Efficient Accelerated Life Tests Kangwon Seo and Rong Pan School of Compu@ng, Informa@cs, and Decision Systems Engineering Arizona State University ASTR 2015, Sep 9-11,
Graphical Models. Lecture 3: Local Condi6onal Probability Distribu6ons. Andrew McCallum
 Graphical Models Lecture 3: Local Condi6onal Probability Distribu6ons Andrew McCallum mccallum@cs.umass.edu Thanks to Noah Smith and Carlos Guestrin for some slide materials. 1 Condi6onal Probability Distribu6ons
Summary and discussion of: Controlling the False Discovery Rate: A Practical and Powerful Approach to Multiple Testing
 Summary and discussion of: Controlling the False Discovery Rate: A Practical and Powerful Approach to Multiple Testing Statistics Journal Club, 36-825 Beau Dabbs and Philipp Burckhardt 9-19-2014 1 Paper
Computer Vision. Pa0ern Recogni4on Concepts Part I. Luis F. Teixeira MAP- i 2012/13
 Computer Vision Pa0ern Recogni4on Concepts Part I Luis F. Teixeira MAP- i 2012/13 What is it? Pa0ern Recogni4on Many defini4ons in the literature The assignment of a physical object or event to one of
Correla'on. Keegan Korthauer Department of Sta's'cs UW Madison
 Correla'on Keegan Korthauer Department of Sta's'cs UW Madison 1 Rela'onship Between Two Con'nuous Variables When we have measured two con$nuous random variables for each item in a sample, we can study
CS 6140: Machine Learning Spring What We Learned Last Week. Survey 2/26/16. VS. Model
 Logis@cs CS 6140: Machine Learning Spring 2016 Instructor: Lu Wang College of Computer and Informa@on Science Northeastern University Webpage: www.ccs.neu.edu/home/luwang Email: luwang@ccs.neu.edu Assignment
Statistical Applications in Genetics and Molecular Biology
 Statistical Applications in Genetics and Molecular Biology Volume 5, Issue 1 2006 Article 28 A Two-Step Multiple Comparison Procedure for a Large Number of Tests and Multiple Treatments Hongmei Jiang Rebecca
Machine Learning and Data Mining. Bayes Classifiers. Prof. Alexander Ihler
 + Machine Learning and Data Mining Bayes Classifiers Prof. Alexander Ihler A basic classifier Training data D={x (i),y (i) }, Classifier f(x ; D) Discrete feature vector x f(x ; D) is a con@ngency table
Classifica(on and predic(on omics style. Dr Nicola Armstrong Mathema(cs and Sta(s(cs Murdoch University
 Classifica(on and predic(on omics style Dr Nicola Armstrong Mathema(cs and Sta(s(cs Murdoch University Classifica(on Learning Set Data with known classes Prediction Classification rule Data with unknown
CS 6140: Machine Learning Spring 2016
 CS 6140: Machine Learning Spring 2016 Instructor: Lu Wang College of Computer and Informa?on Science Northeastern University Webpage: www.ccs.neu.edu/home/luwang Email: luwang@ccs.neu.edu Logis?cs Assignment
Gene Regula*on, ChIP- X and DNA Mo*fs. Statistics in Genomics Hongkai Ji
 Gene Regula*on, ChIP- X and DNA Mo*fs Statistics in Genomics Hongkai Ji (hji@jhsph.edu) Genetic information is stored in DNA TCAGTTGGAGCTGCTCCCCCACGGCCTCTCCTCACATTCCACGTCCTGTAGCTCTATGACCTCCACCTTTGAGTCCCTCCTC
Hypothesis testing I. - In particular, we are talking about statistical hypotheses. [get everyone s finger length!] n =
![Hypothesis testing I. - In particular, we are talking about statistical hypotheses. [get everyone s finger length!] n =](/thumbs/86/94764601.jpg "Hypothesis testing I. - In particular, we are talking about statistical hypotheses. [get everyone s finger length!] n =") Hypothesis testing I I. What is hypothesis testing? [Note we re temporarily bouncing around in the book a lot! Things will settle down again in a week or so] - Exactly what it says. We develop a hypothesis,
Hypothesis testing I I. What is hypothesis testing? [Note we re temporarily bouncing around in the book a lot! Things will settle down again in a week or so] - Exactly what it says. We develop a hypothesis,
*Equal contribution Contact: (TT) 1 Department of Biomedical Engineering, the Engineering Faculty, Tel Aviv
 1 Department of Biomedical Engineering, the Engineering Faculty, Tel Aviv") Supplementary of Complementary Post Transcriptional Regulatory Information is Detected by PUNCH-P and Ribosome Profiling Hadas Zur*,1, Ranen Aviner*,2, Tamir Tuller 1,3 1 Department of Biomedical Engineering,
Supplementary of Complementary Post Transcriptional Regulatory Information is Detected by PUNCH-P and Ribosome Profiling Hadas Zur*,1, Ranen Aviner*,2, Tamir Tuller 1,3 1 Department of Biomedical Engineering,
General linear model: basic
 General linear model: basic Introducing General Linear Model (GLM): Start with an example Proper>es of the BOLD signal Linear Time Invariant (LTI) system The hemodynamic response func>on (Briefly) Evalua>ng
ABSSeq: a new RNA-Seq analysis method based on modelling absolute expression differences
 ABSSeq: a new RNA-Seq analysis method based on modelling absolute expression differences Wentao Yang October 30, 2018 1 Introduction This vignette is intended to give a brief introduction of the ABSSeq
High-Throughput Sequencing Course. Introduction. Introduction. Multiple Testing. Biostatistics and Bioinformatics. Summer 2018
 High-Throughput Sequencing Course Multiple Testing Biostatistics and Bioinformatics Summer 2018 Introduction You have previously considered the significance of a single gene Introduction You have previously
Genetic Networks. Korbinian Strimmer. Seminar: Statistical Analysis of RNA-Seq Data 19 June IMISE, Universität Leipzig
 Genetic Networks Korbinian Strimmer IMISE, Universität Leipzig Seminar: Statistical Analysis of RNA-Seq Data 19 June 2012 Korbinian Strimmer, RNA-Seq Networks, 19/6/2012 1 Paper G. I. Allen and Z. Liu.
Empirical Bayes Moderation of Asymptotically Linear Parameters
 Empirical Bayes Moderation of Asymptotically Linear Parameters Nima Hejazi Division of Biostatistics University of California, Berkeley stat.berkeley.edu/~nhejazi nimahejazi.org twitter/@nshejazi github/nhejazi
Sociology 301. Hypothesis Testing + t-test for Comparing Means. Hypothesis Testing. Hypothesis Testing. Liying Luo 04.14
 Sociology 301 Hypothesis Testing + t-test for Comparing Means Liying Luo 04.14 Hypothesis Testing 5. State a technical decision and a substan;ve conclusion Hypothesis Testing A random sample of 100 UD
Elementary Statistics Triola, Elementary Statistics 11/e Unit 17 The Basics of Hypotheses Testing
 (Section 8-2) Hypotheses testing is not all that different from confidence intervals, so let s do a quick review of the theory behind the latter. If it s our goal to estimate the mean of a population,
ChIP-seq analysis M. Defrance, C. Herrmann, S. Le Gras, D. Puthier, M. Thomas.Chollier
 ChIP-seq analysis M. Defrance, C. Herrmann, S. Le Gras, D. Puthier, M. Thomas.Chollier Data visualization, quality control, normalization & peak calling Peak annotation Presentation () Practical session
Advanced Statistical Methods: Beyond Linear Regression
 Advanced Statistical Methods: Beyond Linear Regression John R. Stevens Utah State University Notes 3. Statistical Methods II Mathematics Educators Worshop 28 March 2009 1 http://www.stat.usu.edu/~jrstevens/pcmi
Applied Time Series Analysis FISH 507. Eric Ward Mark Scheuerell Eli Holmes
 Applied Time Series Analysis FISH 507 Eric Ward Mark Scheuerell Eli Holmes Introduc;ons Who are we? Who & why you re here? What are you looking to get from this class? Days and Times Lectures When: Tues
One sided tests. An example of a two sided alternative is what we ve been using for our two sample tests:
 One sided tests So far all of our tests have been two sided. While this may be a bit easier to understand, this is often not the best way to do a hypothesis test. One simple thing that we can do to get
Last two weeks: Sample, population and sampling distributions finished with estimation & confidence intervals
 Past weeks: Measures of central tendency (mean, mode, median) Measures of dispersion (standard deviation, variance, range, etc). Working with the normal curve Last two weeks: Sample, population and sampling
Overview - MS Proteomics in One Slide. MS masses of peptides. MS/MS fragments of a peptide. Results! Match to sequence database
 Overview - MS Proteomics in One Slide Obtain protein Digest into peptides Acquire spectra in mass spectrometer MS masses of peptides MS/MS fragments of a peptide Results! Match to sequence database 2 But
Sampling Distributions
 Sampling Distributions Sampling Distribution of the Mean & Hypothesis Testing Remember sampling? Sampling Part 1 of definition Selecting a subset of the population to create a sample Generally random sampling
Sampling Distributions: Central Limit Theorem
 Review for Exam 2 Sampling Distributions: Central Limit Theorem Conceptually, we can break up the theorem into three parts: 1. The mean (µ M ) of a population of sample means (M) is equal to the mean (µ)
Introduc)on to the Design and Analysis of Experiments. Violet R. Syro)uk School of Compu)ng, Informa)cs, and Decision Systems Engineering
on to the Design and Analysis of Experiments. Violet R. Syro)uk School of Compu)ng, Informa)cs, and Decision Systems Engineering") Introduc)on to the Design and Analysis of Experiments Violet R. Syro)uk School of Compu)ng, Informa)cs, and Decision Systems Engineering 1 Complex Engineered Systems What makes an engineered system complex?
Introduc)on to the Design and Analysis of Experiments Violet R. Syro)uk School of Compu)ng, Informa)cs, and Decision Systems Engineering 1 Complex Engineered Systems What makes an engineered system complex?
Cycle «Analyse de données de séquençage à haut-débit»
 Cycle «Analyse de données de séquençage à haut-débit» Module 1/5 Analyse ADN Chadi Saad CRIStAL - Équipe BONSAI - Univ Lille, CNRS, INRIA (chadi.saad@univ-lille.fr) Présentation de Sophie Gallina (source:
T- test recap. Week 7. One- sample t- test. One- sample t- test 5/13/12. t = x " µ s x. One- sample t- test Paired t- test Independent samples t- test
 T- test recap Week 7 One- sample t- test Paired t- test Independent samples t- test T- test review Addi5onal tests of significance: correla5ons, qualita5ve data In each case, we re looking to see whether
Statistical Inference
 Statistical Inference J. Daunizeau Institute of Empirical Research in Economics, Zurich, Switzerland Brain and Spine Institute, Paris, France SPM Course Edinburgh, April 2011 Image time-series Spatial
Introductory Econometrics. Review of statistics (Part II: Inference)
") Introductory Econometrics Review of statistics (Part II: Inference) Jun Ma School of Economics Renmin University of China October 1, 2018 1/16 Null and alternative hypotheses Usually, we have two competing
Introductory Econometrics Review of statistics (Part II: Inference) Jun Ma School of Economics Renmin University of China October 1, 2018 1/16 Null and alternative hypotheses Usually, we have two competing
Going Beyond SNPs with Next Genera5on Sequencing Technology Personalized Medicine: Understanding Your Own Genome Fall 2014
 Going Beyond SNPs with Next Genera5on Sequencing Technology 02-223 Personalized Medicine: Understanding Your Own Genome Fall 2014 Next Genera5on Sequencing Technology (NGS) NGS technology Discover more
Prac%cal Bioinforma%cs for Life Scien%sts. Week 14, Lecture 28. István Albert Bioinforma%cs Consul%ng Center Penn State
 Prac%cal Bioinforma%cs for Life Scien%sts Week 14, Lecture 28 István Albert Bioinforma%cs Consul%ng Center Penn State Final project A group of researchers are interested in studying protein binding loca%ons
Improving the Performance of the FDR Procedure Using an Estimator for the Number of True Null Hypotheses
 Improving the Performance of the FDR Procedure Using an Estimator for the Number of True Null Hypotheses Amit Zeisel, Or Zuk, Eytan Domany W.I.S. June 5, 29 Amit Zeisel, Or Zuk, Eytan Domany (W.I.S.)Improving
Dispersion modeling for RNAseq differential analysis
 Dispersion modeling for RNAseq differential analysis E. Bonafede 1, F. Picard 2, S. Robin 3, C. Viroli 1 ( 1 ) univ. Bologna, ( 3 ) CNRS/univ. Lyon I, ( 3 ) INRA/AgroParisTech, Paris IBC, Victoria, July
Generalized Linear Models (1/29/13)
") STA613/CBB540: Statistical methods in computational biology Generalized Linear Models (1/29/13) Lecturer: Barbara Engelhardt Scribe: Yangxiaolu Cao When processing discrete data, two commonly used probability
STA613/CBB540: Statistical methods in computational biology Generalized Linear Models (1/29/13) Lecturer: Barbara Engelhardt Scribe: Yangxiaolu Cao When processing discrete data, two commonly used probability
z-scores z-scores z-scores and the Normal Distribu4on PSYC 300A - Lecture 3 Dr. J. Nicol
 z-scores and the Normal Distribu4on PSYC 300A - Lecture 3 Dr. J. Nicol z-scores Knowing a raw score does not inform us about the rela4ve loca4on of that score in the distribu4on The rela4ve loca4on of
Last week: Sample, population and sampling distributions finished with estimation & confidence intervals
 Past weeks: Measures of central tendency (mean, mode, median) Measures of dispersion (standard deviation, variance, range, etc). Working with the normal curve Last week: Sample, population and sampling
HYPOTHESIS TESTING. Hypothesis Testing
 MBA 605 Business Analytics Don Conant, PhD. HYPOTHESIS TESTING Hypothesis testing involves making inferences about the nature of the population on the basis of observations of a sample drawn from the population.
Statistical Inference
 Statistical Inference Jean Daunizeau Wellcome rust Centre for Neuroimaging University College London SPM Course Edinburgh, April 2010 Image time-series Spatial filter Design matrix Statistical Parametric
Lab #12: Exam 3 Review Key
 Psychological Statistics Practice Lab#1 Dr. M. Plonsky Page 1 of 7 Lab #1: Exam 3 Review Key 1) a. Probability - Refers to the likelihood that an event will occur. Ranges from 0 to 1. b. Sampling Distribution
Multiple Testing. Hoang Tran. Department of Statistics, Florida State University
 Multiple Testing Hoang Tran Department of Statistics, Florida State University Large-Scale Testing Examples: Microarray data: testing differences in gene expression between two traits/conditions Microbiome
High-throughput sequence alignment. November 9, 2017
 High-throughput sequence alignment November 9, 2017 a little history human genome project #1 (many U.S. government agencies and large institute) started October 1, 1990. Goal: 10x coverage of human genome,
Sample Size Estimation for Studies of High-Dimensional Data
 Sample Size Estimation for Studies of High-Dimensional Data James J. Chen, Ph.D. National Center for Toxicological Research Food and Drug Administration June 3, 2009 China Medical University Taichung,
Statistical Inference: Estimation and Confidence Intervals Hypothesis Testing
 Statistical Inference: Estimation and Confidence Intervals Hypothesis Testing 1 In most statistics problems, we assume that the data have been generated from some unknown probability distribution. We desire
Tools and topics for microarray analysis
 Tools and topics for microarray analysis USSES Conference, Blowing Rock, North Carolina, June, 2005 Jason A. Osborne, osborne@stat.ncsu.edu Department of Statistics, North Carolina State University 1 Outline
Mul$ple Sequence Alignment Methods. Tandy Warnow Departments of Bioengineering and Computer Science h?p://tandy.cs.illinois.edu
 Mul$ple Sequence Alignment Methods Tandy Warnow Departments of Bioengineering and Computer Science h?p://tandy.cs.illinois.edu Species Tree Orangutan Gorilla Chimpanzee Human From the Tree of the Life
Chapter 23. Inference About Means
 Chapter 23 Inference About Means 1 /57 Homework p554 2, 4, 9, 10, 13, 15, 17, 33, 34 2 /57 Objective Students test null and alternate hypotheses about a population mean. 3 /57 Here We Go Again Now that
A Sequential Bayesian Approach with Applications to Circadian Rhythm Microarray Gene Expression Data
 A Sequential Bayesian Approach with Applications to Circadian Rhythm Microarray Gene Expression Data Faming Liang, Chuanhai Liu, and Naisyin Wang Texas A&M University Multiple Hypothesis Testing Introduction
express: Streaming read deconvolution and abundance estimation applied to RNA-Seq
 express: Streaming read deconvolution and abundance estimation applied to RNA-Seq Adam Roberts 1 and Lior Pachter 1,2 1 Department of Computer Science, 2 Departments of Mathematics and Molecular & Cell
Valida&on of Predic&ve Classifiers
 Valida&on of Predic&ve Classifiers 1! Predic&ve Biomarker Classifiers In most posi&ve clinical trials, only a small propor&on of the eligible popula&on benefits from the new rx Many chronic diseases are
ChIP-seq analysis M. Defrance, C. Herrmann, S. Le Gras, D. Puthier, M. Thomas.Chollier
 ChIP-seq analysis M. Defrance, C. Herrmann, S. Le Gras, D. Puthier, M. Thomas.Chollier Visualization, quality, normalization & peak-calling Presentation (Carl Herrmann) Practical session Peak annotation
Courtesy of Jes Jørgensen
 Courtesy of Jes Jørgensen Testing Models 3 May 2016 Science is all about models Use physical mechanisms to predict outcomes Test the outcomes in order to test our understanding of the physics Science is
Introduction to Statistical Genetics (BST227) Lecture 6: Population Substructure in Association Studies
 Lecture 6: Population Substructure in Association Studies") Introduction to Statistical Genetics (BST227) Lecture 6: Population Substructure in Association Studies Confounding in gene+c associa+on studies q What is it? q What is the effect? q How to detect it?
Introduction to Statistical Genetics (BST227) Lecture 6: Population Substructure in Association Studies Confounding in gene+c associa+on studies q What is it? q What is the effect? q How to detect it?
Transcrip:on factor binding mo:fs
 Transcrip:on factor binding mo:fs BMMB- 597D Lecture 29 Shaun Mahony Transcrip.on factor binding sites Short: Typically between 6 20bp long Degenerate: TFs have favorite binding sequences but don t require
Statistics Boot Camp. Dr. Stephanie Lane Institute for Defense Analyses DATAWorks 2018
 Statistics Boot Camp Dr. Stephanie Lane Institute for Defense Analyses DATAWorks 2018 March 21, 2018 Outline of boot camp Summarizing and simplifying data Point and interval estimation Foundations of statistical
Introduc)on to Ar)ficial Intelligence
on to Ar)ficial Intelligence") Introduc)on to Ar)ficial Intelligence Lecture 13 Approximate Inference CS/CNS/EE 154 Andreas Krause Bayesian networks! Compact representa)on of distribu)ons over large number of variables! (OQen) allows
Introduc)on to Ar)ficial Intelligence Lecture 13 Approximate Inference CS/CNS/EE 154 Andreas Krause Bayesian networks! Compact representa)on of distribu)ons over large number of variables! (OQen) allows
Streaming - 2. Bloom Filters, Distinct Item counting, Computing moments. credits:www.mmds.org.
 Streaming - 2 Bloom Filters, Distinct Item counting, Computing moments credits:www.mmds.org http://www.mmds.org Outline More algorithms for streams: 2 Outline More algorithms for streams: (1) Filtering
Regression Part II. One- factor ANOVA Another dummy variable coding scheme Contrasts Mul?ple comparisons Interac?ons
 Regression Part II One- factor ANOVA Another dummy variable coding scheme Contrasts Mul?ple comparisons Interac?ons One- factor Analysis of variance Categorical Explanatory variable Quan?ta?ve Response
Business Statistics. Lecture 10: Course Review
 Business Statistics Lecture 10: Course Review 1 Descriptive Statistics for Continuous Data Numerical Summaries Location: mean, median Spread or variability: variance, standard deviation, range, percentiles,