Intro to Info Vis. CS 725/825 Information Visualization Spring } Before class. } During class. Dr. Michele C. Weigle
|
|
|
- Georgiana Simpson
- 5 years ago
- Views:
Transcription

1 CS 725/825 Information Visualization Spring 2018 Intro to Info Vis Dr. Michele C. Weigle Today } Before class } Reading: Ch 1 - What's Vis, and Why Do It? } During class } Highlight and discuss Ch 1 } We will not cover everything that you are responsible for during class time. 2
2 Topic Objectives } Define visualization. } Explain the importance of humans in the visualization process. } Explain why human vision is particularly well-suited for information transfer. } Give an example of a visualization idiom. } Explain why it is best to consider multiple alternatives for vis before selecting a solution. } Explain at a high-level the "what-why-how" framework for analyzing visualization use. } Differentiate between R, D3, and Tableau and describe the type of tasks for which each tool might be most appropriate. 3 What is visualization? } "The communication of information using graphical representations" } Ward, Grinstein, Keim } "The use of computer-supported interactive visual representations of data to amplify cognition" } Card, Mackinlay, Shneiderman, Readings in Information Visualization: Using Vision to Think } "The purpose of visualization is insight, not pictures." } Ben Shneiderman 4


3 Where have you seen a visualization today? What's vis? } Visualization is suitable when there is a need to augment human capabilities rather than replace people with computational decision-making methods. } The design space of possible vis idioms is huge, and includes the considerations of both how to create and how to interact with visual representations. } Vis design is full of tradeoffs, and most possibilities in the design space are ineffective for a particular task, so validating the effectiveness of a design is both necessary and difficult. } Vis designers must take into account three very different kinds of resource limitations: those of computers, of humans, and of displays. } Vis usage can be analyzed in terms of why the user needs it, what data is shown, and how the idiom is designed. 6 Munzner, pg. 1
4 Visualization is suitable when there is a need to augment human capabilities rather than replace people with computational decision-making methods. 7 Why have a human in the loop? augment human capabilities } Vis allows people to analyze data when they don't know exactly what questions to ask in advance. } Best path - put a human in the loop } exploit the pattern detection properties of human vision 8


5 augment human capabilities Humans are great at pattern recognition Create visualizations that lets computers do what computers do well and lets humans do what humans do well. 9 Uses of vis tools } Transitional } vis works itself out of a job } Long-term } exploratory analysis } Presentation } visual explanations augment human capabilities New York Times,

6 augment human capabilities Why have a computer in the loop? Munzner, Fig 1.2 (Barsky et al., 2007) 11 augment human capabilities Why use an external representation? } Vis allows people to offload cognition and memory usage to make space for other operations. } Diagrams as external representations } information can be organized by spatial location } search - grouping items needed for problem-solving in one location } recognition - grouping relevant info for one item in the same location 12

![20 + 2 = 22] 2 7 3 6 [8 + 5 = 13] [4 + 2 + 1 = 7] Example courtesy Tamara Munzner, Univ.](/docs-images/93/112719913/images/7-2.jpg "of British Columbia 13 Why depend on vision?")
7 Visualization can extend your memory What is 57 x 48? augment human capabilities paper mental buffer [8 * 7 = 56] x 48 [8 * 5 = = 45] [4 * 7 = 28] 228 [4 * 5 = = 22] [8 + 5 = 13] [ = 7] Example courtesy Tamara Munzner, Univ. of British Columbia 13 Why depend on vision? augment human capabilities } Visual system provides a high-bandwidth channel to our brains. } Significant amount of visual information processing occurs in parallel at the preconscious level. 14

8 Can you find the red dot? augment human capabilities preattentive processing 15 Which state had the highest marriage rate? Florida Connecticut Colorado Delaware District of Columbia augment human capabilities 16
9 augment human capabilities Which state had the highest marriage rate? 17 U.S. Census Bureau, Statistical Abstract of the United States: Why show the data in detail? augment human capabilities } Vis tools can allow people to explore data to find patterns or to determine if a statistical model actually fits the data } Look out for questionable data } "just because it's numbers doesn't mean it's true" } is it a typo or something interesting? } "make sure you know which one it is" 18
10 Anscombe's Quartet 19 F.J. Anscombe, "Graphs in Statistical Analysis", American Statistician, Feb 1973 Munzner, Figure 1.3 augment human capabilities Anscombe s Quartet: Raw Data I II III IV x y x y x y x y mean var corr augment human capabilities The four data sets are not the same "Graphics reveal data" - Edward Tufte, The Visual Display of Quantitative Information 20

11 Datasaurus Dozen 21 The design space of possible vis idioms is huge, and includes the considerations of both how to create and how to interact with visual representations. 22
12 design space of possible vis idioms is huge Why is the idiom design space huge? } Vis idioms - approaches to creating and manipulating visual representations } Simple examples: scatterplots, bar charts, line charts 23 design space of possible vis idioms is huge 45 Ways to Communicate Two Quantities 24


13 design space of possible vis idioms is huge datavizproject.com 25 Why use interactivity? how to interact with visual representations } Interaction allows for } handling complexity } displaying multiple aspects of a dataset 26
14 Vis design is full of tradeoffs, and most possibilities in the design space are ineffective for a particular task, so validating the effectiveness of a design is both necessary and difficult. 27 Why focus on tasks? ineffective for a particular task } The intended task is just as important as the data to be visualized. } Four categories of tasks } presentation } discovery } enjoyment of information } producing more information for later use 28

15 Why focus on effectiveness? most possibilities are ineffective } Effectiveness is an important measure for understanding if the user task was supported. } "The purpose of visualization is insight, not pictures." -Ben Shneiderman } But, no picture can tell the truth, the whole truth, and nothing but the truth. 29 most possibilities are ineffective Why are most designs ineffective? } Design may not match with human perception } Design may not match with intended task Which color comprises the greatest portion? What is the percentage of the green region? 30
16 most possibilities are ineffective Search space metaphor for vis design Good! x x o o o o o o x x o x Space of possible solutions Selected solution Proposal space Consideration space Known space x Good solution o OK solution Poor Solution Bad! o x o o o x x o o o x Space of possible solutions Munzner, Fig Why is validation difficult? validating the effectiveness is necessary and difficult } How do you know if your visualization "works"? } How do you measure insight? } How do you argue that one design is better than another? } What does "better" mean? faster? more fun? more effective? } What does "effectively" mean? 32

17 Vis designers must take into account three very different kinds of resource limitations: those of computers, of humans, and of displays. 33 Why are there resource limitations? } computational capacity } human perceptual and cognitive capacity } display capacity take into account resource limitations 34
18 Vis usage can be analyzed in terms of why the user needs it, what data is shown, and how the idiom is designed. 35 Why analyze vis? } Analyzing existing systems is a good stepping stone to designing new ones. } High-level framework for analyzing vis use } what data the user sees } why the user intends to use a vis tool } how the visual encoding and interaction idioms are constructed in terms of design choices 36
19 Tools 37 Workflow } What } data gathering } data wrangling } Why } developing questions } initial analysis } How } charts for analysis } charts for presentation 38
20 What: Data Gathering /births-deaths-marriages-divorces.html } Tabula extract tables from PDFs } Beautiful Soup extract data from webpages 39 What: Data Wrangling } Data is often messy } Tools } Excel } Open Refine filter and clean data files } Much more on this next week 40
21 Why } Developing questions } which states have the highest marriage rates? } which states have the highest divorce rates? is that correlated to marriage rate? } which states have the highest birth rates? is that correlated to marriage rate? } Initial analysis } Excel } Google Sheets, Google Charts } Tableau } R 41 How } Charts for analysis } Charts for presentation New York Times,


22 Excel


23 Tableau 45 D3 Many examples use D3v3. Current version is D3v4. In many instances, these are not compatible. 46


24 Choosing Tools datavisualization.ch 47 Choosing Tools chartmaker directory 48


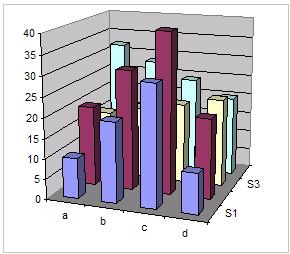
25 What I Learned Recreating One Chart Using 24 Tools 49 Tools for Analysis vs. Presentation 50
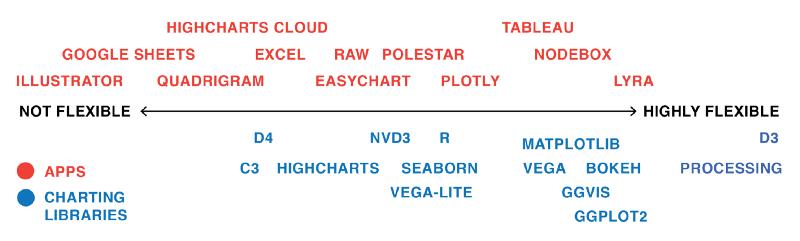
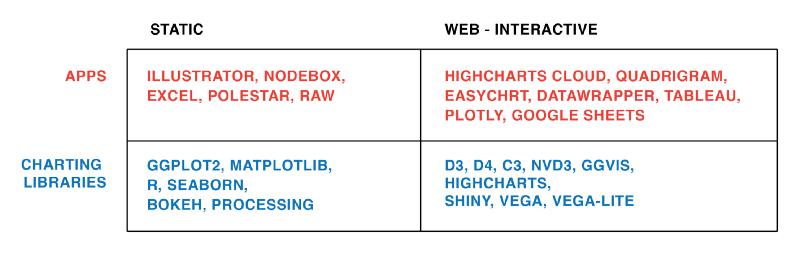
26 Flexibility of Tools 51 Apps vs. Libraries and Static vs. Interactive 52
27 Topic Objectives } Define visualization. } Explain the importance of humans in the visualization process. } Explain why human vision is particularly well-suited for information transfer. } Give an example of a visualization idiom. } Explain why it is best to consider multiple alternatives for vis before selecting a solution. } Explain at a high-level the "what-why-how" framework for analyzing visualization use. } Differentiate between R, D3, and Tableau and describe the type of tasks for which each tool might be most appropriate. 53
Data. Notes. are required reading for the week. textbook reading and a few slides on data formats and data cleaning
 CS 725/825 Information Visualization Fall 2017 Data Dr. Michele C. Weigle http://www.cs.odu.edu/~mweigle/cs725-f17/ Notes } We will not cover these slides in class, but they are required reading for the
Introduction to Information Visualization
 Introduction to Information Visualization Edward Tufte: References The Visual Display of Quantitative Information Envisioning Information Visual Explanation Dr. John Stasko s Information Visualization
Week 12: Visual Argument (Visual and Statistical Thinking by Tufte) March 28, 2017
 March 28, 2017") CS 4001: Computing, Society & Professionalism Munmun De Choudhury Assistant Professor School of Interactive Computing Week 12: Visual Argument (Visual and Statistical Thinking by Tufte) March 28, 2017
CS 4001: Computing, Society & Professionalism Munmun De Choudhury Assistant Professor School of Interactive Computing Week 12: Visual Argument (Visual and Statistical Thinking by Tufte) March 28, 2017
Your World is not Red or Green. Good Practice in Data Display and Dashboard Design
 Your World is not Red or Green Good Practice in Data Display and Dashboard Design References Tufte, E. R. (2). The visual display of quantitative information (2nd Ed.). Cheshire, CT: Graphics Press. Few,
Bivariate data analysis
 Bivariate data analysis Categorical data - creating data set Upload the following data set to R Commander sex female male male male male female female male female female eye black black blue green green
Geographic Data Science - Lecture III
 Geographic Data Science - Lecture III (Geo-)Visualization Dani Arribas-Bel Today Visualization What and why History Examples Geovisualization What "A map for everyone" Dangers of geovisualization Visualization
Approaches to Spatial Analysis. Flora Vale, Linda Beale, Mark Harrower, Clint Brown Esri Redlands
 Approaches to Spatial Analysis Flora Vale, Linda Beale, Mark Harrower, Clint Brown Esri Redlands Analysis (noun) Detailed examination of the elements or structure of something, as a basis for discussion,
2.6 Complexity Theory for Map-Reduce. Star Joins 2.6. COMPLEXITY THEORY FOR MAP-REDUCE 51
 2.6. COMPLEXITY THEORY FOR MAP-REDUCE 51 Star Joins A common structure for data mining of commercial data is the star join. For example, a chain store like Walmart keeps a fact table whose tuples each
MIS 0855 Data Science (Section 005) Fall 2016 In-Class Exercise (Week 4) Visualizing with Maps
 Fall 2016 In-Class Exercise (Week 4) Visualizing with Maps") MIS 0855 Data Science (Section 005) Fall 2016 In-Class Exercise (Week 4) Visualizing with Maps Objective: Learn how to use Tableau s powerful mapping tools Learning Outcomes: Learn at what levels (e.g.
MIS 0855 Data Science (Section 005) Fall 2016 In-Class Exercise (Week 4) Visualizing with Maps Objective: Learn how to use Tableau s powerful mapping tools Learning Outcomes: Learn at what levels (e.g.
CS444/544: Midterm Review. Carlos Scheidegger
 CS444/544: Midterm Review Carlos Scheidegger D3: DATA-DRIVEN DOCUMENTS The essential idea D3 creates a two-way association between elements of your dataset and entries in the DOM D3 operates on selections
Math 132. Population Growth: Raleigh and Wake County
 Math 132 Population Growth: Raleigh and Wake County S. R. Lubkin Application Ask anyone who s been living in Raleigh more than a couple of years what the biggest issue is here, and if the answer has nothing
MITOCW MITRES18_005S10_DiffEqnsGrowth_300k_512kb-mp4
 MITOCW MITRES18_005S10_DiffEqnsGrowth_300k_512kb-mp4 GILBERT STRANG: OK, today is about differential equations. That's where calculus really is applied. And these will be equations that describe growth.
Displaying Scientific Evidence for Making Valid Decisions: Lessons from Two Case Studies
 Displaying Scientific Evidence for Making Valid Decisions: Lessons from Two Case Studies Steve Lee The CLIMB Program Research Communication Workshop Spring 2011 Edward R. Tufte s Visual and Statistical
Visual Display of Information
 Visual Display of Information XKCD Edward Tufte Charles Joseph Minard s dramatic account of Napoleon's Russian campaign of 1812 (drawn in 1861) 1, men arrived in Moscow 422, men started the journey to
Chapter. Organizing and Summarizing Data. Copyright 2013, 2010 and 2007 Pearson Education, Inc.
 Chapter 2 Organizing and Summarizing Data Section 2.1 Organizing Qualitative Data Objectives 1. Organize Qualitative Data in Tables 2. Construct Bar Graphs 3. Construct Pie Charts When data is collected
Math Topic: Unit Conversions and Statistical Analysis of Data with Categorical and Quantitative Graphs
 Math Topic: Unit Conversions and Statistical Analysis of Data with Categorical and Quantitative Graphs Science Topic: s/dwarf s of our Solar System Written by: Eric Vignaud and Lexie Edwards Lesson Objectives
1. The Basic X-Y Scatter Plot
 1. The Basic X-Y Scatter Plot EXCEL offers a wide range of plots; however, this discussion will be restricted to generating XY scatter plots in various formats. The easiest way to begin is to highlight
CALCULUS. Teaching Concepts of TechSpace THOMAS LINGEFJÄRD & DJAMSHID FARAHANI
 Teaching Concepts of TechSpace CALCULUS THOMAS LINGEFJÄRD & DJAMSHID FARAHANI The topic of calculus is an integral part of the senior secondary mathematics curriculum. The concepts of limits and derivatives,
Statistics A Brief Visit. Lulu Kang, MATH 100
 Statistics A Brief Visit Lulu Kang, MATH 00 What is Statistics Many people would think statistics is the study of data. True, but not entirely true. What is Statistics Statistics is the study of the collection,
Essentials of Statistics and Probability
 May 22, 2007 Department of Statistics, NC State University dbsharma@ncsu.edu SAMSI Undergrad Workshop Overview Practical Statistical Thinking Introduction Data and Distributions Variables and Distributions
EXPERIMENTAL DESIGN. u Science answers questions with experiments.
 EXPERIMENTAL DESIGN u Science answers questions with experiments. Define the Problem u Begin by asking a question about your topic u Represented by a problem statement u What is a good question for an
Mapping Data 1: Constructing a Choropleth Map
 Mapping Data 1: Constructing a Choropleth Map OVERVIEW & OBJECTIVES Students will become acquainted with mapping data and understanding the importance of recognizing patterns by constructing a choropleth
The posterior - the goal of Bayesian inference
 Chapter 7 The posterior - the goal of Bayesian inference 7.1 Googling Suppose you are chosen, for your knowledge of Bayesian statistics, to work at Google as a search traffic analyst. Based on historical
@SoyGema GEMA PARREÑO PIQUERAS
 @SoyGema GEMA PARREÑO PIQUERAS WHAT IS AN ARTIFICIAL NEURON? WHAT IS AN ARTIFICIAL NEURON? Image Recognition Classification using Softmax Regressions and Convolutional Neural Networks Languaje Understanding
Uncertainty visualisation. Edwin de Jonge May 17th 2016, Visualisation Workshop, Valencia
 Uncertainty visualisation Edwin de Jonge (@edwindjonge) May 17th 2016, Visualisation Workshop, Valencia Who am I? Statistical consultant / Data scientist - working @ R&D department of Statistics Netherlands
Pathline: " 1234B2# ="3;6<89>";>6"B A1"<6"A <?;>"=21 9>";52#A. Miriah Meyer 1,2
 1234567" 2839958:9;8"8:?7
Spatial Data Analysis in Archaeology Anthropology 589b. Kriging Artifact Density Surfaces in ArcGIS
 Spatial Data Analysis in Archaeology Anthropology 589b Fraser D. Neiman University of Virginia 2.19.07 Spring 2007 Kriging Artifact Density Surfaces in ArcGIS 1. The ingredients. -A data file -- in.dbf
Visualization. Maneesh Agrawala and Michael Bernstein CS 247
 Visualization Maneesh Agrawala and Michael Bernstein CS 247 Topics Why do we create visualizations? Data and image Estimating magnitude Deconstructions What is Visualization? Definition [www.oed.com] 1.
How to Make or Plot a Graph or Chart in Excel
 This is a complete video tutorial on How to Make or Plot a Graph or Chart in Excel. To make complex chart like Gantt Chart, you have know the basic principles of making a chart. Though I have used Excel
Visualizing Big Data on Maps: Emerging Tools and Techniques. Ilir Bejleri, Sanjay Ranka
 Visualizing Big Data on Maps: Emerging Tools and Techniques Ilir Bejleri, Sanjay Ranka Topics Web GIS Visualization Big Data GIS Performance Maps in Data Visualization Platforms Next: Web GIS Visualization
DATA DISAGGREGATION BY GEOGRAPHIC
 PROGRAM CYCLE ADS 201 Additional Help DATA DISAGGREGATION BY GEOGRAPHIC LOCATION Introduction This document provides supplemental guidance to ADS 201.3.5.7.G Indicator Disaggregation, and discusses concepts
What are the five components of a GIS? A typically GIS consists of five elements: - Hardware, Software, Data, People and Procedures (Work Flows)
") LECTURE 1 - INTRODUCTION TO GIS Section I - GIS versus GPS What is a geographic information system (GIS)? GIS can be defined as a computerized application that combines an interactive map with a database
LECTURE 1 - INTRODUCTION TO GIS Section I - GIS versus GPS What is a geographic information system (GIS)? GIS can be defined as a computerized application that combines an interactive map with a database
Human-Centered Fidelity Metrics for Virtual Environment Simulations
 Human-Centered Fidelity Metrics for Virtual Environment Simulations Three Numbers from Standard Experimental Design and Analysis: α, power, effect magnitude VR 2005 Tutorial J. Edward Swan II, Mississippi
New Paltz Central School District Mathematics Third Grade
 September - Unit 1: Place Value and Numeration/Addition and Use hundred charts and number lines. Place Value October Subtraction Read and write numbers to 1,000. Pre- What is place value? Order numbers
Thank you for your purchase!
 TM Thank you for your purchase! Please be sure to save a copy of this document to your local computer. This activity is copyrighted by the AIMS Education Foundation. All rights reserved. No part of this
COMP3702/7702 Artificial Intelligence Week1: Introduction Russell & Norvig ch.1-2.3, Hanna Kurniawati
 COMP3702/7702 Artificial Intelligence Week1: Introduction Russell & Norvig ch.1-2.3, 3.1-3.3 Hanna Kurniawati Today } What is Artificial Intelligence? } Better know what it is first before committing the
GIS Test Drive What a Geographic Information System Is and What it Can Do. Alison Davis-Holland
 GIS Test Drive What a Geographic Information System Is and What it Can Do Alison Davis-Holland adavisholland@gmail.com WHO AM I? Geospatial Analyst M.S. in Geographic and Cartographic Sciences Use GIS
Motivating Questions: How many hurricanes happen in a year? Have the number of hurricanes per year changed over time?
 Hurricanes Over Time Materials For the leader: Projector Whiteboard to project data graph onto For the activity: Graphing paper Markers Globe Copy of data cards Overview Hurricanes occur in the North Atlantic
Exploratory Data Analysis
 CS448B :: 30 Sep 2010 Exploratory Data Analysis Last Time: Visualization Re-Design Jeffrey Heer Stanford University In-Class Design Exercise Mackinlay s Ranking Task: Analyze and Re-design visualization
Review. Number of variables. Standard Scores. Anecdotal / Clinical. Bivariate relationships. Ch. 3: Correlation & Linear Regression
 Ch. 3: Correlation & Relationships between variables Scatterplots Exercise Correlation Race / DNA Review Why numbers? Distribution & Graphs : Histogram Central Tendency Mean (SD) The Central Limit Theorem
Business Statistics. Lecture 9: Simple Regression
 Business Statistics Lecture 9: Simple Regression 1 On to Model Building! Up to now, class was about descriptive and inferential statistics Numerical and graphical summaries of data Confidence intervals
Agilent MassHunter Quantitative Data Analysis
 Agilent MassHunter Quantitative Data Analysis Presenters: Howard Sanford Stephen Harnos MassHunter Quantitation: Batch and Method Setup Outliers, Data Review, Reporting 1 MassHunter Quantitative Analysis
Effective January 2008 All indicators in Standard / 11
 Scientific Inquiry 8-1 The student will demonstrate an understanding of technological design and scientific inquiry, including process skills, mathematical thinking, controlled investigative design and
Data Visualization (DSC 530/CIS )
") Data Visualization (DSC 530/CIS 602-01) Tables Dr. David Koop Visualization of Tables Items and attributes For now, attributes are not known to be positions Keys and values - key is an independent attribute
Data Visualization (DSC 530/CIS 602-01) Tables Dr. David Koop Visualization of Tables Items and attributes For now, attributes are not known to be positions Keys and values - key is an independent attribute
EXPERIMENT 2 Reaction Time Objectives Theory
 EXPERIMENT Reaction Time Objectives to make a series of measurements of your reaction time to make a histogram, or distribution curve, of your measured reaction times to calculate the "average" or mean
Chapter 1. GIS Fundamentals
 1. GIS Overview Chapter 1. GIS Fundamentals GIS refers to three integrated parts. Geographic: Of the real world; the spatial realities, the geography. Information: Data and information; their meaning and
Math101, Sections 2 and 3, Spring 2008 Review Sheet for Exam #2:
 Math101, Sections 2 and 3, Spring 2008 Review Sheet for Exam #2: 03 17 08 3 All about lines 3.1 The Rectangular Coordinate System Know how to plot points in the rectangular coordinate system. Know the
The Community Maps Project Craig Roland! The University of Florida! January 2002!
 Preliminary map by a 4th grader Community Map by Four Art Buddies The Community Maps Project Craig Roland! The University of Florida! January 2002! The Community Maps Project represents a collaborative
Chapter 2: Tools for Exploring Univariate Data
 Stats 11 (Fall 2004) Lecture Note Introduction to Statistical Methods for Business and Economics Instructor: Hongquan Xu Chapter 2: Tools for Exploring Univariate Data Section 2.1: Introduction What is
THE DATA REVOLUTION HAS BEGUN On the front lines with geospatial data and tools
 THE DATA REVOLUTION HAS BEGUN On the front lines with geospatial data and tools Slidedoc of presentation for MEASURE Evaluation End of Project Meeting Washington DC May 22, 2014 John Spencer Geospatial
Point of intersection
 Name: Date: Period: Exploring Systems of Linear Equations, Part 1 Learning Goals Define a system of linear equations and a solution to a system of linear equations. Identify whether a system of linear
Module 10 Summative Assessment
 Module 10 Summative Assessment Activity In this activity you will use the three dimensions of vulnerability that you learned about in this module exposure, sensitivity, and adaptive capacity to assess
Becky Zemple Prior Knowledge Assessment Lesson Plan 8 th Grade Physical Science through Atomic Theory
 Becky Zemple Prior Knowledge Assessment Lesson Plan 8 th Grade Physical Science 10-22-12 through 10-23-12 Atomic Theory Purpose: This lesson is designed to help students understand the basis of the atom
DATA LAB. Data Lab Page 1
 NOTE: This DataLab Activity Guide will be updated soon to reflect April 2015 changes DATA LAB PURPOSE. In this lab, students analyze and interpret quantitative features of their brightness graph to determine
DATA SCIENCE SIMPLIFIED USING ARCGIS API FOR PYTHON
 DATA SCIENCE SIMPLIFIED USING ARCGIS API FOR PYTHON LEAD CONSULTANT, INFOSYS LIMITED SEZ Survey No. 41 (pt) 50 (pt), Singapore Township PO, Ghatkesar Mandal, Hyderabad, Telengana 500088 Word Limit of the
Exercise - INSTRUCTIONS
 Learning module: Introduction to Qlik GeoAnalytics Exercise - INSTRUCTIONS Using the Example Download instructions on the right, open the IntroQlikGeoAnalytics_Exercise example in Qlik Sense Desktop and
Visualizing Geospatial Graphs
 Visualizing Geospatial Graphs An introduction to visualizing geospatial graph data with KeyLines Geospatial www.cambridge-intelligence.com USA: +1 (775) 842-6665 UK: +44 (0)1223 362 000 Cambridge Intelligence
Multiple Choice. Chapter 2 Test Bank
 Straightforward Statistics 1st Edition Bowen Test Bank Full Download: https://testbanklive.com/download/straightforward-statistics-1st-edition-bowen-test-bank/ Chapter 2 Test Bank Multiple Choice 1. Data
Recommended Grade Level: 8 Earth/Environmental Science Weather vs. Climate
 Lab Activity Title: Climate Factors Past and Present Recommended Grade Level: 8 Discipline: Earth/Environmental Science Topic: Weather vs. Climate Time Requirements: 90 minutes Submitted by: Karen McCabe
Welcome! Power BI User Group (PUG) Copenhagen
 Copenhagen") Welcome! Power BI User Group (PUG) Copenhagen Making Maps in Power BI Andrea Martorana Tusa BI Specialist Welcome to Making maps in Power BI Who am I? First name: Andrea. Last name: Martorana Tusa. Italian,
Welcome! Power BI User Group (PUG) Copenhagen Making Maps in Power BI Andrea Martorana Tusa BI Specialist Welcome to Making maps in Power BI Who am I? First name: Andrea. Last name: Martorana Tusa. Italian,
Lab 1. EXCEL plus some basic concepts such as scientific notation, order of magnitude, logarithms, and unit conversions
 COMPUTER LAB 1 EARTH SYSTEMS SCIENCE I PG250 Fall 2010 Hunter College Lab 1. EXCEL plus some basic concepts such as scientific notation, order of magnitude, logarithms, and unit conversions Low Impact
Uncertainty in Physical Measurements: Module 5 Data with Two Variables
 : Often data have two variables, such as the magnitude of the force F exerted on an object and the object s acceleration a. In this Module we will examine some ways to determine how one of the variables,
NAME: DATE: SECTION: MRS. KEINATH
 1 Vocabulary and Formulas: Correlation coefficient The correlation coefficient, r, measures the direction and strength of a linear relationship between two variables. Formula: = 1 x i x y i y r. n 1 s
A Scientific Model for Free Fall.
 A Scientific Model for Free Fall. I. Overview. This lab explores the framework of the scientific method. The phenomenon studied is the free fall of an object released from rest at a height H from the ground.
Manipulating Radicals
 Lesson 40 Mathematics Assessment Project Formative Assessment Lesson Materials Manipulating Radicals MARS Shell Center University of Nottingham & UC Berkeley Alpha Version Please Note: These materials
MITOCW free_body_diagrams
 MITOCW free_body_diagrams This is a bungee jumper at the bottom of his trajectory. This is a pack of dogs pulling a sled. And this is a golf ball about to be struck. All of these scenarios can be represented
2. Graphing Practice. Warm Up
 2. Graphing Practice In this worksheet you will practice graphing and use your graphs to interpret and analyze data. The first three questions are warm-up questions; complete this section before moving
Neural Networks 2. 2 Receptive fields and dealing with image inputs
 CS 446 Machine Learning Fall 2016 Oct 04, 2016 Neural Networks 2 Professor: Dan Roth Scribe: C. Cheng, C. Cervantes Overview Convolutional Neural Networks Recurrent Neural Networks 1 Introduction There
Machine Learning! in just a few minutes. Jan Peters Gerhard Neumann
 Machine Learning! in just a few minutes Jan Peters Gerhard Neumann 1 Purpose of this Lecture Foundations of machine learning tools for robotics We focus on regression methods and general principles Often
Regression Analysis in R
 Regression Analysis in R 1 Purpose The purpose of this activity is to provide you with an understanding of regression analysis and to both develop and apply that knowledge to the use of the R statistical
Recap from Last Time
 P and NP Recap from Last Time The Limits of Decidability In computability theory, we ask the question What problems can be solved by a computer? In complexity theory, we ask the question What problems
Human Population Dynamics CAPT Embedded Task
 Name Per. Assigned Due Human Population Dynamics CAPT Embedded Task Essential Question: What factors influence population growth? The human population has existed for a little more than 500,000 years.
Statistical Science and Data Science
 Statistical Science and Data Science Nancy Reid 27 October 2016 Fisher Memorial Lecture 27 Oct 2016 Fisher Memorial Lecture 27 Oct 2016 2 Fisher Number Selected Correspondence of R. A. Fisher Edited by
Comparing Multiple Representations of Functions
 Are All Functions Created Equal? Comparing Multiple Representations of Functions 1.3 Learning Goals In this lesson, you will: Identify equivalent forms of functions in various representations. Model situations
Learning Analytics. Dr. Bowen Hui Computer Science University of British Columbia Okanagan
 Learning Analytics Dr. Bowen Hui Computer cience University of British Columbia kanagan Putting the Pieces Together Consider an intelligent tutoring system designed to assist the user in programming Possible
ELEMENTS OF GROUP THEORY FOR PHYSICISTS BY A. W JOSHI DOWNLOAD EBOOK : ELEMENTS OF GROUP THEORY FOR PHYSICISTS BY A. W JOSHI PDF
 Read Online and Download Ebook ELEMENTS OF GROUP THEORY FOR PHYSICISTS BY A. W JOSHI DOWNLOAD EBOOK : ELEMENTS OF GROUP THEORY FOR PHYSICISTS BY A. W Click link bellow and free register to download ebook:
Connecting weather to boaters. Neal Moodie National Manager, Marine Weather Services May 2015
 Connecting weather to boaters Neal Moodie National Manager, Marine Weather Services May 2015 Supporting services with education Talk outline Weather education challenges and options How do boaties use/think
A Journey Back in Time
 A Trip Through Geologic Time TEACHER NOTES Lab zonetm A Journey Back in Time The following steps will walk you through the. Use the hints and detailed directions as you guide your students through planning,
(Refer Slide Time: 00:10)
") Chemical Reaction Engineering 1 (Homogeneous Reactors) Professor R. Krishnaiah Department of Chemical Engineering Indian Institute of Technology Madras Lecture No 10 Design of Batch Reactors Part 1 (Refer
Chemical Reaction Engineering 1 (Homogeneous Reactors) Professor R. Krishnaiah Department of Chemical Engineering Indian Institute of Technology Madras Lecture No 10 Design of Batch Reactors Part 1 (Refer
UNIT 1: The Scientific Method Chapter 1: The Nature of Science (pages 5-35)
") CORNELL NOTES Directions: You must create a minimum of 5 questions in this column per page (average). Use these to study your notes and prepare for tests and quizzes. Notes will be turned in to your teacher
CORNELL NOTES Directions: You must create a minimum of 5 questions in this column per page (average). Use these to study your notes and prepare for tests and quizzes. Notes will be turned in to your teacher
CSE332: Data Structures & Parallelism Lecture 2: Algorithm Analysis. Ruth Anderson Winter 2018
 CSE332: Data Structures & Parallelism Lecture 2: Algorithm Analysis Ruth Anderson Winter 2018 Today Algorithm Analysis What do we care about? How to compare two algorithms Analyzing Code Asymptotic Analysis
Among various open-source GIS programs, QGIS can be the best suitable option which can be used across partners for reasons outlined below.
 Comparison of Geographic Information Systems (GIS) software As of January 2018, WHO has reached an agreement with ESRI (an international supplier of GIS software) for an unlimited use of ArcGIS Desktop
Cockpit System Situational Awareness Modeling Tool
 ABSTRACT Cockpit System Situational Awareness Modeling Tool John Keller and Dr. Christian Lebiere Micro Analysis & Design, Inc. Capt. Rick Shay Double Black Aviation Technology LLC Dr. Kara Latorella NASA
ArcGIS & Extensions - Synergy of GIS tools. Synergy. Analyze & Visualize
 Using ArcGIS Extensions to Analyze and Visualize data Colin Childs 1 Topics Objectives Synergy Analysis & Visualization ArcGIS Analysis environments Geoprocessing tools Extensions ArcMap The analysis Process
Machine Learning Analyses of Meteor Data
 WGN, The Journal of the IMO 45:5 (2017) 1 Machine Learning Analyses of Meteor Data Viswesh Krishna Research Student, Centre for Fundamental Research and Creative Education. Email: krishnaviswesh@cfrce.in
CSE332: Data Structures & Parallelism Lecture 2: Algorithm Analysis. Ruth Anderson Winter 2018
 CSE332: Data Structures & Parallelism Lecture 2: Algorithm Analysis Ruth Anderson Winter 2018 Today Algorithm Analysis What do we care about? How to compare two algorithms Analyzing Code Asymptotic Analysis
Spatial Data Availability Energizes Florida s Citizens
 NASCIO 2016 Recognition Awards Nomination Spatial Data Availability Energizes Florida s Citizens State of Florida Agency for State Technology & Department of Environmental Protection Category: ICT Innovations
Assignment 1: Due Friday Feb 6 at 6pm
 CS1110 Spring 2015 Assignment 1: Due Friday Feb 6 at 6pm You must work either on your own or with one partner. If you work with a partner, you and your partner must first register as a group in CMS and
Unit 6 Quadratic Relations of the Form y = ax 2 + bx + c
 Unit 6 Quadratic Relations of the Form y = ax 2 + bx + c Lesson Outline BIG PICTURE Students will: manipulate algebraic expressions, as needed to understand quadratic relations; identify characteristics
CSE332: Data Structures & Parallelism Lecture 2: Algorithm Analysis. Ruth Anderson Winter 2019
 CSE332: Data Structures & Parallelism Lecture 2: Algorithm Analysis Ruth Anderson Winter 2019 Today Algorithm Analysis What do we care about? How to compare two algorithms Analyzing Code Asymptotic Analysis
Geovisualization. CSISS Workshop, Ann Arbor. May Mark Gahegan, GeoVISTA Center, Department of Geography, Penn State university
 Geovisualization CSISS Workshop, Ann Arbor. May 2001 Mark Gahegan, GeoVISTA Center, Department of Geography, Penn State university Introduction Visualization is an emerging science that draws from a rich
CS 361: Probability & Statistics
 January 24, 2018 CS 361: Probability & Statistics Relationships in data Standard coordinates If we have two quantities of interest in a dataset, we might like to plot their histograms and compare the two
WHAT IS LIFE? / MIND AND MATTER BY ERWIN SCHRODINGER DOWNLOAD EBOOK : WHAT IS LIFE? / MIND AND MATTER BY ERWIN SCHRODINGER PDF
 Read Online and Download Ebook WHAT IS LIFE? / MIND AND MATTER BY ERWIN SCHRODINGER DOWNLOAD EBOOK : WHAT IS LIFE? / MIND AND MATTER BY ERWIN Click link bellow and free register to download ebook: WHAT
HISTORY 1XX/ DH 1XX. Introduction to Geospatial Humanities. Instructor: Zephyr Frank, Associate Professor, History Department Office: Building
 HISTORY 1XX/ DH 1XX Introduction to Geospatial Humanities Instructor: Zephyr Frank, Associate Professor, History Department Office: Building 200-332 Course Description This course introduces undergraduate
Activity Title: It s Either Very Hot or Very Cold Up There!
 Grades 3-5 Teacher Pages Activity Title: It s Either Very Hot or Very Cold Up There! Activity Objective(s): In this activity, and the follow-up activity next week, teams will design and conduct experiments
Please bring the task to your first physics lesson and hand it to the teacher.
 Pre-enrolment task for 2014 entry Physics Why do I need to complete a pre-enrolment task? This bridging pack serves a number of purposes. It gives you practice in some of the important skills you will
Biostatistics and Design of Experiments Prof. Mukesh Doble Department of Biotechnology Indian Institute of Technology, Madras
 Biostatistics and Design of Experiments Prof. Mukesh Doble Department of Biotechnology Indian Institute of Technology, Madras Lecture - 39 Regression Analysis Hello and welcome to the course on Biostatistics
Page 1 of 5. New: evidence, measure, nutrients, light, soil, transport, volume, water, warmth, insect, pollen, pollinate, nectar.
 National Curriculum Objectives: (Statutory requirements) a) Identify and describe the functions of different parts of flowering : roots, stem/trunk, leaves and flowers b) Explore the requirements of for
DATA 301 Introduction to Data Analytics Geographic Information Systems
 DATA 301 Introduction to Data Analytics Geographic Information Systems Dr. Ramon Lawrence University of British Columbia Okanagan ramon.lawrence@ubc.ca DATA 301: Data Analytics (2) Why learn Geographic
CS1110 Lab 3 (Feb 10-11, 2015)
") CS1110 Lab 3 (Feb 10-11, 2015) First Name: Last Name: NetID: The lab assignments are very important and you must have a CS 1110 course consultant tell CMS that you did the work. (Correctness does not matter.)
CS1110 Lab 3 (Feb 10-11, 2015) First Name: Last Name: NetID: The lab assignments are very important and you must have a CS 1110 course consultant tell CMS that you did the work. (Correctness does not matter.)