CS 361: Probability & Statistics
|
|
|
- Phebe Hawkins
- 5 years ago
- Views:
Transcription
1 January 24, 2018 CS 361: Probability & Statistics Relationships in data
2 Standard coordinates If we have two quantities of interest in a dataset, we might like to plot their histograms and compare the two quantities, even if they have different units or measure entirely different things If we wanted to compare a histogram of internship earnings and GPA to see if there s something similar about the histograms, how to proceed?
3 Standard coordinates A transformation of the dataset Create a new dataset mean from each data item with standardized location subtract the And standardized scale divide each data item by the standard deviation is dimensionless, has 0 mean, and unit standard deviation

4 Standard coordinates Recipe for computing standard coordinates from your dataset


5 Standard normal data A wide variety of data, when standardized, will have a particular look and even fit a particular mathematical curve.
6 Boxplots Another type of visualization
7 How to make a box plot Height of the box is from q1 to q3, width is whatever makes it look nice Identify the median Use a rule for outliers: bigger than q (iqr) or smaller than q1-1.5(iqr) for example Whiskers extend to the largest data item which isn t an outlier and smallest data item which isn t an outlier Outlier data points indicated
8 Chapter 2: Relationships in data
9 Relationships Most of what we have covered so far has been about visualizing or describing a single dimension of a dataset We may be interested in how two or more dimensions of a dataset relate to one another We might expect there to be a relationship among: temperature and latitude, height and weight, hours spent studying and GPA, etc.
10 Visualizing relationships

11 Plotting 2d categorical data We could try and collapse two categorical variables with m and n different values into a single variable with mn values and use a bar chart What could go wrong? mn could be too large for the chart to be readable

12 Pie charts An alternative is a pie chart Small differences may be hard to judge, though

13 Stacked bar charts
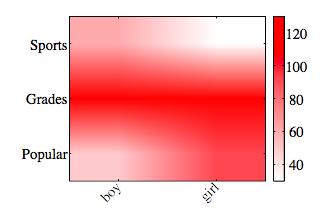
14 Heat Maps

15 3D bar charts

16 3D bar charts occlusion
17 Time series and spatial data
18 Time series data Sometimes there is something in the data that indicates an ordering in time for the data (month, day, year, etc) Plot the points Connect with lines Trends: upwards, downwards, periodic? Ask yourself what s happening before and after the cutoffs chosen

19 Time series
20 Relationships in time series We can visually inspect a relationship between two variables in a dataset with these plots Why might the number of pelts be periodic? The price?

21 Plotting spatial data


22 Spatial data and Cholera

23 Spatial data
24 Scatterplots
25 Visualizing two variables: scatterplots 2D plot with one numerical variable on each axis
26 Scatterplots Choose 2 of the d variables in your dataset that you re interested in investigating for some relationship Call one of the variables x and one y Creating a new dataset Then plot a mark on a graph for each data item at the (x,y) coordinate given by the 2 variables you ve chosen to look at It doesn t really matter which is x and y (what if we flipped them?)
27 Including more information It s possible to use point size, point color, or different types of points (x s and o s for instance) to indicate the values of other variables in the plot Any difference between sex 1 and 2? Relationship between temp and HR?
28 Scale matters The same dataset, outliers removed, two different axis scales
29 Normalization The top figure shows the time series data, the bottom two are the same data on a scatter plot In the bottom left, it s hard to see the law of supply and demand. Normalization reveals that this is a scaling artifact
30 Scatterplots summary A good first choice when dealing with 2 numerical dimensions of data Scale matters, so it s a good idea to use standard coordinates May want to remove outliers or unusual data
31 Correlation
32 Correlation Broadly, if x changes, what does y do? If a small x and small y (respectively large x and large y) tend to occur together we say there is positive correlation between x and y
33 Correlation If small values of x tend to occur with large values of y and large values of x tend to occur with small values of y we say that x and y are negatively correlated
34 Correlation When there is no tendency for x and y to be either large or small together, we say there is zero correlation Our data will be more of a blob
35 Examples Lines of code in a codebase and number of bugs? Body temperature and height? GPA and hours spent playing video games? Earnings and happiness?
36 Correlation coefficient Suppose we have N data items that are each 2-vectors Normalize the data The correlation coefficient of x and y is the mean of the product, i.e.
37 Properties of correlation Correlation coefficient is symmetric Not changed by translating data Scaling may change the sign
38 Properties of correlation How do these two conceptualizations line up?
39 Properties of correlation The largest possible correlation is 1 and happens when The smallest possible correlation is -1 and happens when
40 Proving correlation bounds Proposition: First note that the correlation can be written as a dot product of two vectors Let and We have or Either But or which is Recall
41 Proof Since is our standardized dataset, we have Similar reasoning applies for y So we know that And since We ve shown that
42 Using correlation to predict One useful task is to take what we know about the data we have and make predictions about data we don t yet have or measurements we have that are incomplete Example: we might like to go into the fur pelt business and have a bunch of historical data on supply and prices. We know the price today and would like to guess as to the total supply That is we have a bunch of pairs (x,y) for prices and supply. But our state of knowledge today might be (x_0,???) Correlation will be useful for this task
43 Prediction We want a predictor that we can apply to any x We want it to behave well on our existing data We can choose the predictor by considering the error the predictor will have
44 Prediction Since it s possible to convert to and from standard coordinates and we know standard coordinates have nice properties like 0 mean and 1 standard deviation, we will first convert We will write to indicate our predicted value of for the point
PS2.1 & 2.2: Linear Correlations PS2: Bivariate Statistics
 PS2.1 & 2.2: Linear Correlations PS2: Bivariate Statistics LT1: Basics of Correlation LT2: Measuring Correlation and Line of best fit by eye Univariate (one variable) Displays Frequency tables Bar graphs
P8130: Biostatistical Methods I
 P8130: Biostatistical Methods I Lecture 2: Descriptive Statistics Cody Chiuzan, PhD Department of Biostatistics Mailman School of Public Health (MSPH) Lecture 1: Recap Intro to Biostatistics Types of Data
Stat 101 Exam 1 Important Formulas and Concepts 1
 1 Chapter 1 1.1 Definitions Stat 101 Exam 1 Important Formulas and Concepts 1 1. Data Any collection of numbers, characters, images, or other items that provide information about something. 2. Categorical/Qualitative
Chapter 2: Tools for Exploring Univariate Data
 Stats 11 (Fall 2004) Lecture Note Introduction to Statistical Methods for Business and Economics Instructor: Hongquan Xu Chapter 2: Tools for Exploring Univariate Data Section 2.1: Introduction What is
Where Is Newton Taking Us? And How Fast?
 Name: Where Is Newton Taking Us? And How Fast? In this activity, you ll use a computer applet to investigate patterns in the way the approximations of Newton s Methods settle down to a solution of the
TOPIC: Descriptive Statistics Single Variable
 TOPIC: Descriptive Statistics Single Variable I. Numerical data summary measurements A. Measures of Location. Measures of central tendency Mean; Median; Mode. Quantiles - measures of noncentral tendency
Alex s Guide to Word Problems and Linear Equations Following Glencoe Algebra 1
 Alex s Guide to Word Problems and Linear Equations Following Glencoe Algebra 1 What is a linear equation? It sounds fancy, but linear equation means the same thing as a line. In other words, it s an equation
MATH 1150 Chapter 2 Notation and Terminology
 MATH 1150 Chapter 2 Notation and Terminology Categorical Data The following is a dataset for 30 randomly selected adults in the U.S., showing the values of two categorical variables: whether or not the
Announcements. Lecture 1 - Data and Data Summaries. Data. Numerical Data. all variables. continuous discrete. Homework 1 - Out 1/15, due 1/22
 Announcements Announcements Lecture 1 - Data and Data Summaries Statistics 102 Colin Rundel January 13, 2013 Homework 1 - Out 1/15, due 1/22 Lab 1 - Tomorrow RStudio accounts created this evening Try logging
Determining the Spread of a Distribution
 Determining the Spread of a Distribution 1.3-1.5 Cathy Poliak, Ph.D. cathy@math.uh.edu Department of Mathematics University of Houston Lecture 3-2311 Lecture 3-2311 1 / 58 Outline 1 Describing Quantitative
Elementary Statistics
 Elementary Statistics Q: What is data? Q: What does the data look like? Q: What conclusions can we draw from the data? Q: Where is the middle of the data? Q: Why is the spread of the data important? Q:
Determining the Spread of a Distribution
 Determining the Spread of a Distribution 1.3-1.5 Cathy Poliak, Ph.D. cathy@math.uh.edu Department of Mathematics University of Houston Lecture 3-2311 Lecture 3-2311 1 / 58 Outline 1 Describing Quantitative
Chapter 1:Descriptive statistics
 Slide 1.1 Chapter 1:Descriptive statistics Descriptive statistics summarises a mass of information. We may use graphical and/or numerical methods Examples of the former are the bar chart and XY chart,
For instance, we want to know whether freshmen with parents of BA degree are predicted to get higher GPA than those with parents without BA degree.
 DESCRIPTIVE ANALYSIS For instance, we want to know whether freshmen with parents of BA degree are predicted to get higher GPA than those with parents without BA degree. Assume that we have data; what information
Chapter 1. Looking at Data
 Chapter 1 Looking at Data Types of variables Looking at Data Be sure that each variable really does measure what you want it to. A poor choice of variables can lead to misleading conclusions!! For example,
Chapter 8. Linear Regression. Copyright 2010 Pearson Education, Inc.
 Chapter 8 Linear Regression Copyright 2010 Pearson Education, Inc. Fat Versus Protein: An Example The following is a scatterplot of total fat versus protein for 30 items on the Burger King menu: Copyright
STP 420 INTRODUCTION TO APPLIED STATISTICS NOTES
 INTRODUCTION TO APPLIED STATISTICS NOTES PART - DATA CHAPTER LOOKING AT DATA - DISTRIBUTIONS Individuals objects described by a set of data (people, animals, things) - all the data for one individual make
What is statistics? Statistics is the science of: Collecting information. Organizing and summarizing the information collected
 What is statistics? Statistics is the science of: Collecting information Organizing and summarizing the information collected Analyzing the information collected in order to draw conclusions Two types
Further Mathematics 2018 CORE: Data analysis Chapter 2 Summarising numerical data
 Chapter 2: Summarising numerical data Further Mathematics 2018 CORE: Data analysis Chapter 2 Summarising numerical data Extract from Study Design Key knowledge Types of data: categorical (nominal and ordinal)
appstats8.notebook October 11, 2016
 Chapter 8 Linear Regression Objective: Students will construct and analyze a linear model for a given set of data. Fat Versus Protein: An Example pg 168 The following is a scatterplot of total fat versus
AP Final Review II Exploring Data (20% 30%)
") AP Final Review II Exploring Data (20% 30%) Quantitative vs Categorical Variables Quantitative variables are numerical values for which arithmetic operations such as means make sense. It is usually a measure
AP Final Review II Exploring Data (20% 30%) Quantitative vs Categorical Variables Quantitative variables are numerical values for which arithmetic operations such as means make sense. It is usually a measure
Chapter 1 Review of Equations and Inequalities
 Chapter 1 Review of Equations and Inequalities Part I Review of Basic Equations Recall that an equation is an expression with an equal sign in the middle. Also recall that, if a question asks you to solve
Descriptive Univariate Statistics and Bivariate Correlation
 ESC 100 Exploring Engineering Descriptive Univariate Statistics and Bivariate Correlation Instructor: Sudhir Khetan, Ph.D. Wednesday/Friday, October 17/19, 2012 The Central Dogma of Statistics used to
Solving Equations by Adding and Subtracting
 SECTION 2.1 Solving Equations by Adding and Subtracting 2.1 OBJECTIVES 1. Determine whether a given number is a solution for an equation 2. Use the addition property to solve equations 3. Determine whether
Correlation. January 11, 2018
 Correlation January 11, 2018 Contents Correlations The Scattterplot The Pearson correlation The computational raw-score formula Survey data Fun facts about r Sensitivity to outliers Spearman rank-order
1. Descriptive stats methods for organizing and summarizing information
 Two basic types of statistics: 1. Descriptive stats methods for organizing and summarizing information Stats in sports are a great example Usually we use graphs, charts, and tables showing averages and
In this investigation you will use the statistics skills that you learned the to display and analyze a cup of peanut M&Ms.
 M&M Madness In this investigation you will use the statistics skills that you learned the to display and analyze a cup of peanut M&Ms. Part I: Categorical Analysis: M&M Color Distribution 1. Record the
Chapter 1 Describing Data
 Chapter 1 Describing Data Variable Basics Def: A Variable is any characteristic of an individual. Def: Individuals are the objects described by data. Note the term individual is somewhat flawed. Sometimes
CS 124 Math Review Section January 29, 2018
 CS 124 Math Review Section CS 124 is more math intensive than most of the introductory courses in the department. You re going to need to be able to do two things: 1. Perform some clever calculations to
Linear Regression. Linear Regression. Linear Regression. Did You Mean Association Or Correlation?
 Did You Mean Association Or Correlation? AP Statistics Chapter 8 Be careful not to use the word correlation when you really mean association. Often times people will incorrectly use the word correlation
Chapter 8. Linear Regression. The Linear Model. Fat Versus Protein: An Example. The Linear Model (cont.) Residuals
 Residuals") Chapter 8 Linear Regression Copyright 2007 Pearson Education, Inc. Publishing as Pearson Addison-Wesley Slide 8-1 Copyright 2007 Pearson Education, Inc. Publishing as Pearson Addison-Wesley Fat Versus
Chapter 8 Linear Regression Copyright 2007 Pearson Education, Inc. Publishing as Pearson Addison-Wesley Slide 8-1 Copyright 2007 Pearson Education, Inc. Publishing as Pearson Addison-Wesley Fat Versus
Topic 3: Introduction to Statistics. Algebra 1. Collecting Data. Table of Contents. Categorical or Quantitative? What is the Study of Statistics?!
 Topic 3: Introduction to Statistics Collecting Data We collect data through observation, surveys and experiments. We can collect two different types of data: Categorical Quantitative Algebra 1 Table of
( )( b + c) = ab + ac, but it can also be ( )( a) = ba + ca. Let s use the distributive property on a couple of
( b + c) = ab + ac, but it can also be ( )( a) = ba + ca. Let s use the distributive property on a couple of") Factoring Review for Algebra II The saddest thing about not doing well in Algebra II is that almost any math teacher can tell you going into it what s going to trip you up. One of the first things they
Factoring Review for Algebra II The saddest thing about not doing well in Algebra II is that almost any math teacher can tell you going into it what s going to trip you up. One of the first things they
1 Measures of the Center of a Distribution
 1 Measures of the Center of a Distribution Qualitative descriptions of the shape of a distribution are important and useful. But we will often desire the precision of numerical summaries as well. Two aspects
1-1. Chapter 1. Sampling and Descriptive Statistics by The McGraw-Hill Companies, Inc. All rights reserved.
 1-1 Chapter 1 Sampling and Descriptive Statistics 1-2 Why Statistics? Deal with uncertainty in repeated scientific measurements Draw conclusions from data Design valid experiments and draw reliable conclusions
BIOL 51A - Biostatistics 1 1. Lecture 1: Intro to Biostatistics. Smoking: hazardous? FEV (l) Smoke
 Smoke") BIOL 51A - Biostatistics 1 1 Lecture 1: Intro to Biostatistics Smoking: hazardous? FEV (l) 1 2 3 4 5 No Yes Smoke BIOL 51A - Biostatistics 1 2 Box Plot a.k.a box-and-whisker diagram or candlestick chart
BIOL 51A - Biostatistics 1 1 Lecture 1: Intro to Biostatistics Smoking: hazardous? FEV (l) 1 2 3 4 5 No Yes Smoke BIOL 51A - Biostatistics 1 2 Box Plot a.k.a box-and-whisker diagram or candlestick chart
, (1) e i = ˆσ 1 h ii. c 2016, Jeffrey S. Simonoff 1
 e i = ˆσ 1 h ii. c 2016, Jeffrey S. Simonoff 1") Regression diagnostics As is true of all statistical methodologies, linear regression analysis can be a very effective way to model data, as along as the assumptions being made are true. For the regression
Regression diagnostics As is true of all statistical methodologies, linear regression analysis can be a very effective way to model data, as along as the assumptions being made are true. For the regression
Math101, Sections 2 and 3, Spring 2008 Review Sheet for Exam #2:
 Math101, Sections 2 and 3, Spring 2008 Review Sheet for Exam #2: 03 17 08 3 All about lines 3.1 The Rectangular Coordinate System Know how to plot points in the rectangular coordinate system. Know the
#29: Logarithm review May 16, 2009
 #29: Logarithm review May 16, 2009 This week we re going to spend some time reviewing. I say re- view since you ve probably seen them before in theory, but if my experience is any guide, it s quite likely
Descriptive Data Summarization
 Descriptive Data Summarization Descriptive data summarization gives the general characteristics of the data and identify the presence of noise or outliers, which is useful for successful data cleaning
Approximate Linear Relationships
 Approximate Linear Relationships In the real world, rarely do things follow trends perfectly. When the trend is expected to behave linearly, or when inspection suggests the trend is behaving linearly,
Numbers and Operations Review
 C H A P T E R 5 Numbers and Operations Review This chapter reviews key concepts of numbers and operations that you need to know for the SAT. Throughout the chapter are sample questions in the style of
Describing Data: Two Variables
 STAT 250 Dr. Kari Lock Morgan Describing Data: Two Variables SECTIONS 2.4, 2.5 One quantitative variable (2.4) One quantitative and one categorical (2.4) Two quantitative (2.5) z- score Which is better,
Chapter 7: Statistics Describing Data. Chapter 7: Statistics Describing Data 1 / 27
 Chapter 7: Statistics Describing Data Chapter 7: Statistics Describing Data 1 / 27 Categorical Data Four ways to display categorical data: 1 Frequency and Relative Frequency Table 2 Bar graph (Pareto chart)
Lesson Plan. Answer Questions. Summary Statistics. Histograms. The Normal Distribution. Using the Standard Normal Table
 Lesson Plan Answer Questions Summary Statistics Histograms The Normal Distribution Using the Standard Normal Table 1 2. Summary Statistics Given a collection of data, one needs to find representations
20 Hypothesis Testing, Part I
 20 Hypothesis Testing, Part I Bob has told Alice that the average hourly rate for a lawyer in Virginia is $200 with a standard deviation of $50, but Alice wants to test this claim. If Bob is right, she
Describing Distributions
 Describing Distributions With Numbers April 18, 2012 Summary Statistics. Measures of Center. Percentiles. Measures of Spread. A Summary Statement. Choosing Numerical Summaries. 1.0 What Are Summary Statistics?
BNG 495 Capstone Design. Descriptive Statistics
 BNG 495 Capstone Design Descriptive Statistics Overview The overall goal of this short course in statistics is to provide an introduction to descriptive and inferential statistical methods, with a focus
4.3 Rational Inequalities and Applications
 342 Rational Functions 4.3 Rational Inequalities and Applications In this section, we solve equations and inequalities involving rational functions and eplore associated application problems. Our first
Describing distributions with numbers
 Describing distributions with numbers A large number or numerical methods are available for describing quantitative data sets. Most of these methods measure one of two data characteristics: The central
Performance of fourth-grade students on an agility test
 Starter Ch. 5 2005 #1a CW Ch. 4: Regression L1 L2 87 88 84 86 83 73 81 67 78 83 65 80 50 78 78? 93? 86? Create a scatterplot Find the equation of the regression line Predict the scores Chapter 5: Understanding
Chapter 5. Understanding and Comparing. Distributions
 STAT 141 Introduction to Statistics Chapter 5 Understanding and Comparing Distributions Bin Zou (bzou@ualberta.ca) STAT 141 University of Alberta Winter 2015 1 / 27 Boxplots How to create a boxplot? Assume
Visualizing Data: Basic Plot Types
 Visualizing Data: Basic Plot Types Data Science 101 Stanford University, Department of Statistics Agenda Today s lecture focuses on these basic plot types: bar charts histograms boxplots scatter plots
Lecture Notes 2: Variables and graphics
 Highlights: Lecture Notes 2: Variables and graphics Quantitative vs. qualitative variables Continuous vs. discrete and ordinal vs. nominal variables Frequency distributions Pie charts Bar charts Histograms
Rising 7 th Grade Summer Assignment
 Rising 7 th Grade Summer Assignment Concept 1 - Negative Numbers/Absolute Value (6.NS.5, 6a, 7abcd) Negative Numbers On a number line, numbers get to the right and to the left. Any number to the left of
are the objects described by a set of data. They may be people, animals or things.
 ( c ) E p s t e i n, C a r t e r a n d B o l l i n g e r 2016 C h a p t e r 5 : E x p l o r i n g D a t a : D i s t r i b u t i o n s P a g e 1 CHAPTER 5: EXPLORING DATA DISTRIBUTIONS 5.1 Creating Histograms
What is the association of between the two variables? In what direction does the association go?
 Common Core Standard: 8.SP.4 What is the association of between the two variables? In what direction does the association go? How strong is the association between the two variables? CPM Materials modified
M & M Project. Think! Crunch those numbers! Answer!
 M & M Project Think! Crunch those numbers! Answer! Chapters 1-2 Exploring Data and Describing Location in a Distribution Univariate Data: Length Stemplot and Frequency Table Stem (Units Digit) 0 1 1 Leaf
Math 223 Lecture Notes 3/15/04 From The Basic Practice of Statistics, bymoore
 Math 223 Lecture Notes 3/15/04 From The Basic Practice of Statistics, bymoore Chapter 3 continued Describing distributions with numbers Measuring spread of data: Quartiles Definition 1: The interquartile
Chapter 1: Exploring Data
 Chapter 1: Exploring Data Section 1.3 with Numbers The Practice of Statistics, 4 th edition - For AP* STARNES, YATES, MOORE Chapter 1 Exploring Data Introduction: Data Analysis: Making Sense of Data 1.1
Business Statistics. Lecture 10: Course Review
 Business Statistics Lecture 10: Course Review 1 Descriptive Statistics for Continuous Data Numerical Summaries Location: mean, median Spread or variability: variance, standard deviation, range, percentiles,
1. Exploratory Data Analysis
 1. Exploratory Data Analysis 1.1 Methods of Displaying Data A visual display aids understanding and can highlight features which may be worth exploring more formally. Displays should have impact and be
CS 5630/6630 Scientific Visualization. Elementary Plotting Techniques II
 CS 5630/6630 Scientific Visualization Elementary Plotting Techniques II Motivation Given a certain type of data, what plotting technique should I use? What plotting techniques should be avoided? How do
Math 140 Introductory Statistics
 Math 140 Introductory Statistics Professor Silvia Fernández Chapter 2 Based on the book Statistics in Action by A. Watkins, R. Scheaffer, and G. Cobb. Visualizing Distributions Recall the definition: The
Math 140 Introductory Statistics
 Visualizing Distributions Math 140 Introductory Statistics Professor Silvia Fernández Chapter Based on the book Statistics in Action by A. Watkins, R. Scheaffer, and G. Cobb. Recall the definition: The
2 Analogies between addition and multiplication
 Problem Analysis The problem Start out with 99% water. Some of the water evaporates, end up with 98% water. How much of the water evaporates? Guesses Solution: Guesses: Not %. 2%. 5%. Not 00%. 3%..0%..5%.
I started to think that maybe I could just distribute the log so that I get:
 2.3 Chopping Logs A Solidify Understanding Task Abe and Mary were working on their math homework together when Abe has a brilliant idea Abe: I was just looking at this log function that we graphed in Falling
STA Module 5 Regression and Correlation. Learning Objectives. Learning Objectives (Cont.) Upon completing this module, you should be able to:
 Upon completing this module, you should be able to:") STA 2023 Module 5 Regression and Correlation Learning Objectives Upon completing this module, you should be able to: 1. Define and apply the concepts related to linear equations with one independent variable.
STA 2023 Module 5 Regression and Correlation Learning Objectives Upon completing this module, you should be able to: 1. Define and apply the concepts related to linear equations with one independent variable.
2.1 Definition. Let n be a positive integer. An n-dimensional vector is an ordered list of n real numbers.
 2 VECTORS, POINTS, and LINEAR ALGEBRA. At first glance, vectors seem to be very simple. It is easy enough to draw vector arrows, and the operations (vector addition, dot product, etc.) are also easy to
STT 315 This lecture is based on Chapter 2 of the textbook.
 STT 315 This lecture is based on Chapter 2 of the textbook. Acknowledgement: Author is thankful to Dr. Ashok Sinha, Dr. Jennifer Kaplan and Dr. Parthanil Roy for allowing him to use/edit some of their
Nicole Dalzell. July 2, 2014
 UNIT 1: INTRODUCTION TO DATA LECTURE 3: EDA (CONT.) AND INTRODUCTION TO STATISTICAL INFERENCE VIA SIMULATION STATISTICS 101 Nicole Dalzell July 2, 2014 Teams and Announcements Team1 = Houdan Sai Cui Huanqi
5.2 Infinite Series Brian E. Veitch
 5. Infinite Series Since many quantities show up that cannot be computed exactly, we need some way of representing it (or approximating it). One way is to sum an infinite series. Recall that a n is the
Vocabulary: Samples and Populations
 Vocabulary: Samples and Populations Concept Different types of data Categorical data results when the question asked in a survey or sample can be answered with a nonnumerical answer. For example if we
1. Create a scatterplot of this data. 2. Find the correlation coefficient.
 How Fast Foods Compare Company Entree Total Calories Fat (grams) McDonald s Big Mac 540 29 Filet o Fish 380 18 Burger King Whopper 670 40 Big Fish Sandwich 640 32 Wendy s Single Burger 470 21 1. Create
Keystone Exams: Algebra
 KeystoneExams:Algebra TheKeystoneGlossaryincludestermsanddefinitionsassociatedwiththeKeystoneAssessmentAnchorsand Eligible Content. The terms and definitions included in the glossary are intended to assist
Analytical Graphing. lets start with the best graph ever made
 Analytical Graphing lets start with the best graph ever made Probably the best statistical graphic ever drawn, this map by Charles Joseph Minard portrays the losses suffered by Napoleon's army in the Russian
Section 3.3 Maximum and Minimum Values
 Section 3.3 Maximum and Minimum Values Definition For a function f defined on a set S of real numbers and a number c in S. A) f(c) is called the absolute maximum of f on S if f(c) f(x) for all x in S.
CS 147: Computer Systems Performance Analysis
 CS 147: Computer Systems Performance Analysis Advanced Regression Techniques CS 147: Computer Systems Performance Analysis Advanced Regression Techniques 1 / 31 Overview Overview Overview Common Transformations
Revised: 2/19/09 Unit 1 Pre-Algebra Concepts and Operations Review
 2/19/09 Unit 1 Pre-Algebra Concepts and Operations Review 1. How do algebraic concepts represent real-life situations? 2. Why are algebraic expressions and equations useful? 2. Operations on rational numbers
Describing Distributions With Numbers
 Describing Distributions With Numbers October 24, 2012 What Do We Usually Summarize? Measures of Center. Percentiles. Measures of Spread. A Summary Statement. Choosing Numerical Summaries. 1.0 What Do
How are molecular formulas different from empirical formulas? Can they ever be the same for a particular substance?
 Chapter 3 Reading Guide Tro 4 th edition Suggested Problems: balancing equations is very time consuming in MC, so there are no assigned problems. Don't ignore this though, you need to practice. Use worksheet
1 Review of the dot product
 Any typographical or other corrections about these notes are welcome. Review of the dot product The dot product on R n is an operation that takes two vectors and returns a number. It is defined by n u
Simple Regression Model. January 24, 2011
 Simple Regression Model January 24, 2011 Outline Descriptive Analysis Causal Estimation Forecasting Regression Model We are actually going to derive the linear regression model in 3 very different ways
irst we need to know that there are many ways to indicate multiplication; for example the product of 5 and 7 can be written in a variety of ways:
 CH 2 VARIABLES INTRODUCTION F irst we need to know that there are many ways to indicate multiplication; for example the product of 5 and 7 can be written in a variety of ways: 5 7 5 7 5(7) (5)7 (5)(7)
Unit 2. Describing Data: Numerical
 Unit 2 Describing Data: Numerical Describing Data Numerically Describing Data Numerically Central Tendency Arithmetic Mean Median Mode Variation Range Interquartile Range Variance Standard Deviation Coefficient
2.0 Lesson Plan. Answer Questions. Summary Statistics. Histograms. The Normal Distribution. Using the Standard Normal Table
 2.0 Lesson Plan Answer Questions 1 Summary Statistics Histograms The Normal Distribution Using the Standard Normal Table 2. Summary Statistics Given a collection of data, one needs to find representations
1.3: Describing Quantitative Data with Numbers
 1.3: Describing Quantitative Data with Numbers Section 1.3 Describing Quantitative Data with Numbers After this section, you should be able to MEASURE center with the mean and median MEASURE spread with
AP Statistics. Chapter 6 Scatterplots, Association, and Correlation
 AP Statistics Chapter 6 Scatterplots, Association, and Correlation Objectives: Scatterplots Association Outliers Response Variable Explanatory Variable Correlation Correlation Coefficient Lurking Variables
MA 1125 Lecture 15 - The Standard Normal Distribution. Friday, October 6, Objectives: Introduce the standard normal distribution and table.
 MA 1125 Lecture 15 - The Standard Normal Distribution Friday, October 6, 2017. Objectives: Introduce the standard normal distribution and table. 1. The Standard Normal Distribution We ve been looking at
Chapter 1: Why is my evil lecturer forcing me to learn statistics?
 Chapter 1: Why is my evil lecturer forcing me to learn statistics? Smart Alex s Solutions Task 1 What are (broadly speaking) the five stages of the research process? 1. Generating a research question:
Bag RED ORANGE GREEN YELLOW PURPLE Candies per Bag
 Skittles Project For this project our entire class when out and bought a standard 2.17 ounce bag of skittles. Before we ate them, we recorded all of our data, the amount of skittles in our bag and the
2011 Pearson Education, Inc
 Statistics for Business and Economics Chapter 2 Methods for Describing Sets of Data Summary of Central Tendency Measures Measure Formula Description Mean x i / n Balance Point Median ( n +1) Middle Value
STAT 200 Chapter 1 Looking at Data - Distributions
 STAT 200 Chapter 1 Looking at Data - Distributions What is Statistics? Statistics is a science that involves the design of studies, data collection, summarizing and analyzing the data, interpreting the
Lecture 3B: Chapter 4, Section 2 Quantitative Variables (Displays, Begin Summaries)
") Lecture 3B: Chapter 4, Section 2 Quantitative Variables (Displays, Begin Summaries) Summarize with Shape, Center, Spread Displays: Stemplots, Histograms Five Number Summary, Outliers, Boxplots Mean vs.
Lecture 3B: Chapter 4, Section 2 Quantitative Variables (Displays, Begin Summaries) Summarize with Shape, Center, Spread Displays: Stemplots, Histograms Five Number Summary, Outliers, Boxplots Mean vs.
Chapter 2. Mathematical Reasoning. 2.1 Mathematical Models
 Contents Mathematical Reasoning 3.1 Mathematical Models........................... 3. Mathematical Proof............................ 4..1 Structure of Proofs........................ 4.. Direct Method..........................
Statistics, continued
 Statistics, continued Visual Displays of Data Since numbers often do not resonate with people, giving visual representations of data is often uses to make the data more meaningful. We will talk about a
Example 2. Given the data below, complete the chart:
 Statistics 2035 Quiz 1 Solutions Example 1. 2 64 150 150 2 128 150 2 256 150 8 8 Example 2. Given the data below, complete the chart: 52.4, 68.1, 66.5, 75.0, 60.5, 78.8, 63.5, 48.9, 81.3 n=9 The data is
Describing Distributions With Numbers Chapter 12
 Describing Distributions With Numbers Chapter 12 May 1, 2013 What Do We Usually Summarize? Measures of Center. Percentiles. Measures of Spread. A Summary. 1.0 What Do We Usually Summarize? source: Prof.
Finite Mathematics : A Business Approach
 Finite Mathematics : A Business Approach Dr. Brian Travers and Prof. James Lampes Second Edition Cover Art by Stephanie Oxenford Additional Editing by John Gambino Contents What You Should Already Know
Unit C: Usage of Graphics in Agricultural Economics. Lesson 3: Understanding the Relationship of Data, Graphics, and Statistics
 Unit C: Usage of Graphics in Agricultural Economics Lesson 3: Understanding the Relationship of Data, Graphics, and Statistics 1 Terms Correlation Erratic Gradual Interpretation Mean Median Mode Negative