Bag RED ORANGE GREEN YELLOW PURPLE Candies per Bag
|
|
|
- Branden Fisher
- 5 years ago
- Views:
Transcription
1 Skittles Project For this project our entire class when out and bought a standard 2.17 ounce bag of skittles. Before we ate them, we recorded all of our data, the amount of skittles in our bag and the proportion of each color in the bag. We then complied all of our data into a large sample so we could compare our data to the class s. We are trying to figure out what the proportion of each color is in each bag of skittles. The class sample data will be compared to our own bag individual bag of skittles to see if there is a difference from the average amount of skittles in each bag, the color of each in every bag and how that compares to a single bag. The data below is all of the collective data from the class. The chart is each individual bag broken down by color and the number of candies in each bag. The average bag number of candies in the bag is 60 candies and for the most part each color is evenly distributed across the board. This is what I expected to see from the data, my personal data is a little more skewed than the collective data but it is fairly similar. With the average number of candies being 60 in each bag and my bag had 55, that is lower than what I would have expected but it isn t too unusual. Class Data: 330 Red Green Yellow Orange Puprle Purple Yellow Green Orange Red % 18% % 20% 270 Color of Skittles 21%
2 Bag RED ORANGE GREEN YELLOW PURPLE Candies per Bag Column Totals
3 Personal Data: Personal Bag Purple Green Yellow Orange Red 11% % 16% % 20% 0 RED YELLOW ORANGE GREEN PURPLE Bag RED ORANGE GREEN YELLOW PURPLE Candies per Bag Proportion Below are the graphs of quantitate data, data that can be counted. In this section we won t be looking at things such as color and focus of number of candies in each bag and how they compare to each other. The distribution of the candies are normally distributed, such as I had expected but the class data does differ from my personal data. Since I had a bag that contained only 55 candies my bag is considered to be on of the four outliers in the collective data set. Five Number Summary Minimum Value Quartile 1 Mean Quartile 3 Max Value
4
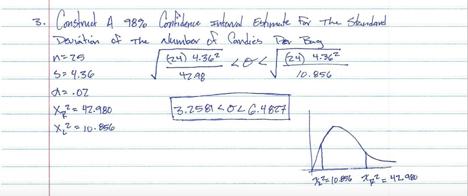
5 In reflection to this part of the assignment, the data that we have calculated is fairly close to what I had expected to see. The data is normally distributed, there are more outliers than I would have expected but for the most part it is pretty normal. A Pareto Chart and Pie Chart are the easiest graphs to use when showing categorical data simply because the show the proportion of each color very easily and clearly. A histogram wouldn t work for categorical data because the numerical data is along the x-axis of the graph which would make it impossible to show categorical data across that axis. Part 2 This next part of the project we will be looking at confidence intervals. I will construct three different confidence intervals with the given skittles data, the intervals show how accurate a study is. For example, the first confidence interval that we will be constructing is looking at the proportion of yellow candies to the whole bag. I will construct it with 99% confidence that the true proportion of yellow skittles in each bag is what I say it is, given a little bit of wiggle room, about one percent, which is the remaining percent taken out of 100. I conducted 3 different confidence intervals, one about the percentage of yellow skittles in each bag, the mean number of skittles in each bag and the standard deviation of skittles in each bag. The first calculation shows that in all of the candies in the world I am 99% sure that there is between 17.6% and 23% of candies are going to be yellow in any given bag of skittles. The second calculation shows that I m 95% sure that the mean, or average, number of candies in each bag is between 58.6 and 62.2 candies in each bag. The final calculation shows the standard deviation of the number of candies in each bag. This is saying that since there is an average, lets say 60 candies it would not be surprising if there were plus or minus about 5 candies in each bag. For the hypothesis testing the first calculation shows that we didn t reject the null hypothesis which is saying that there isn t enough evidence for us to deny the fact that there is a 20% of the candies in each bag are going to be red. The second hypothesis test is asking if there is a 99% chance that all of the bags of skittles have 55 candies in each of them. In this process we were able to reject our claim therefore saying I am not confident that 99% of all skittles bags have 55 candies in them. For each of these tests their are certain requirements to make sure that these tests are accurate. For each of the tests they must be from a simple random sample, in needs to be a binomial distribution, and for proportions, you must have at least five successes and five failures. Meaning that there needs to be at least five red candies and five other candies. For the second hypothesis test we did it has to be normally distributed, taken from a simple random sample, and be a binomial distribution. These processes were eye opening to me. I was surprised by a lot of the results that we received from the calculations made in the project. From this section we learned that all of the colors of skittles in each bag of candies is fairly close to even with a little bit of an error involved.
6
7
8 Nick Rowley Prof. Brenda Santistevan 12/2/14 Skittles Reflection I really enjoyed doing this Skittles project, I learned many valuable lessons during this project and am glad that I had the opportunity to do it. In the project we did many different equations and developed graphs and charts to show the relationship of the class and our own personal bag of skittles. The first part of the project we did we found the proportion of all of the color of skittles in our bag. Everyone in the class did this and we all submitted our data onto a spreadsheet so we could easily compare and contrast them to each others bags. This is the first time that I was able to put the concepts I had learned into real world situations. When I first started this project I figured that, for the most part, each Skittle color in the bag would be fairly evenly distributed. As I had predicted, they were. Another thing that I had learned from doing this project is that from a sample of data, as long as it is a simple random sample, you are able to predict about the correct proportion for a population. Meaning that with my bag of skittles that I had purchased I was able to predict about the average proportion of each color of candies in every bag in the history of the world. Granted it wouldn t be completely accurate but we can get a prediction that is close enough we could be able to use it. In conclusion, as I had stated earlier I am glad that I had the opportunity to do this project and take this class. This has shown me how to use the principles that we learned in class and how to use them in real life situations.
9
Chapter 26: Comparing Counts (Chi Square)
") Chapter 6: Comparing Counts (Chi Square) We ve seen that you can turn a qualitative variable into a quantitative one (by counting the number of successes and failures), but that s a compromise it forces
Chapter 6: Comparing Counts (Chi Square) We ve seen that you can turn a qualitative variable into a quantitative one (by counting the number of successes and failures), but that s a compromise it forces
Chi Square Analysis M&M Statistics. Name Period Date
 Chi Square Analysis M&M Statistics Name Period Date Have you ever wondered why the package of M&Ms you just bought never seems to have enough of your favorite color? Or, why is it that you always seem
M&M GEOLOGY INTRODUCTION
 M&M Geology 1 M&M GEOLOGY INTRODUCTION Geologists study the structure of the Earth. In order to define and determine that structure, geologists must study the types of minerals that make up the various
Do students sleep the recommended 8 hours a night on average?
 BIEB100. Professor Rifkin. Notes on Section 2.2, lecture of 27 January 2014. Do students sleep the recommended 8 hours a night on average? We first set up our null and alternative hypotheses: H0: μ= 8
Lesson 19: Understanding Variability When Estimating a Population Proportion
 Lesson 19: Understanding Variability When Estimating a Population Proportion Student Outcomes Students understand the term sampling variability in the context of estimating a population proportion. Students
In this investigation you will use the statistics skills that you learned the to display and analyze a cup of peanut M&Ms.
 M&M Madness In this investigation you will use the statistics skills that you learned the to display and analyze a cup of peanut M&Ms. Part I: Categorical Analysis: M&M Color Distribution 1. Record the
Probability Distributions
 Probability Distributions Probability This is not a math class, or an applied math class, or a statistics class; but it is a computer science course! Still, probability, which is a math-y concept underlies
20 Hypothesis Testing, Part I
 20 Hypothesis Testing, Part I Bob has told Alice that the average hourly rate for a lawyer in Virginia is $200 with a standard deviation of $50, but Alice wants to test this claim. If Bob is right, she
11-2 Multinomial Experiment
 Chapter 11 Multinomial Experiments and Contingency Tables 1 Chapter 11 Multinomial Experiments and Contingency Tables 11-11 Overview 11-2 Multinomial Experiments: Goodness-of-fitfit 11-3 Contingency Tables:
Chapter 10. Chapter 10. Multinomial Experiments and. Multinomial Experiments and Contingency Tables. Contingency Tables.
 Chapter 10 Multinomial Experiments and Contingency Tables 1 Chapter 10 Multinomial Experiments and Contingency Tables 10-1 1 Overview 10-2 2 Multinomial Experiments: of-fitfit 10-3 3 Contingency Tables:
Chapter 7: Statistics Describing Data. Chapter 7: Statistics Describing Data 1 / 27
 Chapter 7: Statistics Describing Data Chapter 7: Statistics Describing Data 1 / 27 Categorical Data Four ways to display categorical data: 1 Frequency and Relative Frequency Table 2 Bar graph (Pareto chart)
Math 221, REVIEW, Instructor: Susan Sun Nunamaker
 Math 221, REVIEW, Instructor: Susan Sun Nunamaker Good Luck & Contact me through through e-mail if you have any questions. 1. Bar graphs can only be vertical. a. true b. false 2.
8/4/2009. Describing Data with Graphs
 Describing Data with Graphs 1 A variable is a characteristic that changes or varies over time and/or for different individuals or objects under consideration. Examples: Hair color, white blood cell count,
Probability Distributions
 CONDENSED LESSON 13.1 Probability Distributions In this lesson, you Sketch the graph of the probability distribution for a continuous random variable Find probabilities by finding or approximating areas
LC OL - Statistics. Types of Data
 LC OL - Statistics Types of Data Question 1 Characterise each of the following variables as numerical or categorical. In each case, list any three possible values for the variable. (i) Eye colours in a
Categorical Data Analysis. The data are often just counts of how many things each category has.
 Categorical Data Analysis So far we ve been looking at continuous data arranged into one or two groups, where each group has more than one observation. E.g., a series of measurements on one or two things.
Experiment 2 Random Error and Basic Statistics
 PHY9 Experiment 2: Random Error and Basic Statistics 8/5/2006 Page Experiment 2 Random Error and Basic Statistics Homework 2: Turn in at start of experiment. Readings: Taylor chapter 4: introduction, sections
REVIEW: Midterm Exam. Spring 2012
 REVIEW: Midterm Exam Spring 2012 Introduction Important Definitions: - Data - Statistics - A Population - A census - A sample Types of Data Parameter (Describing a characteristic of the Population) Statistic
Dealing with the assumption of independence between samples - introducing the paired design.
 Dealing with the assumption of independence between samples - introducing the paired design. a) Suppose you deliberately collect one sample and measure something. Then you collect another sample in such
GAISE Framework 3. Formulate Question Collect Data Analyze Data Interpret Results
 Project-SET Variability Final Learning Trajectory 1,2 Loop 1 4 Concept of a Distribution GAISE Framework 3 Formulate Question Collect Data Analyze Data Interpret Results a. How can we discover a. Describe
Statistics, continued
 Statistics, continued Visual Displays of Data Since numbers often do not resonate with people, giving visual representations of data is often uses to make the data more meaningful. We will talk about a
Math 58. Rumbos Fall More Review Problems Solutions
 Math 58. Rumbos Fall 2008 1 More Review Problems Solutions 1. A particularly common question in the study of wildlife behavior involves observing contests between residents of a particular area and intruders.
Dover- Sherborn High School Mathematics Curriculum Probability and Statistics
 Mathematics Curriculum A. DESCRIPTION This is a full year courses designed to introduce students to the basic elements of statistics and probability. Emphasis is placed on understanding terminology and
Business Statistics. Lecture 9: Simple Regression
 Business Statistics Lecture 9: Simple Regression 1 On to Model Building! Up to now, class was about descriptive and inferential statistics Numerical and graphical summaries of data Confidence intervals
Inference for Proportions, Variance and Standard Deviation
 Inference for Proportions, Variance and Standard Deviation Sections 7.10 & 7.6 Cathy Poliak, Ph.D. cathy@math.uh.edu Office Fleming 11c Department of Mathematics University of Houston Lecture 12 Cathy
THE SAMPLING DISTRIBUTION OF THE MEAN
 THE SAMPLING DISTRIBUTION OF THE MEAN COGS 14B JANUARY 26, 2017 TODAY Sampling Distributions Sampling Distribution of the Mean Central Limit Theorem INFERENTIAL STATISTICS Inferential statistics: allows
Tables Table A Table B Table C Table D Table E 675
 BMTables.indd Page 675 11/15/11 4:25:16 PM user-s163 Tables Table A Standard Normal Probabilities Table B Random Digits Table C t Distribution Critical Values Table D Chi-square Distribution Critical Values
2275 Speedway, Mail Code C9000 Austin, TX (512) Weather and Climate
 Weather and Climate") Lesson Plan for Grades: Middle School Length of Lesson: 90 minutes Authored by: UT Environmental Science Institute Date created: 05/10/2017 Subject area/course: Mathematics Materials: Fun size bags of
Lesson Plan for Grades: Middle School Length of Lesson: 90 minutes Authored by: UT Environmental Science Institute Date created: 05/10/2017 Subject area/course: Mathematics Materials: Fun size bags of
One-sample categorical data: approximate inference
 One-sample categorical data: approximate inference Patrick Breheny October 6 Patrick Breheny Biostatistical Methods I (BIOS 5710) 1/25 Introduction It is relatively easy to think about the distribution
Ch. 11 Inference for Distributions of Categorical Data
 Ch. 11 Inference for Distributions of Categorical Data CH. 11 2 INFERENCES FOR RELATIONSHIPS The two sample z procedures from Ch. 10 allowed us to compare proportions of successes in two populations or
1. (25) Suppose that a bag of Skittles contains 20 Reds, 25 Yellows, 22 Purples, 15 Oranges and 18 Greens.
 Suppose that a bag of Skittles contains 20 Reds, 25 Yellows, 22 Purples, 15 Oranges and 18 Greens.") Final Exam Math 11 Name: You will need a calculator for some parts of the exam (TI-83 and TI-84 calculators are available to borrow at the front of the classroom). You should show enough work for me to
Final Exam Math 11 Name: You will need a calculator for some parts of the exam (TI-83 and TI-84 calculators are available to borrow at the front of the classroom). You should show enough work for me to
Algebra. Here are a couple of warnings to my students who may be here to get a copy of what happened on a day that you missed.
 This document was written and copyrighted by Paul Dawkins. Use of this document and its online version is governed by the Terms and Conditions of Use located at. The online version of this document is
Elementary Statistics Triola, Elementary Statistics 11/e Unit 17 The Basics of Hypotheses Testing
 (Section 8-2) Hypotheses testing is not all that different from confidence intervals, so let s do a quick review of the theory behind the latter. If it s our goal to estimate the mean of a population,
Final Exam STAT On a Pareto chart, the frequency should be represented on the A) X-axis B) regression C) Y-axis D) none of the above
 X-axis B) regression C) Y-axis D) none of the above") King Abdul Aziz University Faculty of Sciences Statistics Department Final Exam STAT 0 First Term 49-430 A 40 Name No ID: Section: You have 40 questions in 9 pages. You have 90 minutes to solve the exam.
King Abdul Aziz University Faculty of Sciences Statistics Department Final Exam STAT 0 First Term 49-430 A 40 Name No ID: Section: You have 40 questions in 9 pages. You have 90 minutes to solve the exam.
AP Statistics Cumulative AP Exam Study Guide
 AP Statistics Cumulative AP Eam Study Guide Chapters & 3 - Graphs Statistics the science of collecting, analyzing, and drawing conclusions from data. Descriptive methods of organizing and summarizing statistics
MATH 1150 Chapter 2 Notation and Terminology
 MATH 1150 Chapter 2 Notation and Terminology Categorical Data The following is a dataset for 30 randomly selected adults in the U.S., showing the values of two categorical variables: whether or not the
Harvard University. Rigorous Research in Engineering Education
 Statistical Inference Kari Lock Harvard University Department of Statistics Rigorous Research in Engineering Education 12/3/09 Statistical Inference You have a sample and want to use the data collected
Contingency Tables. Safety equipment in use Fatal Non-fatal Total. None 1, , ,128 Seat belt , ,878
 Contingency Tables I. Definition & Examples. A) Contingency tables are tables where we are looking at two (or more - but we won t cover three or more way tables, it s way too complicated) factors, each
AP Final Review II Exploring Data (20% 30%)
") AP Final Review II Exploring Data (20% 30%) Quantitative vs Categorical Variables Quantitative variables are numerical values for which arithmetic operations such as means make sense. It is usually a measure
AP Final Review II Exploring Data (20% 30%) Quantitative vs Categorical Variables Quantitative variables are numerical values for which arithmetic operations such as means make sense. It is usually a measure
Math101, Sections 2 and 3, Spring 2008 Review Sheet for Exam #2:
 Math101, Sections 2 and 3, Spring 2008 Review Sheet for Exam #2: 03 17 08 3 All about lines 3.1 The Rectangular Coordinate System Know how to plot points in the rectangular coordinate system. Know the
Part Possible Score Base 5 5 MC Total 50
 Stat 220 Final Exam December 16, 2004 Schafer NAME: ANDREW ID: Read This First: You have three hours to work on the exam. The other questions require you to work out answers to the questions; be sure to
Learning Objectives for Stat 225
 Learning Objectives for Stat 225 08/20/12 Introduction to Probability: Get some general ideas about probability, and learn how to use sample space to compute the probability of a specific event. Set Theory:
MA : Introductory Probability
 MA 320-001: Introductory Probability David Murrugarra Department of Mathematics, University of Kentucky http://www.math.uky.edu/~dmu228/ma320/ Spring 2017 David Murrugarra (University of Kentucky) MA 320:
MITOCW MIT8_01F16_W01PS05_360p
 MITOCW MIT8_01F16_W01PS05_360p You're standing at a traffic intersection. And you start to accelerate when the light turns green. Suppose that your acceleration as a function of time is a constant for
23. MORE HYPOTHESIS TESTING
 23. MORE HYPOTHESIS TESTING The Logic Behind Hypothesis Testing For simplicity, consider testing H 0 : µ = µ 0 against the two-sided alternative H A : µ µ 0. Even if H 0 is true (so that the expectation
Chapter 1. Looking at Data
 Chapter 1 Looking at Data Types of variables Looking at Data Be sure that each variable really does measure what you want it to. A poor choice of variables can lead to misleading conclusions!! For example,
Descriptive statistics
 Patrick Breheny February 6 Patrick Breheny to Biostatistics (171:161) 1/25 Tables and figures Human beings are not good at sifting through large streams of data; we understand data much better when it
STT 315 This lecture is based on Chapter 2 of the textbook.
 STT 315 This lecture is based on Chapter 2 of the textbook. Acknowledgement: Author is thankful to Dr. Ashok Sinha, Dr. Jennifer Kaplan and Dr. Parthanil Roy for allowing him to use/edit some of their
Linear Algebra, Summer 2011, pt. 3
 Linear Algebra, Summer 011, pt. 3 September 0, 011 Contents 1 Orthogonality. 1 1.1 The length of a vector....................... 1. Orthogonal vectors......................... 3 1.3 Orthogonal Subspaces.......................
Keller: Stats for Mgmt & Econ, 7th Ed July 17, 2006
 Chapter 17 Simple Linear Regression and Correlation 17.1 Regression Analysis Our problem objective is to analyze the relationship between interval variables; regression analysis is the first tool we will
Mathematical Notation Math Introduction to Applied Statistics
 Mathematical Notation Math 113 - Introduction to Applied Statistics Name : Use Word or WordPerfect to recreate the following documents. Each article is worth 10 points and should be emailed to the instructor
CS 147: Computer Systems Performance Analysis
 CS 147: Computer Systems Performance Analysis Summarizing Variability and Determining Distributions CS 147: Computer Systems Performance Analysis Summarizing Variability and Determining Distributions 1
Originality in the Arts and Sciences: Lecture 2: Probability and Statistics
 Originality in the Arts and Sciences: Lecture 2: Probability and Statistics Let s face it. Statistics has a really bad reputation. Why? 1. It is boring. 2. It doesn t make a lot of sense. Actually, the
Course Review. Kin 304W Week 14: April 9, 2013
 Course Review Kin 304W Week 14: April 9, 2013 1 Today s Outline Format of Kin 304W Final Exam Course Review Hand back marked Project Part II 2 Kin 304W Final Exam Saturday, Thursday, April 18, 3:30-6:30
Analytical Graphing. lets start with the best graph ever made
 Analytical Graphing lets start with the best graph ever made Probably the best statistical graphic ever drawn, this map by Charles Joseph Minard portrays the losses suffered by Napoleon's army in the Russian
Experiment 1: The Same or Not The Same?
 Experiment 1: The Same or Not The Same? Learning Goals After you finish this lab, you will be able to: 1. Use Logger Pro to collect data and calculate statistics (mean and standard deviation). 2. Explain
CS 361: Probability & Statistics
 January 24, 2018 CS 361: Probability & Statistics Relationships in data Standard coordinates If we have two quantities of interest in a dataset, we might like to plot their histograms and compare the two
Last Lecture. Distinguish Populations from Samples. Knowing different Sampling Techniques. Distinguish Parameters from Statistics
 Last Lecture Distinguish Populations from Samples Importance of identifying a population and well chosen sample Knowing different Sampling Techniques Distinguish Parameters from Statistics Knowing different
Statistics lecture 3. Bell-Shaped Curves and Other Shapes
 Statistics lecture 3 Bell-Shaped Curves and Other Shapes Goals for lecture 3 Realize many measurements in nature follow a bell-shaped ( normal ) curve Understand and learn to compute a standardized score
Multiple Choice. Chapter 2 Test Bank
 Straightforward Statistics 1st Edition Bowen Test Bank Full Download: https://testbanklive.com/download/straightforward-statistics-1st-edition-bowen-test-bank/ Chapter 2 Test Bank Multiple Choice 1. Data
STP 420 INTRODUCTION TO APPLIED STATISTICS NOTES
 INTRODUCTION TO APPLIED STATISTICS NOTES PART - DATA CHAPTER LOOKING AT DATA - DISTRIBUTIONS Individuals objects described by a set of data (people, animals, things) - all the data for one individual make
Experiment 2 Random Error and Basic Statistics
 PHY191 Experiment 2: Random Error and Basic Statistics 7/12/2011 Page 1 Experiment 2 Random Error and Basic Statistics Homework 2: turn in the second week of the experiment. This is a difficult homework
Lecture 41 Sections Wed, Nov 12, 2008
 Lecture 41 Sections 14.1-14.3 Hampden-Sydney College Wed, Nov 12, 2008 Outline 1 2 3 4 5 6 7 one-proportion test that we just studied allows us to test a hypothesis concerning one proportion, or two categories,
Module 03 Lecture 14 Inferential Statistics ANOVA and TOI
 Introduction of Data Analytics Prof. Nandan Sudarsanam and Prof. B Ravindran Department of Management Studies and Department of Computer Science and Engineering Indian Institute of Technology, Madras Module
A is one of the categories into which qualitative data can be classified.
 Chapter 2 Methods for Describing Sets of Data 2.1 Describing qualitative data Recall qualitative data: non-numerical or categorical data Basic definitions: A is one of the categories into which qualitative
North Carolina State University
 North Carolina State University MA 141 Course Text Calculus I by Brenda Burns-Williams and Elizabeth Dempster August 7, 2014 Section1 Functions Introduction In this section, we will define the mathematical
Business Statistics. Lecture 10: Course Review
 Business Statistics Lecture 10: Course Review 1 Descriptive Statistics for Continuous Data Numerical Summaries Location: mean, median Spread or variability: variance, standard deviation, range, percentiles,
Title: Photosynthesis Phun
 Title: Photosynthesis Phun Author: Jean Marie Buschur Overview: An activity using Skittles to show how the photosynthesis reaction balances. Suggested grade level(s): 7-10 Concepts covered: Photosynthesis,
HOLLOMAN S AP STATISTICS BVD CHAPTER 08, PAGE 1 OF 11. Figure 1 - Variation in the Response Variable
 Chapter 08: Linear Regression There are lots of ways to model the relationships between variables. It is important that you not think that what we do is the way. There are many paths to the summit We are
Vocabulary: Samples and Populations
 Vocabulary: Samples and Populations Concept Different types of data Categorical data results when the question asked in a survey or sample can be answered with a nonnumerical answer. For example if we
Sampling Distribution Models. Chapter 17
 Sampling Distribution Models Chapter 17 Objectives: 1. Sampling Distribution Model 2. Sampling Variability (sampling error) 3. Sampling Distribution Model for a Proportion 4. Central Limit Theorem 5. Sampling
Introduction to Statistics
 Chapter 1 Introduction to Statistics 1.1 Preliminary Definitions Definition 1.1. Data are observations (such as measurements, genders, survey responses) that have been collected. Definition 1.2. Statistics
Ch18 links / ch18 pdf links Ch18 image t-dist table
 Ch18 links / ch18 pdf links Ch18 image t-dist table ch18 (inference about population mean) exercises: 18.3, 18.5, 18.7, 18.9, 18.15, 18.17, 18.19, 18.27 CHAPTER 18: Inference about a Population Mean The
Glossary. The ISI glossary of statistical terms provides definitions in a number of different languages:
 Glossary The ISI glossary of statistical terms provides definitions in a number of different languages: http://isi.cbs.nl/glossary/index.htm Adjusted r 2 Adjusted R squared measures the proportion of the
Earth s Layers Activity
 Earth s Layers Activity Purpose: To visualize the basic structure of the Earth and how we study it. Materials: Procedure: A piece of poster board shaped like a pizza slice with radius of about 16 cm Compass
M & M Project. Think! Crunch those numbers! Answer!
 M & M Project Think! Crunch those numbers! Answer! Chapters 1-2 Exploring Data and Describing Location in a Distribution Univariate Data: Length Stemplot and Frequency Table Stem (Units Digit) 0 1 1 Leaf
Index I-1. in one variable, solution set of, 474 solving by factoring, 473 cubic function definition, 394 graphs of, 394 x-intercepts on, 474
 Index A Absolute value explanation of, 40, 81 82 of slope of lines, 453 addition applications involving, 43 associative law for, 506 508, 570 commutative law for, 238, 505 509, 570 English phrases for,
Chapter 18. Sampling Distribution Models. Copyright 2010, 2007, 2004 Pearson Education, Inc.
 Chapter 18 Sampling Distribution Models Copyright 2010, 2007, 2004 Pearson Education, Inc. Normal Model When we talk about one data value and the Normal model we used the notation: N(μ, σ) Copyright 2010,
ENV Laboratory 1: Quadrant Sampling
 Name: Date: Introduction Quite often when conducting experiments it is impossible to measure every individual, object or species that exists. We will explore some methods to estimate the number of objects/species/individuals
Constant linear models
 Constant linear models A constant linear model is a type of model that provides us with tools for drawing statistical inferences about means of random variables. Means of random variables are theoretical
Chapter 1 Statistical Inference
 Chapter 1 Statistical Inference causal inference To infer causality, you need a randomized experiment (or a huge observational study and lots of outside information). inference to populations Generalizations
Chapter. Organizing and Summarizing Data. Copyright 2013, 2010 and 2007 Pearson Education, Inc.
 Chapter 2 Organizing and Summarizing Data Section 2.1 Organizing Qualitative Data Objectives 1. Organize Qualitative Data in Tables 2. Construct Bar Graphs 3. Construct Pie Charts When data is collected
Sampling Distributions of the Sample Mean Pocket Pennies
 You will need 25 pennies collected from recent day-today change Some of the distributions of data that you have studied have had a roughly normal shape, but many others were not normal at all. What kind
1. Descriptive stats methods for organizing and summarizing information
 Two basic types of statistics: 1. Descriptive stats methods for organizing and summarizing information Stats in sports are a great example Usually we use graphs, charts, and tables showing averages and
The Purpose of Hypothesis Testing
 Section 8 1A:! An Introduction to Hypothesis Testing The Purpose of Hypothesis Testing See s Candy states that a box of it s candy weighs 16 oz. They do not mean that every single box weights exactly 16
STAT100 Elementary Statistics and Probability
 STAT100 Elementary Statistics and Probability Exam, Monday, August 11, 014 Solution Show all work clearly and in order, and circle your final answers. Justify your answers algebraically whenever possible.
Study and research skills 2009 Duncan Golicher. and Adrian Newton. Last draft 11/24/2008
 Study and research skills 2009. and Adrian Newton. Last draft 11/24/2008 Inference about the mean: What you will learn Why we need to draw inferences from samples The difference between a population and
Chapter 7: Sampling Distributions
 + Chapter 7: Sampling Distributions Section 7.2 The Practice of Statistics, 4 th edition For AP* STARNES, YATES, MOORE + Chapter 7 Sampling Distributions n 7.1 What is a Sampling Distribution? n 7.2 n
Counting Out πr 2. Teacher Lab Discussion. Overview. Picture, Data Table, and Graph. Part I Middle Counting Length/Area Out πrinvestigation
 5 6 7 Middle Counting Length/rea Out πrinvestigation, page 1 of 7 Counting Out πr Teacher Lab Discussion Figure 1 Overview In this experiment we study the relationship between the radius of a circle and
Confidence intervals
 Confidence intervals We now want to take what we ve learned about sampling distributions and standard errors and construct confidence intervals. What are confidence intervals? Simply an interval for which
Chapter 6. Estimates and Sample Sizes
 Chapter 6 Estimates and Sample Sizes Lesson 6-1/6-, Part 1 Estimating a Population Proportion This chapter begins the beginning of inferential statistics. There are two major applications of inferential
MACROLAB LESSON 1 Time, Speed, and Distance Teacher Guide
 MACROLAB LESSON 1 Time, Speed, and Distance Teacher Guide Overview Students will use Sphero to show that there is a linear relationship between time, speed, and distance. They will program Sphero to move
Business Analytics and Data Mining Modeling Using R Prof. Gaurav Dixit Department of Management Studies Indian Institute of Technology, Roorkee
 Business Analytics and Data Mining Modeling Using R Prof. Gaurav Dixit Department of Management Studies Indian Institute of Technology, Roorkee Lecture - 04 Basic Statistics Part-1 (Refer Slide Time: 00:33)
Variables, distributions, and samples (cont.) Phil 12: Logic and Decision Making Fall 2010 UC San Diego 10/18/2010
 Phil 12: Logic and Decision Making Fall 2010 UC San Diego 10/18/2010") Variables, distributions, and samples (cont.) Phil 12: Logic and Decision Making Fall 2010 UC San Diego 10/18/2010 Review Recording observations - Must extract that which is to be analyzed: coding systems,
Variables, distributions, and samples (cont.) Phil 12: Logic and Decision Making Fall 2010 UC San Diego 10/18/2010 Review Recording observations - Must extract that which is to be analyzed: coding systems,
Testing Research and Statistical Hypotheses
 Testing Research and Statistical Hypotheses Introduction In the last lab we analyzed metric artifact attributes such as thickness or width/thickness ratio. Those were continuous variables, which as you
AIM HIGH SCHOOL. Curriculum Map W. 12 Mile Road Farmington Hills, MI (248)
") AIM HIGH SCHOOL Curriculum Map 2923 W. 12 Mile Road Farmington Hills, MI 48334 (248) 702-6922 www.aimhighschool.com COURSE TITLE: Statistics DESCRIPTION OF COURSE: PREREQUISITES: Algebra 2 Students will
AIM HIGH SCHOOL Curriculum Map 2923 W. 12 Mile Road Farmington Hills, MI 48334 (248) 702-6922 www.aimhighschool.com COURSE TITLE: Statistics DESCRIPTION OF COURSE: PREREQUISITES: Algebra 2 Students will
Chapter 7: Sampling Distributions
 Chapter 7: Sampling Distributions Section 7.1 What is a Sampling Distribution? The Practice of Statistics, 4 th edition For AP* STARNES, YATES, MOORE Chapter 7 Sampling Distributions 7.1 What is a Sampling
Biostatistics and Epidemiology, Midterm Review
 Biostatistics and Epidemiology, Midterm Review New York Medical College By: Jasmine Nirody This review is meant to cover lectures from the first half of the Biostatistics course. The sections are not organised
Chapter 1. The data we first collected was the diameter of all the different colored M&Ms we were given. The diameter is in cm.
 + = M&M Experiment Introduction!! In order to achieve a better understanding of chapters 1-9 in our textbook, we have outlined experiments that address the main points present in each of the mentioned
Math 2000 Practice Final Exam: Homework problems to review. Problem numbers
 Math 2000 Practice Final Exam: Homework problems to review Pages: Problem numbers 52 20 65 1 181 14 189 23, 30 245 56 256 13 280 4, 15 301 21 315 18 379 14 388 13 441 13 450 10 461 1 553 13, 16 561 13,