M & M Project. Think! Crunch those numbers! Answer!
|
|
|
- Francine Nelson
- 5 years ago
- Views:
Transcription


1 M & M Project Think! Crunch those numbers! Answer!

2 Chapters 1-2 Exploring Data and Describing Location in a Distribution
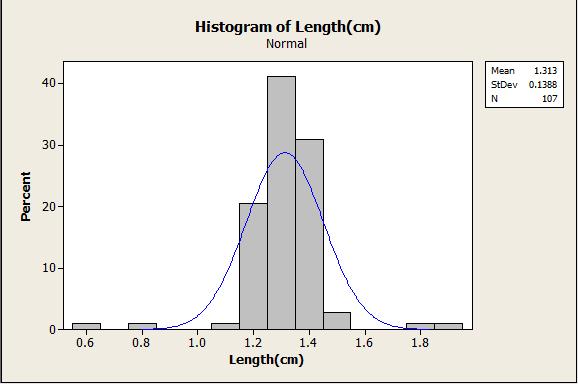
3 Univariate Data: Length Stemplot and Frequency Table Stem (Units Digit) Leaf (Tenths digit) Mean: 1.31 cm Variance:.019 cm Standard Deviation:.139 cm Range: 1.13 cm Length (cm) Frequency
4 Univariate Data: Length Histogram and Modified Boxplot 5-Number Summary:.6, 1.3, 1.3, 1.4, 1.9 IQR:.1
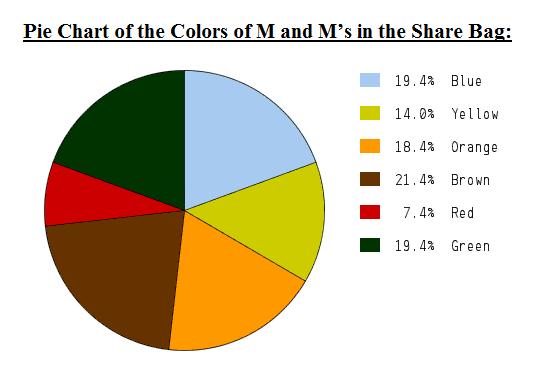
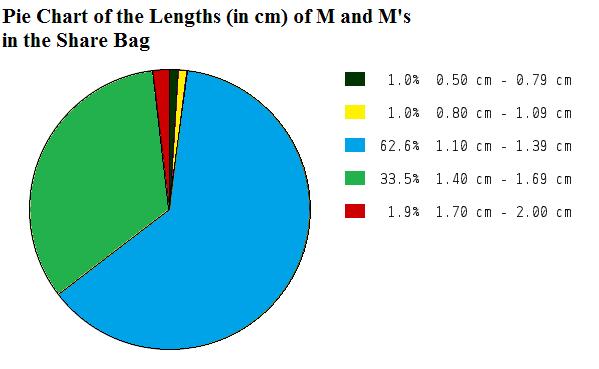
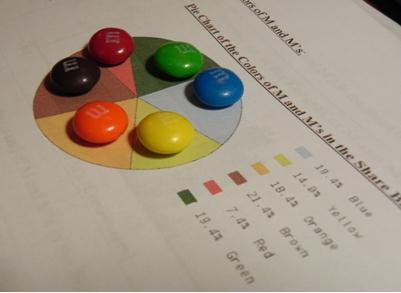
5 Univariate Data: Length Pie charts
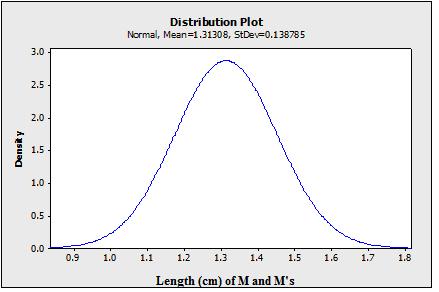
6 Univariate Data: Length Density Curves

7 Chapter 3 Examining Relationships
8 Bivariate Data: Length and Width Scatter Plot Explanatory Variable X: Length (cm) Response Variable Y: Width (cm) LSRL Equation: ŷ= x r:

9 Bivariate Data: Length and Width Residual Plot r-squared:.0743

10 Chapter 4 More about Relationships between Two Variables
11 Nonlinear Data: Length and Mass Nonlinear Scatter Plot Explanatory Variable X: Length (cm) Response Variable Y: Mass (g) LSRL Equation: ŷ= x r: r-squared:.00016
12 Nonlinear Data: Length and Mass Transformed Scatter Plot Dimensional Transformation: Length Cubed LSRL Equation: ŷ= x 3 r: r-squared:.00081
13 Nonlinear Data: Length and Mass Residual Plot of Transformed Data Two Influential Outliers: 5.8 cm and 6.8 cm
14 Categorical Relationships Two-Way Table Color of M & M M On Blue Yellow Red Orange Green Brown Total Yes No Total Marginal Distributions: Yes: 79/107= 73.8% No: 28/107= 26.2% Blue: 21/107= 19.6% Yellow: 15/107= 14% Red: 8/107= 7.5% Orange: 19/107= 17.8% Green: 21/107= 19.6% Brown: 23/107= 21.5%


15 Chapter 5 Producing Data
16 Experimental Design Randomized Experiment Group 1: 50 Students Treatment 1: Taste Blue Treatment 1: Taste Blue 100 Students: Random Allocation Compare Results: Taste Preference Group 2: 50 Students Treatment 1: Taste Blue Treatment 1: Taste Blue

17 Chapter 6 Probability and Simulation
18 Probability Models Model One: Disjoint Event What is the probability than a flipped M & M will land M side up? S: { M side up, M side down} M up.56 M down.44
19 Probability Models Model Two: Non-Disjoint Event What is the probability than a randomly selected and flipped M & M will be orange and land M side up? S: {orange and M up, orange and M down, not orange and M up, not orange and M down} Orange.358 M up
20 Probability Models Two-Way Table M Side Blue Yellow Red Orange Green Brown Total Up Down Total


21 Chapter 7 Random Variables


22 Random Variables Discrete Random Variables Number of times a flipped M & M lands M side up


23 Random Variables Continuous Random Variables Distribution of mass

24 Chapter 8 Binomial and Geometric Models
25 Chapter 8 Binomial Questions Theoretical 107 M and M s are contained within a M and M packet. The probability that one will pick a red M and M at random is What is the probability of getting at least 3 red M and M s with replacement in 10 trials?

26 Binomial Distribution The mean of this data set is red M and M s. The standard deviation is reds away from the mean. The variance is

27 Chapter 8: Actual Binomial Trial # # of red M and M s picked In a sample size of 10 Probability of choosing a red M and M in trial

28 Geometric Questions 107 M and M s are contained within a M and M packet. The probability that one will pick a red M and M at random is What is the probability of picking the first red M and M at random on the 2th trial with replacement?

29 Actual Geometric Distribution Trial # Red M and M picked 2nd (1=yes, 0=no) The actual probability of picking the first red M and M at random on the 2th trial with replacement is 0.05.
30 Chapter 9 Sampling Distributions
31 Chapter 9 Distribution of Colors in the population

32 Chapter 9 Distribution of Colors in the population
33 The mean of the sampling distribution of p-hat is p= as. By the rule of thumb #1, the population size is greater than 10 times the sample size of 10 M and M s, so the standard deviation of p-hat is = Rule of thumb #2 does not apply in this situation because np>10 or n(1-p)>10, therefore a normal approximation may not be used. Due to the low frequency of red M and M s in our population, it would not be possible for rule of thumb # 2 to apply.

34 The End Thank you for watching our show!!!
Sociology 6Z03 Review I
 Sociology 6Z03 Review I John Fox McMaster University Fall 2016 John Fox (McMaster University) Sociology 6Z03 Review I Fall 2016 1 / 19 Outline: Review I Introduction Displaying Distributions Describing
REVIEW: Midterm Exam. Spring 2012
 REVIEW: Midterm Exam Spring 2012 Introduction Important Definitions: - Data - Statistics - A Population - A census - A sample Types of Data Parameter (Describing a characteristic of the Population) Statistic
Introduction to Statistics
 Chapter 1 Introduction to Statistics 1.1 Preliminary Definitions Definition 1.1. Data are observations (such as measurements, genders, survey responses) that have been collected. Definition 1.2. Statistics
Prentice Hall Stats: Modeling the World 2004 (Bock) Correlated to: National Advanced Placement (AP) Statistics Course Outline (Grades 9-12)
 Correlated to: National Advanced Placement (AP) Statistics Course Outline (Grades 9-12)") National Advanced Placement (AP) Statistics Course Outline (Grades 9-12) Following is an outline of the major topics covered by the AP Statistics Examination. The ordering here is intended to define the
National Advanced Placement (AP) Statistics Course Outline (Grades 9-12) Following is an outline of the major topics covered by the AP Statistics Examination. The ordering here is intended to define the
STAT 200 Chapter 1 Looking at Data - Distributions
 STAT 200 Chapter 1 Looking at Data - Distributions What is Statistics? Statistics is a science that involves the design of studies, data collection, summarizing and analyzing the data, interpreting the
Chapter 1. The data we first collected was the diameter of all the different colored M&Ms we were given. The diameter is in cm.
 + = M&M Experiment Introduction!! In order to achieve a better understanding of chapters 1-9 in our textbook, we have outlined experiments that address the main points present in each of the mentioned
Semester I Review. The authors also kept track of the color of the first born in each litter. (B = brown, G = gray, W = white, and T = tan)
") Answer Key A.P. Statistics Semester I Review In the paper Reproduction in Laboratory colonies of Bank Vole, the authors presented the results of a study of litter size. (A vole is a small rodent with a
Answer Key A.P. Statistics Semester I Review In the paper Reproduction in Laboratory colonies of Bank Vole, the authors presented the results of a study of litter size. (A vole is a small rodent with a
Chapter 2: Tools for Exploring Univariate Data
 Stats 11 (Fall 2004) Lecture Note Introduction to Statistical Methods for Business and Economics Instructor: Hongquan Xu Chapter 2: Tools for Exploring Univariate Data Section 2.1: Introduction What is
AP Final Review II Exploring Data (20% 30%)
") AP Final Review II Exploring Data (20% 30%) Quantitative vs Categorical Variables Quantitative variables are numerical values for which arithmetic operations such as means make sense. It is usually a measure
AP Final Review II Exploring Data (20% 30%) Quantitative vs Categorical Variables Quantitative variables are numerical values for which arithmetic operations such as means make sense. It is usually a measure
Learning Objectives for Stat 225
 Learning Objectives for Stat 225 08/20/12 Introduction to Probability: Get some general ideas about probability, and learn how to use sample space to compute the probability of a specific event. Set Theory:
M 140 Test 1 B Name (1 point) SHOW YOUR WORK FOR FULL CREDIT! Problem Max. Points Your Points Total 75
 SHOW YOUR WORK FOR FULL CREDIT! Problem Max. Points Your Points Total 75") M 140 est 1 B Name (1 point) SHOW YOUR WORK FOR FULL CREDI! Problem Max. Points Your Points 1-10 10 11 10 12 3 13 4 14 18 15 8 16 7 17 14 otal 75 Multiple choice questions (1 point each) For questions
M 140 est 1 B Name (1 point) SHOW YOUR WORK FOR FULL CREDI! Problem Max. Points Your Points 1-10 10 11 10 12 3 13 4 14 18 15 8 16 7 17 14 otal 75 Multiple choice questions (1 point each) For questions
In this investigation you will use the statistics skills that you learned the to display and analyze a cup of peanut M&Ms.
 M&M Madness In this investigation you will use the statistics skills that you learned the to display and analyze a cup of peanut M&Ms. Part I: Categorical Analysis: M&M Color Distribution 1. Record the
AP Statistics Cumulative AP Exam Study Guide
 AP Statistics Cumulative AP Eam Study Guide Chapters & 3 - Graphs Statistics the science of collecting, analyzing, and drawing conclusions from data. Descriptive methods of organizing and summarizing statistics
STP 420 INTRODUCTION TO APPLIED STATISTICS NOTES
 INTRODUCTION TO APPLIED STATISTICS NOTES PART - DATA CHAPTER LOOKING AT DATA - DISTRIBUTIONS Individuals objects described by a set of data (people, animals, things) - all the data for one individual make
M 225 Test 1 B Name SHOW YOUR WORK FOR FULL CREDIT! Problem Max. Points Your Points Total 75
 M 225 Test 1 B Name SHOW YOUR WORK FOR FULL CREDIT! Problem Max. Points Your Points 1-13 13 14 3 15 8 16 4 17 10 18 9 19 7 20 3 21 16 22 2 Total 75 1 Multiple choice questions (1 point each) 1. Look at
What is Statistics? Statistics is the science of understanding data and of making decisions in the face of variability and uncertainty.
 What is Statistics? Statistics is the science of understanding data and of making decisions in the face of variability and uncertainty. Statistics is a field of study concerned with the data collection,
QUIZ 1 (CHAPTERS 1-4) SOLUTIONS MATH 119 SPRING 2013 KUNIYUKI 105 POINTS TOTAL, BUT 100 POINTS = 100%
 SOLUTIONS MATH 119 SPRING 2013 KUNIYUKI 105 POINTS TOTAL, BUT 100 POINTS = 100%") QUIZ 1 (CHAPTERS 1-4) SOLUTIONS MATH 119 SPRING 2013 KUNIYUKI 105 POINTS TOTAL, BUT 100 POINTS = 100% 1) (6 points). A college has 32 course sections in math. A frequency table for the numbers of students
QUIZ 1 (CHAPTERS 1-4) SOLUTIONS MATH 119 SPRING 2013 KUNIYUKI 105 POINTS TOTAL, BUT 100 POINTS = 100% 1) (6 points). A college has 32 course sections in math. A frequency table for the numbers of students
Example 2. Given the data below, complete the chart:
 Statistics 2035 Quiz 1 Solutions Example 1. 2 64 150 150 2 128 150 2 256 150 8 8 Example 2. Given the data below, complete the chart: 52.4, 68.1, 66.5, 75.0, 60.5, 78.8, 63.5, 48.9, 81.3 n=9 The data is
AIM HIGH SCHOOL. Curriculum Map W. 12 Mile Road Farmington Hills, MI (248)
") AIM HIGH SCHOOL Curriculum Map 2923 W. 12 Mile Road Farmington Hills, MI 48334 (248) 702-6922 www.aimhighschool.com COURSE TITLE: Statistics DESCRIPTION OF COURSE: PREREQUISITES: Algebra 2 Students will
AIM HIGH SCHOOL Curriculum Map 2923 W. 12 Mile Road Farmington Hills, MI 48334 (248) 702-6922 www.aimhighschool.com COURSE TITLE: Statistics DESCRIPTION OF COURSE: PREREQUISITES: Algebra 2 Students will
Chapter 1 Statistical Inference
 Chapter 1 Statistical Inference causal inference To infer causality, you need a randomized experiment (or a huge observational study and lots of outside information). inference to populations Generalizations
Sets and Set notation. Algebra 2 Unit 8 Notes
 Sets and Set notation Section 11-2 Probability Experimental Probability experimental probability of an event: Theoretical Probability number of time the event occurs P(event) = number of trials Sample
Ch Inference for Linear Regression
 Ch. 12-1 Inference for Linear Regression ACT = 6.71 + 5.17(GPA) For every increase of 1 in GPA, we predict the ACT score to increase by 5.17. population regression line β (true slope) μ y = α + βx mean
1-1. Chapter 1. Sampling and Descriptive Statistics by The McGraw-Hill Companies, Inc. All rights reserved.
 1-1 Chapter 1 Sampling and Descriptive Statistics 1-2 Why Statistics? Deal with uncertainty in repeated scientific measurements Draw conclusions from data Design valid experiments and draw reliable conclusions
8/4/2009. Describing Data with Graphs
 Describing Data with Graphs 1 A variable is a characteristic that changes or varies over time and/or for different individuals or objects under consideration. Examples: Hair color, white blood cell count,
QUIZ 1 (CHAPTERS 1-4) SOLUTIONS MATH 119 FALL 2012 KUNIYUKI 105 POINTS TOTAL, BUT 100 POINTS
 SOLUTIONS MATH 119 FALL 2012 KUNIYUKI 105 POINTS TOTAL, BUT 100 POINTS") QUIZ 1 (CHAPTERS 1-4) SOLUTIONS MATH 119 FALL 2012 KUNIYUKI 105 POINTS TOTAL, BUT 100 POINTS = 100% Show all work, simplify as appropriate, and use good form and procedure (as in class). Box in your final
QUIZ 1 (CHAPTERS 1-4) SOLUTIONS MATH 119 FALL 2012 KUNIYUKI 105 POINTS TOTAL, BUT 100 POINTS = 100% Show all work, simplify as appropriate, and use good form and procedure (as in class). Box in your final
Interpret Standard Deviation. Outlier Rule. Describe the Distribution OR Compare the Distributions. Linear Transformations SOCS. Interpret a z score
 Interpret Standard Deviation Outlier Rule Linear Transformations Describe the Distribution OR Compare the Distributions SOCS Using Normalcdf and Invnorm (Calculator Tips) Interpret a z score What is an
Index I-1. in one variable, solution set of, 474 solving by factoring, 473 cubic function definition, 394 graphs of, 394 x-intercepts on, 474
 Index A Absolute value explanation of, 40, 81 82 of slope of lines, 453 addition applications involving, 43 associative law for, 506 508, 570 commutative law for, 238, 505 509, 570 English phrases for,
Subject CS1 Actuarial Statistics 1 Core Principles
 Institute of Actuaries of India Subject CS1 Actuarial Statistics 1 Core Principles For 2019 Examinations Aim The aim of the Actuarial Statistics 1 subject is to provide a grounding in mathematical and
Glossary for the Triola Statistics Series
 Glossary for the Triola Statistics Series Absolute deviation The measure of variation equal to the sum of the deviations of each value from the mean, divided by the number of values Acceptance sampling
Stat 101 Exam 1 Important Formulas and Concepts 1
 1 Chapter 1 1.1 Definitions Stat 101 Exam 1 Important Formulas and Concepts 1 1. Data Any collection of numbers, characters, images, or other items that provide information about something. 2. Categorical/Qualitative
Algebra I Learning Targets Chapter 1: Equations and Inequalities (one variable) Section Section Title Learning Target(s)
 Section Section Title Learning Target(s)") Chapter 1: Equations and Inequalities (one variable) Section Learning Target(s) I can 1.2 Evaluate and Simplify Algebraic Expressions 1. Evaluate and simplify numeric and algebraic expressions (order of
Chapter 1: Equations and Inequalities (one variable) Section Learning Target(s) I can 1.2 Evaluate and Simplify Algebraic Expressions 1. Evaluate and simplify numeric and algebraic expressions (order of
CK-12 Middle School Math Grade 8
 CK-12 Middle School Math aligned with COMMON CORE MATH STATE STANDARDS INITIATIVE Middle School Standards for Math Content Common Core Math Standards for CK-12 Middle School Math The Number System (8.NS)
CSS 211: Statistical Methods I
 CSS 211: Statistical Methods I Zhaoxian Zhou School of Computing University of Southern Mississippi Zhaoxian.Zhou@usm.edu January 11, 2018 Zhaoxian Zhou (USM) CSS 211 January 11, 2018 1 / 227 Overview
STATISTICS 141 Final Review
 STATISTICS 141 Final Review Bin Zou bzou@ualberta.ca Department of Mathematical & Statistical Sciences University of Alberta Winter 2015 Bin Zou (bzou@ualberta.ca) STAT 141 Final Review Winter 2015 1 /
Random Variables Example:
 Random Variables Example: We roll a fair die 6 times. Suppose we are interested in the number of 5 s in the 6 rolls. Let X = number of 5 s. Then X could be 0, 1, 2, 3, 4, 5, 6. X = 0 corresponds to the
UNIT 12 ~ More About Regression
 ***SECTION 15.1*** The Regression Model When a scatterplot shows a relationship between a variable x and a y, we can use the fitted to the data to predict y for a given value of x. Now we want to do tests
are the objects described by a set of data. They may be people, animals or things.
 ( c ) E p s t e i n, C a r t e r a n d B o l l i n g e r 2016 C h a p t e r 5 : E x p l o r i n g D a t a : D i s t r i b u t i o n s P a g e 1 CHAPTER 5: EXPLORING DATA DISTRIBUTIONS 5.1 Creating Histograms
BIVARIATE DATA data for two variables
 (Chapter 3) BIVARIATE DATA data for two variables INVESTIGATING RELATIONSHIPS We have compared the distributions of the same variable for several groups, using double boxplots and back-to-back stemplots.
Test 1 Review. Review. Cathy Poliak, Ph.D. Office in Fleming 11c (Department Reveiw of Mathematics University of Houston Exam 1)
") Test 1 Review Review Cathy Poliak, Ph.D. cathy@math.uh.edu Office in Fleming 11c Department of Mathematics University of Houston Exam 1 Review Cathy Poliak, Ph.D. cathy@math.uh.edu Office in Fleming 11c
Test 1 Review Review Cathy Poliak, Ph.D. cathy@math.uh.edu Office in Fleming 11c Department of Mathematics University of Houston Exam 1 Review Cathy Poliak, Ph.D. cathy@math.uh.edu Office in Fleming 11c
Descriptive Univariate Statistics and Bivariate Correlation
 ESC 100 Exploring Engineering Descriptive Univariate Statistics and Bivariate Correlation Instructor: Sudhir Khetan, Ph.D. Wednesday/Friday, October 17/19, 2012 The Central Dogma of Statistics used to
Shape, Outliers, Center, Spread Frequency and Relative Histograms Related to other types of graphical displays
 Histograms: Shape, Outliers, Center, Spread Frequency and Relative Histograms Related to other types of graphical displays Sep 9 1:13 PM Shape: Skewed left Bell shaped Symmetric Bi modal Symmetric Skewed
Chapter2 Description of samples and populations. 2.1 Introduction.
 Chapter2 Description of samples and populations. 2.1 Introduction. Statistics=science of analyzing data. Information collected (data) is gathered in terms of variables (characteristics of a subject that
Data 1 Assessment Calculator allowed for all questions
 Foundation Higher Data Assessment Calculator allowed for all questions MATHSWATCH All questions Time for the test: 45 minutes Name: Grade Title of clip Marks Score Percentage Clip 84 D Data collection
MATH 1150 Chapter 2 Notation and Terminology
 MATH 1150 Chapter 2 Notation and Terminology Categorical Data The following is a dataset for 30 randomly selected adults in the U.S., showing the values of two categorical variables: whether or not the
Chapter 1. Looking at Data
 Chapter 1 Looking at Data Types of variables Looking at Data Be sure that each variable really does measure what you want it to. A poor choice of variables can lead to misleading conclusions!! For example,
Descriptive statistics Maarten Jansen
 Descriptive statistics Maarten Jansen Overview 1. Classification of observational values 2. Visualisation methods 3. Guidelines for good visualisation c Maarten Jansen STAT-F-413 Descriptive statistics
STATISTICS/MATH /1760 SHANNON MYERS
 STATISTICS/MATH 103 11/1760 SHANNON MYERS π 100 POINTS POSSIBLE π YOUR WORK MUST SUPPORT YOUR ANSWER FOR FULL CREDIT TO BE AWARDED π YOU MAY USE A SCIENTIFIC AND/OR A TI-83/84/85/86 CALCULATOR ONCE YOU
CHAPTER 5: EXPLORING DATA DISTRIBUTIONS. Individuals are the objects described by a set of data. These individuals may be people, animals or things.
 (c) Epstein 2013 Chapter 5: Exploring Data Distributions Page 1 CHAPTER 5: EXPLORING DATA DISTRIBUTIONS 5.1 Creating Histograms Individuals are the objects described by a set of data. These individuals
Honors Algebra 1 - Fall Final Review
 Name: Period Date: Honors Algebra 1 - Fall Final Review This review packet is due at the beginning of your final exam. In addition to this packet, you should study each of your unit reviews and your notes.
From Practical Data Analysis with JMP, Second Edition. Full book available for purchase here. About This Book... xiii About The Author...
 From Practical Data Analysis with JMP, Second Edition. Full book available for purchase here. Contents About This Book... xiii About The Author... xxiii Chapter 1 Getting Started: Data Analysis with JMP...
PS2.1 & 2.2: Linear Correlations PS2: Bivariate Statistics
 PS2.1 & 2.2: Linear Correlations PS2: Bivariate Statistics LT1: Basics of Correlation LT2: Measuring Correlation and Line of best fit by eye Univariate (one variable) Displays Frequency tables Bar graphs
Unit Six Information. EOCT Domain & Weight: Algebra Connections to Statistics and Probability - 15%
 GSE Algebra I Unit Six Information EOCT Domain & Weight: Algebra Connections to Statistics and Probability - 15% Curriculum Map: Describing Data Content Descriptors: Concept 1: Summarize, represent, and
Regression Model Building
 Regression Model Building Setting: Possibly a large set of predictor variables (including interactions). Goal: Fit a parsimonious model that explains variation in Y with a small set of predictors Automated
P (A) = P (B) = P (C) = P (D) =
 = P (B) = P (C) = P (D) =") STAT 145 CHAPTER 12 - PROBABILITY - STUDENT VERSION The probability of a random event, is the proportion of times the event will occur in a large number of repititions. For example, when flipping a coin,
STAT 145 CHAPTER 12 - PROBABILITY - STUDENT VERSION The probability of a random event, is the proportion of times the event will occur in a large number of repititions. For example, when flipping a coin,
Describing distributions with numbers
 Describing distributions with numbers A large number or numerical methods are available for describing quantitative data sets. Most of these methods measure one of two data characteristics: The central
Exam 1 Review (Notes 1-8)
") 1 / 17 Exam 1 Review (Notes 1-8) Shiwen Shen Department of Statistics University of South Carolina Elementary Statistics for the Biological and Life Sciences (STAT 205) Basic Concepts 2 / 17 Type of studies:
1 / 17 Exam 1 Review (Notes 1-8) Shiwen Shen Department of Statistics University of South Carolina Elementary Statistics for the Biological and Life Sciences (STAT 205) Basic Concepts 2 / 17 Type of studies:
STATISTICS ( CODE NO. 08 ) PAPER I PART - I
 PAPER I PART - I") STATISTICS ( CODE NO. 08 ) PAPER I PART - I 1. Descriptive Statistics Types of data - Concepts of a Statistical population and sample from a population ; qualitative and quantitative data ; nominal and
STATISTICS ( CODE NO. 08 ) PAPER I PART - I 1. Descriptive Statistics Types of data - Concepts of a Statistical population and sample from a population ; qualitative and quantitative data ; nominal and
Bivariate Data Summary
 Bivariate Data Summary Bivariate data data that examines the relationship between two variables What individuals to the data describe? What are the variables and how are they measured Are the variables
STA220H1F Term Test Oct 26, Last Name: First Name: Student #: TA s Name: or Tutorial Room:
 STA0HF Term Test Oct 6, 005 Last Name: First Name: Student #: TA s Name: or Tutorial Room: Time allowed: hour and 45 minutes. Aids: one sided handwritten aid sheet + non-programmable calculator Statistical
Probability Distributions
 Probability Distributions Probability This is not a math class, or an applied math class, or a statistics class; but it is a computer science course! Still, probability, which is a math-y concept underlies
A graph for a quantitative variable that divides a distribution into 25% segments.
 STATISTICS Unit 2 STUDY GUIDE Topics 6-10 Part 1: Vocabulary For each word, be sure you know the definition, the formula, or what the graph looks like. Name Block A. association M. mean absolute deviation
Algebra 1 Khan Academy Video Correlations By SpringBoard Activity and Learning Target
 Algebra 1 Khan Academy Video Correlations By SpringBoard Activity and Learning Target SB Activity Activity 1 Investigating Patterns 1-1 Learning Targets: Identify patterns in data. Use tables, graphs,
Contents. Acknowledgments. xix
 Table of Preface Acknowledgments page xv xix 1 Introduction 1 The Role of the Computer in Data Analysis 1 Statistics: Descriptive and Inferential 2 Variables and Constants 3 The Measurement of Variables
Practice Questions for Exam 1
 Practice Questions for Exam 1 1. A used car lot evaluates their cars on a number of features as they arrive in the lot in order to determine their worth. Among the features looked at are miles per gallon
Nemours Biomedical Research Statistics Course. Li Xie Nemours Biostatistics Core October 14, 2014
 Nemours Biomedical Research Statistics Course Li Xie Nemours Biostatistics Core October 14, 2014 Outline Recap Introduction to Logistic Regression Recap Descriptive statistics Variable type Example of
Inference for the Regression Coefficient
 Inference for the Regression Coefficient Recall, b 0 and b 1 are the estimates of the slope β 1 and intercept β 0 of population regression line. We can shows that b 0 and b 1 are the unbiased estimates
A Peak to the World of Multivariate Statistical Analysis
 A Peak to the World of Multivariate Statistical Analysis Real Contents Real Real Real Why is it important to know a bit about the theory behind the methods? Real 5 10 15 20 Real 10 15 20 Figure: Multivariate
Last Lecture. Distinguish Populations from Samples. Knowing different Sampling Techniques. Distinguish Parameters from Statistics
 Last Lecture Distinguish Populations from Samples Importance of identifying a population and well chosen sample Knowing different Sampling Techniques Distinguish Parameters from Statistics Knowing different
A Short Course in Basic Statistics
 A Short Course in Basic Statistics Ian Schindler November 5, 2017 Creative commons license share and share alike BY: C 1 Descriptive Statistics 1.1 Presenting statistical data Definition 1 A statistical
UCLA STAT 10 Statistical Reasoning - Midterm Review Solutions Observational Studies, Designed Experiments & Surveys
 UCLA STAT 10 Statistical Reasoning - Midterm Review Solutions Observational Studies, Designed Experiments & Surveys.. 1. (i) The treatment being compared is: (ii). (5) 3. (3) 4. (4) Study 1: the number
MS Algebra 1 Scope and Sequence Quarter 1 Overview
 Quarter 1 Overview Equations, Inequalities, Absolute Value Students must master creating, solving, and In 7 th grade, students will have developed a Write, solve, and interpret multi-step equations analyzing
ECN221 Exam 1 VERSION B Fall 2017 (Modules 1-4), ASU-COX VERSION B
, ASU-COX VERSION B") ECN221 Exam 1 VERSION B Fall 2017 (Modules 1-4), ASU-COX VERSION B Choose the best answer. Do not write letters in the margin or communicate with other students in any way; if you do you will receive a
ECN221 Exam 1 VERSION B Fall 2017 (Modules 1-4), ASU-COX VERSION B Choose the best answer. Do not write letters in the margin or communicate with other students in any way; if you do you will receive a
Math 2311 TEST 2 REVIEW SHEET KEY
 Math 2311 TEST 2 REVIEW SHEET KEY #1 25, Define the following: 1. Continuous random variable 2. Discrete random variable 3. Density curve 4. Uniform density curve 5. Normal distribution 6. Sampling distribution
Chapter 10. Chapter 10. Multinomial Experiments and. Multinomial Experiments and Contingency Tables. Contingency Tables.
 Chapter 10 Multinomial Experiments and Contingency Tables 1 Chapter 10 Multinomial Experiments and Contingency Tables 10-1 1 Overview 10-2 2 Multinomial Experiments: of-fitfit 10-3 3 Contingency Tables:
Data 1 Assessment Calculator allowed for all questions
 Foundation Higher Data Assessment Calculator allowed for all questions MATHSWATCH All questions Time for the test: 4 minutes Name: MATHSWATCH ANSWERS Grade Title of clip Marks Score Percentage Clip 84
Institute of Actuaries of India
 Institute of Actuaries of India Subject CT3 Probability and Mathematical Statistics For 2018 Examinations Subject CT3 Probability and Mathematical Statistics Core Technical Syllabus 1 June 2017 Aim The
Skills available for New York eighth grade math standards
 Skills available for New York eighth grade math standards Standards are in bold, followed by a list of the IXL math skills that are aligned to that standard. Students can practice these skills online at
11-2 Multinomial Experiment
 Chapter 11 Multinomial Experiments and Contingency Tables 1 Chapter 11 Multinomial Experiments and Contingency Tables 11-11 Overview 11-2 Multinomial Experiments: Goodness-of-fitfit 11-3 Contingency Tables:
For Bonnie and Jesse (again)
") SECOND EDITION A P P L I E D R E G R E S S I O N A N A L Y S I S a n d G E N E R A L I Z E D L I N E A R M O D E L S For Bonnie and Jesse (again) SECOND EDITION A P P L I E D R E G R E S S I O N A N A
SECOND EDITION A P P L I E D R E G R E S S I O N A N A L Y S I S a n d G E N E R A L I Z E D L I N E A R M O D E L S For Bonnie and Jesse (again) SECOND EDITION A P P L I E D R E G R E S S I O N A N A
Trendlines Simple Linear Regression Multiple Linear Regression Systematic Model Building Practical Issues
 Trendlines Simple Linear Regression Multiple Linear Regression Systematic Model Building Practical Issues Overfitting Categorical Variables Interaction Terms Non-linear Terms Linear Logarithmic y = a +
Ch. 1: Data and Distributions
 Ch. 1: Data and Distributions Populations vs. Samples How to graphically display data Histograms, dot plots, stem plots, etc Helps to show how samples are distributed Distributions of both continuous and
Lecture 1: Descriptive Statistics
 Lecture 1: Descriptive Statistics MSU-STT-351-Sum 15 (P. Vellaisamy: MSU-STT-351-Sum 15) Probability & Statistics for Engineers 1 / 56 Contents 1 Introduction 2 Branches of Statistics Descriptive Statistics
A-G Algebra 1. Gorman Learning Center (052344) Basic Course Information
 Basic Course Information") A-G Algebra 1 Gorman Learning Center (052344) Basic Course Information Title: A-G Algebra 1 Transcript abbreviations: A-G Algebra 1a / 5R1001, A-G Algebra 1b / 5R1006 Length of course: Full Year Subject
A-G Algebra 1 Gorman Learning Center (052344) Basic Course Information Title: A-G Algebra 1 Transcript abbreviations: A-G Algebra 1a / 5R1001, A-G Algebra 1b / 5R1006 Length of course: Full Year Subject
Math 3339 Homework 2 (Chapter 2, 9.1 & 9.2)
") Math 3339 Homework 2 (Chapter 2, 9.1 & 9.2) Name: PeopleSoft ID: Instructions: Homework will NOT be accepted through email or in person. Homework must be submitted through CourseWare BEFORE the deadline.
Math 3339 Homework 2 (Chapter 2, 9.1 & 9.2) Name: PeopleSoft ID: Instructions: Homework will NOT be accepted through email or in person. Homework must be submitted through CourseWare BEFORE the deadline.
CS 361: Probability & Statistics
 January 24, 2018 CS 361: Probability & Statistics Relationships in data Standard coordinates If we have two quantities of interest in a dataset, we might like to plot their histograms and compare the two
Lecture 6. Probability events. Definition 1. The sample space, S, of a. probability experiment is the collection of all
 Lecture 6 1 Lecture 6 Probability events Definition 1. The sample space, S, of a probability experiment is the collection of all possible outcomes of an experiment. One such outcome is called a simple
Exploring Data. How to Explore Data
 Exploring Data Statistics is the art and science of learning from data. This may include: Designing appropriate tools to collect data. Organizing data in a meaningful way. Displaying data with appropriate
Scatterplots and Correlation
 Bivariate Data Page 1 Scatterplots and Correlation Essential Question: What is the correlation coefficient and what does it tell you? Most statistical studies examine data on more than one variable. Fortunately,
What is statistics? Statistics is the science of: Collecting information. Organizing and summarizing the information collected
 What is statistics? Statistics is the science of: Collecting information Organizing and summarizing the information collected Analyzing the information collected in order to draw conclusions Two types
Lecture 6: Chapter 4, Section 2 Quantitative Variables (Displays, Begin Summaries)
") Lecture 6: Chapter 4, Section 2 Quantitative Variables (Displays, Begin Summaries) Summarize with Shape, Center, Spread Displays: Stemplots, Histograms Five Number Summary, Outliers, Boxplots Cengage Learning
Lecture 6: Chapter 4, Section 2 Quantitative Variables (Displays, Begin Summaries) Summarize with Shape, Center, Spread Displays: Stemplots, Histograms Five Number Summary, Outliers, Boxplots Cengage Learning
Review for Exam #1. Chapter 1. The Nature of Data. Definitions. Population. Sample. Quantitative data. Qualitative (attribute) data
 data") Review for Exam #1 1 Chapter 1 Population the complete collection of elements (scores, people, measurements, etc.) to be studied Sample a subcollection of elements drawn from a population 11 The Nature
Review for Exam #1 1 Chapter 1 Population the complete collection of elements (scores, people, measurements, etc.) to be studied Sample a subcollection of elements drawn from a population 11 The Nature
Massachusetts Institute of Technology
 Summary of Results for Special Random Variables Discrete Uniform over [a, b]: { 1 p X (k) = b a +1, if k = a, a +1,...,b, 0, otherwise, E[X] = a + b 2 a)(b a + 2), var(x) =(b. 12 Bernoulli with Parameter
MATH 10 INTRODUCTORY STATISTICS
 MATH 10 INTRODUCTORY STATISTICS Tommy Khoo Your friendly neighbourhood graduate student. Week 1 Chapter 1 Introduction What is Statistics? Why do you need to know Statistics? Technical lingo and concepts:
Determining the Spread of a Distribution
 Determining the Spread of a Distribution 1.3-1.5 Cathy Poliak, Ph.D. cathy@math.uh.edu Department of Mathematics University of Houston Lecture 3-2311 Lecture 3-2311 1 / 58 Outline 1 Describing Quantitative
Practical Statistics
 Practical Statistics Lecture 1 (Nov. 9): - Correlation - Hypothesis Testing Lecture 2 (Nov. 16): - Error Estimation - Bayesian Analysis - Rejecting Outliers Lecture 3 (Nov. 18) - Monte Carlo Modeling -
Unit 10: Simple Linear Regression and Correlation
 Unit 10: Simple Linear Regression and Correlation Statistics 571: Statistical Methods Ramón V. León 6/28/2004 Unit 10 - Stat 571 - Ramón V. León 1 Introductory Remarks Regression analysis is a method for
Washington Island School Grade Level: 8th Subject: Mathematics. Curriculum Map Date Approved: Teacher: Daniel Jaeger
 Washington Island School Grade Level: 8th Subject: Mathematics Curriculum Map Date Approved: Teacher: Daniel Jaeger Course Description and Core Principles: Big Ideas Math 8, a common core curriculum is
Introductory Mathematics
 Introductory Mathematics 1998 2003 1.01 Identify subsets of the real number system. 1.02 Estimate and compute with rational Grade 7: 1.02 numbers. 1.03 Compare, order, and convert among Grade 6: 1.03 fractions,
20 Hypothesis Testing, Part I
 20 Hypothesis Testing, Part I Bob has told Alice that the average hourly rate for a lawyer in Virginia is $200 with a standard deviation of $50, but Alice wants to test this claim. If Bob is right, she
Determining the Spread of a Distribution
 Determining the Spread of a Distribution 1.3-1.5 Cathy Poliak, Ph.D. cathy@math.uh.edu Department of Mathematics University of Houston Lecture 3-2311 Lecture 3-2311 1 / 58 Outline 1 Describing Quantitative