CS444/544: Midterm Review. Carlos Scheidegger
|
|
|
- Archibald Mason
- 5 years ago
- Views:
Transcription
1 CS444/544: Midterm Review Carlos Scheidegger
2 D3: DATA-DRIVEN DOCUMENTS
3 The essential idea D3 creates a two-way association between elements of your dataset and entries in the DOM D3 operates on selections methods apply to all elements in the selection
4 Data Joins d3 associates data to a selection with the data method d3.select( svg ).selectall( circle ).data(inputdata).enter().append( circle ).attr( r, function(d) { return d.age; });
.data(inputdata).enter().append( circle ).")
5 Join Selections d3.select( svg ).selectall( circle ).data(inputdata).enter().append( circle ).attr( r, function(d) { return d.age; });
6 Selection methods selection.method(accessor) selection: which elements to change method: what to change about elements accessor: which aspect of the data d3.select( svg ).selectall( circle ).data(inputdata).enter().append( circle ).attr( r, function(d) { return d.age; });
7 Selection methods selection.method(accessor) selection: which elements to change method: what to change about elements accessor: which aspect of the data d3.select( svg ).selectall( circle ).data(inputdata).enter().append( circle ).attr( r, function(d) { return d.age; });
8 Selection methods selection.method(accessor) selection: which elements to change method: what to change about elements accessor: which aspect of the data d3.select( svg ).selectall( circle ).data(inputdata).enter().append( circle ).attr( r, function(d) { return d.age; });
9 Write a d3 statement to select all circles in this DOM <svg id= svg > <g> <circle cx=300 cy=400 r=30 fill=red/> <circle cx=200 cy=30 r=50 fill=blue/> <circle cx=40 cy=20 r=60 fill=black/> </g> </svg> d3.select( #svg ).selectall( circle )
10 Write a d3 statement to set the radius of all red circles to 40 <svg id= svg > <g id= group1 > <circle cx=300 cy=400 r=30 fill=blue/> <circle cx=200 cy=30 r=50 fill=blue/> <circle cx=40 cy=20 r=60 fill=blue/> </g> <g id= group2 > <circle cx=300 cy=400 r=30 fill=red/> <circle cx=200 cy=30 r=50 fill=red/> <circle cx=40 cy=20 r=60 fill=red/> </g> </svg>
11 You have data stored in an array: var data = [ { age: 5, height: 3 }, { age: 12, height: 30 }, { age: 15, height: 40 } ]; Create a list of rectangles inside the svg element, each bound to an element of data <svg id= svg > </svg>
12 You have data stored in an array: var data = [ { age: 5, height: 3 }, { age: 12, height: 30 }, { age: 15, height: 40 } ]; The variable sel currently holds a selection of three rectangles, each bound to an element of data. Write a d3 statement that sets to red the fill color of all rectangles bound to values with age greater than 10.
13 d3 scales scales encode transformations between different spaces var scale = d3.scalelinear(); scale.domain([d1, d2]): where the transformation comes from scale.range([t1, t2]): where the transformation goes to scale(x): send x through transformation
14 d3 scales var scale = d3.scalelinear().domain([10, 30]).range([100, 200]); What s the result of scale(20)? scale(50)?
15 PRINCIPLES

16 Color Vision

17 Color Vision Deficiencies Never use red-green as primary color discriminator!
18 SPATIAL ADAPTATION
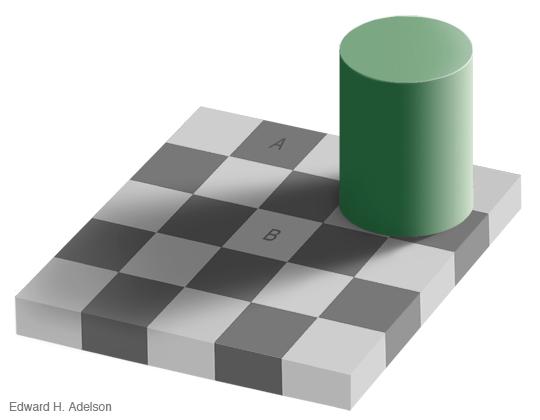
19 SPATIAL ADAPTATION

20

21
22
23

24
25
26 TEMPORAL ADAPTATION


27 Color Spaces RGB, CMYK, HSL: Device dependent. Good for computers, bad for humans Lab, Polar Lab ( HCL ): Perceptually-driven, better distances in coordinates are meaningful coordinates are perceptually meaningful
28 Do not rely only on hue boundaries to depict shape
29 Do not rely only on hue boundaries to depict shape
30 Area affects saturation perception
31 Area affects saturation perception

32 Saturation affects area perception
33 Area affects saturation perception Saturation affects area perception Do not change saturation if task involves area judgement Do not change area if task involves saturation judgement
34 Saturation Consider implied ordering in color channels Hue Luminance
35 If you re going to use the rainbow colormap, use an isoluminant version, quantize it, or both Bad Better
36 Be aware of implied and perceptually forced color relationships For categorical data, use color only when you have few categories (less than 10)
37 Q: You re given this color scale for a map of temperatures. What s wrong?
38 Q: You re given this color scale for a map of rainfall variation (from much less than normal, to normal, to much more than normal). What s wrong? Much more than normal normal Much less than normal
39 Q: You re given this color scale for a map of locally popular religious views across a country. What s wrong? Catholicism Unitarianism Judaism
40 THE STANDARD VISUAL CHANNELS
41

42 Cleveland/McGill perception papers
43 PREATTENTIVENESS, OR VISUAL POP-OUT
44
 return red ; else return blue ; } else { if (d.")
45 function(d) { if (d.row > 4) return blue ; else return red ; } function(d) { if (d.column > 4) { if (d.shape === square ) return red ; else return blue ; } else { if (d.shape === square ) return blue ; else return square ; } }
46 Preattentiveness (mostly) works onechannel-at-a-time.
47 Integral vs. Separable Channels Do humans perceive values as a whole, or as things that can be split? Use separable channels for multi-variate encodings
48 Integral vs. Separable Channels Separable Integral color x location color x shape x-size x y-size color x motion size x orientation r-g x y-b Colin Ware, 2004, p180
 Baraba and Finkner, via Tufte")
49 Bivariate Color Maps (This one is bad) Baraba and Finkner, via Tufte (VDQI)

50 Bivariate Color Maps (This one is pretty good)
51 Q: Why?
52 To get (some) separability in colors, use Luminance, Contrast, and Hue
53 INTERACTION, FILTERING, AGGREGATION
54 Q: Your data has five different attributes. How to show all relationships? use five different channels in a single plot wrong answer: we lose preattentiveness, and there aren t that many good channels
55 What if there s too much data? Sometimes you can t present all the data in a single plot Show multiple good plots and linked views Interaction
56 What if there s too much data? Sometimes you can t present all the data in a single plot Interaction: let the user drive what aspect of the data is being displayed Filtering: Selectively hide some of the data points Aggregation: Show visual representations of subsets of the data
57 Shneiderman s Visual information seeking mantra Overview first, zoom and filter, then details-on-demand
58 Overview first: Before all else, show a highlevel view, possibly through appropriate aggregation
59 Zoom and Filter: Use interaction to create user-specified views
60 Details on Demand: Individual points or attributes should be available, but only as requested
61 TECHNIQUES: SPATIAL ARRANGEMENTS

62 Transformations
63 Transformations

64 Transformations
65 Line Charts
66 Bank to 45 degrees
67 Many dimensions

68 Parallel Coordinates
69 Principal Component Analysis Species PC2 0.0 Petal.Width Petal.Length setosa versicolor 0.1 Sepal.Length Sepal.Width virginica PC1
PRINCIPAL COMPONENTS ANALYSIS
 PRINCIPAL COMPONENTS ANALYSIS Iris Data Let s find Principal Components using the iris dataset. This is a well known dataset, often used to demonstrate the effect of clustering algorithms. It contains
CSC2524 L0101 TOPICS IN INTERACTIVE COMPUTING: INFORMATION VISUALISATION DATA MODELS. Fanny CHEVALIER
 CSC2524 L0101 TOPICS IN INTERACTIVE COMPUTING: INFORMATION VISUALISATION DATA MODELS Fanny CHEVALIER VISUALISATION DATA MODELS AND REPRESENTATIONS Source: http://www.hotbutterstudio.com/ THE INFOVIS
Intro to Info Vis. CS 725/825 Information Visualization Spring } Before class. } During class. Dr. Michele C. Weigle
 CS 725/825 Information Visualization Spring 2018 Intro to Info Vis Dr. Michele C. Weigle http://www.cs.odu.edu/~mweigle/cs725-s18/ Today } Before class } Reading: Ch 1 - What's Vis, and Why Do It? } During
The SAS System 18:28 Saturday, March 10, Plot of Canonical Variables Identified by Cluster
 The SAS System 18:28 Saturday, March 10, 2018 1 The FASTCLUS Procedure Replace=FULL Radius=0 Maxclusters=2 Maxiter=10 Converge=0.02 Initial Seeds Cluster SepalLength SepalWidth PetalLength PetalWidth 1
Creative Data Mining
 Creative Data Mining Using ML algorithms in python Artem Chirkin Dr. Daniel Zünd Danielle Griego Lecture 7 0.04.207 /7 What we will cover today Outline Getting started Explore dataset content Inspect visually
MULTIVARIATE HOMEWORK #5
 MULTIVARIATE HOMEWORK #5 Fisher s dataset on differentiating species of Iris based on measurements on four morphological characters (i.e. sepal length, sepal width, petal length, and petal width) was subjected
Principal Component Analysis (PCA) Principal Component Analysis (PCA)
 Principal Component Analysis (PCA)") Recall: Eigenvectors of the Covariance Matrix Covariance matrices are symmetric. Eigenvectors are orthogonal Eigenvectors are ordered by the magnitude of eigenvalues: λ 1 λ 2 λ p {v 1, v 2,..., v n } Recall:
Recall: Eigenvectors of the Covariance Matrix Covariance matrices are symmetric. Eigenvectors are orthogonal Eigenvectors are ordered by the magnitude of eigenvalues: λ 1 λ 2 λ p {v 1, v 2,..., v n } Recall:
1. Introduction to Multivariate Analysis
 1. Introduction to Multivariate Analysis Isabel M. Rodrigues 1 / 44 1.1 Overview of multivariate methods and main objectives. WHY MULTIVARIATE ANALYSIS? Multivariate statistical analysis is concerned with
Welcome! Power BI User Group (PUG) Copenhagen
 Copenhagen") Welcome! Power BI User Group (PUG) Copenhagen Making Maps in Power BI Andrea Martorana Tusa BI Specialist Welcome to Making maps in Power BI Who am I? First name: Andrea. Last name: Martorana Tusa. Italian,
Welcome! Power BI User Group (PUG) Copenhagen Making Maps in Power BI Andrea Martorana Tusa BI Specialist Welcome to Making maps in Power BI Who am I? First name: Andrea. Last name: Martorana Tusa. Italian,
How to display data badly
 How to display data badly Karl W Broman Biostatistics & Medical Informatics University of Wisconsin Madison kbroman.org github.com/kbroman @kwbroman Using Microsoft Excel to obscure your data and annoy
Part I. Linear Discriminant Analysis. Discriminant analysis. Discriminant analysis
 Week 5 Based in part on slides from textbook, slides of Susan Holmes Part I Linear Discriminant Analysis October 29, 2012 1 / 1 2 / 1 Nearest centroid rule Suppose we break down our data matrix as by the
Extended Mosaic and Association Plots for Visualizing (Conditional) Independence. Achim Zeileis David Meyer Kurt Hornik
 Independence. Achim Zeileis David Meyer Kurt Hornik") Extended Mosaic and Association Plots for Visualizing (Conditional) Independence Achim Zeileis David Meyer Kurt Hornik Overview The independence problem in -way contingency tables Standard approach: χ
Extended Mosaic and Association Plots for Visualizing (Conditional) Independence Achim Zeileis David Meyer Kurt Hornik Overview The independence problem in -way contingency tables Standard approach: χ
Color perception SINA 08/09
 Color perception Color adds another dimension to visual perception Enhances our visual experience Increase contrast between objects of similar lightness Helps recognizing objects However, it is clear that
Data Visualization (DSC 530/CIS )
") Data Visualization (DSC 530/CIS 602-01) Tables Dr. David Koop Visualization of Tables Items and attributes For now, attributes are not known to be positions Keys and values - key is an independent attribute
Data Visualization (DSC 530/CIS 602-01) Tables Dr. David Koop Visualization of Tables Items and attributes For now, attributes are not known to be positions Keys and values - key is an independent attribute
Data Visualization (CIS 468)
") Data Visualization (CIS 468) Tables & Maps Dr. David Koop Discriminability What is problematic here? File vtkdatasetreader PythonSource vtkimageclip vtkimagedatageometryfilter vtkimageresample vtkimagereslice
Data Visualization (CIS 468) Tables & Maps Dr. David Koop Discriminability What is problematic here? File vtkdatasetreader PythonSource vtkimageclip vtkimagedatageometryfilter vtkimageresample vtkimagereslice
Visualizing Independence Using Extended Association and Mosaic Plots. Achim Zeileis David Meyer Kurt Hornik
 Visualizing Independence Using Extended Association and Mosaic Plots Achim Zeileis David Meyer Kurt Hornik Overview The independence problem in 2-way contingency tables Standard approach: χ 2 test Alternative
Chapter 7: Making Maps with GIS. 7.1 The Parts of a Map 7.2 Choosing a Map Type 7.3 Designing the Map
 Chapter 7: Making Maps with GIS 7.1 The Parts of a Map 7.2 Choosing a Map Type 7.3 Designing the Map What is a map? A graphic depiction of all or part of a geographic realm in which the real-world features
The next generation in weather radar software.
 The next generation in weather radar software. PUBLISHED BY Vaisala Oyj Phone (int.): +358 9 8949 1 P.O. Box 26 Fax: +358 9 8949 2227 FI-00421 Helsinki Finland Try IRIS Focus at iris.vaisala.com. Vaisala
Data Mining with R. Linear Classifiers and the Perceptron Algorithm. Hugh Murrell
 Data Mining with R Linear Classifiers and the Perceptron Algorithm Hugh Murrell references These slides are based on a notes by Cosma Shalizi and an essay by Charles Elkan, but are self contained and access
Bayesian Classification Methods
 Bayesian Classification Methods Suchit Mehrotra North Carolina State University smehrot@ncsu.edu October 24, 2014 Suchit Mehrotra (NCSU) Bayesian Classification October 24, 2014 1 / 33 How do you define
Opponent Color Spaces
 C. A. Bouman: Digital Image Processing - January 8, 2018 1 Opponent Color Spaces Perception of color is usually not best represented in RGB. A better model of HVS is the so-call opponent color model Opponent
Applied Multivariate and Longitudinal Data Analysis
 Applied Multivariate and Longitudinal Data Analysis Chapter 2: Inference about the mean vector(s) Ana-Maria Staicu SAS Hall 5220; 919-515-0644; astaicu@ncsu.edu 1 In this chapter we will discuss inference
Predictive Analytics on Accident Data Using Rule Based and Discriminative Classifiers
 Advances in Computational Sciences and Technology ISSN 0973-6107 Volume 10, Number 3 (2017) pp. 461-469 Research India Publications http://www.ripublication.com Predictive Analytics on Accident Data Using
x n -2.5 Definition A list is a list of objects, where multiplicity is allowed, and order matters. For example, as lists
 Vectors, Linear Combinations, and Matrix-Vector Mulitiplication In this section, we introduce vectors, linear combinations, and matrix-vector multiplication The rest of the class will involve vectors,
Perceptually Uniform Color Spaces
 C. A. Bouman: Digital Image Processing - January 8, 2018 1 Perceptually Uniform Color Spaces Problem: Small changes in XYZ may result in small or large perceptual changes. Solution: Formulate a perceptually
ISCID-CO Dunkerque/ULCO. Mathematics applied to economics and management Foundations of Descriptive and Inferential Statistics
 IMBS 1 ISCID-CO Dunkerque/ULCO Mathematics applied to economics and management Foundations of Descriptive and Inferential Statistics December 2015 - Final assessment - Session 1 - Semester 1 Time allowed
Vision & Perception. Simple model: simple reflectance/illumination model. image: x(n 1,n 2 )=i(n 1,n 2 )r(n 1,n 2 ) 0 < r(n 1,n 2 ) < 1
=i(n 1,n 2 )r(n 1,n 2 ) 0 < r(n 1,n 2 ) < 1") Simple model: simple reflectance/illumination model Eye illumination source i(n 1,n 2 ) image: x(n 1,n 2 )=i(n 1,n 2 )r(n 1,n 2 ) reflectance term r(n 1,n 2 ) where 0 < i(n 1,n 2 ) < 0 < r(n 1,n 2 )
Simple model: simple reflectance/illumination model Eye illumination source i(n 1,n 2 ) image: x(n 1,n 2 )=i(n 1,n 2 )r(n 1,n 2 ) reflectance term r(n 1,n 2 ) where 0 < i(n 1,n 2 ) < 0 < r(n 1,n 2 )
Linear Discriminant Analysis Based in part on slides from textbook, slides of Susan Holmes. November 9, Statistics 202: Data Mining
 Linear Discriminant Analysis Based in part on slides from textbook, slides of Susan Holmes November 9, 2012 1 / 1 Nearest centroid rule Suppose we break down our data matrix as by the labels yielding (X
Making sense of Math in Vis. Gordon Kindlmann University of Chicago
 Making sense of Math in Vis Gordon Kindlmann University of Chicago glk@uchicago.edu (from seminar description) http://www.dagstuhl.de/en/program/calendar/semhp/?semnr=18041 Mathematical foundations of
MAP SYMBOL BREWER A NEW APPROACH FOR A CARTOGRAPHIC MAP SYMBOL GENERATOR
 MAP SYMBOL BREWER A NEW APPROACH FOR A CARTOGRAPHIC MAP SYMBOL GENERATOR Olaf Schnabel Institute of Cartography, Swiss Federal Institute of Technology (ETH) CH-8093 Zurich, Switzerland schnabel@karto.baug.ethz.ch
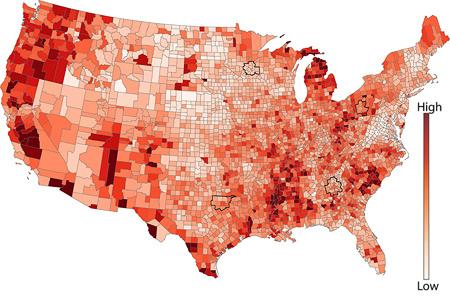
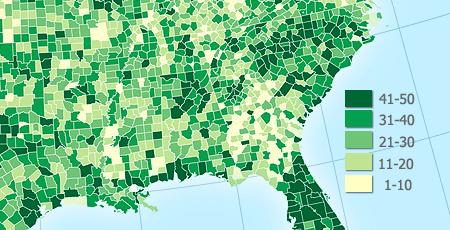
The Choropleth Map Slide #2: Choropleth mapping enumeration units
 The Choropleth Map Slide #2: Choropleth mapping is a common technique for representing enumeration data These are maps where enumeration units, such as states or countries, are shaded a particular color
4 Statistics of Normally Distributed Data
 4 Statistics of Normally Distributed Data 4.1 One Sample a The Three Basic Questions of Inferential Statistics. Inferential statistics form the bridge between the probability models that structure our
SYDE 575: Introduction to Image Processing. Image Compression Part 2: Variable-rate compression
 SYDE 575: Introduction to Image Processing Image Compression Part 2: Variable-rate compression Variable-rate Compression: Transform-based compression As mentioned earlier, we wish to transform image data
Visual Quality Assessment of Subspace Clusterings
 Visual Quality Assessment of Subspace Clusterings Michael Hund1, Ines Färber2, Michael Behrisch1, Andrada Tatu1, Tobias Schreck3, Daniel A. Keim1, Thomas Seidl4 1 2 University of Konstanz, Germany {lastname@dbvis.inf.uni-konstanz.de}
 http://www.wrcc.dri.edu/csc/scenic/ USER GUIDE 2017 Introduction... 2 Overview Data... 3 Overview Analysis Tools... 4 Overview Monitoring Tools... 4 SCENIC structure and layout... 5... 5 Detailed Descriptions
Color and compositing
 Color and compositing 2D Computer Graphics: Diego Nehab Summer 208. Radiometry Measurement of radiant energy in terms of absolute power Wave vs. particle Wavelength (λ), frequency (ν = c λ ), and amplitude
Residual-based Shadings for Visualizing (Conditional) Independence
 Independence") Residual-based Shadings for Visualizing (Conditional) Independence Achim Zeileis David Meyer Kurt Hornik http://www.ci.tuwien.ac.at/~zeileis/ Overview The independence problem in 2-way contingency tables
Residual-based Shadings for Visualizing (Conditional) Independence Achim Zeileis David Meyer Kurt Hornik http://www.ci.tuwien.ac.at/~zeileis/ Overview The independence problem in 2-way contingency tables
Robust scale estimation with extensions
 Robust scale estimation with extensions Garth Tarr, Samuel Müller and Neville Weber School of Mathematics and Statistics THE UNIVERSITY OF SYDNEY Outline The robust scale estimator P n Robust covariance
Visual Imaging and the Electronic Age Color Science
 Visual Imaging and the Electronic Age Color Science Color Gamuts & Color Spaces for User Interaction Lecture #7 September 16, 2014 Donald P. Greenberg Color Triangle for XYZ Y g 2 1 Z r -2-1 b 1 X XYZ
Data Mining and Analysis
 978--5-766- - Data Mining and Analysis: Fundamental Concepts and Algorithms CHAPTER Data Mining and Analysis Data mining is the process of discovering insightful, interesting, and novel patterns, as well
Complex Numbers. A complex number z = x + iy can be written in polar coordinates as re i where
 Lab 20 Complex Numbers Lab Objective: Create visualizations of complex functions. Visually estimate their zeros and poles, and gain intuition about their behavior in the complex plane. Representations
NEW PIXEL SORTING METHOD FOR PALETTE BASED STEGANOGRAPHY AND COLOR MODEL SELECTION
 NEW PIXEL SORTING METHOD FOR PALETTE BASED STEGANOGRAPHY AND COLOR MODEL SELECTION Sos S. Agaian 1 and Juan P. Perez 2 1NSP Lab, The University of Texas at San Antonio, Electrical Engineering Department,
Digital Image Processing
 Digital Image Processing 16 November 2006 Dr. ir. Aleksandra Pizurica Prof. Dr. Ir. Wilfried Philips Aleksandra.Pizurica @telin.ugent.be Tel: 09/264.3415 UNIVERSITEIT GENT Telecommunicatie en Informatieverwerking
Color2Gray: Salience-Preserving Color Removal
 Color2Gray: Salience-Preserving Color Removal Amy Gooch Sven Olsen Jack Tumblin Bruce Gooch Slides by Gooch et al. Color Removal Color Grayscale Color Removal Color Proposed Algorithm Isoluminant Colors
CS : Spatial Data Modeling and Analysis. Geovisualization
 CS260-002: Spatial Data Modeling and Analysis Geovisualization Visual Perception Learning Styles & Personality Types: Visual, Auditory, Kinesthetic Cholera cases in the London epidemic of 1854 Cholera
Thinking in Frequency
 09/05/17 Thinking in Frequency Computational Photography University of Illinois Derek Hoiem Administrative Matlab/linear algebra tutorial tomorrow, planned for 6:30pm Probably 1214 DCL (will send confirmation
Motion influences the Effects of Systematic Chromatic Changes
 Motion influences the Effects of Systematic Chromatic Changes Peggy Gérardin 1, Philippe Roud 1, Sabine Süsstrunk 1 and Kenneth Knoblauch 2,3 1 Ecole Polytechnique Fédérale de Lausanne (EPFL), Lausanne,
Colour Part One. Energy Density CPSC 553 P Wavelength 700 nm
 Colour Part One Energy Density 400 Wavelength 700 nm CPSC 553 P 1 Human Perception An Active Organising Process Many illusions experiments from psychology Colour not just a matter of measuring wavelength
VISUAL EXPLORATION OF SPATIAL-TEMPORAL TRAFFIC CONGESTION PATTERNS USING FLOATING CAR DATA. Candra Kartika 2015
 VISUAL EXPLORATION OF SPATIAL-TEMPORAL TRAFFIC CONGESTION PATTERNS USING FLOATING CAR DATA Candra Kartika 2015 OVERVIEW Motivation Background and State of The Art Test data Visualization methods Result
Clojure Concurrency Constructs, Part Two. CSCI 5828: Foundations of Software Engineering Lecture 13 10/07/2014
 Clojure Concurrency Constructs, Part Two CSCI 5828: Foundations of Software Engineering Lecture 13 10/07/2014 1 Goals Cover the material presented in Chapter 4, of our concurrency textbook In particular,
Multivariate Statistics
 Multivariate Statistics Chapter 2: Multivariate distributions and inference Pedro Galeano Departamento de Estadística Universidad Carlos III de Madrid pedro.galeano@uc3m.es Course 2016/2017 Master in Mathematical
December 3, Dipartimento di Informatica, Università di Torino. Felicittà. Visualizing and Estimating Happiness in
 : : Dipartimento di Informatica, Università di Torino December 3, 2013 : Outline : from social media Social media users generated contents represent the human behavior in everyday life, but... how to analyze
ISyE 6416: Computational Statistics Spring Lecture 5: Discriminant analysis and classification
 ISyE 6416: Computational Statistics Spring 2017 Lecture 5: Discriminant analysis and classification Prof. Yao Xie H. Milton Stewart School of Industrial and Systems Engineering Georgia Institute of Technology
Cell-based Model For GIS Generalization
 Cell-based Model For GIS Generalization Bo Li, Graeme G. Wilkinson & Souheil Khaddaj School of Computing & Information Systems Kingston University Penrhyn Road, Kingston upon Thames Surrey, KT1 2EE UK
CEE598 - Visual Sensing for Civil Infrastructure Eng. & Mgmt.
 CEE598 - Visual Sensing for Civil Infrastructure Eng. & Mgmt. Session 8- Linear Filters From Spatial Domain to Frequency Domain Mani Golparvar-Fard Department of Civil and Environmental Engineering 329D,
Complex Numbers. Visualize complex functions to estimate their zeros and poles.
 Lab 1 Complex Numbers Lab Objective: Visualize complex functions to estimate their zeros and poles. Polar Representation of Complex Numbers Any complex number z = x + iy can be written in polar coordinates
Smart use of Geographic Information System (GIS) platform for delivering weather information and nowcasting services
 platform for delivering weather information and nowcasting services") Smart use of Geographic Information System (GIS) platform for delivering weather information and nowcasting services C. K. Pan Hong Kong Observatory Hong Kong, China It is a world of beauty Source: Image
Smart use of Geographic Information System (GIS) platform for delivering weather information and nowcasting services C. K. Pan Hong Kong Observatory Hong Kong, China It is a world of beauty Source: Image
CSCI 2150 Intro to State Machines
 CSCI 2150 Intro to State Machines Topic: Now that we've created flip-flops, let's make stuff with them Reading: igital Fundamentals sections 6.11 and 9.4 (ignore the JK flip-flop stuff) States Up until
Question 1. The figure shows four pairs of charged particles. For each pair, let V = 0 at infinity and consider V net at points on the x axis.
 Question 1 The figure shows four pairs of charged particles. For each pair, let V = 0 at infinity and consider V net at points on the x axis. For which pairs is there a point at which V net = 0 between
Optimum Notch Filtering - I
 Notch Filtering 1 Optimum Notch Filtering - I Methods discussed before: filter too much image information. Optimum: minimizes local variances of the restored image fˆ x First Step: Extract principal freq.
An Introduction to Multivariate Methods
 Chapter 12 An Introduction to Multivariate Methods Multivariate statistical methods are used to display, analyze, and describe data on two or more features or variables simultaneously. I will discuss multivariate
The Visual Perception of Images
 C. A. Bouman: Digital Image Processing - January 8, 2018 1 The Visual Perception of Images In order to understand images you must understand how humans perceive visual stimulus. Objectives: Understand
Geo-Visualization. GRS09/10 Ron van Lammeren
 Geo-Visualization GRS09/10 Ron van Lammeren 2/30 Theory Semiologie Graphique http://www.flickr.com/photos/kbean/491051226/ 3/30 How to present my geo data? Visualization definitions Map making Cartographic
Discriminant Analysis (DA)
") Discriminant Analysis (DA) Involves two main goals: 1) Separation/discrimination: Descriptive Discriminant Analysis (DDA) 2) Classification/allocation: Predictive Discriminant Analysis (PDA) In DDA Classification
Discriminant Analysis (DA) Involves two main goals: 1) Separation/discrimination: Descriptive Discriminant Analysis (DDA) 2) Classification/allocation: Predictive Discriminant Analysis (PDA) In DDA Classification
Visual Imaging and the Electronic Age Color Science Metamers & Chromaticity Diagrams. Lecture #6 September 7, 2017 Prof. Donald P.
 Visual Imaging and the Electronic Age Color Science Metamers & Chromaticity Diagrams Lecture #6 September 7, 2017 Prof. Donald P. Greenberg Matching the Power Spectrum of the Test Lamp with a Full Set
Geo-Visualization. GRS1011 Ron van Lammeren
 Geo-Visualization GRS1011 Ron van Lammeren Theory Semiologie Graphique http://www.flickr.com/photos/kbean/491051226/ 2/30 How to present my geo data? Visualization definitions Map making Cartographic process
1 Probabilities. 1.1 Basics 1 PROBABILITIES
 1 PROBABILITIES 1 Probabilities Probability is a tricky word usually meaning the likelyhood of something occuring or how frequent something is. Obviously, if something happens frequently, then its probability
USAGE OF OLD MAPS AND THEIR DISTRIBUTION WITHIN THE FRAME OF WEB MAP SERVICES
 USAGE OF OLD MAPS AND THEIR DISTRIBUTION WITHIN THE FRAME OF WEB MAP SERVICES Jiri Cajthaml, Jiri Krejci Czech Technical University in Prague, Faculty of Civil Engineering, Department of Mapping and Cartography,
Chi Square Analysis M&M Statistics. Name Period Date
 Chi Square Analysis M&M Statistics Name Period Date Have you ever wondered why the package of M&Ms you just bought never seems to have enough of your favorite color? Or, why is it that you always seem
Global Scene Representations. Tilke Judd
 Global Scene Representations Tilke Judd Papers Oliva and Torralba [2001] Fei Fei and Perona [2005] Labzebnik, Schmid and Ponce [2006] Commonalities Goal: Recognize natural scene categories Extract features
Lecture 1: Latin Squares!
 Latin Squares Instructor: Paddy Lecture : Latin Squares! Week of Mathcamp 00 Introduction Definition. A latin square of order n is a n n array, filled with symbols {,... n}, such that no symbol is repeated
Advanced Forecast. For MAX TM. Users Manual
 Advanced Forecast For MAX TM Users Manual www.maxtoolkit.com Revised: June 24, 2014 Contents Purpose:... 3 Installation... 3 Requirements:... 3 Installer:... 3 Setup: spreadsheet... 4 Setup: External Forecast
Color vision and colorimetry
 Color vision and colorimetry Photoreceptor types Rods Scotopic vision (low illumination) Do not mediate color perception High density in the periphery to capture many quanta Low spatial resolution Many-to-one
Validation Report for Precipitation products from Cloud Physical Properties (PPh-PGE14: PCPh v1.0 & CRPh v1.0)
") Page: 1/26 Validation Report for Precipitation SAF/NWC/CDOP2/INM/SCI/VR/15, Issue 1, Rev. 0 15 July 2013 Applicable to SAFNWC/MSG version 2013 Prepared by AEMET Page: 2/26 REPORT SIGNATURE TABLE Function
Page: 1/26 Validation Report for Precipitation SAF/NWC/CDOP2/INM/SCI/VR/15, Issue 1, Rev. 0 15 July 2013 Applicable to SAFNWC/MSG version 2013 Prepared by AEMET Page: 2/26 REPORT SIGNATURE TABLE Function
Visualization. Maneesh Agrawala and Michael Bernstein CS 247
 Visualization Maneesh Agrawala and Michael Bernstein CS 247 Topics Why do we create visualizations? Data and image Estimating magnitude Deconstructions What is Visualization? Definition [www.oed.com] 1.
Geography 360 Principles of Cartography. April 17, 2006
 Geography 360 Principles of Cartography April 17, 2006 Outlines Cartographic design principles Enhancing visual hierarchies on maps Kinds of numerical data and color scheme What is proportional symbol
Geovisualization of Attribute Uncertainty
 Geovisualization of Attribute Uncertainty Hyeongmo Koo 1, Yongwan Chun 2, Daniel A. Griffith 3 University of Texas at Dallas, 800 W. Campbell Road, Richardson, Texas 75080, 1 Email: hxk134230@utdallas.edu
Scientific Visualization at University of Chicago. Gordon L. Kindlmann Let!s recap some Calculus Taylor expansion of scalar field
 Scientific Visualization at University of Chicago Gordon L. Kindlmann Let!s recap some Calculus Taylor expansion of scalar field f(x 0 + )=f(x 0 )+ f(x 0 ) + o( ) x 0 f(x 0 ) f(x 0 )
Trouble-Shooting Coordinate System Problems
 Trouble-Shooting Coordinate System Problems Written by Barbara M. Parmenter. Revised on October 2, 2018 OVERVIEW OF THE EXERCISE... 1 COPYING THE MAP PROJECTION EXERCISE FOLDER TO YOUR H: DRIVE OR DESKTOP...
Data Mining. CS57300 Purdue University. Bruno Ribeiro. February 8, 2018
 Data Mining CS57300 Purdue University Bruno Ribeiro February 8, 2018 Decision trees Why Trees? interpretable/intuitive, popular in medical applications because they mimic the way a doctor thinks model
Sequential Logic (3.1 and is a long difficult section you really should read!)
") EECS 270, Fall 2014, Lecture 6 Page 1 of 8 Sequential Logic (3.1 and 3.2. 3.2 is a long difficult section you really should read!) One thing we have carefully avoided so far is feedback all of our signals
EECS 270, Fall 2014, Lecture 6 Page 1 of 8 Sequential Logic (3.1 and 3.2. 3.2 is a long difficult section you really should read!) One thing we have carefully avoided so far is feedback all of our signals
Last time: PCA. Statistical Data Mining and Machine Learning Hilary Term Singular Value Decomposition (SVD) Eigendecomposition and PCA
 Eigendecomposition and PCA") Last time: PCA Statistical Data Mining and Machine Learning Hilary Term 2016 Dino Sejdinovic Department of Statistics Oxford Slides and other materials available at: http://www.stats.ox.ac.uk/~sejdinov/sdmml
Last time: PCA Statistical Data Mining and Machine Learning Hilary Term 2016 Dino Sejdinovic Department of Statistics Oxford Slides and other materials available at: http://www.stats.ox.ac.uk/~sejdinov/sdmml
Comp 11 Lectures. Mike Shah. July 26, Tufts University. Mike Shah (Tufts University) Comp 11 Lectures July 26, / 40
 Comp 11 Lectures July 26, / 40") Comp 11 Lectures Mike Shah Tufts University July 26, 2017 Mike Shah (Tufts University) Comp 11 Lectures July 26, 2017 1 / 40 Please do not distribute or host these slides without prior permission. Mike
Comp 11 Lectures Mike Shah Tufts University July 26, 2017 Mike Shah (Tufts University) Comp 11 Lectures July 26, 2017 1 / 40 Please do not distribute or host these slides without prior permission. Mike
Multimedia Information Systems
 Multimedia Information Systems Samson Cheung EE 639, Fall 2004 Lecture 3 & 4: Color, Video, and Fundamentals of Data Compression 1 Color Science Light is an electromagnetic wave. Its color is characterized
Article from. Predictive Analytics and Futurism. July 2016 Issue 13
 Article from Predictive Analytics and Futurism July 2016 Issue 13 Regression and Classification: A Deeper Look By Jeff Heaton Classification and regression are the two most common forms of models fitted
Quick Reference Manual. Ver. 1.3
 Quick Reference Manual Ver. 1.3 1 EXASITE Voyage EXSITE Voyage is a web-based communication tool designed to support the following users; Ship operators who utilize Optimum Ship Routing (OSR) service in
Vector Analysis: Farm Land Suitability Analysis in Groton, MA
 Vector Analysis: Farm Land Suitability Analysis in Groton, MA Written by Adrienne Goldsberry, revised by Carolyn Talmadge 10/9/2018 Introduction In this assignment, you will help to identify potentially
Visualisation of Spatial Data
 Visualisation of Spatial Data VU Visual Data Science Johanna Schmidt WS 2018/19 2 Visual Data Science Introduction to Visualisation Basics of Information Visualisation Charts and Techniques Introduction
Physical Geography Lab Activity #15
 Physical Geography Lab Activity #15 Due date Name Choropleth Maps COR Objective 1 & 7, SLOs 1 & 3 15.1. Introduction Up until this point we have used maps to find locations on the Earth. While they are
Representation of Geographic Data
 GIS 5210 Week 2 The Nature of Spatial Variation Three principles of the nature of spatial variation: proximity effects are key to understanding spatial variation issues of geographic scale and level of
Internet Video Search
 Internet Video Search Arnold W.M. Smeulders & Cees Snoek CWI & UvA Overview Image and Video Search Lecture 1 Lecture 2 Lecture 3 visual search, the problem color-spatial-textural-temporal features measures
Multimedia communications
 Multimedia communications Comunicazione multimediale G. Menegaz gloria.menegaz@univr.it Prologue Context Context Scale Scale Scale Course overview Goal The course is about wavelets and multiresolution
Basic Verification Concepts
 Basic Verification Concepts Barbara Brown National Center for Atmospheric Research Boulder Colorado USA bgb@ucar.edu Basic concepts - outline What is verification? Why verify? Identifying verification
Image Analysis. PCA and Eigenfaces
 Image Analysis PCA and Eigenfaces Christophoros Nikou cnikou@cs.uoi.gr Images taken from: D. Forsyth and J. Ponce. Computer Vision: A Modern Approach, Prentice Hall, 2003. Computer Vision course by Svetlana
Color Image Correction
 FLDE. p. 1/48 Color Image Correction Benasque, September 2007 Vicent Caselles Departament de Tecnologia Universitat Pompeu Fabra joint work with M.Bertalmío, R. Palma, E. Provenzi FLDE. p. 2/48 Overview
Introduction to Colorimetry
 IES NY Issues in Color Seminar February 26, 2011 Introduction to Colorimetry Jean Paul Freyssinier Lighting Research Center, Rensselaer Polytechnic Institute Troy, New York, U.S.A. sponsored by www.lrc.rpi.edu/programs/solidstate/assist
Efficient Algorithms and Intractable Problems Spring 2016 Alessandro Chiesa and Umesh Vazirani Midterm 2
 CS 170 Efficient Algorithms and Intractable Problems Spring 2016 Alessandro Chiesa and Umesh Vazirani Midterm 2 Name: SID: GSI and section time: Write down the names of the students around you as they
Cognitive semantics and cognitive theories of representation: Session 6: Conceptual spaces
 Cognitive semantics and cognitive theories of representation: Session 6: Conceptual spaces Martin Takáč Centre for cognitive science DAI FMFI Comenius University in Bratislava Príprava štúdia matematiky
EEC 686/785 Modeling & Performance Evaluation of Computer Systems. Lecture 11
 EEC 686/785 Modeling & Performance Evaluation of Computer Systems Lecture Department of Electrical and Computer Engineering Cleveland State University wenbing@ieee.org (based on Dr. Raj Jain s lecture
Exploring the map reading process with eye movement analysis
 Exploring the map reading process with eye movement analysis Vassilios Krassanakis School of Rural & Surveying Engineering, National Technical University of Athens 9, Heroon Polytechniou Str., Zographos,