Data Visualization (CIS 468)
|
|
|
- Brittany Lynch
- 5 years ago
- Views:
Transcription
1 Data Visualization (CIS 468) Tables & Maps Dr. David Koop
2 Discriminability What is problematic here? File vtkdatasetreader PythonSource vtkimageclip vtkimagedatageometryfilter vtkimageresample vtkimagereslice vtkwarpscalar vtkcolortransferfunction vtklookuptable vtkelevationfilter vtkoutlinefilter PythonSource vtkpolydatanormals vtkpolydatamapper vtkproperty vtkdatasetmapper vtkscalarbaractor vtkactor vtkcamera vtkactor vtklodactor vtkcubeaxesactor2d vtkrenderer VTKCell [Koop et al., 2013] 2
3 Separability [GOOD] 3
4 Separability [GOOD] 3
5 Visualizing Tables Express Values Separate, Order, Align Regions Separate Order Align 1 Key 2 Keys 3 Keys Many Keys List Matrix Volume Recursive Subdivision Axis Orientation Rectilinear Parallel Radial Layout Density Dense Space-Filling [Munzner (ill. Maguire), 2014] 4
6 Scatterplots Prices in 1980 Fish Prices over the Years Prices in 1970 Data: two quantitative values Task: find trends, clusters, outliers How: marks at spatial position in horizontal and vertical directions Correlation: dependence between two attributes - Positive and negative correlation - Indicated by lines Coordinate system (axes) and labels are important! 5
7 Bar Charts Data: one quantitative attribute, one categorical attribute Task: lookup & compare values How: line marks, vertical position (quantitative), horizontal position (categorical) What about length? Ordering criteria: alphabetical or using quantitative attribute Scalability: distinguishability - bars at least one pixel wide - hundreds Animal Type Animal Type [Munzner (ill. Maguire), 2014] 6
8 Dot and Line Charts Year Data: one quantitative attribute, one ordered attribute Task: lookup values, find outliers and trends How: point mark and positions Line Charts: add connection mark (line) Similar to scatterplots but allow ordered attribute Year [Munzner (ill. Maguire), 2014] 7
9 Proper Use of Line and Bar Charts Female Lion Antelope Panda Male Female Lion Antelope Male What does the line indicate? Does this make sense? [Adapted from Zacks and Tversky, 1999, Munzner (ill. Maguire), 2014] 8

10 Streamgraphs [Ebb and Flow of Movies, M. Bloch et al., New York Times, 2008] 9
11 Multiscale Banking 706 IEEE TRANSACTIONS ON VISUALIZATIO Sunspot Cycles Aspect Ratio = 3.96 Aspect Ratio = Power Spectrum [Heer and Agrawala, 2006] 10

12 Assignment 2 Link Use Tableau and D3 to create stacked bar charts of Citibike data Due Friday, Start now! 11
, <12 colors Red-green color scales often used - Be aware of colorblindness! Fast-Pitch Softball Slugging Percentage [fastpitchanalytics.")
13 Heatmaps Data: Two keys, one quantitative attribute Task: Find clusters, outliers, summarize How: area marks in grid, color encoding of quantitative attribute Scalability: number of pixels for area marks (millions), <12 colors Red-green color scales often used - Be aware of colorblindness! Fast-Pitch Softball Slugging Percentage [fastpitchanalytics.com] 12
14 Bertin Matrices Must we only use color? - What other marks might be appropriate? [C.Perrin et al., 2014] 13

15 Bertin Matrices Must we only use color? - What other marks might be appropriate? [C.Perrin et al., 2014] 13

16 Bertin s Encodings Text text Grayscale QUANTITY OF INK ENCODINGS POSITIONAL ENCODING MEAN-BASED ENCODINGS Circle Dual bar chart Bar chart Line Black and white bar chart Average bar chart [C.Perrin et al., 2014] 14
, Photo by Robert")
17 Matrix Reordering [Bertin Exhibit (INRIA, Vis 2014), Photo by Robert Kosara] 15

18 Cluster Heatmap [File System Similarity, R. Musăloiu-E., 2009] 16
19 Cluster Heatmap Data & Task: Same as Heatmap How: Area marks but matrix is ordered by cluster hierarchies Scalability: limited by the cluster dendrogram Dendrogram: a visual encoding of tree data with leaves aligned 17
20 Sepal.Length Sepal.Width Petal.Length Petal.Width Iris Data (red=setosa,green=versicolor,blue=virginica) Scatterplot Matrix (SPLOM) Data: Many quantitative attributes Derived Data: names of attributes Task: Find correlations, trends, outliers How: Scatterplots in matrix alignment Scale: attributes: ~12, items: hundreds? Visualizations in a visualization: at high level, marks are themselves visualizations 18 [Wikipedia]
21 Spatial Axis Orientation So far, we have seen the vertical and horizontal axes (a rectilinear layout) used to encode almost everything What other possibilities are there for axes? [Munzner (ill. Maguire), 2014] 19
22 Spatial Axis Orientation So far, we have seen the vertical and horizontal axes (a rectilinear layout) used to encode almost everything What other possibilities are there for axes? - Parallel axes Math Physics Dance Drama Parallel Coordinates [Munzner (ill. Maguire), 2014] 19
23 Spatial Axis Orientation So far, we have seen the vertical and horizontal axes (a rectilinear layout) used to encode almost everything What other possibilities are there for axes? - Parallel axes - Radial axes Math Physics Dance Drama Parallel Coordinates [Munzner (ill. Maguire), 2014] 19
24 Radial Axes
25 Radial Axes Polar Coordinates (angle + position along the line at that angle) What types of encodings are possible for tabular data in polar coordinates?
26 Radial Axes Polar Coordinates (angle + position along the line at that angle) What types of encodings are possible for tabular data in polar coordinates? - Radial bar charts Pie charts - Donut charts
27 Part-of-whole: Relative % comparison? 40M 35M 30M Population 65 Years and Over 45 to 64 Years 25 to 44 Years 18 to 24 Years 14 to 17 Years 5 to 13 Years Under 5 Years 25M 20M 15M 10M 5M 0M CA TX NY FL IL PA OH MI GA NC NJ VA WA AZ MA IN TN MOMD WI MN CO AL SC LA KY OR OK CT IA MS AR KS UT NV NMWV NE ID ME NH HI RI MT DE SD AK ND VT DC WY [Stacked Bar Chart, Bostock, 2017] 21
28 Normalized Stacked Bar Chart 100% 90% 65 Years and Over 80% 70% 45 to 64 Years 60% 50% 40% 25 to 44 Years 30% 18 to 24 Years 20% 14 to 17 Years 10% 5 to 13 Years 0% UT TX ID AZ NV GA AK MSNM NE CA OK SD CO KS WYNC AR LA IN IL MN DE HI SCMO VA IA TN KY AL WAMDND OH WI OR NJ MT MI FL NY DC CT PA MAWV RI NH ME VT Under 5 Years [Normalized Stacked Bar Chart, Bostock, 2017] 22
29 Pie Chart 65 < [Pie Chart, Bostock, 2017] 23
30 Pie Charts vs. bar charts [Munzner's Textbook, 2014] - Angle channel is lower precision then position in bar charts What about donut charts? Are we judging angle, or are we judging area, or arc length? - See "An Illustrated Study of the Pie Chart Study Results" by R. Kosara 24

31 Arcs, Angles, or Areas? [R. Kosara and D. Skau, 2016] 25

32 Absolute Error Relative to Pie Chart [R. Kosara and D. Skau, 2016] 26
33 Conclusion: We do not read pie charts by angle 27
34 Pies vs. Bars but area is still harder to judge than position Screens are usually not round 28
35 Geographic Visualization 29
36 Geographic Visualization Spatial data (have positions) Cartography: the science of drawing maps - Lots of history and well-established procedures - May also have non-spatial attributes associated with items - Thematic cartography: integrate these non-spatial attributes (e.g. population, life expectancy, etc.) Goals: - Respect cartographic principles - Understand data with geographic references with the visualization principles 30

37 Map Projection [P. Foresman, Wikimedia] 31

38 Flattening the Sphere? [USGS Map Projections] 32

39 Lambert Conformal Conic Projection [USGS Map Projections] 33
40 Standard Projections [J. P. Snyder, USGS] 34

41 Map Projections [xkcd] 35

42 Projection Classification Angle-preserving [J. van Wijk, 2008] 36
43 Search Tasks Location known Location unknown Target known Lookup Locate Target unknown Browse Explore [Munzner (ill. Maguire), 2014] 37
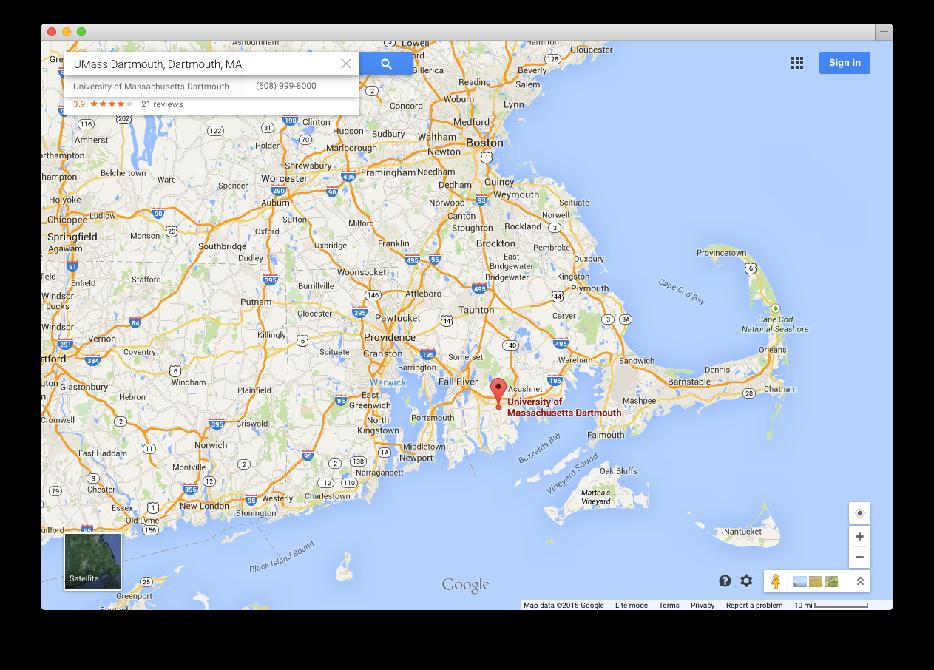
44 Lookup 38
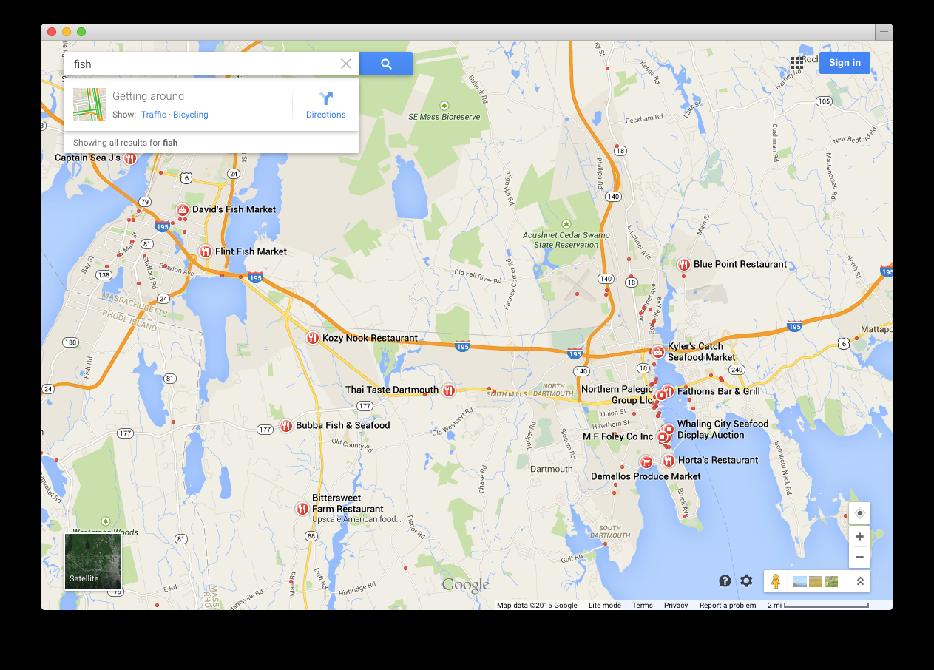
45 Locate 39
46 Adding Data Discrete: a value is associated with a specific position - Size - Color Hue - Charts Continuous: each spatial position has a value (fields) - Heatmap - Isolines 40
47 Discrete Categorical Attribute: Shape [Acadia NP, National Park Service] 41


48 Discrete Categorical Attribute: Shape [Acadia NP, National Park Service] 41

49 Discrete Quantitative Attribute: Color Saturation 42

50 Discrete Quantitative Attribute: Size 43

51 Discrete Quantitative Attributes: Bar Chart [ 44

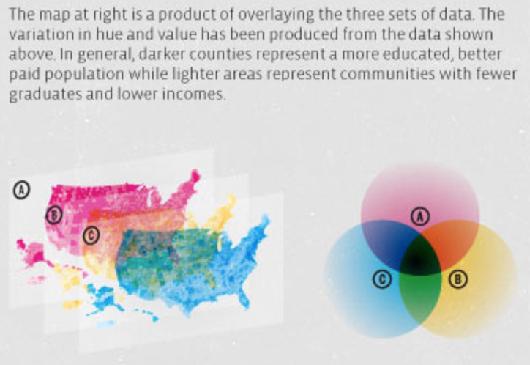
52 Continuous Quantitative Attribute: Color Hue [ 45

53 Time as the attribute [NYTimes] 46

54 Isolines [USGS via Wikipedia] 47
55 Isolines Scalar fields: - value at each location - sampled on grids Isolines use derived data from the scalar field - Interpret field as representing continuous values - Derived data is geometry: new lines that represent the same attribute value Scalability: dozens of levels Other encodings? 48
Data Visualization (DSC 530/CIS )
") Data Visualization (DSC 530/CIS 602-01) Tables Dr. David Koop Visualization of Tables Items and attributes For now, attributes are not known to be positions Keys and values - key is an independent attribute
Data Visualization (DSC 530/CIS 602-01) Tables Dr. David Koop Visualization of Tables Items and attributes For now, attributes are not known to be positions Keys and values - key is an independent attribute
Lecture 26 Section 8.4. Mon, Oct 13, 2008
 Lecture 26 Section 8.4 Hampden-Sydney College Mon, Oct 13, 2008 Outline 1 2 3 4 Exercise 8.12, page 528. Suppose that 60% of all students at a large university access course information using the Internet.
Use your text to define the following term. Use the terms to label the figure below. Define the following term.
 Mapping Our World Section. and Longitude Skim Section of your text. Write three questions that come to mind from reading the headings and the illustration captions.. Responses may include questions about
Analyzing Severe Weather Data
 Chapter Weather Patterns and Severe Storms Investigation A Analyzing Severe Weather Data Introduction Tornadoes are violent windstorms associated with severe thunderstorms. Meteorologists carefully monitor
Your Galactic Address
 How Big is the Universe? Usually you think of your address as only three or four lines long: your name, street, city, and state. But to address a letter to a friend in a distant galaxy, you have to specify
Nursing Facilities' Life Safety Standard Survey Results Quarterly Reference Tables
 Nursing Facilities' Life Safety Standard Survey Results Quarterly Reference Tables Table of Contents Table 1: Summary of Life Safety Survey Results by State Table 2: Ten Most Frequently Cited Life Safety
CIS 467/602-01: Data Visualization
 IS 467/602-01: Data Visualization etworks Dr. David Koop IS 467, Spring 2015 Assignment 2 http://www.cis.umassd.edu/ ~dkoop/cis467/assignment2.html Scaling width Text elements and selectall Any other questions?
Sample Statistics 5021 First Midterm Examination with solutions
 THE UNIVERSITY OF MINNESOTA Statistics 5021 February 12, 2003 Sample First Midterm Examination (with solutions) 1. Baseball pitcher Nolan Ryan played in 20 games or more in the 24 seasons from 1968 through
Multiway Analysis of Bridge Structural Types in the National Bridge Inventory (NBI) A Tensor Decomposition Approach
 A Tensor Decomposition Approach") Multiway Analysis of Bridge Structural Types in the National Bridge Inventory (NBI) A Tensor Decomposition Approach By Offei A. Adarkwa Nii Attoh-Okine (Ph.D) (IEEE Big Data Conference -10/27/2014) 1 Presentation
Multiway Analysis of Bridge Structural Types in the National Bridge Inventory (NBI) A Tensor Decomposition Approach By Offei A. Adarkwa Nii Attoh-Okine (Ph.D) (IEEE Big Data Conference -10/27/2014) 1 Presentation
Evolution Strategies for Optimizing Rectangular Cartograms
 Evolution Strategies for Optimizing Rectangular Cartograms Kevin Buchin 1, Bettina Speckmann 1, and Sander Verdonschot 2 1 TU Eindhoven, 2 Carleton University September 20, 2012 Sander Verdonschot (Carleton
Appendix 5 Summary of State Trademark Registration Provisions (as of July 2016)
") Appendix 5 Summary of State Trademark Registration Provisions (as of July 2016) App. 5-1 Registration Renewal Assignments Dates Term # of of 1st # of Use # of Form Serv. Key & State (Years) Fee Spec. Use
Appendix 5 Summary of State Trademark Registration Provisions (as of July 2016) App. 5-1 Registration Renewal Assignments Dates Term # of of 1st # of Use # of Form Serv. Key & State (Years) Fee Spec. Use
Parametric Test. Multiple Linear Regression Spatial Application I: State Homicide Rates Equations taken from Zar, 1984.
 Multiple Linear Regression Spatial Application I: State Homicide Rates Equations taken from Zar, 984. y ˆ = a + b x + b 2 x 2K + b n x n where n is the number of variables Example: In an earlier bivariate
Drought Monitoring Capability of the Oklahoma Mesonet. Gary McManus Oklahoma Climatological Survey Oklahoma Mesonet
 Drought Monitoring Capability of the Oklahoma Mesonet Gary McManus Oklahoma Climatological Survey Oklahoma Mesonet Mesonet History Commissioned in 1994 Atmospheric measurements with 5-minute resolution,
Smart Magnets for Smart Product Design: Advanced Topics
 Smart Magnets for Smart Product Design: Advanced Topics Today s Presenter Jason Morgan Vice President Engineering Correlated Magnetics Research 6 Agenda Brief overview of Correlated Magnetics Research
Statistical Mechanics of Money, Income, and Wealth
 Statistical Mechanics of Money, Income, and Wealth Victor M. Yakovenko Adrian A. Dragulescu and A. Christian Silva Department of Physics, University of Maryland, College Park, USA http://www2.physics.umd.edu/~yakovenk/econophysics.html
SAMPLE AUDIT FORMAT. Pre Audit Notification Letter Draft. Dear Registrant:
 Pre Audit Notification Letter Draft Dear Registrant: The Pennsylvania Department of Transportation (PennDOT) is a member of the Federally Mandated International Registration Plan (IRP). As part of this
What Lies Beneath: A Sub- National Look at Okun s Law for the United States.
 What Lies Beneath: A Sub- National Look at Okun s Law for the United States. Nathalie Gonzalez Prieto International Monetary Fund Global Labor Markets Workshop Paris, September 1-2, 2016 What the paper
EXST 7015 Fall 2014 Lab 08: Polynomial Regression
 EXST 7015 Fall 2014 Lab 08: Polynomial Regression OBJECTIVES Polynomial regression is a statistical modeling technique to fit the curvilinear data that either shows a maximum or a minimum in the curve,
Cluster Analysis. Part of the Michigan Prosperity Initiative
 Cluster Analysis Part of the Michigan Prosperity Initiative 6/17/2010 Land Policy Institute Contributors Dr. Soji Adelaja, Director Jason Ball, Visiting Academic Specialist Jonathon Baird, Research Assistant
Summary of Natural Hazard Statistics for 2008 in the United States
 Summary of Natural Hazard Statistics for 2008 in the United States This National Weather Service (NWS) report summarizes fatalities, injuries and damages caused by severe weather in 2008. The NWS Office
2006 Supplemental Tax Information for JennisonDryden and Strategic Partners Funds
 2006 Supplemental Information for JennisonDryden and Strategic Partners s We have compiled the following information to help you prepare your 2006 federal and state tax returns: Percentage of income from
Annual Performance Report: State Assessment Data
 Annual Performance Report: 2005-2006 State Assessment Data Summary Prepared by: Martha Thurlow, Jason Altman, Damien Cormier, and Ross Moen National Center on Educational Outcomes (NCEO) April, 2008 The
Swine Enteric Coronavirus Disease (SECD) Situation Report June 30, 2016
 Situation Report June 30, 2016") Animal and Plant Health Inspection Service Veterinary Services Swine Enteric Coronavirus Disease (SECD) Situation Report June 30, 2016 Information current as of 12:00 pm MDT, 06/29/2016 This report provides
Animal and Plant Health Inspection Service Veterinary Services Swine Enteric Coronavirus Disease (SECD) Situation Report June 30, 2016 Information current as of 12:00 pm MDT, 06/29/2016 This report provides
Class business PS is due Wed. Lecture 20 (QPM 2016) Multivariate Regression November 14, / 44
 Multivariate Regression November 14, / 44") Multivariate Regression Prof. Jacob M. Montgomery Quantitative Political Methodology (L32 363) November 14, 2016 Lecture 20 (QPM 2016) Multivariate Regression November 14, 2016 1 / 44 Class business PS
Multivariate Regression Prof. Jacob M. Montgomery Quantitative Political Methodology (L32 363) November 14, 2016 Lecture 20 (QPM 2016) Multivariate Regression November 14, 2016 1 / 44 Class business PS
Forecasting the 2012 Presidential Election from History and the Polls
 Forecasting the 2012 Presidential Election from History and the Polls Drew Linzer Assistant Professor Emory University Department of Political Science Visiting Assistant Professor, 2012-13 Stanford University
C Further Concepts in Statistics
 Appendix C.1 Representing Data and Linear Modeling C1 C Further Concepts in Statistics C.1 Representing Data and Linear Modeling Use stem-and-leaf plots to organize and compare sets of data. Use histograms
Module 19: Simple Linear Regression
 Module 19: Simple Linear Regression This module focuses on simple linear regression and thus begins the process of exploring one of the more used and powerful statistical tools. Reviewed 11 May 05 /MODULE
Empirical Application of Panel Data Regression
 Empirical Application of Panel Data Regression 1. We use Fatality data, and we are interested in whether rising beer tax rate can help lower traffic death. So the dependent variable is traffic death, while
Swine Enteric Coronavirus Disease (SECD) Situation Report Sept 17, 2015
 Situation Report Sept 17, 2015") Animal and Plant Health Inspection Service Veterinary Services Swine Enteric Coronavirus Disease (SECD) Situation Report Sept 17, 2015 Information current as of 12:00 pm MDT, 09/16/2015 This report provides
Animal and Plant Health Inspection Service Veterinary Services Swine Enteric Coronavirus Disease (SECD) Situation Report Sept 17, 2015 Information current as of 12:00 pm MDT, 09/16/2015 This report provides
Swine Enteric Coronavirus Disease (SECD) Situation Report Mar 5, 2015
 Situation Report Mar 5, 2015") Animal and Plant Health Inspection Service Veterinary Services Swine Enteric Coronavirus Disease (SECD) Situation Report Mar 5, 2015 Information current as of 12:00 pm MDT, 03/04/2015 This report provides
Animal and Plant Health Inspection Service Veterinary Services Swine Enteric Coronavirus Disease (SECD) Situation Report Mar 5, 2015 Information current as of 12:00 pm MDT, 03/04/2015 This report provides
Meteorology 110. Lab 1. Geography and Map Skills
 Meteorology 110 Name Lab 1 Geography and Map Skills 1. Geography Weather involves maps. There s no getting around it. You must know where places are so when they are mentioned in the course it won t be
AIR FORCE RESCUE COORDINATION CENTER
 AIR FORCE RESCUE COORDINATION CENTER 2006 ANNUAL REPORT 1 TABLE OF CONTENTS AFRCC CHARTER & MISSION STATEMENT 3 AFRCC ORGANIZATION 4 TABLE 1 10 YEAR LOOKBACK 5 TABLE 2 ACTIVITY BY MISSION TYPE 6 TABLE
Final Exam. 1. Definitions: Briefly Define each of the following terms as they relate to the material covered in class.
 Name Answer Key Economics 170 Spring 2003 Honor pledge: I have neither given nor received aid on this exam including the preparation of my one page formula list and the preparation of the Stata assignment
REGRESSION ANALYSIS BY EXAMPLE
 REGRESSION ANALYSIS BY EXAMPLE Fifth Edition Samprit Chatterjee Ali S. Hadi A JOHN WILEY & SONS, INC., PUBLICATION CHAPTER 5 QUALITATIVE VARIABLES AS PREDICTORS 5.1 INTRODUCTION Qualitative or categorical
Scatterplots. STAT22000 Autumn 2013 Lecture 4. What to Look in a Scatter Plot? Form of an Association
 Scatterplots STAT22000 Autumn 2013 Lecture 4 Yibi Huang October 7, 2013 21 Scatterplots 22 Correlation (x 1, y 1 ) (x 2, y 2 ) (x 3, y 3 ) (x n, y n ) A scatter plot shows the relationship between two
Some concepts are so simple
 Density: How Concentrated is Our Population? Morton J. Marcus Director Emeritus, Indiana Business Research Center, Kelley School of Business, Indiana University Some concepts are so simple to understand.
The veto as electoral stunt
 The veto as eectora stunt EITM and a test with comparative data Eric ITAM, Mexico City Apr. 2, 203 eitm@mpsa Motivation A Form: see EITM in action forma mode 2 comparative statics 3 fasifiabe impications
Discontinuation of Support for Field Chemistry Measurements in the National Atmospheric Deposition Program National Trends Network (NADP/NTN)
") Discontinuation of Support for Field Chemistry Measurements in the National Atmospheric Deposition Program National Trends Network (NADP/NTN) Christopher Lehmann, NADP Program Office, Illinois State Water
Discontinuation of Support for Field Chemistry Measurements in the National Atmospheric Deposition Program National Trends Network (NADP/NTN) Christopher Lehmann, NADP Program Office, Illinois State Water
Kari Lock. Department of Statistics, Harvard University Joint Work with Andrew Gelman (Columbia University)
") Bayesian Combinaion of Sae Polls and Elecion Forecass Kari Lock Deparmen of Saisics, Harvard Universiy Join Work wih Andrew Gelman (Columbia Universiy Harvard Insiue for Quaniaive Social Science Feb 4
Bayesian Combinaion of Sae Polls and Elecion Forecass Kari Lock Deparmen of Saisics, Harvard Universiy Join Work wih Andrew Gelman (Columbia Universiy Harvard Insiue for Quaniaive Social Science Feb 4
Resources. Amusement Park Physics With a NASA Twist EG GRC
 Resources 141 EG-2003-03-010-GRC 142 EG-2003-03-01o-GRC Vocabulary acceleration-the rate of change of velocity displacement-change in position of an object force-a push or a pull exerted on some object
AFRCC AIR FORCE RESCUE COORDINATION CENTER
 AFRCC AIR FORCE RESCUE COORDINATION CENTER 2003 ANNUAL REPORT AFRCC ANNUAL REPORT TABLE OF CONTENTS AFRCC Mission Statement and Charter... 3 Organizational Chart... 4 Commander's Comments... 5 2003 AFRCC
$3.6 Billion GNMA Servicing Offering
 $3.6 Billion GNMA Servicing Offering Offering R2-0818 Bid Date: 8/14/2018 Bids are due by 5:00 PM EST Mortgage Industry Advisory Corporation 521 Fifth Avenue 9th Floor New York, NY 10175 TEL: (212) 233-1250
Combinatorics. Problem: How to count without counting.
 Combinatorics Problem: How to count without counting. I How do you figure out how many things there are with a certain property without actually enumerating all of them. Sometimes this requires a lot of
Analysis of the USDA Annual Report (2015) of Animal Usage by Research Facility. July 4th, 2017
 of Animal Usage by Research Facility. July 4th, 2017") Analysis of the USDA Annual Report (2015) of Animal Usage by Research Facility July 4th, 2017 Author's information: Jorge Sigler, Catherine Perry, Amanda Gray, James Videle For inquiries contact James
Analysis of the USDA Annual Report (2015) of Animal Usage by Research Facility July 4th, 2017 Author's information: Jorge Sigler, Catherine Perry, Amanda Gray, James Videle For inquiries contact James
Further Concepts in Statistics
 Appendix D Further Concepts in Statistics D1 Appendix D Further Concepts in Statistics Stem-and-Leaf Plots Histograms and Frequency Distributions Line Graphs Choosing an Appropriate Graph Scatter Plots
Week 3 Linear Regression I
 Week 3 Linear Regression I POL 200B, Spring 2014 Linear regression is the most commonly used statistical technique. A linear regression captures the relationship between two or more phenomena with a straight
Regression Diagnostics
 Diag 1 / 78 Regression Diagnostics Paul E. Johnson 1 2 1 Department of Political Science 2 Center for Research Methods and Data Analysis, University of Kansas 2015 Diag 2 / 78 Outline 1 Introduction 2
Draft Report. Prepared for: Regional Air Quality Council 1445 Market Street, Suite 260 Denver, Colorado Prepared by:
 Draft Report Evaluation of Preliminary MM5 Meteorological Model Simulation for the June-July 2006 Denver Ozone SIP Modeling Period Focused on Colorado Prepared for: Regional Air Quality Council 1445 Market
Further Concepts in Statistics
 Appendix C Further Concepts in Statistics C1 Appendix C Further Concepts in Statistics Stem-and-Leaf Plots Histograms and Frequency Distributions Line Graphs Choosing an Appropriate Graph Scatter Plots
Effects of Various Uncertainty Sources on Automatic Generation Control Systems
 Effects of Various Uncertainty Sources on Automatic Generation Control Systems D. Apostolopoulou, Y. C. Chen, J. Zhang, A. D. Domínguez-García, and P. W. Sauer University of Illinois at Urbana-Champaign
Time-Series Trends of Mercury Deposition Network Data
 Time-Series Trends of Mercury Deposition Network Data Peter Weiss 1, David Gay 2, Mark Brigham 3, Matthew Parsons 4, Arnout Ter Schure 5 1 University of California, Santa Cruz, 2 National Atmospheric Deposition
AC/RC Regional Councils of Colonels & Partnerships
 AC/RC Regional Councils of Colonels & Partnerships WESTERN REGION AC: SJA, I Corps RC: Cdr, 6 th LOD GREAT LAKES REGION AC: SJA, 101 st ABN Div (AA)) RC: Cdr, 9 th LOD NORTHEAST REGION AC: SJA, 10 th Mtn
Overview key concepts and terms (based on the textbook Chang 2006 and the practical manual)
") Introduction Geo-information Science (GRS-10306) Overview key concepts and terms (based on the textbook 2006 and the practical manual) Introduction Chapter 1 Geographic information system (GIS) Geographically
Introduction Geo-information Science (GRS-10306) Overview key concepts and terms (based on the textbook 2006 and the practical manual) Introduction Chapter 1 Geographic information system (GIS) Geographically
Teachers Curriculum Institute Map Skills Toolkit 411
 Map kills Toolkit To the Teacher tudents encounter maps every day inside and outside their classes in books and on handheld devices, computers, or television screens. Whether they re navigating cities
Outline. Administrivia and Introduction Course Structure Syllabus Introduction to Data Mining
 Outline Administrivia and Introduction Course Structure Syllabus Introduction to Data Mining Dimensionality Reduction Introduction Principal Components Analysis Singular Value Decomposition Multidimensional
CS444/544: Midterm Review. Carlos Scheidegger
 CS444/544: Midterm Review Carlos Scheidegger D3: DATA-DRIVEN DOCUMENTS The essential idea D3 creates a two-way association between elements of your dataset and entries in the DOM D3 operates on selections
APRIL 1999 THE WALL STREET JOURNAL CLASSROOM EDITION Hurricanes, typhoons, coastal storms Earthquake (San Francisco area) Flooding
 Flooding") 12 THE WALL STREET JOURNAL CLASSROOM EDITION APRIL 1999 THE COST OF DISASTERS APRIL 1999 THE WALL STREET JOURNAL CLASSROOM EDITION 13 THE COST OF DISASTERS FORCES OF NATURE The U.S. government spends billions
12 THE WALL STREET JOURNAL CLASSROOM EDITION APRIL 1999 THE COST OF DISASTERS APRIL 1999 THE WALL STREET JOURNAL CLASSROOM EDITION 13 THE COST OF DISASTERS FORCES OF NATURE The U.S. government spends billions
Test of Convergence in Agricultural Factor Productivity: A Semiparametric Approach
 Test of Convergence in Agricultural Factor Productivity: A Semiparametric Approach Krishna P. Paudel, Louisiana State University and LSU Agricultural Center Mahesh Pandit, Louisiana State University and
2/25/2019. Taking the northern and southern hemispheres together, on average the world s population lives 24 degrees from the equator.
 Where is the world s population? Roughly 88 percent of the world s population lives in the Northern Hemisphere, with about half north of 27 degrees north Taking the northern and southern hemispheres together,
Graphing Data. Example:
 Graphing Data Bar graphs and line graphs are great for looking at data over time intervals, or showing the rise and fall of a quantity over the passage of time. Example: Auto Sales by Year Year Number
Estimating Dynamic Games of Electoral Competition to Evaluate Term Limits in U.S. Gubernatorial Elections: Online Appendix
 Estimating Dynamic Games of Electoral Competition to Evaluate Term Limits in U.S. Gubernatorial Elections: Online ppendix Holger Sieg University of Pennsylvania and NBER Chamna Yoon Baruch College I. States
GEOREFERENCING, PROJECTIONS Part I. PRESENTING DATA Part II
 Week 7 GEOREFERENCING, PROJECTIONS Part I PRESENTING DATA Part II topics of the week Georeferencing Coordinate systems Map Projections ArcMap and Projections Geo-referencing Geo-referencing is the process
Creative Data Mining
 Creative Data Mining Using ML algorithms in python Artem Chirkin Dr. Daniel Zünd Danielle Griego Lecture 7 0.04.207 /7 What we will cover today Outline Getting started Explore dataset content Inspect visually
Introduction to Mathematical Statistics and Its Applications Richard J. Larsen Morris L. Marx Fifth Edition
 Introduction to Mathematical Statistics and Its Applications Richard J. Larsen Morris L. Marx Fifth Edition Pearson Education Limited Edinburgh Gate Harlow Essex CM20 2JE England and Associated Companies
Geographic Information Systems. Introduction to Data and Data Sources
 Geographic Information Systems Introduction to Data and Data Sources Presented by John Showler, NJDA-SSCC NJ SCD GIS Training Session December 10, 209 The Objectives of this session are 3-fold: 1. Introduce
Map image from the Atlas of Oregon (2nd. Ed.), Copyright 2001 University of Oregon Press
, Copyright 2001 University of Oregon Press") Map Layout and Cartographic Design with ArcGIS Desktop Matthew Baker ESRI Educational Services Redlands, CA Education UC 2008 1 Seminar overview General map design principles Working with map elements
Map Layout and Cartographic Design with ArcGIS Desktop Matthew Baker ESRI Educational Services Redlands, CA Education UC 2008 1 Seminar overview General map design principles Working with map elements
Blueline Tilefish Assessment Approach: Stock structure, data structure, and modeling approach
 Blueline Tilefish Assessment Approach: Stock structure, data structure, and modeling approach Nikolai Klibansky National Oceanic and Atmospheric Administration August 28, 2017 Nikolai Klibansky (NOAA)
Geographers Perspectives on the World
 What is Geography? Geography is not just about city and country names Geography is not just about population and growth Geography is not just about rivers and mountains Geography is a broad field that
Topographic Recreational Map Of New Mexico: Detailed Travel Map By GTR Mapping
 Topographic Recreational Map Of New Mexico: Detailed Travel Map By GTR Mapping Biological Assessment for Proposed Reconstruction of New Mexico Forest Highway 12. Cuba and Jemez Recreation Opportunity Spectrum
Measurement the Distance between Points on the Map
 International Journal of Engineering Science Invention ISSN (Online): 2319 6734, ISSN (Print): 2319 6726 ǁ Volume 3 ǁ Issue 1 ǁ January 2014 ǁ PP.01-06 Measurement the Distance between Points on the Map
A Second Opinion Correlation Coefficient. Rudy A. Gideon and Carol A. Ulsafer. University of Montana, Missoula MT 59812
 A Second Opinion Correlation Coefficient Rudy A. Gideon and Carol A. Ulsafer University of Montana, Missoula MT 59812 An important decision in most fields of research is whether two variables are related.
Stat 101 Exam 1 Important Formulas and Concepts 1
 1 Chapter 1 1.1 Definitions Stat 101 Exam 1 Important Formulas and Concepts 1 1. Data Any collection of numbers, characters, images, or other items that provide information about something. 2. Categorical/Qualitative
CS 361: Probability & Statistics
 January 24, 2018 CS 361: Probability & Statistics Relationships in data Standard coordinates If we have two quantities of interest in a dataset, we might like to plot their histograms and compare the two
An interactive tool for teaching map projections
 An interactive tool for teaching map projections Map projections are one of the fundamental concepts of geographic information science and cartography. An understanding of the different variants and properties
Organization of 2D Space
 Organization of 2D Space Linear Frequency is Mapped in 2D Space Linear frequency time series, bar charts, histograms, etc. feature 2possible more sets of information Most data have multi-dimensional and
MULTIVARIATE HOMEWORK #5
 MULTIVARIATE HOMEWORK #5 Fisher s dataset on differentiating species of Iris based on measurements on four morphological characters (i.e. sepal length, sepal width, petal length, and petal width) was subjected
Do Now 18 Balance Point. Directions: Use the data table to answer the questions. 2. Explain whether it is reasonable to fit a line to the data.
 Do Now 18 Do Now 18 Balance Point Directions: Use the data table to answer the questions. 1. Calculate the balance point.. Explain whether it is reasonable to fit a line to the data.. The data is plotted
Keith C. Clarke Department of Geologyand Geography Hunter College-CUNY 695 Park Avenue New York, NY 10021,USA
 DISTORTION ON THE INTERRUPTED MODIFIED COLLIGNON PROJECTION Keith C. Clarke Department of Geologyand Geography Hunter College-CUNY 695 Park Avenue New York, NY 10021,USA and Karen A. Mulcahy Earth and
Maths GCSE Langdon Park Foundation Calculator pack A
 Maths GCSE Langdon Park Foundation Calculator pack A Name: Class: Date: Time: 96 minutes Marks: 89 marks Comments: Q1. The table shows how 25 students travel to school. Walk Bus Car Taxi 9 8 7 1 Draw a
Drake Petroleum Company, Inc. Accutest Job Number: JB Total number of pages in report:
 e-hardcopy 2.0 Automated Report New Jersey 05/06/15 05/06/15 Technical Report for Drake Petroleum Company, Inc. 146282.003 PO#007805 Accutest Job Number: Sampling Date: 03/25/15 Report to: Brown & Caldwell
Chapter 7: Making Maps with GIS. 7.1 The Parts of a Map 7.2 Choosing a Map Type 7.3 Designing the Map
 Chapter 7: Making Maps with GIS 7.1 The Parts of a Map 7.2 Choosing a Map Type 7.3 Designing the Map What is a map? A graphic depiction of all or part of a geographic realm in which the real-world features
Making Maps With GIS. Making Maps With GIS
 Making Maps With GIS Getting Started with GIS Chapter 7 Making Maps With GIS 7.1 The Parts of a Map 7.2 Choosing a Map Type 7.3 Designing the Map 1 What is a map? Map is the communication tool for the
Daily Operations Briefing June 9, 2012 As of 8:30 a.m. EDT
 Daily Operations Briefing June 9, 2012 As of 8:30 a.m. EDT 1 Significant Activity: June 8 9 Significant Events: Little Bear Fire & Whitewater-Baldy Complex Fire - NM Lost Lake Fire & Box Creek Fire UT
CS-11 Tornado/Hail: To Model or Not To Model
 CS-11 Tornado/Hail: To Model or Not To Model CAS Seminar on Reinsurance- June 5, 2012 George Davis 2012 AIR WORLDWIDE CAS Seminar on Reinsurance 1 Antitrust Notice The Casualty Actuarial Society is committed
The Observational Climate Record
 The Observational Climate Record Deke Arndt NOAA s Asheville, NC, USA February 2018 National Oceanic and Atmospheric Administration NOAA Satellite and Information Service National Centers for Environmental
CHAPTER 9 DATA DISPLAY AND CARTOGRAPHY
 CHAPTER 9 DATA DISPLAY AND CARTOGRAPHY 9.1 Cartographic Representation 9.1.1 Spatial Features and Map Symbols 9.1.2 Use of Color 9.1.3 Data Classification 9.1.4 Generalization Box 9.1 Representations 9.2
Basic Training Battlemind to Home Symposium. Sept
 Basic Training Battlemind to Home Symposium Sept 2017 1 What is Measuring Communities? A social indicators project which allows users to obtain military-specific information about communities strengths
MATH 1150 Chapter 2 Notation and Terminology
 MATH 1150 Chapter 2 Notation and Terminology Categorical Data The following is a dataset for 30 randomly selected adults in the U.S., showing the values of two categorical variables: whether or not the
Intro to Info Vis. CS 725/825 Information Visualization Spring } Before class. } During class. Dr. Michele C. Weigle
 CS 725/825 Information Visualization Spring 2018 Intro to Info Vis Dr. Michele C. Weigle http://www.cs.odu.edu/~mweigle/cs725-s18/ Today } Before class } Reading: Ch 1 - What's Vis, and Why Do It? } During
Daily Operations Briefing May 30, 2012 As of 8:30 a.m. EDT
 Daily Operations Briefing May 30, 2012 As of 8:30 a.m. EDT 1 Significant Activity: May 29-30 Significant Events: Severe Weather: NY & OK Wildfire Activity: NM & CO Tropical Activity: Atlantic: Tropical
Chapter 2. Data Analysis
 Chapter 2 Data Analysis 2.1. Density Estimation and Survival Analysis The most straightforward application of BNP priors for statistical inference is in density estimation problems. Consider the generic
Daily Operations Briefing Tuesday, May 14, 2013 As of 8:30 a.m. EDT
 Daily Operations Briefing Tuesday, May 14, 2013 As of 8:30 a.m. EDT 1 Significant Activity: May 13-14 Significant Events: None Significant Weather: Rain & thunderstorms: Northern Plains to Mid-Atlantic;
SECTION 4 PARCEL IDENTIFIERS 4.1 LONGITUDE AND LATITUDE
 SECTION 4 PARCEL IDENTIFIERS 4.1 LONGITUDE AND LATITUDE Most maps must be drawn in such a way that points and areas can be located accurately on the earth's surface and described objectively. A uniform
D3.js Avancé / Time Visualization
 D3.js Avancé / Time Visualization Cours #3 https://lyondataviz.github.io/teaching/lyon1-m2/2017/ Romain Vuillemot OUTLINE SOLUTION: INTERACTIVE LINE CHART TIME VISUALIZATION ADVANCED D3.JS TIME VISUALIZATION
WEATHER MAPS NAME. Temperature: Dew Point: Wind Direction: Wind Velocity: % of Sky Covered: Current Pressure:
 NAME WEATHER MAPS For decades hundreds of weather stations throughout the United States have been making standard observations of temperature, moisture, air pressure and winds. The data are collected centrally
Clear Roads Overview. AASHTO Committee on Maintenance July 23, 2018 Charlotte, North Carolina
 Clear Roads Overview AASHTO Committee on Maintenance July 23, 2018 Charlotte, North Carolina Kyle Lester Director of Highway Maintenance Colorado Department of Transportation Overview Clear Roads Winter
Basic principles of cartographic design. Makram Murad-al-shaikh M.S. Cartography Esri education delivery team
 Basic principles of cartographic design Makram Murad-al-shaikh M.S. Cartography Esri education delivery team Cartographic concepts Cartography defined The communication channel - Why maps fail Objectives
CS 5630/6630 Scientific Visualization. Elementary Plotting Techniques II
 CS 5630/6630 Scientific Visualization Elementary Plotting Techniques II Motivation Given a certain type of data, what plotting technique should I use? What plotting techniques should be avoided? How do
Daily Operations Briefing. Friday, May 30, :30 a.m. EDT
 Daily Operations Briefing Friday, May 30, 2014 8:30 a.m. EDT Significant Activity: May 29 30 Significant Events: M5.9 Earthquake Pingyang, China Tropical Activity Eastern Pacific (Low 10%) Significant
Simulating the State-by-State Effects of Terrorist Attacks on Three Major U.S. Ports: Applying NIEMO (National Interstate Economic Model)
") CREATE Research Archive Non-published Research Reports 8-19-2005 Simulating the State-by-State Effects of Terrorist Attacks on Three Major U.S. Ports: Applying NIEMO (National Interstate Economic Model)
CREATE Research Archive Non-published Research Reports 8-19-2005 Simulating the State-by-State Effects of Terrorist Attacks on Three Major U.S. Ports: Applying NIEMO (National Interstate Economic Model)