A comparison of existing and new methods for the analysis of nonlinear variations in coordinate time series
|
|
|
- Philip Riley
- 5 years ago
- Views:
Transcription


1 IUGG Prague, June 22 July 3, 2015 A comparison of existing and new methods for the analysis of nonlinear variations in coordinate time series Miltiadis Chatzinikos Athanasios Dermanis Department of Geodesy and Surveying - Aristotle University of Thessaloniki
2 Comparison of four methods for the analysis of the GPS position time series: Existing: STD - Standard least-square fitting of periodic function with annual and semiannual frequencies SSA - Singular Spectrum Analysis New: MOD - Least-Square fitting of a amplitude and phase modulated annual signal using continuous piecewise-linear amplitude and phase models ECS - Least-Square fitting of equidistant cubic splines
3 Objectives: - Separate physically meaningful signals from noise in coordinate time series - Introduce easy-to-use models for future update of the ITRF to include also nonlinear coordinate variation terms
4 Coordinate Interpolation method: SSA Singular Spectral Analysis
5 SSA - Singular Spectrum Analysis Time series: 1 2 x, x,..., xn Lag-window size: M c c c c c c c c c c c c c c c c c c C c c c c c c c c c c c c c c c c c c M2 M M3 M M4 M M5 M4 M 2 M 3 M 4 M M 1 M 2 M 3 M Ni 1 c x x, 0 i M 1 i k ki N i k1 a: principal components, E: eigenvectors M k k i i j j j1 a x E, 0 i N M Reconstruction of coordinates: k 1 i k k xi a, 1 1 j 1 i je j i M i k 1 M k k xi a, j 1 i je j M M i N M 1 x k 1 M k k i i j j, j i N M 1 N i N M 2
6 Coordinate Interpolation method: MOD Amplitude and phase modulation of annual carrier by piecewise linear functions
7 MOD - Modeling of coordinate time series by amplitude and phase modulation x( t) A( t)cos 2 t ( t) 0 0 = annual carrier frequency A(t) = amplitude (t) = phase t : k t tk 1 A A A( t) A ( t t ) k k1 k1 k1 tk tk 1 ( t) ( t t ) k k 1 k1 k1 tk tk 1 At () Ak 1 Ak t t t 0 1 t 2 t k 2 tk 1 t k tk 1 tn 2 t n1 t n
8 MOD - Modeling of coordinate time series by amplitude and phase modulation t : k t tk 1 A A x( t ) x( t ) e A ( t t ) cos 2 t ( t t ) e k k1 k k1 i i i k1 i k1 0 i k1 i k1 i tk tk 1 tk tk 1 Linearization f y f ( x) e b y f ( x0) ( x x0) e A x e x 0 x [ A A ] T 0 n 0 n T e Pe min leads to large variation of A k and k! Instead: Tikhonov regularization solution: T T e Pe x Wx min n n T 2 2 x Wx A( Ak Ak 1) ( k k 1) k1 k1 A, : regularization parameters
9 Coordinate Interpolation method: ECS Equidistant Cubic Splines
10 ECS - Modeling of coordinate time series by equidistant cubic splines t t t i1 i : Version 1: Spline in terms of second derivatives g g 2M M M M M x( t) S ( t) g h ( t ) ( t ) ( t ) h 6 2 6h i i1 i1 i i1 2 i i1 3 i i1 i1 i1 i1 N M ds dt ds dt i i1 i ( i ) ( i ) d S dt d S ( ) ( ) dt 2 2 i i1 i 2 i 2 i Constraints for equality of first derivatives 6 M i1 4 M i M i1 ( g 2 i1 2 gi gi 1) h xt () gi 2 S i () 1 t gi 1 Si () t () 1 t.... g i.... h S i t i2 i 1 i i 1
11 ECS - Modeling of coordinate time series by equidistant cubic splines t t t i1 i : Version 2: Spline in terms of first derivatives g g 2N N g g N N x( t) S ( t) g N ( t ) 3 ( t ) 2 ( t ) h h h h N i i1 i1 i 2 i i1 i1 i 3 i i1 i1 i1 2 i1 3 2 i1 ds dt ds dt i i1 i ( i ) ( i ) Constraints for equality of second derivatives M d S dt d S ( ) ( ) dt 2 2 i i1 i 2 i 2 i hn 4hN hn 3( g g ) i1 i i1 i1 i1 xt () gi 2 S i () 1 t gi 1 Si () t () 1 t.... g i.... h S i t i2 i 1 i i 1
12 ECS - Modeling of coordinate time series by equidistant cubic splines t t t i1 k i : Version 1: Spline in terms of second derivatives ( ) ( ) ( ) g i g M i i M i 1 ( 1) M i i i k k k i k k i k i ( k i 1) M x t x t e S t e g h t t M ( tk i1) ek h 6 b Ax e 2 6h x [ g g M M ] T Constraints: 6 M i1 4 M i M i1 ( g 2 i1 2 gi gi 1) 0 h 0 n 0 Cx 0 n T e Pe min Subject to Cx 0 Least squares with constraints xt () gi 2 S i () 1 t gi 1 Si () t () 1 t.... g i.... h S i t i2 i 1 i i 1
13 ECS - Modeling of coordinate time series by equidistant cubic splines t t t i1 k i : Version 2: Spline in terms of first derivatives 2 ( ) ( ) ( ) 3 g g N N x t S t e g N t ( t ) 2 g g N N ( t ) e h h h h i i 1 i 1 i 2 i i 1 i 1 i 3 k i k k i1 i1 k i1 2 k i1 3 2 k i1 k b Ax e x [ g g N N ] T 0 n 0 n Constraints: hn 4hN hn 3( g g ) 0 i1 i i1 i1 i1 Cx 0 T e Pe min Subject to Cx 0 Least squares with constraints xt () gi 2 S i () 1 t gi 1 Si () t () 1 t.... g i.... h S i t i2 i 1 i i 1
14 Replacement of East, North coordinates with principal horizontal components E, N = East and North coordinate residuals after linear trend removal i i Sample dispersion matrix: S 2 2 se s 1 EN ( Ei me ) ( Ei me )( Ni mn ) 2 2 s N EN sn i ( Ei me )( Ni mn ) ( Ni mn ) 1 1 m E, m N N N E i N i i i Diagonalization: 2 2 se s EN smax 0 S ( ) ( ) 2 R 2 R sen sn 0 smin Principal horizontal components: max Hi Ei ( ) min R H N i i Identification of the horizontal direction with maximal coordinate variation!
15 Replacement of East, North coordinates with principal horizontal components
16 Hellas Network 17 GNSS stations Time span
17 Definition of the reference system Alignment to a global network (ITRF, IGS): - Best for global or large scale tectonic studies - Coordinate time series reflect station motion at global scale Regional stacking: - Best for regional scale tectonic studies - Removes from coordinate series contributions from motion of the region as whole with respect to global system systematic errors in GNSS data

18 Time-series of Transformation Parameters (Stacking procedure on 17 stations)
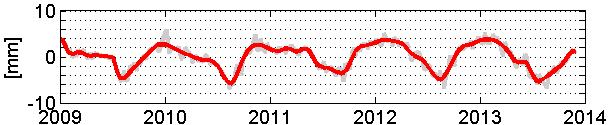
19 GPS station: RLSO (NW Peloponnese) Comparison of Coordinate Interpolation Methods


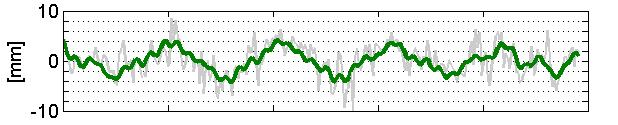


20 Coordinate Time Series Interpolated vs original nonlinear terms max horizontal (x 2) vertical STD SSA MOD ECS Time Time
21 Spectrum Analysis Covariance Functions GPS station: RLSO (Achaia, Northwestern Peloponnesus) max horizontal max horizontal ORIG STD SSA MOD ECS vertical vertical Cycles/Year Week

22 GPS station: KASI (Corfu, Ionian Sea) Comparison of Coordinate Interpolation Methods


23 Coordinate Time Series Interpolated vs original nonlinear terms max horizontal vertical STD SSA MOD ECS Time Time
24 Spectrum Analysis Covariance Functions GPS station: KASI (Corfu, Ionian Sea) max horizontal max horizontal ORIG STD SSA MOD ECS vertical vertical Cycles/Year Week
25 2 RMS of residuals after interpolation for all 17 stations (maximal horizontal component) 1.8 STD SSA MOD ECS ANAV AUT1 DUTH KASI KLOK KORI LEMN MET0 NOA1 PAT0 PONT PRKV RLSO SPAN SPET TUC2 VLSM
26 4 RMS of residuals after interpolation for all 17 stations (vertical component) ANAV AUT1 DUTH KASI KLOK KORI LEMN MET0 NOA1 PAT0 PONT PRKV RLSO SPAN SPET TUC2 VLSM

27 EUREF Network NYA1 NYA1 - Ny-Alesund, Norway QAQ1 - Qaqortoq/Julianehaab, Southern Greenland QAQ1
28 Coordinate Time Series Interpolated vs original nonlinear terms GPS station: NYA1 (Ny-Alesund, Norway) max horizontal ORIG STD SSA MOD ECS time
 vertical ORIG STD SSA MOD ECS")
29 Coordinate Time Series Interpolated vs original nonlinear terms GPS station: NYA1 (Ny-Alesund, Norway) vertical ORIG STD SSA MOD ECS time
30 Spectral Analysis Interpolated vs original nonlinear terms GPS station: NYA1 (Ny-Alesund, Norway) max horizontal vertical ORIG STD SSA MOD ECS ORIG STD SSA MOD ECS Cycles/Year Cycles/Year
31 Covariance functions Interpolated vs original nonlinear terms GPS station: NYA1 (Ny-Alesund, Norway) C(0) = 3.52 mm 2 C(0) = mm 2 max horizontal ORIG vertical ORIG STD STD SSA SSA MOD MOD ECS ECS week week
32 Coordinate Time Series Interpolated vs original nonlinear terms GPS station: QAQ1 (Qaqortoq/Julianehaab, Southern Greenland) max horizontal ORIG STD SSA MOD ECS time
33 Coordinate Time Series Interpolated vs original nonlinear terms GPS station: QAQ1 (Qaqortoq/Julianehaab, Southern Greenland) vertical ORIG STD SSA MOD ECS time
34 Spectral Analysis Interpolated vs original nonlinear terms GPS station: QAQ1 (Qaqortoq/Julianehaab, Southern Greenland) max horizontal vertical ORIG STD SSA MOD ECS ORIG STD SSA MOD ECS Cycles/Year Cycles/Year
35 Covariance functions Interpolated vs original nonlinear terms GPS station: QAQ1 (Qaqortoq/Julianehaab, Southern Greenland) C(0) = 6.19 mm 2 C(0) = mm 2 max horizontal ORIG vertical ORIG STD STD SSA SSA MOD MOD ECS ECS week week
36 The adaptability issue for a coordinate interpolation-smoothing method A good method should be adaptive enough to recover the geophysical signal and at the same time not too adaptive to interpret noise as signal Optimal separation is not possible in an undisputable way because the noise characteristics are not fully known. This is mainly due to colored noise (effect of systematic errors) and biases, while only the white and zero mean part of the noise can be easily removed Within each method various degrees of adaptability are possible by tuning relevant parameters: STD: SSA: MOD: ECS: frequencies other than annual and semi-annual length of lag window length of interval of linear amplitude/phase regularization parameter values length of interval for splines
37 The suitability of a coordinate interpolation-smoothing method for geophysical interpretation STD: Standard use of annual, semiannual and other frequencies Limited interpretation: Amplitude of included frequencies MOD: Amplitude and phase modulation by piecewise linear functions Most challenging for geophysical interpretation. Variation in amplitude values reflects magnitude of meteorological & hydrological effects. Variation in phase values reflects different occurrence times of such effects. In plane words: Not all winters/summers are severe to the same degree each year! Severe phenomena do not occur at the same dates every year!
38 The suitability of the nodulation method for geophysical interpretation - Examples GPS station: KASI (Corfu island, Ionian Sea) - interval 3 months Amplitude max horizontal Phase max horizontal vertical vertical
39 The suitability of the nodulation method for geophysical interpretation - Examples GPS station: RLSO (Achaia, Northwestern Peloponnesus) - interval 3 months max horizontal Amplitude Phase max horizontal vertical vertical
40 The suitability of the nodulation method for geophysical interpretation - Examples GPS station: NYA1 (Ny-Alesund, Norway) - interval 3 months max horizontal Amplitude Phase max horizontal vertical vertical
41 The suitability of the nodulation method for geophysical interpretation - Examples GPS station: QAQ1 (Qaqortoq/Julianehaab, Southern Greenland) - interval 3 months max horizontal Amplitude Phase max horizontal vertical vertical
42 Conclusions: Standard annual and semiannual frequencies: ANALYTIC MODEL, INSUFFICIENT ADAPTIVITY GEOPHYSICAL INTERPRETATION? Singular Spectrum Analysis: HIGH ADAPTIVITY, NO ANALYTIC MODEL Amplitude & phase modulation: GOOD ADAPTIVITY ANALYTIC MODEL GEOPHYSICAL INTERPRETATION! NEED FOR REGULARIZATION Equidistant cubic splines: HIGH ADAPTIVITY ANALYTIC MODEL
43 Thanks for your attention!
NTUA, Faculty of Rural and Surveying Engineering, Dionysos Satellite Observatory, Higher Geodesy Laboratory NOA, Institute of Geodynamics 1
 NOA, Institute of Geodynamics 1 Crustal Deformation from GPS measurements at the Ionian Sea : Preliminary Results Anastasiou 1 D., Paradissis 1 D., Ganas 2 A., Marinou 1 A., Papazissi 1 K., Drakatos 2
THREE SEASONAL BEHAVIOUR OF THE BALKAN PENINSULA GNSS PERMANENT STATIONS FROM GPS SOLUTIONS
 Доклади на Българската академия на науките Comptes rendus de l Académie bulgare des Sciences Tome 66, No 1, 2013 GEOPHYSIQUE Sismologie THREE SEASONAL BEHAVIOUR OF THE BALKAN PENINSULA GNSS PERMANENT STATIONS
Tectonic deformations in Greece and the operation of HEPOS network
 Tectonic deformations in Greece and the operation of HEPOS network M. Gianniou KTIMATOLOGIO S.A. (Hellenic Cadastre) Abstract Today, networks of permanent reference stations are broadly used for the realization
Estimation of tectonic velocities using GPS Precise Point Positioning: The case of Hellenic RTK network HEPOS
 Estimation of tectonic velocities using GPS Precise Point Positioning: The case of Hellenic RTK network HEPOS M. Gianniou, I. Stavropoulou National Cadastre and Mapping Agency S.A. Mesogion Ave. 288, 15562
ITRF2014 Et la prise en compte des mouvements non linéaires
 ITRF2014 Et la prise en compte des mouvements non linéaires Zuheir Altamimi, Paul Rebischung, Laurent Métivier, Xavier Collilieux E-mail: zuheir.altamimi@ign.fr ITRF2014 Network Key Points Modelling of
Geodetic Department KTIMATOLOGIO S.A. (Hellenic Cadastre) K. Katsampalos, C. Kotsakis Department of Geodesy and Surveying
 K. Katsampalos, C. Kotsakis Department of Geodesy and Surveying") Realization of ETRS89 in Greece by the HEPOS network M. Gianniou i Geodetic Department KTIMATOLOGIO S.A. (Hellenic Cadastre) mgianniu@ktimatologio.gr K. Katsampalos, C. Kotsakis Department of Geodesy and
Realization of ETRS89 in Greece by the HEPOS network M. Gianniou i Geodetic Department KTIMATOLOGIO S.A. (Hellenic Cadastre) mgianniu@ktimatologio.gr K. Katsampalos, C. Kotsakis Department of Geodesy and
Numerical evidence for the inconsistent separation of the ITRF-ICRF transformation into precession-nutation, diurnal rotation and polar motion
 Numerical evidence for the inconsistent separation of the ITRF-ICRF transformation into precession-nutation, diurnal rotation and polar motion Athanasios Dermanis and Dimitrios Tsoulis Aristotle University
REFINED AND SITE-AUGMENTED TROPOSPHERIC DELAY MODELS FOR GNSS
 REFINED AND SITE-AUGMENTED TROPOSPHERIC DELAY MODELS FOR GNSS Daniel Landskron, Gregor Möller, Armin Hofmeister, Johannes Böhm, and Robert Weber Technische Universität Wien, Austria Gußhausstraße 27-29,
Influence of the Reference Frame Alignment on Station Positions and Velocities: Global or Regional?
 AGU Fall Meeting, San Francisco, USA, 15 19 December 2008 Influence of the Reference Frame Alignment on Station Positions and Velocities: Global or Regional? J. Legrand(1), N. Bergeot(1), C. Bruyninx(1),
Ten years analysis of Tropospheric refractivity variations
 ANNALS OF GEOPHYSICS, VOL. 47, N. 4, August 2004 Ten years analysis of Tropospheric refractivity variations Stergios A. Isaakidis and Thomas D. Xenos Department of Electrical and Computer Engineering,
On the statistical significance of climatic trends estimated from GRUAN tropospheric time series
 On the statistical significance of climatic trends estimated from GRUAN tropospheric time series Fadwa Alshawaf, Galina Dick, Jens Wickert 1 On the statistical significance of climatic trends estimated
Realizing a geodetic reference frame using GNSS in the presence of crustal deformations: The case of Greece
 Realizing a geodetic reference frame using GNSS in the presence of crustal deformations: The case of Greece M. Gianniou National Cadastre and Mapping Agency S.A. Outline 1. Introduction 2. Deformation
STATISTICAL EVALUATION OF THE STABILITY OF VLBI, SLR, DORIS AND GPS STATIONS
 STATISTICAL EVALUATION OF THE STABILITY OF VLBI, SLR, DORIS AND GPS STATIONS K. Le Bail (1), O. de Viron (), M. Feissel-Vernier (3), (1) Institut Géographique National/LAREG, Marne La Vallée, France and
The International Terrestrial Reference System and ETRS89: Part I : General concepts
 The International Terrestrial Reference System and ETRS89: Part I : General concepts Zuheir ALTAMIMI Laboratoire de Recherche en Géodésie Institut national de l information géographique et forestière (IGN),
National Report of Greece to EUREF 2016
 National Report of Greece to EUREF 2016 M.Gianniou, E. Mitropoulou, D. Mastoris National Cadastre and Mapping Agency S.A. Mesogion Ave. 288, 15562 Athens, Greece 1. Introduction During the last months
Lecture Hilbert-Huang Transform. An examination of Fourier Analysis. Existing non-stationary data handling method
 Lecture 12-13 Hilbert-Huang Transform Background: An examination of Fourier Analysis Existing non-stationary data handling method Instantaneous frequency Intrinsic mode functions(imf) Empirical mode decomposition(emd)
On the Use of Crustal Deformation Models. in the Management of ETRS89 Realizations in Fennoscandia
 On the Use of Crustal Deformation Models Presented at the FIG Working Week 2017, May 29 - June 2, 2017 in Helsinki, Finland in the Management of ETRS89 Realizations in Fennoscandia Martin Lidberg, Jonas
Correction to Atmospheric Effects and Spurious Signals in GPS Analyses
 JOURNAL OF GEOPHYSICAL RESEARCH, VOL.???, XXXX, DOI:10.1029/, 1 2 Correction to Atmospheric Effects and Spurious Signals in GPS Analyses P. Tregoning 3 4 Research School of Earth Sciences, The Australian
Def. The euclidian distance between two points x = (x 1,...,x p ) t and y = (y 1,...,y p ) t in the p-dimensional space R p is defined as
 t and y = (y 1,...,y p ) t in the p-dimensional space R p is defined as") MAHALANOBIS DISTANCE Def. The euclidian distance between two points x = (x 1,...,x p ) t and y = (y 1,...,y p ) t in the p-dimensional space R p is defined as d E (x, y) = (x 1 y 1 ) 2 + +(x p y p ) 2
MAHALANOBIS DISTANCE Def. The euclidian distance between two points x = (x 1,...,x p ) t and y = (y 1,...,y p ) t in the p-dimensional space R p is defined as d E (x, y) = (x 1 y 1 ) 2 + +(x p y p ) 2
Lab 9: Satellite Geodesy (35 points)
") Lab 9: Satellite Geodesy (35 points) Here you will work with GPS Time Series data to explore plate motion and deformation in California. This lab modifies an exercise found here: http://www.unavco.org:8080/cws/pbonucleus/draftresources/sanandreas/
Lab 9: Satellite Geodesy (35 points) Here you will work with GPS Time Series data to explore plate motion and deformation in California. This lab modifies an exercise found here: http://www.unavco.org:8080/cws/pbonucleus/draftresources/sanandreas/
An analysis of the Kefalonia seismic sequence of Jan Feb. 3, 2014
 An analysis of the Kefalonia seismic sequence of Jan. 26 - Feb. 3, 2014 Alessandro Caporali 1),Carine Bruyninx 2),Rui Fernandes 3),Athanassios Ganas 4),Ambrus Kenyeres 5),Martin Lidberg 6), Guenter Stangl
Application of Satellite Laser Ranging for Long- Wavelength Gravity Field Determination
 Application of Satellite Laser Ranging for Long- Wavelength Gravity Field Determination J. C. Ries Center for Space Research The University of Texas at Austin Low Degree Gravity Variations from SLR GRACE
Athanassios Ganas,
 Current Status of the NOANET GNSS network 2006 2014 Athanassios Ganas, aganas@noa.grgr George Drakatos, Kostas Chousianitis Panagiotis Argyrakis, Marios Papanikolaou, Alexandra Moshou, Christina Tsimi,
DS-GA 1002 Lecture notes 10 November 23, Linear models
 DS-GA 2 Lecture notes November 23, 2 Linear functions Linear models A linear model encodes the assumption that two quantities are linearly related. Mathematically, this is characterized using linear functions.
From Global to National Geodetic Reference Frames: how are they connected and why are they needed?
 From Global to National Geodetic Reference Frames: how are they connected and why are they needed? Zuheir ALTAMIMI Institut National de l Information Géographique et Forestière, France Vice-President,
Old painting digital color restoration
 Old painting digital color restoration Michail Pappas Ioannis Pitas Dept. of Informatics, Aristotle University of Thessaloniki GR-54643 Thessaloniki, Greece Abstract Many old paintings suffer from the
Study of Time Series and Development of System Identification Model for Agarwada Raingauge Station
 Study of Time Series and Development of System Identification Model for Agarwada Raingauge Station N.A. Bhatia 1 and T.M.V.Suryanarayana 2 1 Teaching Assistant, 2 Assistant Professor, Water Resources Engineering
Mutual comparison of the combinations of the Earth orientation parameters obtained by different techniques
 Mutual comparison of the combinations of the Earth orientation parameters obtained by different techniques C. Ron, J. Vondrák Astronomical Institute, Boční II 141, 141 31 Praha 4, Czech Republic Abstract.
Preparation for the ITRF2013. Zuheir Altamimi Xavier Collilieux Laurent Métivier IGN, France
 Preparation for the ITRF2013 Zuheir Altamimi Xavier Collilieux Laurent Métivier IGN, France 1 Outline Introduction Solicited solutions Analysis Strategy Preparation for the ITRF2013: Combination tests
HST.582J/6.555J/16.456J
 Blind Source Separation: PCA & ICA HST.582J/6.555J/16.456J Gari D. Clifford gari [at] mit. edu http://www.mit.edu/~gari G. D. Clifford 2005-2009 What is BSS? Assume an observation (signal) is a linear
The International Terrestrial Reference System and ETRS89: Part II : ITRS & ETRS89 relationship
 The International Terrestrial Reference System and ETRS89: Part II : ITRS & ETRS89 relationship Zuheir ALTAMIMI Laboratoire de Recherche en Géodésie Institut national de l information géographique et forestière
Time Series Prediction
 Sternberg Astronomical Institute Lomonosov Moscow State University Time Series Prediction Leonid Zotov Fulbright Scholar 28-29 San Juan, Puerto Rico, 8 May 29 FROM THE BEGINNING OF THE HISTORY PEOPLE TRIED
Introduction to machine learning and pattern recognition Lecture 2 Coryn Bailer-Jones
 Introduction to machine learning and pattern recognition Lecture 2 Coryn Bailer-Jones http://www.mpia.de/homes/calj/mlpr_mpia2008.html 1 1 Last week... supervised and unsupervised methods need adaptive
Linear Algebra Review (Course Notes for Math 308H - Spring 2016)
") Linear Algebra Review (Course Notes for Math 308H - Spring 2016) Dr. Michael S. Pilant February 12, 2016 1 Background: We begin with one of the most fundamental notions in R 2, distance. Letting (x 1,
Linear Algebra Review (Course Notes for Math 308H - Spring 2016) Dr. Michael S. Pilant February 12, 2016 1 Background: We begin with one of the most fundamental notions in R 2, distance. Letting (x 1,
Cubic Splines; Bézier Curves
 Cubic Splines; Bézier Curves 1 Cubic Splines piecewise approximation with cubic polynomials conditions on the coefficients of the splines 2 Bézier Curves computer-aided design and manufacturing MCS 471
The 3D time dependent transformation model on the NOANET CORS GNSS. A collaboration between Geodesy & Geodynamics
 The 3D tme dependent transformaton model on the NOANET CORS GNSS. A collaboraton between Geodesy & Geodynamcs N. KALAMAKIS 1, D. AMPATZIDIS 2, K. KATSAMBALOS 1 1 DEPA RTMEN T OF GEODESY & SURVEYING - A
A6523 Signal Modeling, Statistical Inference and Data Mining in Astrophysics Spring 2013
 A6523 Signal Modeling, Statistical Inference and Data Mining in Astrophysics Spring 2013 Lecture 26 Localization/Matched Filtering (continued) Prewhitening Lectures next week: Reading Bases, principal
Singular value decomposition. If only the first p singular values are nonzero we write. U T o U p =0
 Singular value decomposition If only the first p singular values are nonzero we write G =[U p U o ] " Sp 0 0 0 # [V p V o ] T U p represents the first p columns of U U o represents the last N-p columns
Teleseismic waveform modelling of the 2008 Leonidio event
 The 6 January 2008 (Mw6.2) Leonidio (southern Greece) intermediate depth earthquake: teleseismic body wave modelling Anastasia Kiratzi and Christoforos Benetatos Department of Geophysics, Aristotle University
Designing Information Devices and Systems II Fall 2015 Note 5
 EE 16B Designing Information Devices and Systems II Fall 01 Note Lecture given by Babak Ayazifar (9/10) Notes by: Ankit Mathur Spectral Leakage Example Compute the length-8 and length-6 DFT for the following
ECE 661: Homework 10 Fall 2014
 ECE 661: Homework 10 Fall 2014 This homework consists of the following two parts: (1) Face recognition with PCA and LDA for dimensionality reduction and the nearest-neighborhood rule for classification;
New satellite mission for improving the Terrestrial Reference Frame: means and impacts
 Fourth Swarm science meeting and geodetic missions workshop ESA, 20-24 March 2017, Banff, Alberta, Canada New satellite mission for improving the Terrestrial Reference Frame: means and impacts Richard
Observation of Landslide Movements by Geodetic and Borehole Tilt Measurements
 53 Observation of Landslide Movements by Geodetic and Borehole Tilt Measurements Mentes, Gy. and László Bányai, L. Geodetic and Geophysical Institute, Research Centre for Astronomy and Earth Sciences,
16.20 Techniques of Structural Analysis and Design Spring Instructor: Raúl Radovitzky Aeronautics & Astronautics M.I.T
 16.20 Techniques of Structural Analysis and Design Spring 2013 Instructor: Raúl Radovitzky Aeronautics & Astronautics M.I.T February 15, 2013 2 Contents 1 Stress and equilibrium 5 1.1 Internal forces and
Bare minimum on matrix algebra. Psychology 588: Covariance structure and factor models
 Bare minimum on matrix algebra Psychology 588: Covariance structure and factor models Matrix multiplication 2 Consider three notations for linear combinations y11 y1 m x11 x 1p b11 b 1m y y x x b b n1
Performance of the GSN station KONO-IU,
 Performance of the GSN station KONO-IU, 1991-2009 A report in a series documenting the status of the Global Seismographic Network WQC Report 2010:9 February 28, 2010 Göran Ekström and Meredith Nettles
Vulnerability of economic systems
 Vulnerability of economic systems Quantitative description of U.S. business cycles using multivariate singular spectrum analysis Andreas Groth* Michael Ghil, Stéphane Hallegatte, Patrice Dumas * Laboratoire
Analysis effects in IGS station motion time series P. Rebischung, X. Collilieux, T. van Dam, J. Ray, Z. Altamimi
 Analysis effects in IGS station motion time series P. Rebischung, X. Collilieux, T. van Dam, J. Ray, Z. Altamimi IGS workshop 2012, Olsztyn, Poland 1 Background: expectedsignals IGS station position time
HST.582J / 6.555J / J Biomedical Signal and Image Processing Spring 2007
 MIT OpenCourseWare http://ocw.mit.edu HST.582J / 6.555J / 16.456J Biomedical Signal and Image Processing Spring 2007 For information about citing these materials or our Terms of Use, visit: http://ocw.mit.edu/terms.
Precise Point Positioning requires consistent global products
 Precise Point Positioning requires consistent global products H. P. Kierulf Hans-Peter Plag Abstract Precise Point Positioning (PPP) is increasingly used to compute time series of point motion in a global
Evaluation of the impact of atmospheric pressure loading modeling on GNSS data analysis
 Evaluation of the impact of atmospheric pressure loading modeling on GNSS data analysis R. Dach a, J. Böhm b, S. Lutz a, and P. Steigenberger c a Astronomical Institute, University of Bern, Bern, Switzerland
Global Mapping Function (GMF): A new empirical mapping function based on numerical weather model data
: A new empirical mapping function based on numerical weather model data") Johannes Böhm, Arthur Niell, Paul Tregoning, and Harald Schuh Global Mapping Function (GMF): A new empirical mapping function based on numerical weather model data Geophysical Research Letters Vol. 33,
Johannes Böhm, Arthur Niell, Paul Tregoning, and Harald Schuh Global Mapping Function (GMF): A new empirical mapping function based on numerical weather model data Geophysical Research Letters Vol. 33,
Earth gravity field recovery using GPS, GLONASS, and SLR satellites
 13-01-08 Earth gravity field recovery using GPS, GLONASS, and SLR satellites Krzysztof Sośnica (1), Adrian Jäggi (1), Daniela Thaller (2), Ulrich Meyer (1), Christian Baumann (1), Rolf Dach (1), Gerhard
SIO 210: Data analysis
 SIO 210: Data analysis 1. Sampling and error 2. Basic statistical concepts 3. Time series analysis 4. Mapping 5. Filtering 6. Space-time data 7. Water mass analysis 10/8/18 Reading: DPO Chapter 6 Look
1 Principal Components Analysis
 Lecture 3 and 4 Sept. 18 and Sept.20-2006 Data Visualization STAT 442 / 890, CM 462 Lecture: Ali Ghodsi 1 Principal Components Analysis Principal components analysis (PCA) is a very popular technique for
Factor Analysis and Kalman Filtering (11/2/04)
") CS281A/Stat241A: Statistical Learning Theory Factor Analysis and Kalman Filtering (11/2/04) Lecturer: Michael I. Jordan Scribes: Byung-Gon Chun and Sunghoon Kim 1 Factor Analysis Factor analysis is used
CS281A/Stat241A: Statistical Learning Theory Factor Analysis and Kalman Filtering (11/2/04) Lecturer: Michael I. Jordan Scribes: Byung-Gon Chun and Sunghoon Kim 1 Factor Analysis Factor analysis is used
Dimensionality Reduction. CS57300 Data Mining Fall Instructor: Bruno Ribeiro
 Dimensionality Reduction CS57300 Data Mining Fall 2016 Instructor: Bruno Ribeiro Goal } Visualize high dimensional data (and understand its Geometry) } Project the data into lower dimensional spaces }
SIO 210: Data analysis methods L. Talley, Fall Sampling and error 2. Basic statistical concepts 3. Time series analysis
 SIO 210: Data analysis methods L. Talley, Fall 2016 1. Sampling and error 2. Basic statistical concepts 3. Time series analysis 4. Mapping 5. Filtering 6. Space-time data 7. Water mass analysis Reading:
ELEG 5633 Detection and Estimation Signal Detection: Deterministic Signals
 ELEG 5633 Detection and Estimation Signal Detection: Deterministic Signals Jingxian Wu Department of Electrical Engineering University of Arkansas Outline Matched Filter Generalized Matched Filter Signal
The Global Mapping Function (GMF): A new empirical mapping function based on numerical weather model data
: A new empirical mapping function based on numerical weather model data") The Global Mapping Function (GMF): A new empirical mapping function based on numerical weather model data J. Boehm, A. Niell, P. Tregoning, H. Schuh Troposphere mapping functions are used in the analyses
The Global Mapping Function (GMF): A new empirical mapping function based on numerical weather model data J. Boehm, A. Niell, P. Tregoning, H. Schuh Troposphere mapping functions are used in the analyses
Numerical Methods. Lecture Notes #08 Discrete Least Square Approximation
 Numerical Methods Discrete Least Square Approximation Pavel Ludvík, March 30, 2016 Department of Mathematics and Descriptive Geometry VŠB-TUO http://homen.vsb.cz/ lud0016/ 1 / 23
Climate change signals and LOD
 Climate change signals and LOD Leonid Zotov 1,2, Sidorenkov N.S. 3, Chujkova N.A. 2 1 National Research University Higher School of Economics, Moscow Institute of Electronics and Mathematics, (lzotov@hse.ru)
Data Mining and Analysis: Fundamental Concepts and Algorithms
 Data Mining and Analysis: Fundamental Concepts and Algorithms dataminingbook.info Mohammed J. Zaki 1 Wagner Meira Jr. 2 1 Department of Computer Science Rensselaer Polytechnic Institute, Troy, NY, USA
IGS POLAR MOTION MEASUREMENTS
 STATUS & PROSPECTS FOR IGS POLAR MOTION MEASUREMENTS Why does the IGS care about EOPs? observations, predictions, & IGS product table Recent pole & pole rate accuracies & error sources Rapid & Final products
Sinusoidal Modeling. Yannis Stylianou SPCC University of Crete, Computer Science Dept., Greece,
 Sinusoidal Modeling Yannis Stylianou University of Crete, Computer Science Dept., Greece, yannis@csd.uoc.gr SPCC 2016 1 Speech Production 2 Modulators 3 Sinusoidal Modeling Sinusoidal Models Voiced Speech
Data S.A. 30s. Xe= Gravity anom. sigd=0.06 corlength=1000s sigp=1. dg microgal. dg microgal. Data S.A. 30s. Xe=
 Gravity anom. sigd=.6 corlength=4s sigp=1. Gravity anom. sigd=.6 corlength=6s sigp=1. Xe=.594 Λ=4s Xe=.595 Λ=6s -2. -15. -1. -5.. Tim -2. -15. -1. -5.. Tim Gravity anom. sigd=.6 corlength=8s sigp=1. Gravity
(a)
") Chapter 8 Subspace Methods 8. Introduction Principal Component Analysis (PCA) is applied to the analysis of time series data. In this context we discuss measures of complexity and subspace methods for
Chapter 8 Subspace Methods 8. Introduction Principal Component Analysis (PCA) is applied to the analysis of time series data. In this context we discuss measures of complexity and subspace methods for
Report for 15th PCGIAP Meeting at 18th UNRCC-AP Working Group 1 Regional Geodesy
 Report for 15th PCGIAP Meeting at 18th UNRCC-AP Working Group 1 Regional Geodesy Chairman Shigeru Matsuzaka, Japan - shigeru@gsi.go.jp Vice Chairman Prof. Pengfei Cheng, China - chengpf@casm.ac.cn John
Spatiotemporal filtering using principal component analysis and Karhunen-Loeve expansion approaches for regional GPS network analysis
 JOURNAL OF GEOPHYSICAL RESEARCH, VOL. 111,, doi: 10.1029/2005JB003806, 2006 Spatiotemporal filtering using principal component analysis and Karhunen-Loeve expansion approaches for regional GPS network
6.435, System Identification
 System Identification 6.435 SET 3 Nonparametric Identification Munther A. Dahleh 1 Nonparametric Methods for System ID Time domain methods Impulse response Step response Correlation analysis / time Frequency
Global reference systems and Earth rotation
 current realizations and scientific problems Aleksander Brzeziński 1,2, Tomasz Liwosz 1, Jerzy Rogowski 1, Jan Kryński 3 1 Department of Geodesy and Geodetic Astronomy Warsaw University of Technology 2
The Caterpillar -SSA approach to time series analysis and its automatization
 The Caterpillar -SSA approach to time series analysis and its automatization Th.Alexandrov,.Golyandina theo@pdmi.ras.ru, nina@ng1174.spb.edu St.Petersburg State University Caterpillar -SSA and its automatization
When to Do the Gridding?
 Part 6: Objective Analysis Optimum Interpolation Composite Analysis When to Do the Gridding? The methods described are applicable to any problem where the data you are given do not fill the domain of interest
Dimension Reduction Techniques. Presented by Jie (Jerry) Yu
 Yu") Dimension Reduction Techniques Presented by Jie (Jerry) Yu Outline Problem Modeling Review of PCA and MDS Isomap Local Linear Embedding (LLE) Charting Background Advances in data collection and storage
Dimension Reduction Techniques Presented by Jie (Jerry) Yu Outline Problem Modeling Review of PCA and MDS Isomap Local Linear Embedding (LLE) Charting Background Advances in data collection and storage
Stochastic Models, Estimation and Control Peter S. Maybeck Volumes 1, 2 & 3 Tables of Contents
 Navtech Part #s Volume 1 #1277 Volume 2 #1278 Volume 3 #1279 3 Volume Set #1280 Stochastic Models, Estimation and Control Peter S. Maybeck Volumes 1, 2 & 3 Tables of Contents Volume 1 Preface Contents
NKG2016LU, an improved postglacial land uplift model over the Nordic-Baltic region
 NKG2016LU, an improved postglacial land uplift model over the Nordic-Baltic region Olav Vestøl, Jonas Ågren, Holger Steffen, Halfdan Kierulf, Martin Lidberg, Tõnis Oja, Andres Rüdja, Veikko Saaranen, Casper
Input: A set (x i -yy i ) data. Output: Function value at arbitrary point x. What for x = 1.2?
 data. Output: Function value at arbitrary point x. What for x = 1.2?") Applied Numerical Analysis Interpolation Lecturer: Emad Fatemizadeh Interpolation Input: A set (x i -yy i ) data. Output: Function value at arbitrary point x. 0 1 4 1-3 3 9 What for x = 1.? Interpolation
Applied Numerical Analysis Interpolation Lecturer: Emad Fatemizadeh Interpolation Input: A set (x i -yy i ) data. Output: Function value at arbitrary point x. 0 1 4 1-3 3 9 What for x = 1.? Interpolation
1. Fundamental concepts
 . Fundamental concepts A time series is a sequence of data points, measured typically at successive times spaced at uniform intervals. Time series are used in such fields as statistics, signal processing
Computer Assisted Image Analysis
 Computer Assisted Image Analysis Lecture 0 - Object Descriptors II Amin Allalou amin@cb.uu.se Centre for Image Analysis Uppsala University 2009-04-27 A. Allalou (Uppsala University) Object Descriptors
ECE 636: Systems identification
 ECE 636: Systems identification Lectures 3 4 Random variables/signals (continued) Random/stochastic vectors Random signals and linear systems Random signals in the frequency domain υ ε x S z + y Experimental
Using modern time series analysis techniques to predict ENSO events from the SOI time series
 Nonlinear Processes in Geophysics () 9: 4 45 Nonlinear Processes in Geophysics c European Geophysical Society Using modern time series analysis techniques to predict ENSO events from the SOI time series
Lecture 10 Polynomial interpolation
 Lecture 10 Polynomial interpolation Weinan E 1,2 and Tiejun Li 2 1 Department of Mathematics, Princeton University, weinan@princeton.edu 2 School of Mathematical Sciences, Peking University, tieli@pku.edu.cn
Computational Physics
 Interpolation, Extrapolation & Polynomial Approximation Lectures based on course notes by Pablo Laguna and Kostas Kokkotas revamped by Deirdre Shoemaker Spring 2014 Introduction In many cases, a function
Strain analysis.
 Strain analysis ecalais@purdue.edu Plates vs. continuum Gordon and Stein, 1991 Most plates are rigid at the until know we have studied a purely discontinuous approach where plates are
Validation of GRACE time-variable gravity field by ICESat, GPS, WGHM and altimetry satellites
 Validation of GRACE time-variable gravity field by ICESat, GPS, WGHM and altimetry satellites Christian Gruber 1, Andreas Groh 2, Elisa Fagiolini 1, Christoph Dahle 1, Sergei Rudenko 1 (1) German Research
Porosity prediction using cokriging with multiple secondary datasets
 Cokriging with Multiple Attributes Porosity prediction using cokriging with multiple secondary datasets Hong Xu, Jian Sun, Brian Russell, Kris Innanen ABSTRACT The prediction of porosity is essential for
How significant is the dynamic component of the North American vertical datum?
 CGU Annual Scientific Meeting -8 June 212, Banff, Canada How significant is the dynamic component of the North American vertical datum? E. Rangelova, M.G. Sideris (University of Calgary) W. van der Wal
Structure in Data. A major objective in data analysis is to identify interesting features or structure in the data.
 Structure in Data A major objective in data analysis is to identify interesting features or structure in the data. The graphical methods are very useful in discovering structure. There are basically two
COMPLEX PRINCIPAL COMPONENT SPECTRA EXTRACTION
 COMPLEX PRINCIPAL COMPONEN SPECRA EXRACION PROGRAM complex_pca_spectra Computing principal components o begin, click the Formation attributes tab in the AASPI-UIL window and select program complex_pca_spectra:
Linear ODEs. Existence of solutions to linear IVPs. Resolvent matrix. Autonomous linear systems
 Linear ODEs p. 1 Linear ODEs Existence of solutions to linear IVPs Resolvent matrix Autonomous linear systems Linear ODEs Definition (Linear ODE) A linear ODE is a differential equation taking the form
Dealing with significant differential tectonic plate velocities within an RTK-network: The case of HEPOS
 Dealing with significant differential tectonic plate velocities within an RTK-network: The case of HEPOS M. Gianniou, E. Mitropoulou, I. Stavropoulou National Cadastre and Mapping Agency S.A. Mesogion
SIO 210 CSP: Data analysis methods L. Talley, Fall Sampling and error 2. Basic statistical concepts 3. Time series analysis
 SIO 210 CSP: Data analysis methods L. Talley, Fall 2016 1. Sampling and error 2. Basic statistical concepts 3. Time series analysis 4. Mapping 5. Filtering 6. Space-time data 7. Water mass analysis Reading:
Tide Gauge Benchmark Monitoring Need for Reprocessing in Europe. Tilo Schöne & the IGS TIGA Working Group
 Tide Gauge Benchmark Monitoring Need for Reprocessing in Europe Tilo Schöne & the IGS TIGA Working Group Vertical Tide Gauge Control Long-term stable and consistent frame to relate globally distributed
Structural Damage Detection Using Time Windowing Technique from Measured Acceleration during Earthquake
 Structural Damage Detection Using Time Windowing Technique from Measured Acceleration during Earthquake Seung Keun Park and Hae Sung Lee ABSTRACT This paper presents a system identification (SI) scheme
A Framework for Daily Spatio-Temporal Stochastic Weather Simulation
 A Framework for Daily Spatio-Temporal Stochastic Weather Simulation, Rick Katz, Balaji Rajagopalan Geophysical Statistics Project Institute for Mathematics Applied to Geosciences National Center for Atmospheric
The Nile River Records Revisited: How good were Joseph's predictions?
 The Nile River Records Revisited: How good were Joseph's predictions? Michael Ghil Ecole Normale Supérieure, Paris, and University of California, Los Angeles Joint work with Yizhak Feliks, IIBR, and Dmitri
The usefulness of the Radon signal for geophysical purposes highlighted through analytical procedures
 14 th INTERNATIONAL WORKSHOP GARRM (on the GEOLOGICAL ASPECTS OF RADON RISK MAPPING) September 18 th 20 th, 2018 Prague, Czech Republic The usefulness of the Radon signal for geophysical purposes highlighted
Investigations into a Dynamic Geocentric Datum
 Investigations into a Dynamic Geocentric Datum Jian Wang, Jinling Wang and Craig Roberts Abstract A dynamic geodetic datum is a datum that consists of coordinates and velocities of control points, which
Calculation of evaporation from the Caspian Sea surface
 Calculation of evaporation from the Caspian Sea surface M. Filimonova and M. Trubetskova Institute Problems of Water Russian Academia of Science, Moscow, E-mail: filimonova@mtu-net.ru 1 INTRODUCTION Calculation
ECE295, Data Assimila0on and Inverse Problems, Spring 2015
 ECE295, Data Assimila0on and Inverse Problems, Spring 2015 1 April, Intro; Linear discrete Inverse problems (Aster Ch 1 and 2) Slides 8 April, SVD (Aster ch 2 and 3) Slides 15 April, RegularizaFon (ch