On April 4, 2017, FPAC met via conference call for its weekly meeting. The following people participated in the meeting:
|
|
|
- Eleanor Little
- 5 years ago
- Views:
Transcription
1 FISH PASSAGE CENTER 847 NE 19 th Avenue, #250, Portland, OR Phone: (503) Fax: (503) us at MEMORANDUM To: From: Fish Passage Advisory Committee (FPAC) FPC Staff Date: April 4, 2017 Subject: Action Notes from April 4, 2017, FPAC meeting On April 4, 2017, FPAC met via conference call for its weekly meeting. The following people participated in the meeting: Paul Wagner (FPAC Co-Chair NOAA) Tom Lorz (FPAC Co-Chair CRITFC) Brandon Chockley (FPC) Charlie Morrill (WDFW) Dave Benner (FPC) Dave Swank (USFWS) Erick Van Dyke (ODFW) Erin Cooper (FPC) Jay Hesse (Nez Perce Tribe) Jennifer Graham (Warm Springs Tribe) Kyle Dittmer (CRITFC) Margaret Filardo (FPC) Russ Kiefer (IDFG) Sheri Sears (Colville Tribe) Tom Iverson (Yakima Nation) Trevor Conder (NOAA) AGENDA ITEMS Approval of Notes FPAC notes from March 28 were approved without changes. Water Supply/Flood Control Dave Benner (FPC) provided a summary of the current reservoir operations and water supply forecasts, snowpack estimates, and ESP runoff volumes. See the attached document. G:\STAFF\DOCUMENT\2017_Documents\2017_Files\FPAC\0404\FPAC Notes April 4.doc
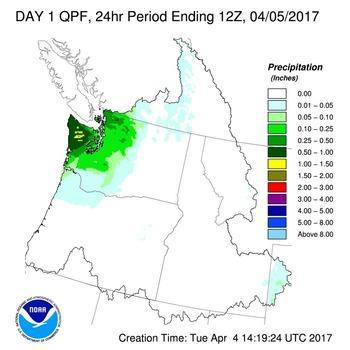
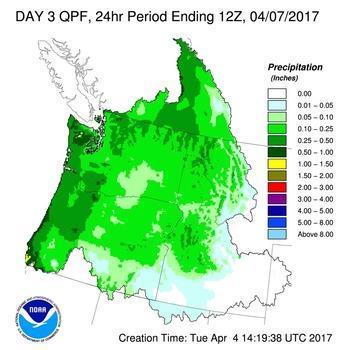
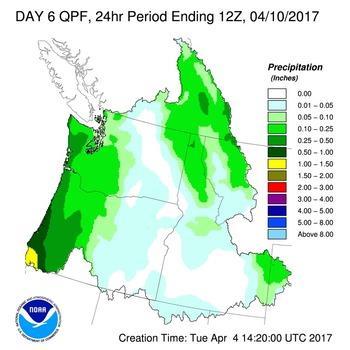
2 Paul Wagner has received an updated forecast for Hungry Horse. The April-August forecast is 2.23 MAF, 105% of average. Weather Kyle Dittmer (CRITFC) provided a summary of weather conditions and water year status. See attached. Juvenile Fish Passage Status For passage indices on April 4, 2017, please see the attached document. For updated indices, use the FPC website. Due to high flows and debris, the Snake River trap has been removed for the season. SMP sampling is currently every other day at Little Goose and every third day at Lower Monumental. PIT-tag detections at Lower Granite Dam starting on March 20 show passage of Dworshak hatchery releases. The Grande Ronde trap has collected Pacific ammocoetes, for the first time. Jay Hesse (Nez Perce Tribe) indicated that this may be due to adult lamprey transferred into the Grande Ronde a few years ago. All bypass systems are operating, with the exception of McNary. McNary will start between April 8 th and April 10 th. GBT sampling at Lower Granite started on March 30. Of a sample of 100 fish, 3 had level 1 (lowest rank) GBT in fins. Sampling will continue on every Thursday. o Brandon Chockley (FPC) will conduct GBT training tomorrow, Wednesday April 5. All other GBT sites will start sampling soon after. Little Goose will sample on April 7. Charlie Morrill (WDFW) pointed out that unlike steelhead, there are fewer yearling Chinook detections at Little Goose than at Lower Granite, indicating that travel times may be increasing after passing Lower Granite. Observation was based on FPC Cumulative PIT-tag Detection query ( Adult Fish Passage Status For adult counts on April 4, 2017, please see the attached document. For updated counts, use the FPC website. The FPC is still working with the COE to get updated adult counts on the FPC website. Automization is still a problem, due to security constraints. Spill Update For spill and TDG from April 3 to April 4, please see the attached document. For updated information, please use the FPC website. Page 2 of 5
3 Spring spill has officially commenced at all Snake River projects. Spill has largely been in excess of FOP spill levels due to limits of hydraulic capacity. TDG standards have been exceeded throughout the Snake and Middle Columbia rivers due to spill in excess of FOP. Bonneville Spill Proposal Paul Wagner (NOAA) presented a COE proposal on spill at Bonneville Dam. Margaret Filardo (FPC) clarified the proposal as she understood it. In the event that wind power generation slows, Bonneville must keep a certain amount of volume of water in reserve in the reservoir to increase power generation on short notice. Due to needs to keep the forebay elevation within a certain operating range, additional water will need to be passed as spill. o As an alternate operation, Scott Bettin (COE) has proposed operating Bonneville turbines outside the 1% efficiency range to move more water through the powerhouse rather than storing water. This would potentially reduce TDG. Paul Wagner stated that data will be available later today from the COE regarding the frequency of operation above the 1%. Paul Wagner stated that his understanding is that it is not used frequently and generally not for more than 2 hours at a time. Margaret Filardo expressed concern that by increasing the flow through turbines and operating outside of the 1% range, more fish will move through the powerhouse under conditions with higher mortality. By comparison, current TDG levels are not concerning. Margaret Filardo suggests not considering the proposal until TDG levels are near 130%. The reduction in TDG may be 2 3% under the proposed operation. Charlie Morrill (WDFW) stated that it is clear from the CSS workshop (April 3) that in order to reach Council recovery goals, fisheries managers should be minimizing powerhouse passage. Dave Swank (USFWS) stated they would like to have more information regarding the frequency and duration of the operation before making a decision. Margaret Filardo (FPC) stated that this operation is proposed at McNary and The Dalles due to their proximity to transmission lines, but concern that that it could be proposed at other projects in future. Sort-by-Code Request FPC members had no questions or objections for a Sort-by-Code request from Lance Clark (ODFW). Paul Wagner (NOAA) will approve the request later this week. Little Goose Operations Little Goose Dam has a need to operate at full pool, rather than MOP, in order to float a bulkhead in for repairs to the lock. Russ Kiefer (IDFG) suggested that rather than drawing down to MOP immediately after the floating of the bulkhead (April 12), delay the drawdown of the full pool at Little Goose to a time when drawdown volume could be used to maintain a uniform spill pattern at Lower Monumental. Uniform spill at LMN Page 3 of 5
4 is better for fish passage, and at high flows the higher elevation at Little Goose may not significantly impact travel times. Dave Benner provided the projected water travel times (WTT) at Little Goose under different operations. Flow (Kcfs) WTT at MOP (days) WTT at Full Reservoir (days) Margaret Filardo (FPC) recommended that if flows are around 130 or higher during the bulkhead operation, it might be better to drop to MOP at a rate of 5 Kcfs/day and maintain uniform spill at Lower Monumental. Flows can be monitored and the decision can be made based on current conditions. Transportation Start Date Paul Wagner (NOAA) stated that the default start date for transportation is May 1 st. He suggested that due to a lack of information regarding the potential benefit of early transportation, to fill out information a transportation study should transport fish from Lower Granite twice a week between April 20 and the official start of transportation. Russ Kiefer (IDFG) suggested that transportation once per week prior to the start of transportation may be sufficient. Margaret Filardo (FPC) reminded FPAC members that the transportation start date was moved from late April into May because data from NOAA showed that transportation benefit ratios were negatively impacted by the fact that fish transported early in the season did not do as well as those that migrated in-river. Tom Lorz (CRITFC) mentioned that since transport one day per week is the current research proposal, he wondered why Paul Wagner was advocating for more frequent transport. Paul Wagner replied that the current transport research only addresses fish tagged at Lower Granite, which are not directly comparable to fish tagged above Lower Granite, according to analysis by Steve Smith (NOAA). o Tom Lorz replied that with the high flows anticipated for this year, there is a low probability that enough tagged fish would be collected and transported to provide adequate sample size. Brandon Chockley (FPC) added that only tagged fish with the appropriate sort-by-code request would be transported rather than returned to the river. o Jay Hesse (Nez Perce Tribe) asked if information regarding sample size and required sampling rate is included in the proposed research. This information is not included in the one-page proposal. Coordination TMT tomorrow, Wednesday April 5. Page 4 of 5
5 There will be a SRWG workgroup on Wednesday, April 5 to discuss Steelhead overshoot and survival. SRWG ranking of one-page proposals is on Thursday, April 6 and Friday, April 7 if needed. There may be a FFDRWG the morning of Thursday, April 6. The next FPAC face-to-face meeting will be April 18 th at 10:00 AM. These minutes have been reviewed and approved by the Fish Passage Advisory Committee. Page 5 of 5
6 FPAC Agenda for Tuesday April 4, 2017 Meeting time: 9:00 AM 1. Approval of outstanding notes March 21,and 28 meeting 2. Water supply and Reservoir status 3. Weather update and climate forecast 4. Fish passage status 5. Bonneville spill proposal 6. Sort-by-code requests: 7. Other 8. Coordination for other schedule meetings
7 FISH PASSAGE CENTER 847 NE 19 th Avenue, #250, Portland, OR Phone: (503) Fax: (503) us at MEMORANDUM TO: FROM: FPAC David Benner, FPC DATE: April 4 th, 2017 RE: Reservoir Operations/Water Supply/Snowpack/LGS MOP Grand Coulee Reservoir is at 1,244.7 feet (4-3-17) and has drafted 4.9 feet over the last week. Outflows at Grand Coulee have ranged between Kcfs and Kcfs over the last week. The April 15 th FC Elevation at Grand Coulee is 1,249.6 feet. The Libby Reservoir is currently at elevation 2,382.8 feet (4-3-17) and has drafted 5.8 feet over the past week. Daily average outflows at Libby Dam have been 25 Kcfs over the last week. The April 15 th FC Elevation at Libby is 2,382.1 feet. Hungry Horse is currently at an elevation of 3,535.8feet (4-3-17) and has drafted 3.5 feet last week. Outflows at Hungry Horse have increased to 11.7 Kcfs over the last week. The April 15 th FC Elevation at Hungry Horse is 3,538.2 feet. Dworshak is currently at an elevation of 1,523.8 feet (4-3-17) and has drafted 5.4 feet over the last week. Inflows to Dworshak decreased last week from 23.4 to 15.4 Kcfs. Dworshak outflows were 25.0 Kcfs last week. The April 15 th System FC Elevation is feet (based on COE April final Forecast of Kaf). The Brownlee Reservoir was at an elevation of feet on April 3, 2017, and drafted 2.3 feet last week. Outflows at Hells Canyon have ranged between 70.6 and 75.3 Kcfs over the last four days. The minimum flow at Hells Canyon is 8.5 Kcfs. The April 15 th FC Elevation at Brownlee is 2,030.8 feet. G:\STAFF\DOCUMENT\2017_Documents\2017_Files\FPAC\0404\FPAC Summary docx
8 Location April 3, day QPF ESP % Average ( ) Runoff Volume (Kaf) The Dalles (Apr-Aug) Grand Coulee (Apr-Aug) Libby Res. Inflow, MT (Apr-Aug) Hungry Horse Res. Inflow, MT (Apr-Aug) Lower Granite Res. Inflow (Apr- July) Brownlee Res. Inflow (Apr-July) Dworshak Res. Inflow (Apr-July) ** *COE March Forecast ** COE April Forecast * 6783* ** Page 2 of 6
9 Snow Water Equivalent (% Med.) Snow Water Equivalent (% Med.) Basin Columbia above the Snake River Confluence Kootenai River in Montana Flathead River Upper Clark Fork River Bitterroot Lower Clark Fork River Idaho Panhandle Region Columbia above Methow Chelan, Entiat, Wenatchee Yakima, Ahtanum Average * Snake River Snake above Palisades Henry Fork, Teton, Willow, Blackfoot, Portneuf Big and Little Wood Big and Little Lost Raft, Goose, Salmon Falls, Bruneau Weiser, Payette, Boise Owyhee Malheur Grande Ronde, Powder, Burnt, Imnaha Clearwater and Salmon Average * Lower Columbia between Bonneville and McNary Umatilla, Walla Walla, Willow Deschutes, Crooked, John Day Lower Columbia, Hood River Average * Page 3 of 6
10 Little Goose MOP Operations and Water Travel Time WTT through LGS pool at MOP (633 ft) WTT through LGS pool at Full (638 ft) Snake River Flow at Flow at Flow (Kcfs) days ft/s Storage Between full Pool (638 ft) and MOP (633 ft) = 48.7 Kcfs or 24.6 Ksfd = 12.3 Kcfs for 2 days or 6.2 Kcfs for four days or 4.1 Kcfs for six days Reservoir Elevation Actual Reservoir Elevation Full Pool Reservoir Elevation January FC February FC March FC Figure 1. Grand Coulee Time Page 4 of 6
11 Reservoir Elevation Actual Reservoir Elevation Full Pool Reservoir Elevation January FC February FC March FC Figure 2. Libby Time Reservoir Elevation Actual Reservoir Elevation Full Pool Reservoir Elevation February System FC March System FC March Local Figure 3. Dworshak Time Page 5 of 6
12 Reservoir Elevation Actual Reservoir Elevation Full Pool Reservoir Elevation January FC February FC March FC Figure 4. Hungry Horse Time Reservoir Elevation Actual Reservoir Elevation Full Pool Reservoir Elevation January FC February FC March FC Figure 5. Brownlee Time Page 6 of 6
13 Water Year 2017 Precipitation Monthly Clim Norm Monthly Seasonal Temp. (degf) March 1-31 (Oct. 1 - now) (pro-rated) Portland 197% 158% -0.5 UPPER-COLUMBIA: Kamloops 165% 133% -0.9 Revelstoke 166% 79% -2.0 Cranbrook 232% 205% -0.7 Creston 201% 144% -0.4 average: 191% 140% -1.0 Normal: MIDDLE-COLUMBIA: Pendleton 178% 150% 0.8 Redmond 86% 140% 3.1 Yakima 158% 167% 2.6 Wenatchee AP 192% 126% -3.1 Omak 192% 132% -1.5 Spokane 255% 187% 0.6 average: 177% 150% 0.4 Normal: LOWER SNAKE: Lewiston 304% 182% 0.3 Pullman 256% 173% 1.4 Stanley 278% 235% 6.1 Challis 45% 165% 5.1 average: 221% 189% 3.2 Normal: UPPER and MIDDLE SNAKE: McCall 253% 191% 4.9 Ontario 160% 153% 3.5 Boise 206% 145% 4.4 Twin Falls 110% 142% 3.2 Burley 62% 168% 7.4 Pocatello 75% 209% 5.8 Idaho Falls 40% 141% 5.5 average: 129% 164% 5.0 Normal: Forecasted Daily Rain (in inches), BON dam area: 4-Apr Apr Apr Apr Apr Apr Apr 0.15
14
15 Mt. Hood Test Site, Oregon (north Oregon Cascades). Elevation 5370 feet. Irish Taylor, Oregon (central Oregon Cascades). Elevation 5540 feet.
16 Stampede Pass, Washington (central Washington Cascades). Elevation 3850 feet. Mountain Meadows, Idaho (Panhandle, Salmon River drainage). Elevation 6360 feet.
17 Source: Fish Passage Center Two-Week Summary of Passage Indices Updated: 4/7/ :01 * One or more of the sites on this date had an incomplete or biased sample. See Sampling Comments: For clip information see: For sockeye and yearling chinook (Snake only) race information see: COMBINED YEARLING WTB IMN GRN LEW LGR LGS LMN RIS MCN JDA BO2 Date (Coll) (Coll) (Coll) (Coll) (INDEX) (INDEX) (INDEX) (INDEX) (INDEX) (INDEX) (INDEX) 03/24/ /25/ /26/ , /27/2017 * , /28/2017 * , /29/ , /30/2017 * , /31/2017 * 1, , /01/2017 * 1, , ,137 04/02/ ,048 1,426 1, , /03/2017 3, , ,063 04/04/2017 * ,016 4,424 1, ,498 1,500 04/05/2017 * 1, , ,190 04/06/2017 * ,366 7, ,668 1,219 04/07/ Total: 10, , ,060 13,532 2, ,841 9,303 # Days: Average: 1, ,088 4,511 1, , YTD 12,317 1,272 3, ,060 13,532 2, ,841 13,039 COMBINED SUBYEARLING WTB IMN GRN LEW LGR LGS LMN RIS MCN JDA BO2 Date (Coll) (Coll) (Coll) (Coll) (INDEX) (INDEX) (INDEX) (INDEX) (INDEX) (INDEX) (INDEX) 03/24/ ,209 03/25/ ,178 03/26/ ,494 03/27/2017 * ,038 03/28/2017 * ,859 03/29/ ,105 03/30/2017 * ,581 03/31/2017 * ,704 04/01/2017 * ,270 04/02/ ,533 04/03/ ,833 04/04/2017 * ,058 04/05/2017 * ,150 04/06/2017 * ,051 04/07/ Total: , ,063 # Days: Average: ,005 YTD , ,129
18 COMBINED WTB IMN GRN LEW LGR LGS LMN RIS MCN JDA BO2 Date (Coll) (Coll) (Coll) (Coll) (INDEX) (INDEX) (INDEX) (INDEX) (INDEX) (INDEX) (INDEX) 03/24/ /25/ /26/ /27/2017 * /28/2017 * /29/ /30/2017 * /31/2017 * /01/2017 * ,990 04/02/ ,316 04/03/ ,208 04/04/2017 * ,615 04/05/2017 * ,397 04/06/2017 * ,991 04/07/ Total: , ,121 # Days: Average: ,652 YTD , ,757 COMBINED WTB IMN GRN LEW LGR LGS LMN RIS MCN JDA BO2 Date (Coll) (Coll) (Coll) (Coll) (INDEX) (INDEX) (INDEX) (INDEX) (INDEX) (INDEX) (INDEX) 03/24/ /25/ /26/ , /27/2017 * , /28/2017 * , /29/ , /30/2017 * , /31/2017 * , /01/2017 * , /02/ ,344 17,686 20, , /03/ , /04/2017 * ,184 6,186 9, , /05/2017 * , /06/2017 * ,971 6, , /07/ Total: , ,397 30,583 29, ,687 3,868 # Days: Average: ,533 10,194 14, , YTD , ,397 30,583 29, ,687 3,950
19 COMBINED SOCKEYE WTB IMN GRN LEW LGR LGS LMN RIS MCN JDA BO2 Date (Coll) (Coll) (Coll) (Coll) (INDEX) (INDEX) (INDEX) (INDEX) (INDEX) (INDEX) (INDEX) 03/24/ /25/ /26/ /27/2017 * /28/2017 * /29/ /30/2017 * /31/2017 * /01/2017 * /02/ /03/ /04/2017 * /05/2017 * /06/2017 * /07/ Total: , ,903 # Days: Average: YTD , ,324 COMBINED LAMPREY JUVENILES WTB IMN GRN LEW LGR LGS LMN RIS MCN JDA BO2 Date (Coll) (Coll) (Coll) (Coll) (Samp) (Coll) (Coll) (Coll) (Coll) (Coll) (Coll) 03/24/ /25/ /26/ /27/2017 * /28/2017 * /29/ /30/2017 * /31/2017 * ,090 04/01/2017 * ,320 04/02/ , /03/ /04/2017 * , /05/2017 * /06/2017 * , /07/ Total: ,385 8,924 # Days: Average: , YTD ,385 31,159
20 * See sampling comments Smolt indices, clipped & unclipped or combined, are presented in the following order: yearling chinook (chinook 1's,) subyearling chinook (chinook 0's), steelhead, coho, sockeye, and lamprey juveniles. Three classes of fish counts are shown in these tables: Sample counts (Samp) are provided for juvenile lamprey at LGR. See note below for details. Collection counts (Coll), which account for sample rates but are not adjusted for flow; Passage indices (INDEX), which are collection counts divided by the proportion of water passing through the sampled powerhouse. Passage indices are not population estimates, but are used to adjust collection counts for daily fluctuations in the site's or project's operations. The classes of counts presented in the report are defined below for each site. Most samples occur over a 24-hr period that spans two calendar days. In this report, the date shown corresponds with the sample end date. Combined lamprey juvenile collection counts are provided for all sites. Combined lamprey juveniles is a combination of pacific lamprey ammocoetes, brook lamprey ammocoetes, unknown lamprey ammocoetes, pacific lamprey macropthalmia, and unidentified lamprey species. In 2013 it was confirmed that juvenile lamprey can escape the sample tank at LGR which would lead to unreliable estimates of collection. Therefore, only sample counts are provided in this report. Definitions for Smolt Index Counts WTB (Collection) = Salmon River Trap at Whitebird : Collection Counts IMN (Collection) = Imnaha River Trap : Collection Counts GRN (Collection) = Grande Ronde River Trap : Collection Counts LEW (Collection) = Snake River Trap at Lewiston : Collection Counts LGR (Index) = Lower Granite Dam Bypass Collection System : Passage Index Counts Passage Index = Collection Counts / {Powerhouse Flow / (Powerhouse Flow + Spill)} LGS (Index) = Little Goose Bypass Collection System : Passage Index Counts Passage Index = Collection Counts / {Powerhouse Flow / (Powerhouse Flow + Spill)} LMN (Index) = Lower Monumental Dam Bypass Collection System : Passage Index Counts Passage Index = Collection Counts / {Powerhouse Flow / (Powerhouse Flow + Spill)} RIS (Index) = Rock Island Dam Second Powerhouse Bypass Trap : Passage Index Counts Passage Index = Collection Counts / {Powerhouse 2 Flow / (Powerhouse 1 & 2 Flow + Spill)} MCN (Index) = McNary Dam Bypass Collection System : Passage Index Counts Passage Index = Collection Counts / {Powerhouse Flow / (Powerhouse Flow + Spill)} JDA (Index) = John Day Dam Bypass Collection System : Passage Index Counts Passage Index = Collection Counts / {Powerhouse Flow / (Powerhouse Flow + Spill)} BO2 (Index) = Bonneville Dam Second Powerhouse Bypass Collection System : Passage Index Counts Passage Index = Collection Counts / {Powerhouse 2 Flow / (Powerhouse 1 & 2 Flow + Spill)} JDA and BO2 data collected for the FPC by Pacific States Marine Fisheries Commission. RIS data collected for the FPC by Chelan Co. PUD. LGR, LMN, and MCN data collected for the FPC by Washington Dept. of Fish and Wildlife. LGS and GRN data collected for the FPC by Oregon Dept. of Fish and Wildlife. IMN data collected for the FPC by the Nez Perce Tribe. Fall (post SMP season) trapping at the Imnaha River Fish Trap (IMN) is funded by the Lower Snake River Compensation Program (LSRCP) WTB and LEW data collected for the FPC by Idaho Dept. of Fish and Game.
21 4/7/ Day and YTD Adult Counts 2017 SALMON COUNTS Daily Totals for Last 7 days and Year to Date Totals (based on reporting dates since 2000) [ FPC Home ] [ Adult Salmon Home ] Corp of Engineers Adult Fish Count Queries by Project and Fish Ladder NOTE: These data are updated as soon as the Corp of Engineers provides the data to us. MORE HOT LINKS: GO TO: Adult Count RSS Feed or Annual Totals or 10 Yr. Avg. vs 2017 and 2016 Graph Table or Water Flow & Spill or Current Water Temperature (January through December) Current vs. Historical Water Temperature (April through Aug) Offline until April FISHING REPORTS: Oregon or Washington or Idaho DATE WILLAMETTE S 2) ytd_adults.htm 1/3 WILD 5) SHAD SOCKEYE LAMPREY CHUM PINK SOURCE 03/31/ n/a n/a n/a n/a n/a n/a n/a n/a WFA 04/01/ n/a n/a n/a n/a n/a n/a n/a n/a WFA 04/02/ n/a n/a n/a n/a n/a n/a n/a n/a WFA 04/03/ n/a n/a n/a n/a n/a n/a n/a n/a WFA 04/04/ n/a n/a n/a n/a n/a n/a n/a n/a WFA 04/05/17 04/06/17 YTD n/a n/a n/a n/a n/a n/a n/a n/a DATE BONNEVILLE DAM WILD 5) SHAD 6) SOCKEYE LAMPREY CHUM PINK SOURCE 03/31/ USACE 04/01/ USACE 04/02/ USACE 04/03/ USACE 04/04/ USACE 04/05/ USACE 04/06/17 YTD DATE THE DALLES DAM 2) **) WILD 5) SHAD SOCKEYE LAMPREY CHUM PINK SOURCE 03/31/ n/a USACE 04/01/ n/a USACE 04/02/ n/a USACE 04/03/ n/a USACE 04/04/ n/a USACE 04/05/ n/a USACE 04/06/17 YTD n/a DATE JOHN DAY DAM 2) WILD 5) SHAD SOCKEYE LAMPREY CHUM PINK SOURCE 04/01/ n/a USACE 04/02/ n/a USACE 04/03/ n/a USACE 04/04/ n/a USACE 04/05/ n/a USACE 04/06/17 YTD n/a DATE MCNARY DAM **) WILD 5) SHAD SOCKEYE LAMPREY CHUM PINK SOURCE 03/31/ USACE 04/01/ USACE 04/02/ USACE 04/03/ USACE 04/04/ USACE 04/05/ USACE 04/06/17 YTD
22 4/7/ Day and YTD Adult Counts DATE ICE HARBOR DAM WILD 5) SHAD SOCKEYE LAMPREY CHUM PINK SOURCE 04/01/ USACE 04/02/ USACE 04/03/ USACE 04/04/ USACE 04/05/ USACE 04/06/17 YTD DATE LOWER MONUMENTAL DAM 2) WILD 5) SHAD SOCKEYE LAMPREY CHUM PINK SOURCE 04/01/ n/a USACE 04/02/ n/a USACE 04/03/ n/a USACE 04/04/ n/a USACE 04/05/ n/a USACE 04/06/17 YTD n/a DATE LITTLE GOOSE DAM 2) WILD 5) SHAD SOCKEYE LAMPREY CHUM PINK SOURCE 04/01/ n/a USACE 04/02/ n/a USACE 04/03/ n/a USACE 04/04/ n/a USACE 04/05/ n/a USACE 04/06/17 YTD n/a DATE LOWER GRANITE DAM 3) WILD 5) SHAD 6) SOCKEYE LAMPREY CHUM PINK SOURCE 03/31/ USACE 04/01/ USACE 04/02/ USACE 04/03/ USACE 04/04/ USACE 04/05/ USACE 04/06/17 YTD NOTES: At Willamette Falls Dam, it takes the staff most of the day to accurately review one day of fish passage on tape when the counts are high. The WFA staff make every attempt to keep the counts as up to date as possible. Note: at WFA Monday's are extremely busy, as the staff attempt to catch up with the weekend counts. The Corp of Engineers has stopped shad counting at The Dalles, starting in 2011 on the advice of the Fish Passage Operations and Management (FPOM) committee, made up of NOAA, CRITFC, ODFW, WDFW, IDFW, BPA, and COE biologists. 1) Since the year 2006, Priest Rapids Dam and Wanapum Dam jack counts have included mini jacks. 2) Shad are not counted at Willamette Falls, The Dalles, John Day, Lower Monumental, Little Goose, Rock Island, Rocky Reach and Wells Dams 3) Steelhead counts appear higher at Lower Granite Dam because most years a group which migrated into the river system between October and December overwinters below LGR and continues its migration in early March. 4) As the Army Corp of Engineers no longer collects adult counts from the PUDs, we now get data directly from Chelan, Douglas and Grant Co. PUDs and DART. The steelhead counts include unclipped (wild) steelhead. It is not appropriate to add the steelhead counts and wild steelhead counts together. 5) Wild steelhead are counted separately from hatchery steelhead at Corps dams on the Columbia and Snake Rivers. Wild steelhead are identified as fish with an intact adipose fin. However, a small number of hatchery fish may not have had their adipose fin removed. There are no wild steelhead counts at Priest Rapids or Willamette Falls. Willamette Falls counts for: Chinook, Steelhead, and Coho only. 6) Shad are typically not counted at any of the Corps dams after August 31 each year and shad are not counted at all Corps dams. An n/a in the shad columns at Bonneville Dam and Lower Granite Dam after August 31st means that the shad are not being counted. 7) In 2014, Grant County PUD trapped and transported hundreds of Lamprey above Rock Island Dam. Therefore, the ladder counts of Lamprey at Rock Island under estimate the true numbers of lamprey past the project. When the source column on this report reads 'unknown', 'ceftp', or 'TMT', it is because the counts have been gathered via the phone or ftp and are considered preliminary data. When the Corp of Engineers finalizes the counts and posts them on their website the source reads USACE. This report includes ALL available adult counts. The information in this report is preliminary. In 2012, the U.S. Army Corps of Engineers and NOAA Fisheries are currently developing automated counting systems for Lamprey Passage Structures (LPS) installed at Bonneville Dam. In the interest of publishing accurate counts, LPS counts will not be publicly posted in season until the automated systems are fully operational. The adult counts in this report are based on reporting dates for dams recently established (2000). They are presented in the table below. A report with adult salmon counts based on historical dates (prior to 2000) can be found here. The reporting dates table shows that several dams stop counting fish around November 15th each year. After a dam stops counting fish for the season, only the total number of fish are shown on this report. These data are updated periodically throughout the day. The FPC data retrieving robot searches the web for updated data every 30 minutes in the AM, and every hour in the PM. ytd_adults.htm 2/3
23 4/7/ Day and YTD Adult Counts The last column " Source " shows where the data was imported from: NWACE is imported from the COE's Daily Fish Reports; USACE is from US Army Corps of Engineers fish count pages; CHPUD is from Chelan PUD; GCPUD is from Grant PUD and DGPUD is from Douglas PUD and DART is from the University of Washington's Data Access in Real Time, WFA is imported from ODFW's Willamette Falls website. Some of the sites are several days behind in reporting, but is reported by the COE as zero, so where zeros appear across all rows, the data should be considered as "not yet reported". Video counts can cause a delay in posting the data to the web, because the staff at the projects have to review the tapes Adult Salmon Dam Count Monitoring Dates Dam Bonneville Dam The Dalles Dam John Day Dam McNary Dam Ice Harbor Dam Video Monitoring Dates Day Night March 1 March 31, 2017 May 15 September December 1, , 2016 February 28, 2018 June 15 September 30, 2017 June 15 September 30, 2017 June 15 September 30, 2017 Direct Monitoring Dates April 1 to November 30, 2017 April 1 to October 31, 2017 April 1 to October 31, 2017 April 1 to October 31, 2017 April 1 to October 31, 2017 Lower Monumental Dam April 1 to October 31, 2017 Little Goose Dam Lower Granite Dam Priest Rapids Dam Wanapum Dam Rock Island Dam Rocky Reach Dam Wells Dam March 1 March 31, 2017 November 1 December 30, 2017 April 15 November 15, 2017 (24 hr) April 15 November 15, 2017 (24 hr) April 14 November 15, 2017 (24 hr) April 14 November 15, 2017 (24 hr) May 1 November 15, 2017 (24 hr) Willamette Falls Count year round (24 hr) June 1 September 30, 2017 April 1 to October 31, 2017 April 1 October 31, Columbia and Snake River Fishway Outages Dam Bonneville Dam The Dalles Dam John Day Dam McNary Dam Ice Harbor Dam Lower Monumental Dam Dates Fishways are Closed Bradford Island Fishway: Not Dewatering. Cascades Island Fishway: Not Dewatering. Washington Shore Fishway: December 1, 2016 February 28, East Fish Fishway: December 1, 2016 February 28, North Fish Fishway: January 3, 2017 January 17, North Fish Fishway: December 1, 2016 January 10, South Fish Fishway: January 17, 2017 February 28, Washington Shore Fishway: December 1, 2016 January 27, Oregon Shore Fishway: January 28, 2017 February 24, North Shore Fishway: January 3, 2017 January 27, South Shore Fishway: January 30, 2017 February 27, North Shore Fishway: January 3, 2017 January 30, South Shore Fishway: February 6, 2017 February 28, Little Goose Dam January 2, 2017 February 17, Lower Granite Dam January 2, 2017 February 13, Priest Rapids Dam Wanapum Dam Rock Island Dam Left Bank Fishway: TBD Right Bank Fishway: TBD Right Bank Fishway: TBD Left Bank Fishway: TBD Right Bank Fishway: January 3, 2017 to January 24, Left Bank Fishway: December 19, 2017 to February 2, Middle Fishway: December 5, 2016 to December 30, Rocky Reach Dam December 12, 2016 to February 28, Wells Dam West Ladder: TBD East Ladder: TBD Data source: Corp of Engineers, Dewatering Plans and Schedules. Available online at: Page last updated on: :05:20 Copyright Fish Passage Center. ytd_adults.htm 3/3
24 4/7/2017 Cumulative Adult Ladder Counts [ FPC Home ] [ Adult Salmon Home ] YEAR TO DATE RETURN COMPARISON REPORT Spring Chinook Summer Chinook Fall Chinook yr Avg yr Avg yr Avg Dam End Date Adult Jack Adult Jack Adult Jack Adult Jack Adult Jack Adult Jack Adult Jack Adult Jack Adult Jack BON 04/ TDA 04/ JDA 04/ MCN 04/ IHR 04/ LMN 04/ LGS 04/ LGR 04/ PRD WAN RIS RRH WEL WFA 04/ Dam End Date Coho Sockeye Steelhead Lamprey Shad 10 yr Avg yr Year Avg Adult Jack Adult Jack Adult Jack Adult Adult Adult Adult Adult Adult Unclipped Unclipped Unclipped Year Year Year BON 04/ TDA 04/ JDA 04/ MCN 04/ IHR 04/ LMN 04/ LGS 04/ LGR 04/ PRD WAN RIS RRH WEL WFA 04/ NOTES: Since the year 2006, Priest Rapids Dam jack counts have included mini jacks. BON=Bonneville, TDA=The Dalles, JDA=John Day, MCN=McNary, LMN=Lower Monumental, LGS=Little Goose, LGR=Lower Granite, PRD=Priest Rapids, RIS=Rock Island, RRH=Rocky Reach, WEL=Wells, WFA Willamette Falls Dam This report is based on historic dam counting dates. In January and February, Willamette Falls Dam is the only project that appears on the report because historically it collected data during this time period. End Date is the last day of data we have for that site the 2014 and 10 year average are also run to this end date. PRD is not posting wild steelhead numbers. These numbers were collected from USACE, Grant PUD, Douglas PUD, Chelan PUD, ODFW and DART. Shad data are not available at WEL, WFA, RIS, and RRH. Wild steelhead numbers are included in the total. Wild Steelhead are defined as unclipped fish. Historic counts (pre 1996) were obtained from CRITFC and compiled by the FPC. Historic counts 1997 to present were obtained from the Corps of Engineers. Page design last updated on: March 9, 2017 This website designed for 1024 x 768 or higher resolution. Questions and comments to: webmaster@fpc.org [ Home ] [ Adult ] [ Smolt ] [ Spawning ] [ River ] [ Hatchery] [ Survival] [ Travel times] [ Documents ] 1/1
25 Project Spill Update: March 28-April 3, 2017 For FPAC Conference Call (4/4/2017) Lower Granite Spill (Kcfs) Total Dissolved Gas (%) Mar 29-Mar 30-Mar 31-Mar 1-Apr 2-Apr 3-Apr 4-Apr Date 2017 FOP Spill (20 Kcfs/20 Kcfs) Actual Spill 12-hr Avg LGS Forebay Forebay Waiver (115%) 12-hr Avg LGR Tailrace Tailrace Waiver (120%) 4/3/ FOP: 20 kcfs/20 kcfs; 24-hr Avg Spill = 82.4 kcfs; LGR Tailrace (12-hr Avg TDG = 127%) - TDG waiver exceeded; LGS Forebay (12-hr Avg TDG = 119%) - TDG waiver exceeded; **Spill in excess of FOP due to high flows in excess of hydraulic capacity**
26 Project Spill Update: March 28-April 3, 2017 For FPAC Conference Call (4/4/2017) 70 Little Goose Spill (Kcfs) Total Dissolved Gas (%) Mar 29-Mar 30-Mar 31-Mar 1-Apr Date 2-Apr 3-Apr 4-Apr 2017 FOP Spill (30%/30%) Actual Spill 12-hr Avg LMN Forebay Forebay Waiver (115%) 12-hr Avg LGS Tailrace Tailrace Waiver (120%) 4/3/ FOP: 30%/30%; 24-hr Avg Spill = 48.1 kcfs (32.0%); LGS Tailrace (12-hr Avg TDG = 121%) - TDG waiver exceeded; LMN Forebay (12-hr Avg TDG = 119%) - TDG waiver exceeded;
27 Project Spill Update: March 28-April 3, 2017 For FPAC Conference Call (4/4/2017) Spill (Kcfs) Lower Monumental Mar 29-Mar 30-Mar 31-Mar 1-Apr 2-Apr 3-Apr 4-Apr Date 2017 FOP Spill (Gas Cap/Gas Cap) Actual Spill 12-hr Avg IHR Forebay Forebay Waiver (115%) 12-hr Avg LMN Tailrace Tailrace Waiver (120%) Total Dissolved Gas (%) 4/3/ FOP**: Gas Cap/Gas Cap; 24-hr Avg Spill = 77.1 kcfs; LMN Tailrace (12-hr Avg TDG = 123%) - TDG waiver exceeded; IHR Forebay (12-hr Avg TDG = 121%) - TDG waiver exceeded; **Spill in excess of FOP due to high flows in excess of hydraulic capacity**
28 Project Spill Update: March 28-April 3, 2017 For FPAC Conference Call (4/4/2017) Spill (Kcfs) Ice Harbor Mar 29-Mar 30-Mar 31-Mar 1-Apr 2-Apr 3-Apr 4-Apr Date 2017 FOP Spill (45 Kcfs/Gas Cap) Actual Spill 12-hr Avg MCN Forebay Forebay Waiver (115%) 12-hr Avg IHR Tailrace Tailrace Waiver (120%) Total Dissolved Gas (%) 4/3/ FOP: 45 kcfs/gas Cap; 24-hr Avg Spill = kcfs; IHR Tailrace (12-hr Avg TDG = 123%) - TDG waiver exceeded; MCN Forebay (12-hr Avg TDG = 117%) - TDG waiver exceeded; **Spill in excess of FOP due to high flows in excess of hydraulic capacity**
29 Carrying non-spinning reserves above 1% at MCN and TDA. 3/30/17 Currently the Federal Columbia River Power System (FCRPS) is experiencing unusually high streamflows in excess of powerhouse capacities resulting in total dissolved gas (TDG) saturation levels exceeding the state water quality standards. These conditions are expected to persist at least through the month of April depending on streamflows. During this period BPA is attempting to fully load all of the available turbines to control TDG levels as close to the state standards as possible. Prior to April 1, the turbines were allowed to be operated up to full load. After April 1, turbine operations are restricted to operating within 1 percent of their peak efficiency. At McNary Dam and The Dalles Dam the 1% restriction results in a significant reduction the amount of water that can flow through the turbines. When streamflows are at more typical levels the restriction does not result in a noticeable change in spill at the dams. However, during very high streamflow conditions, such as is the case this year, the reduction in turbine flow exacerbates the already high TDG saturation in the river. Example: With the current high flows, restricting the flow through units to the 1% band will result in ~30-60 kcfs more spill at each of McNary and The Dalles dams. The increase in spill flow is estimated to raise the TDG saturations levels level 1-3% above current levels which are exceeding 120%. To maintain the reliability of the power system, a portion of the generation in the system must be held in reserve to account for unexpected increases in electricity demand, voltage or frequency. In order to provide the required reserves a generator must unload turbines to create unused capacity and make sure there is sufficient water available to utilize that capacity. A certain amount of these reserves must be available for deployment in seconds and are therefore required to be held on a generator that is already spinning. Some level of the required reserves can be non-spinning, meaning the reserves need to be deployable within 10 minutes. To maintain the required reliability of the power system at least half of the required reserves in the system must be spinning. BPA is proposing to use the system capability above the 1 percent operating range at McNary and The Dalles dams as a non-spinning reserve. If implemented, the ability to deploy non-spinning reserves in this manner will allow BPA to fulfill a portion of our reserve requirements and minimize spill above the state water quality standards. The operation will be rescinded when streamflows recede sufficiently to allow the reserves to be held within the FPP spill caps with the turbines operating within the established 1 percent operating range. If not implemented, in order to carry reserves, BPA will be required to further restrict the operation of units within the established 1 percent operating range, resulting in additional spill and increased TDG saturation levels above the state water quality standards until streamflows recede as noted above.
On August 14, 2018, FPAC met for its weekly conference call. The following people participated in the meeting:
 FISH PASSAGE CENTER 847 NE 19 th Avenue, #250, Portland, OR 97232 Phone: (503) 833-3900 Fax: (503) 232-1259 www.fpc.org/ e-mail us at fpcstaff@fpc.org MEMORANDUM To: From: Fish Passage Advisory Committee
On May 29, 2018, FPAC met via conference call for its weekly meeting. The following people participated in the meeting:
 FISH PASSAGE CENTER 847 NE 19 th Avenue, #250, Portland, OR 97232 Phone: (503) 833-3900 Fax: (503) 232-1259 www.fpc.org/ e-mail us at fpcstaff@fpc.org MEMORANDUM To: From: Fish Passage Advisory Committee
FISH PASSAGE CENTER. On January 8, 2019, FPAC met for its weekly conference call. The following people participated in the call:
 FISH PASSAGE CENTER 847 NE 19 th Avenue, #250, Portland, OR 97232 Phone: (503) 833-3900 Fax: (503) 232-1259 www.fpc.org/ e-mail us at fpcstaff@fpc.org MEMORANDUM To: From: Fish Passage Advisory Committee
On January 23, 2018, FPAC met via conference call for its weekly meeting. The following people participated in the meeting:
 FISH PASSAGE CENTER 847 NE 19 th Avenue, #250, Portland, OR 97232 Phone: (503) 833-3900 Fax: (503) 232-1259 www.fpc.org/ e-mail us at fpcstaff@fpc.org MEMORANDUM To: From: Fish Passage Advisory Committee
On April 3, 2018, FPAC met via conference call for its weekly meeting. The following people participated in the meeting:
 FISH PASSAGE CENTER 847 NE 19 th Avenue, #250, Portland, OR 97232 Phone: (503) 833-3900 Fax: (503) 232-1259 www.fpc.org/ e-mail us at fpcstaff@fpc.org MEMORANDUM To: From: Fish Passage Advisory Committee
On January 12, 2016, FPAC met via conference call for its weekly meeting. The following people participated in the meeting:
 FISH PASSAGE CENTER 847 NE 19 th Avenue, #250, Portland, OR 97232 Phone: (503) 833-3900 Fax: (503) 232-1259 www.fpc.org/ e-mail us at fpcstaff@fpc.org MEMORANDUM To: From: Fish Passage Advisory Committee
FISH PASSAGE CENTER AGENDA ITEMS
 FISH PASSAGE CENTER 847 NE 19 th Avenue, #250, Portland, OR 97232 Phone: (503) 833 3900 Fax: (503) 232 1259 www.fpc.org/ e mail us at fpcstaff@fpc.org MEMORANDUM To: From: Fish Passage Advisory Committee
FISH PASSAGE CENTER. On December 4, 2018, FPAC met for its weekly conference call. The following people participated in the call:
 FISH PASSAGE CENTER 847 NE 19 th Avenue, #250, Portland, OR 97232 Phone: (503) 833-3900 Fax: (503) 232-1259 www.fpc.org/ e-mail us at fpcstaff@fpc.org MEMORANDUM To: From: Fish Passage Advisory Committee
FISH PASSAGE CENTER. On February 12, 2019, FPAC met for its weekly conference call. The following people participated in the call:
 FISH PASSAGE CENTER 847 NE 19 th Avenue, #250, Portland, OR 97232 Phone: (503) 833-3900 Fax: (503) 232-1259 www.fpc.org/ e-mail us at fpcstaff@fpc.org MEMORANDUM To: From: Fish Passage Advisory Committee
FISH PASSAGE CENTER AGENDA ITEMS
 FISH PASSAGE CENTER 847 NE 19 th Avenue, #250, Portland, OR 97232 Phone: (503) 833-3900 Fax: (503) 232-1259 www.fpc.org/ e-mail us at fpcstaff@fpc.org MEMORANDUM To: From: Fish Passage Advisory Committee
FISH PASSAGE CENTER. On December 18, 2018, FPAC met for its monthly face-to-face meeting. The following people participated in the meeting:
 FISH PASSAGE CENTER 847 NE 19 th Avenue, #250, Portland, OR 97232 Phone: (503) 833-3900 Fax: (503) 232-1259 www.fpc.org/ e-mail us at fpcstaff@fpc.org MEMORANDUM To: From: Fish Passage Advisory Committee
On January 16, 2018, FPAC met for at the Fish Passage Center for its monthly face-to-face meeting. The following people participated in the meeting:
 FISH PASSAGE CENTER 847 NE 19 th Avenue, #250, Portland, OR 97232 Phone: (503) 833-3900 Fax: (503) 232-1259 www.fpc.org/ e-mail us at fpcstaff@fpc.org MEMORANDUM To: From: Fish Passage Advisory Committee
Smolt Monitoring Program Two Week Passage Index Report Page 1 of 7
 Page 1 of 7 COMBINED YEARLING CHINOOK 09/15/2018 0 0 0 0 09/18/2018 0 0 0 0 0 09/20/2018 0 0 0 0 09/21/2018 0 0 1 0 09/23/2018 1 0 0 09/25/2018 0 1 0 09/26/2018 1 0 0 0 09/28/2018 0 0 0 Total: 0 0 0 0
February 27, Jim Ruff, Manager, Mainstem Passage and River Operations. March 2008 Runoff Forecast and Power Supply Status
 W. Bill Booth Chair Idaho James A. Yost Idaho Tom Karier Washington Richard K. Wallace Washington Bruce A. Measure Vice-Chair Montana Rhonda Whiting Montana Melinda S. Eden Oregon Joan M. Dukes Oregon
COLUMBIA RIVER TECHNICAL MANAGEMENT TEAM March 28, 2018 Facilitator s Summary Facilitator: Donna Silverberg; Notes: Nancy Pionk, DS Consulting
 1 COLUMBIA RIVER TECHNICAL MANAGEMENT TEAM March 28, 2018 Facilitator s Summary Facilitator: Donna Silverberg; Notes: Nancy Pionk, DS Consulting The following Facilitator s Summary is intended to capture
ACCUMULATED PRECIPITATION IN INCHES
 CUMULATIVE PRECIPITATION WATER YEAR COLUMBIA BASIN ABOVE GRAND COULEE 84% of Normal 1971- Average ACCUMULATED PRECIPITATION IN INCHES 8 6 82% of Normal 85% of Normal 82% of Normal SNAKE RIVER BASIN ABOVE
COLUMBIA RIVER TECHNICAL MANAGEMENT TEAM March 8, 2017 DRAFT Facilitator s Summary Facilitator: Emily Stranz; Notes: Charles Wiggins, DS Consulting
 COLUMBIA RIVER TECHNICAL MANAGEMENT TEAM March 8, 2017 DRAFT Facilitator s Summary Facilitator: Emily Stranz; Notes: Charles Wiggins, DS Consulting The following Facilitator s Summary is intended to capture
847 NE 19 th Avenue, #250, Portland, OR Phone: (503) Fax: (503) us at
 Fax: (503) us at") FISH PASSAGE CENTER 847 NE 19 th Avenue, #250, Portland, OR 97232 Phone: (503) 833-3900 Fax: (503) 232-1259 www.fpc.org/ e-mail us at fpcstaff@fpc.org MEMORANDUM TO: Fish Passage Advisory Committee FROM:
FISH PASSAGE CENTER 847 NE 19 th Avenue, #250, Portland, OR 97232 Phone: (503) 833-3900 Fax: (503) 232-1259 www.fpc.org/ e-mail us at fpcstaff@fpc.org MEMORANDUM TO: Fish Passage Advisory Committee FROM:
COLUMBIA RIVER TECHNICAL MANAGEMENT TEAM February 1, 2017 Facilitator s Summary Facilitator: Emily Stranz; Notes: Charles Wiggins, DS Consulting
 COLUMBIA RIVER TECHNICAL MANAGEMENT TEAM February 1, 2017 Facilitator s Summary Facilitator: Emily Stranz; Notes: Charles Wiggins, DS Consulting The following Facilitator s Summary is intended to capture
ACCUMULATED PRECIPITATION IN INCHES
 4 3 CUMULATIVE PRECIPITATION WATER YEAR 7 COLUMBIA BASIN ABOVE GRAND COULEE 18% of Normal 1971- Average ACCUMULATED PRECIPITATION IN INCHES 1 3 1 4 3 1 8 6 4 94% of Normal 17% of Normal 118% of Normal
2016 Water Management Plan Seasonal Update March 14, Introduction
 Water Management Plan Seasonal Update March 14, 1. Introduction The annual Water Management Plan (WMP) is developed prior to the implementation of Federal Columbia River Power System (FCRPS) operational
ACCUMULATED PRECIPITATION IN INCHES
 40 30 CUMULATIVE PRECIPITATION WATER YEAR 2010 COLUMBIA BASIN ABOVE GRAND COULEE 164% of Normal 1971-2000 Average ACCUMULATED PRECIPITATION IN INCHES 20 10 0 30 20 10 0 40 30 20 10 0 80 60 40 154% of Normal
Appendix A Total Dissolved Gas. Fixed Monitoring Stations
 Appendix A 2017 Total Dissolved Gas Fixed Monitoring Stations Updated October 2017 This page is purposely left blank for duplex printing. Introduction The Corps fixed monitoring station (FMS) system is
2017 Water Management Plan Seasonal Update March 1, Introduction
 2017 Water Management Plan Seasonal Update March 1, 2017 1. Introduction The annual Water Management Plan (WMP) is developed prior to the implementation of Federal Columbia River Power System (FCRPS) operational
ACCUMULATED PRECIPITATION IN INCHES
 CUMULATIVE PRECIPITATION WATER YEAR 9 COLUMBIA BASIN ABOVE GRAND COULEE 87% of Normal 1971- Average ACCUMULATED PRECIPITATION IN INCHES 8 6 97% of Normal 94% of Normal 77% of Normal SNAKE RIVER BASIN ABOVE
ACCUMULATED PRECIPITATION IN INCHES
 4 3 CUMULATIVE PRECIPITATION WATER YEAR 29 COLUMBIA BASIN ABOVE GRAND COULEE 94% of Normal 1971-2 Average ACCUMULATED PRECIPITATION IN INCHES 2 1 3 2 1 4 3 2 1 8 6 4 113% of Normal 99% of Normal 87% of
2016 Water Management Plan Seasonal Update November 8, Introduction
 Water Management Plan Seasonal Update November 8, 1. Introduction The annual Water Management Plan (WMP) is developed prior to the implementation of Federal Columbia River Power System (FCRPS) operational
Technical Report. October September Prepared by: W. Nicholas Beer Susannah Iltis James J. Anderson
 Evaluation of the 25 s of the Run-Timing of Wild Migrant Yearling Chinook, Subyearling Chinook and Steelhead and Water Quality at Multiple Locations on the Snake and Columbia Rivers using CRiSP/RealTime
BOR : John Roache / Mary Mellema / Pat McGrane BPA : Tony Norris / Scott Bettin / Robyn MacKay
 TECHNICAL MANAGEMENT TEAM BOR : John Roache / Mary Mellema / Pat McGrane BPA : Tony Norris / Scott Bettin / Robyn MacKay NOAA-F: Paul Wagner / Richard Dominigue USFWS : David Wills / Steve Haeseker OR
MEMORANDUM. Fish Passage Advisory Committee. Fish Passage Center. DATE: May 15, 2018
 FISH PASSAGE CENTER 847 N.E. 19 th Avenue, #250, Portland, Oregon 97232 Phone: (503) 833-3900 Fax: (503) 232-1259 www.fpc.org e-mail us at fpcstaff@fpc.org MEMORANDUM TO: FROM: Fish Passage Advisory Committee
2012 Water Management Plan Seasonal Update October 31, Introduction
 2012 Water Management Plan Seasonal Update October 31, 2012 1. Introduction The annual Water Management Plan (WMP) is developed prior to the implementation of operational measures identified in the BiOp.
2013 Snake River Fall Chinook Salmon Spawning Summary 2,667 2, ,391
 2013 Snake River Fall Chinook Salmon Spawning Summary by Bill Arnsberg, Nez Perce Tribe Phil Groves, Idaho Power Company Frank Mullins, U.S. Fish and Wildlife Service Debbie Milks, Washington Department
HyMet Company. Streamflow and Energy Generation Forecasting Model Columbia River Basin
 HyMet Company Streamflow and Energy Generation Forecasting Model Columbia River Basin HyMet Inc. Courthouse Square 19001 Vashon Hwy SW Suite 201 Vashon Island, WA 98070 Phone: 206-463-1610 Columbia River
 Water Supply Forecast - THE DALLES http://www.nwrfc.noaa.gov/water_supply/ws_forecasts.php?id=tdao3 Page 1 of 1 3/7/2013 Close Archive Data/Normals Rankings Adjustments Verification Verify All Years Help
The Dalles Dam Fishway Status Report
 The Dalles Dam Fishway Status Report 5/14/2016 Inspection Period: 05/08-05/14/2016 THE DALLES DAM The Dalles Project-Fisheries P.O. Box 564 The Dalles, OR 97058-9998 Phone: 541-506-3800 Exit differential
Kootenai Basin Water Supply Update and Sturgeon Flow Augmentation Kootenai Valley Resource Initiative
 Kootenai Basin Water Supply Update and Sturgeon Flow Augmentation Kootenai Valley Resource Initiative Greg Hoffman Fishery Biologist / Kootenai River Basin Flood Engineer Libby Dam 15 May 2017 US Army
Winter Climate Forecast
 Winter 2018-2019 Climate Forecast 26 th Winter Weather Meeting, OMSI and Oregon AMS, Portland Kyle Dittmer Hydrologist-Meteorologist Columbia River Inter-Tribal Fish Commission Portland, Oregon Professor
Winter Climate Forecast
 Winter 2017-2018 Climate Forecast 25 th Winter Weather Meeting, OMSI and Oregon AMS, Portland Kyle Dittmer Hydrologist-Meteorologist Columbia River Inter-Tribal Fish Commission Portland, Oregon Professor
Oregon Water Conditions Report April 17, 2017
 Oregon Water Conditions Report April 17, 2017 Mountain snowpack continues to maintain significant levels for mid-april. By late March, statewide snowpack had declined to 118 percent of normal after starting
Modeling of peak inflow dates for a snowmelt dominated basin Evan Heisman. CVEN 6833: Advanced Data Analysis Fall 2012 Prof. Balaji Rajagopalan
 Modeling of peak inflow dates for a snowmelt dominated basin Evan Heisman CVEN 6833: Advanced Data Analysis Fall 2012 Prof. Balaji Rajagopalan The Dworshak reservoir, a project operated by the Army Corps
PRELIMINARY DRAFT FOR DISCUSSION PURPOSES
 Memorandum To: David Thompson From: John Haapala CC: Dan McDonald Bob Montgomery Date: February 24, 2003 File #: 1003551 Re: Lake Wenatchee Historic Water Levels, Operation Model, and Flood Operation This
APR-SEP. Forecast Are in KAF % Average 10 % 30 Year. Forecast Period
 Water Supply Forecast - THE DALLES file://v:\nwrfc_forecast\2013\tdao3\04-05.html Page 1 of 1 4/8/2013 Header for Water Supply Information Page Close Archive Data/Normals Rankings Adjustments Verification
Oregon Water Conditions Report May 1, 2017
 Oregon Water Conditions Report May 1, 2017 Mountain snowpack in the higher elevations has continued to increase over the last two weeks. Statewide, most low and mid elevation snow has melted so the basin
Prepared by: W. Nicholas Beer Susannah Iltis Chris Van Holmes James J. Anderson
 Evaluation of the 22 s of the Run-Timing of Wild Migrant Yearling Chinook and Water Quality at Multiple Locations on the Snake and Columbia Rivers using CRiSP/RealTime Prepared by: W. Nicholas Beer Susannah
II. HYDROMETEOROLOGY. OBSERVATIONS: Weather Snowpack SWSI Streamflow Flood Events FORECASTS: Runoff Volume Long Range Peaks Daily Streamflows
 II. HYDROMETEOROLOGY OBSERVATIONS: Weather Snowpack SWSI Streamflow Flood Events FORECASTS: Runoff Volume Long Range Peaks Daily Streamflows A. OBSERVATIONS With the Pacific Northwest=s highly diverse
Great Lakes Update. Volume 194: 2015 Annual Summary
 Great Lakes Update Volume 194: 2015 Annual Summary Background The U.S. Army Corps of Engineers (USACE) tracks and forecasts the water levels of each of the Great Lakes. This report summarizes the hydrologic
Great Lakes Update. Volume 188: 2012 Annual Summary
 Great Lakes Update Volume 188: 2012 Annual Summary Background The U.S. Army Corps of Engineers (USACE) tracks the water levels of each of the Great Lakes. This report highlights hydrologic conditions of
Folsom Dam Water Control Manual Update Joint Federal Project, Folsom Dam
 Folsom Dam Water Control Manual Update Joint Federal Project, Folsom Dam Public Workshop May 25, 2016 Sacramento Library Galleria 828 I Street, Sacramento, CA US Army Corps of Engineers BUILDING STRONG
National Weather Service. Harold H. Opitz Hydrologist in Charge
 National Weather Service Harold H. Opitz Hydrologist in Charge Goals Organization Role of the River Forecast Center Describe Forecast System & Tools Other Details NWS River Forecast Centers Northwest River
Great Lakes Update. Volume 199: 2017 Annual Summary. Background
 Great Lakes Update Volume 199: 2017 Annual Summary Background The U.S. Army Corps of Engineers (USACE) tracks and forecasts the water levels of each of the Great Lakes. This report is primarily focused
Great Lakes Update. Great Lakes Winter and Spring Summary January June Vol. 187 Great Lakes Update August 2012
 Great Lakes Update Great Lakes Winter and Spring Summary January June 2012 The US Army Corps of Engineers (USACE) Detroit District monitors hydraulic and hydrologic conditions of the Great Lakes. This
Missouri River Basin Water Management
 Missouri River Basin Water Management US Army Corps of Engineers Missouri River Navigator s Meeting February 12, 2014 Bill Doan, P.E. Missouri River Basin Water Management US Army Corps of Engineers BUILDING
Total Dissolved Gas submodel parameter calibration for use with CRiSP
 Total Dissolved Gas submodel parameter calibration for use with CRiSP 7/10/2003 3:08 PM W. Nicholas Beer Columbia Basin Research Bo 358218 School of Aquatic and Fishery Sciences University of Washington
3.0 TECHNICAL FEASIBILITY
 3.0 TECHNICAL FEASIBILITY 3.1 INTRODUCTION To enable seasonal storage and release of water from Lake Wenatchee, an impoundment structure would need to be constructed on the lake outlet channel. The structure
1. Review/Approve Agenda and Minutes (B. Klatte)
") AGENDA Fish Passage O&M Coordination (FPOM) Team NOAA Fisheries Office 1201 NE Lloyd Blvd (Lloyd Center MAX stop) St. Helens Room (10 TH Floor) February 14, 2008 (900-1200) Call in number- 503-808-5199
AGENDA Fish Passage O&M Coordination (FPOM) Team NOAA Fisheries Office 1201 NE Lloyd Blvd (Lloyd Center MAX stop) St. Helens Room (10 TH Floor) February 14, 2008 (900-1200) Call in number- 503-808-5199
Albeni Falls Operations Meeting 2015
 Albeni Falls Operations Meeting 2015 Katherine Rowden NWS Joel Fenolio Corps of Engineers Agenda Introductions Drought-Weather Conditions Free flow operations Review of Clarified Operations Albeni Falls
Missouri River Basin Water Management Monthly Update
 Missouri River Basin Water Management Monthly Update Participating Agencies 255 255 255 237 237 237 0 0 0 217 217 217 163 163 163 200 200 200 131 132 122 239 65 53 80 119 27 National Oceanic and Atmospheric
Missouri River Basin Water Management Monthly Update
 Missouri River Basin Water Management Monthly Update Participating Agencies 255 255 255 237 237 237 0 0 0 217 217 217 163 163 163 200 200 200 131 132 122 239 65 53 80 119 27 National Oceanic and Atmospheric
Missouri River Basin Water Management Monthly Update
 Missouri River Basin Water Management Monthly Update Participating Agencies 255 255 255 237 237 237 0 0 0 217 217 217 163 163 163 200 200 200 131 132 122 239 65 53 80 119 27 National Oceanic and Atmospheric
Blue Mountain Province
 Rolling Provincial Review: Implementation 2001-2003 Province 23 Columbia Basin Fish & Wildlife Authority Province FY 2001-2003 Spending Summaries NPCC Recommendations and BPA Spending by Project Category,
Water Outlook for Recap of 2017 winter & runoff season and amount needed in 2018 for adequate irrigation supplies. May 19, 2017 Teton Valley
 Water Outlook for 2018 & More Recap of 2017 winter & runoff season and amount needed in 2018 for adequate irrigation supplies Ron Abramovich Water Supply Specialist May 19, 2017 Teton Valley We ll summarize
Flood Risk Assessment
 Flood Risk Assessment February 14, 2008 Larry Schick Army Corps of Engineers Seattle District Meteorologist General Assessment As promised, La Nina caused an active winter with above to much above normal
Great Lakes Update. Volume 193: 2015 January through June Summary. Vol. 193 Great Lakes Update August 2015
 Great Lakes Update Volume 193: 2015 January through June Summary The U.S. Army Corps of Engineers (USACE) monitors the water levels of each of the Great Lakes. This report provides a summary of the Great
Upper Missouri River Basin February 2018 Calendar Year Runoff Forecast February 6, 2018
 Upper Missouri River Basin February 2018 Calendar Year Runoff Forecast February 6, 2018 Calendar Year Runoff Forecast Explanation and Purpose of Forecast U.S. Army Corps of Engineers, Northwestern Division
Columbia River Basin Steelhead Kelt Reconditioning Physiology Research
 Columbia River Basin Steelhead Kelt Reconditioning Physiology Research Andy Pierce 1, 2, Doug Hatch 2, Dave Fast 3, Scott Everett 4, Matt Abrahamse 3, Laura Jenkins 1, Neil Graham 2, Lea Medeiros 1, Jim
Upper Missouri River Basin January 2018 Calendar Year Runoff Forecast January 3, 2018
 Calendar Year Runoff Forecast Upper Missouri River Basin January 2018 Calendar Year Runoff Forecast January 3, 2018 Explanation and Purpose of Forecast U.S. Army Corps of Engineers, Northwestern Division
Final Report for the Green Valley Creek Winter Refugia Enhancement Project Monitoring December 2016
 Final Report for the Green Valley Creek Winter Refugia Enhancement Project Monitoring December 2016 Prepared by: Mariska Obedzinski and Sarah Nossaman University of California Cooperative Extension & California
Water Temperature Monitoring of the Klamath River Mainstem
 Water Temperature Monitoring of the Klamath River Mainstem Progress Report #3 Prepared by Robert Rohde and Leaf Hillman with assistance provided by Susan Smith and William Tripp Karuk Tribe of California
2016 FPC Adult Ladder Hourly Water Temperature Graph and Query Metadata
 2016 FPC Adult Ladder Hourly Water Graph and Query Metadata Query Description This graph compares the hourly ladder water temperatures for the entrance monitor, exit monitor and monitors located midway
The following information is provided for your use in describing climate and water supply conditions in the West as of April 1, 2003.
 Natural Resources Conservation Service National Water and Climate Center 101 SW Main Street, Suite 1600 Portland, OR 97204-3224 Date: April 8, 2003 Subject: April 1, 2003 Western Snowpack Conditions and
Missouri River Basin Water Management Monthly Update
 Missouri River Basin Water Management Monthly Update Participating Agencies 255 255 255 237 237 237 0 0 0 217 217 217 163 163 163 200 200 200 131 132 122 239 65 53 80 119 27 National Oceanic and Atmospheric
Evapo-transpiration Losses Produced by Irrigation in the Snake River Basin, Idaho
 Nov 7, 2007 DRAFT Evapo-transpiration Losses Produced by Irrigation in the Snake River Basin, Idaho Wendell Tangborn and Birbal Rana HyMet Inc. Vashon Island, WA Abstract An estimated 8 MAF (million acre-feet)
Northwest Outlook October 2016
 Northwest Outlook October 2016 Rainfall Opportunities and Challenges Rainfall over the month of September presented some challenges for the fall harvest while other producers benefitted. Figure 1a shows
Summary of the 2017 Spring Flood
 Ottawa River Regulation Planning Board Commission de planification de la régularisation de la rivière des Outaouais The main cause of the exceptional 2017 spring flooding can be described easily in just
Jackson County 2013 Weather Data
 Jackson County 2013 Weather Data 61 Years of Weather Data Recorded at the UF/IFAS Marianna North Florida Research and Education Center Doug Mayo Jackson County Extension Director 1952-2008 Rainfall Data
Great Lakes Update. Volume 191: 2014 January through June Summary. Vol. 191 Great Lakes Update August 2014
 Great Lakes Update Volume 191: 2014 January through June Summary The U.S. Army Corps of Engineers (USACE) monitors the water levels of each of the Great Lakes. This report provides a summary of the Great
The Dalles Dam Fishway Status Report
 The Dalles Dam Fishway Status Report 3/19/2016 Inspection Period: 03/13/2016-03/19/2016 THE DALLES DAM The Dalles Project-Fisheries P.O. Box 564 The Dalles, OR 97058-9998 Phone: 541-506-3800 The Dalles
Upper Missouri River Basin December 2017 Calendar Year Runoff Forecast December 5, 2017
 Upper Missouri River Basin December 2017 Calendar Year Runoff Forecast December 5, 2017 Calendar Year Runoff Forecast Explanation and Purpose of Forecast U.S. Army Corps of Engineers, Northwestern Division
2017 Technical Revision to the Marine Survival Forecast of the OCN Coho Work Group Harvest Matrix Erik Suring Oregon Department of Fish and Wildlife
 2017 Technical Revision to the Marine Survival Forecast of the OCN Coho Work Group Harvest Matrix Erik Suring Oregon Department of Fish and Wildlife Agenda Item D.2 Attachment 1 November 2017 Introduction
Great Lakes Update. Background
 Great Lakes Update Background The U.S. Army Corps of Engineers, Detroit District, monitors and forecasts the water levels of the Great Lakes. This report summarizes the hydrologic conditions of the Great
2016 ANNUAL FISHWAY STATUS REPORT THE DALLES DAM. Date: Jan, 2017 From: Bob Cordie, Jeff Randall and Gabe Forrester
 2016 ANNUAL FISHWAY STATUS REPORT THE DALLES DAM Date: Jan, 2017 From: Bob Cordie, Jeff Randall and Gabe Forrester 1 INTRODUCTION The Dalles Dam has specific requirements for Columbia River fish passage
Outage Coordination and Business Practices
 Outage Coordination and Business Practices 1 2007 Objectives What drove the need for developing a planning/coordination process. Why outage planning/coordination is crucial and important. Determining what
CENWP-OD 09 February 2017
 CENWP-OD 09 February 2017 MEMORANDUM FOR THE RECORD Subject: Final minutes for the 09 February 2017 FPOM meeting. The meeting was held at the CRITFC offices in Portland, OR. In attendance: Last First Agency
9. PROBABLE MAXIMUM PRECIPITATION AND PROBABLE MAXIMUM FLOOD
 9. PROBABLE MAXIMUM PRECIPITATION AND PROBABLE MAXIMUM FLOOD 9.1. Introduction Due to the size of Watana Dam and the economic importance of the Project to the Railbelt, the Probable Maximum Flood (PMF)
Technical Memorandum. City of Salem, Stormwater Management Design Standards. Project No:
 Technical Memorandum 6500 SW Macadam Avenue, Suite 200 Portland, Oregon, 97239 Tel: 503-244-7005 Fax: 503-244-9095 Prepared for: Project Title: City of Salem, Oregon City of Salem, Stormwater Management
January 25, Summary
 January 25, 2013 Summary Precipitation since the December 17, 2012, Drought Update has been slightly below average in parts of central and northern Illinois and above average in southern Illinois. Soil
MINNESOTA POWER ST LOUIS RIVER PROJECT FERC 2360 ISLAND LAKE RESERVOIR TECHNICAL COMMITTEE MEETING SUMMARY
 5/14/18 Spring Refill Meeting held via email Late spring snowmelt resulted in late start to refill. Spring runoff was not enhanced by rain on snow on frozen ground. Near record dry spring. Refill will
Doug Kluck NOAA Kansas City, MO National Center for Environmental Information (NCEI) National Integrated Drought Information System (NIDIS)
 National Integrated Drought Information System (NIDIS)") National Integrated Drought Information System (NIDIS) for the Missouri River Basin Drought Early Warning Information System (DEWS) & Runoff Trends in the Missouri Basin & Latest Flood Outlook Doug Kluck
National Integrated Drought Information System (NIDIS) for the Missouri River Basin Drought Early Warning Information System (DEWS) & Runoff Trends in the Missouri Basin & Latest Flood Outlook Doug Kluck
Illinois Drought Update, December 1, 2005 DROUGHT RESPONSE TASK FORCE Illinois State Water Survey, Department of Natural Resources
 Illinois Drought Update, December 1, 2005 DROUGHT RESPONSE TASK FORCE Illinois State Water Survey, Department of Natural Resources For more drought information please go to http://www.sws.uiuc.edu/. SUMMARY.
March 1, 2003 Western Snowpack Conditions and Water Supply Forecasts
 Natural Resources Conservation Service National Water and Climate Center 101 SW Main Street, Suite 1600 Portland, OR 97204-3224 Date: March 17, 2003 Subject: March 1, 2003 Western Snowpack Conditions and
FORECAST-BASED OPERATIONS AT FOLSOM DAM AND LAKE
 FORECAST-BASED OPERATIONS AT FOLSOM DAM AND LAKE 255 237 237 237 217 217 217 200 200 200 0 163 131 Bridging the Gap163Conference 255 0 132 255 0 163 122 The Dana on Mission Bay San Diego, CA January 28,
Update on Seasonal Conditions & Summer Weather Outlook
 Update on Seasonal Conditions & Summer Weather Outlook Andy Bryant National Weather Service Portland, Oregon June 6, 2018 Overview Quick review of winter and spring conditions Seasonal water supply forecasts
Water Supply Conditions and Outlook October 1, 2018
 Water Supply Conditions and Outlook October 1, 2018 Flow Forecasting & Operations Planning Water Security Agency Overview Water supply conditions across Saskatchewan remain near normal, with most reservoirs
Folsom Dam Water Control Manual Update Joint Federal Project, Folsom Dam
 Folsom Dam Water Control Manual Update Joint Federal Project, Folsom Dam Public Workshop May 28, 2015 Library Galleria 828 I Street, Sacramento, CA US Army Corps of Engineers BUILDING STRONG WELCOME &
Lake Winnebago Regulation Meeting
 Lake Winnebago Regulation Meeting USACE Detroit District October 9, 2014 US Army Corps of Engineers Agenda Basin Overview Major Stakeholders Maintenance a and Repair Work Weather Conditions 2013-20142014
Current Climate Trends and Implications
 Current Climate Trends and Implications Dr. Mark Seeley Professor emeritus Department of Soil, Water, and Climate University of Minnesota St Paul, MN 55108 Crop Insurance Conference September 12, 2018
January 2011 Calendar Year Runoff Forecast
 January 2011 Calendar Year Runoff Forecast 2010 Runoff Year Calendar Year 2010 was the third highest year of runoff in the Missouri River Basin above Sioux City with 38.8 MAF, behind 1978 and 1997 which
Missouri River Flood Task Force River Management Working Group Improving Accuracy of Runoff Forecasts
 Missouri River Flood Task Force River Management Working Group Improving Accuracy of Runoff Forecasts Kevin Grode, P.E. Reservoir Regulation Team Lead Missouri River Basin Water Management Northwestern
Flow-net Relationships in the Forebay of John Day Dam Annual Report 1982
 Flow-net Relationships in the Forebay of John Day Dam Annual Report 1982 DOE/BP-0011 April 1983 This Document should be cited as follows: Giorgi, A., ''Flow-net Relationships in the Forebay of John Day