HYDROGEOCHEMICAL CHARACTERIZATION OF ACID-MINE DRAINAGE, OHIO VALLEY MUSHROOM FARM SITE IN NORTH LIMA, OHIO. A Thesis.
|
|
|
- Dwain Hicks
- 5 years ago
- Views:
Transcription
1 HYDROGEOCHEMICAL CHARACTERIZATION OF ACID-MINE DRAINAGE, OHIO VALLEY MUSHROOM FARM SITE IN NORTH LIMA, OHIO A Thesis Presented to The Graduate Faculty of The University of Akron In Partial Fulfillment of the Requirements for the Degree Master of Science Theresa L. McQuade December, 2012
2
3 ABSTRACT Eastern Ohio is home to over 1,000 abandoned underground mines (AUM), mostly from coal production, which began more than 200 years ago. The Mushroom Farm site, located in North Lima, Ohio is plagued with acid mine drainage (AMD) resulting from surface mining conducted in the 1980 s and an AUM from the late 1800 s. My principal objective was to identify the source of AMD at the Musrhoom Farm site and determine if mine type dictates the geochemistry of AMD produced. Surface and groundwater samples, along with hydrologic data, were collected seasonally from to determine the current direction of groundwater flow. The results revealed groundwater recharge occurring in the local topographic high spot, with flow generally following a radial pattern away from it. Temperature, ph, dissolved oxygen (DO), and conductivity were collected in the field. The ph ranged from 2.65 to 8.36, with most readings between 3 and 6. Common ion concentrations were determined using ion chromatography, colorimetric assays, inductively coupled plasma (ICP) spectrometry, and atomic absorption spectrometry (AA). Geochemical analysis revealed that AMD is being generated in the northern portion where spoil was homogenized with overburden after surface mining, and also in the southern portion where the AUM exists. Hydrologic data and specific yield (S y ) calculations show that where as there is a smaller volume of AMD being generated in the southern portion (10 million liters versus 50 million liters at a given time), much higher concentrations of iron and sulfate result here (~5,000mg/L versus ~2000 mg/l). Elevated iron and sulfate, along with low ph values are indicative of AMD. Using the aqueous geochemical modeling program, Web-Phreeq, I identified a iii
4 geochemical signature based on iron, sulfate, aluminum, and calcium speciation for the AMD resulting from the AUM. The AMD created from surface spoil proved to be too heterogeneous to establish speciation trends. Historical hydrologic data from well logs and aerial photo analysis (dating back to 1959) revealed that anthropogenic changes to the landscape result in an altered hydrogeology. The AUM at the Mushroom Farm site did not produce any observable AMD until surface mining had been conducted; that process can greatly alter permeability, groundwater recharge, and overburden thickness and composition. iv
5 ACKNOWLEDGEMENTS First I need to thank my advisor, Dr. John Senko. I started at Akron as an undergraduate in his lab and quickly found myself in awe of the research that was being done in our department. I found my way back to Dr. Senko for my graduate career and was able to combine my research interests at one of his project sites; the Mushroom Farm. I am so grateful for Dr. Senko s knowledge and guidance through this process. I would also like to thank Dr. John Szabo and Dr. Ira Sasowsky for being a part of my thesis committee. Each member of my committee has helped shape me as a student, a researcher, and a geologist. Thank you for teaching me to have confidence in my work and in myself, for the humor, the field work, the trips, the friendship, and for believing in me. I d also like to thank the Ohio Department of Natural Resources (ODNR) for their interest in the Mushroom Farm. Cheryl Socotch and Tammy Richards, thank you for sampling with me and for all the data and help you ve provided. My project also wouldn t be possible without Mr. John Wilson, the Mushroom Farm landowner. I owe many thanks to the rest of the Geology faculty at the University of Akron, especially to Elaine Butcher and Tom Quick. Elaine, I would not have been able to finish my thesis without you, let alone register for a class. Thank you for answering every silly question I ve had and fixing the copier every time I broke it. Tom, thank you for your endless supply of knowledge, patience, and expertise. You made my project possible by giving me the tools and showing me how to use them all. To Dr. Peck, a big thanks for your stratigraphy expertise and for the laughs at field camp. For every person I persuaded v
6 to go in the field with me Jim Becker, Kyle Blauvelt, Brett Egresi, Zach Haake, Kimmaree Horvath thank you for carrying heavy equipment, braving the very cold and very hot weather, and chancing it with the ticks. And to all my fellow geology friends who have come and gone at Akron over the years, thanks for the friendship, support, coffee breaks, craziness, and for helping me get through it all in one piece. vi
7 TABLE OF CONTENTS Page LIST OF FIGURES... viii LIST OF TABLES...x CHAPTER I. INTRODUCTION...1 Overview...1 Geologic History of the Appalachian Basin...2 Summary of Geologic History...4 Mining Coal...5 Acid Mine Drainage...6 AMD Production in the Subsurface...6 AMD at the Surface...8 Site Description...9 Ohio s Interest in the Mushroom Farm Site...10 Hypothesis...17 Previous Studies...17 Summing up the Mushroom Farm Project...19 II. METHODS...20 Sampling Campaign...20 Water Sample Collection and Chemical Analyses...20 Hydrologic Analyses...23 Aerial Photography Analysis...24 vii
8 III. RESULTS AND PRELIMINARY INTERPRETATIONS...25 Current Conditions ( data)...25 Northern Section (BHs 5, 6, 7, 8)...25 Southeastern Section (BHs 2, 3, 4, and MW-1)...33 Southwestern Section (BHs 1, 9, 10, 11, and surface samples)...44 Underground Mine Void (BH11 and MW-1)...64 Overview of Current Groundwater Hydrology...66 WebPHREEQ Results...69 Speciation Descriptions...69 Speciation Analysis...72 Past Conditions...77 IV. DISCUSSION...82 Geochemical Signatures of Groundwater from Mine Void and Surface Spoil...82 Tracking the Plume of Acid Mine Drainage...85 Specific Yield: the volume of groundwater involved...87 Contaminant Transport: the mass of iron and sulfate...88 Lifespan of Acid Mine Drainage...96 AMD Development on the Surface...97 The Cause of AMD at the Mushroom Farm...97 Mushroom Farm AMD and Local Drinking Water Supply...99 V. CONCLUSIONS REFERENCES APPENDICES APPENDIX A. WELL LOGS, ABANDONED MINE DATA APPENDIX B. AERIAL PHOTOGRAPHY APPENDIX C. GEOCHEMICAL DATA FOR SAMPLE LOCATIONS viii
9 LIST OF FIGURES Figure Page 1 Map of Ohio with county borders, highlighting Mahoning county Aerial photograph of the Mushroom Farm site, North Lima, OH Stratigraphic column of Allegheny Group (Middle Pennsylvanian) pointing out primary coal seams mined at the Mushroom Farm site (USGS, 2010) Aerial photograph showing a red dot in the location of the sealed entrance to the abandoned mine void Map showing location of observation wells installed by ODNR in 2002 and MW-1, which was drilled separately as a water supply well in 1978 (Base map Google Earth, 2012) Map of observation wells with enlarged photo showing surface sample locations (Base map Google Earth, 2012) Map showing surface topography of Mushroom Farm site along with groundwater and surface water sampling locations Map of surface topography showing sampling locations separated into sections based on flow regime Northern Section observation wells showing lithology, and static water levels at appropriate elevations listed South to North Detail map of Northern Section observation wells Aerial photograph with red circle around seep near BH Detail map of Southeastern Section observation wells, MW-1 (a sealed water supply well), and associated AMD seep in relation to Mushroom Farm site (OGRIP, 2012) Southeastern Section observation wells showing lithology, and static water levels at appropriate elevations listed South to North (A-F) Mapview of Southeastern Section observation wells with static water level (feet above sea level) when available and associated flow lines. (G) Southeastern Section static water level over time...36 ix
10 15 Aerial and ground-based photographs showing AMD seep along railroad, highlighted in red box (A-E) Mapview of Southeastern Section observation wells with SO 2-4 concentrations (mg/l) when available and flow lines. (F) Southeastern Section SO 2-4 concentrations over time (A-E) Mapview of Southeastern Section observation wells with temperature ( C) when available and flow lines. (F) Southeastern Section temperature ( C) over time (A-E) Mapview of Southeastern Section observation wells with DO values (mg/l) when available and flow lines. (F) Southeastern Section DO values over time (A-E) Mapview of Southeastern Section observation wells with ph values when available and flow lines. (F) Southeastern Section ph values over time Graphs showing elemental concentrations (mg/l) over time of (A) Manganese, (B) Magnesium, and (C) Aluminum (A-E) Mapview of Southeastern Section observation wells with Fe 2+ concentrations (mg/l) when available and flow lines. (F) Southeastern Section ferrous iron (Fe 2+ ) concentrations (mg/l) over time (A-D) Mapview of Southeastern Section observation wells with Fe 3+ concentrations (mg/l) when available and flow lines. (E) Southeastern Section ferric iron (Fe 3+ ) concentrations (mg/l) over time (A-D) Mapview of Southeastern Section observation wells with Fe (tot) concentrations (mg/l) when available and flow lines. (E) Southeastern Section total iron concentrations (mg/l) over time Detail map of Southwestern Section observation wells and surface sample locations in relation to Mushroom Farm Site (OGRIP, 2012) Southwestern Section observation wells with static water level (feet above sea level) when available and associated flow lines. (G) Southeastern Section static water level over time Photographs of stream and mine entrance Photographs showing water in vicinity of the house Photographs showing sheetflow in vicinity of house Photographs showing wetland area, circled in red (A-F) Mapview of Southwestern Section observation wells with static water level (feet) when available and associated flow lines. (G) Southeastern Section observation well static water level over time Photograph of BH11 well casing flowing during a sampling event in x
11 32 (A) Mapview of Southwestern Section with sampling locations labeled (Colors of map reflect surface elevations, refer to Figure 7). (B) Graph showing Southwestern Section seasonal ph values from South to North displaying overall increasing trend to North Graph showing Southwestern Section seasonal elemental concentrations listed from South to North of (A) total iron, (B) sulfate, (C) manganese, and (D) magnesium (A) Mapview of Southwestern Section with sampling locations (Colors of map reflect surface elevations, refer to Figure 7). (B) Graph showing Southwestern Section seasonal dissolved oxygen (DO) values from South to North Graph showing Southwestern Section seasonal elemental concentrations listed from South to North showing seasonal concentrations of ferrous and ferric iron (Panels A and B respectively), and (C) seasonal ph values Underground mine map and cross section Map showing surface topography of the Mushroom Farm site split into East and West polygons, shows sampling locations along with height of water column rounded to the nearest foot found above bedrock in each well Map depicting the Mushroom Farm site inundated by water (black) up to 1115 feet above sea level Ferrous iron speciation in Summer 2011 surface and groundwater samples, as determined by Web-Phreeq: Aqueous Geochemical Modeling (Saini-Eidukat, and Yahin, 1999) Ferric iron speciation in Summer 2011 surface and groundwater samples, as determined by Web-Phreeq: Aqueous Geochemical Modeling (Saini-Eidukat, and Yahin, 1999) Aluminum speciation in Summer 2011 surface and groundwater samples, as determined by Web-Phreeq: Aqueous Geochemical Modeling (Saini-Eidukat, and Yahin, 1999) Calcium speciation in Summer 2011 surface and groundwater samples, as determined by Web-Phreeq: Aqueous Geochemical Modeling (Saini-Eidukat, and Yahin, 1999) Aerial photograph showing surface stream channel impacted by AMD, which was sampled during Aerial photograph showing several observation wells installed by ODNR and associated AMD emerging at surface Map highlighting the area where spoil is found, shows sampling locations along with height of water column rounded to the nearest foot found above bedrock in each well (OGRIP, 2012)...91 xi
12 46 Map highlighting area unaffected by surface mining, shows sampling locations along with height of water column rounded to the nearest foot found above bedrock in each well (OGRIP, 2012) Graph of individual and average seasonal total iron concentrations, showing general decrease to the north Graph of individual and average seasonal sulfate concentrations, showing general decrease to the North Graph showing seasonal and average dissolved oxygen concentrations. BH11 holds some of the lowest values observed Figure 50. This is a simple cross section of the Mushroom Farm house and the area to the northeast that was surface mined Aerial photograph of the Mushroom Farm site, (circled on right), with arrows following stream of AMD flowing west towards a homer that uses well water located at Blosser Road, North Lima, OH (circled on left) xii
13 LIST OF TABLES Table Page 1 Precipitation totals for each month sampling took place (NOAA, 2012) Summary of surface seep lifespan identified in historical aerial photography of the Mushroom Farm site (Refer to Appendix B for aerial photos) Summary of aerial photography analysis displaying a timeline of major events that changed the surface in some way as identified in historical aerial photography of the site (Refer to Appendix B for aerial photos)...78 xiii
14 CHAPTER I INTRODUCTION Overview The Surface Mining Control and Reclamation Act (SMCRA) of 1977 was established to protect the environment against negative impacts of surface coal mining operations. A major concern associated with coal mining is the oxidation of metal-sulfide minerals, such as pyrite, associated with coal and adjacent rock formations (Blowes et al., 2003). Pyrite is an iron sulfide mineral that oxidizes in the presence of atmospheric oxygen. Pyrite oxidation is the principal cause of acid-mine drainage (AMD) (Blowes et al., 2003). AMD is characterized by a low ph and potentially high concentrations of iron, sulfate, manganese, calcium, aluminum, magnesium and several other elements (Blowes at al., 2003). This project serves as an evaluation of the geochemical and hydrologic properties of AMD at a site where both surficial and underground coal mining occurred, to detect any differences resulting from source location. The goal of this project is to determine if the AMD at the Ohio Valley Mushroom Farm site can be characterized as drainage coming from the underground mine void or the surface mine spoil left on the property. 1
15 Geologic History of the Appalachian Basin The Appalachian Basin is an important coal region that produces more than a third of US coal (US EIA, 2009). The geologic history of the Appalachian Basin in Ohio dates back to over 480 million years ago. At that time, what would later be known as Ohio was located along a passive plate margin over the equator (USGS, 2004). The tropical environment lent itself to shallow seas, which promote deposition of carbonate rock and sediment. During regression events the land was dominated by erosional processes and sedimentary deposits (USGS, 2004). This can be observed in Ohio Ordovician stratigraphy where limestone and calcareous shale dominate (Brant and DeLong, 1960). Through the Middle Ordovician Period plates shifted, and the Taconic Orogeny brought forth the early Appalachians. During this mountain-building event the oceanic plate, Iapetus, converged with the North American plate. Iapetus subducted beneath the North American craton, consequently creating volcanoes, thrust faults, and folding of the sedimentary and igneous layers (USGS, 2004). These folds generally dip in an eastward direction (Pepper, 1934). By the end of the Ordovician Period the early Appalachians were being eroded down and shallow seas were still depositing limestone (that has since undergone dolotimization) in what is now called the Appalachian Basin (Brant and DeLong, 1960). The Acadian Orogeny was the next to leave its mark on the Appalachians in the Late Silurian Period. This orogeny is characterized as a series of events and began the closing of the Iapetus Ocean. It lasted 75 million years, ending ~325 mya. The main event was the collision of the North American plate and the Avalonia Island arc; closing the western portion of the Iapetus Ocean. Volcanism and uplift occurred at the convergent boundary. A large consequence was the formation of the Catskill Delta, a large inland sedimentary deposit that can be observed today as folded sandstones in Pennsylvania and New York. 2
16 Ohio s Silurian record shows some minor shale and sandstone units, followed by massive dolomite beds, in the Appalachian Basin. This suggests a small period of regression, lending to sedimentary deposits from nearby uplifted areas, followed by transgression and shallow seas again dominating the area depositing fine muds (Boggs, 2006). With the Iapetus Ocean still narrowing, Gondwanaland was next to converge with the North American craton. This is known as the Alleghanian Orogeny, which formed the supercontinent Pangea (Hatcher, 2010). After millions of years the violent volcanism that plagued many of Pangea s convergent seams halted. Still, more folding and faulting created uplift in the center of the supercontinent. The early Appalachian mountain chain likely reached peak elevations similar to that of the Alps. The Alleghenian Orogeny lasted until ~250 mya. During the Devonian Period and lasting until the end of the Paleozoic Era there began to be a change in deposition from strictly limestone to more terriginous sediments; including shale, sandstone and conglomerate. Eventually transgression and regression events were alternating in such a way to produce cyclothems, or coal-to-coal interval deposits (Weller, 1931). A cyclothem in Ohio begins with coal at its base, followed by black fissile shale, marine deposited limestone or shale, massive gray shale, sandstone, sandy shale, nonmarine limestone and underclay (Brant and DeLong, 1960). These facies represent coastal to lagoonal depositional environments (USGS, 2004). Although not all recorded coal seams are economically minable, there are 58 named coal beds in the Pennsylvanian geologic section of Ohio and 9 in the Permian (Brant and DeLong, 1960). Bedrock outcropping or near the surface in eastern and southeastern Ohio, namely Mahoning County, consists of Pennsylvanian and Mississippian strata. The next major event in geologic history that left a mark on the Appalachian Basin was the most recent ice age (20,000-11,000 years ago). Ice sheets began to advance into 3
17 Mahoning County during the Pleistocene epoch (Totten and White, 1987). Ice carved over the landscape, modifying what was already deposited by previous glaciations. In general, topography of Mahoning County is smoother now than before the last glaciation, with infilled stream valleys and hilltops eroded by ice (Totten and White, 1987). The topographic features of Mahoning County owe their existence to periods of glaciation. These include ground and end moraines, which cover most of the County. Ground moraines are generally smooth and end moraines are hummocky (Totten and White, 1987). Other topographic features in Mahoning County include glaciofluvial landforms; such as kames, kame terraces and valley trains. The smoothed morphology of Mahoning County is mostly covered by a thin veneer of younger till overlying older glacial deposits and bedrock (Totten and White, 1987). Summary of Geologic History The organic material, terriginous sediments, and limestone deposited during the late Paleozoic Era are preserved in the coal-bearing cyclothems which are mined for coal today in Ohio, Pennsylvania, Kentucky, Maryland, and West Virginia. The Upper Freeport coal bed, Pennsylvanian in age, is the 14th most productive coal bed in the United States and can be found across southeastern and eastern Ohio. (EIA, 2009). 4
18 Mining Coal Over 90% of coal produced in the United States is used to generate electricity (US EIA, 2011). The Appalachian Coal Region is a top producer in the United States and is responsible for more than a third of the nation s coal production (US EIA, 2009). Although mining coal may be necessary and financially viable, there are often negative environmental impacts associated with it. The two main methods of extracting coal are underground and surface mining. Underground mining, also known as deep mining, involves tunneling underground to extract coal, and removal of excess rock strata that encases the coal may be necessary (US EIA, 2006). Underground mining is thought to be less destructive than surface mining due to the reduction in the disturbance to the terrestrial surface. However subsidence may result, potentially affecting nearby structures. Surface mining involves the removal of overlying rock and soil, or overburden, to expose the coal seam underneath, followed by removal of the coal. The overburden becomes homogenized and is replaced once the removal of coal is accomplished on site (US EIA, 2006). Surface mining is currently the predominant method of extracting coal in the United States, and potentially the most harmful due to spoil or tailings left on site (US EPA, 2000). These post-mining landscapes are altered and set the scene for potential environmental problems. The iron sulfide minerals associated with coal mining can undergo oxidation by contact with atmospheric oxygen and water (Blowes et al., 2003). This often happens due to the presence of pyrite, found in spoil, and altered groundwater paths. 5
19 Acid Mine Drainage When land is altered by mining activities, chemical reactions between water and minerals will occur, and frequently have detrimental environmental effects on surrounding areas. Mining coal has been especially prevalent in the Appalachian coal region for the past 200 years and the consequence facing the region now is acid-mine drainage (AMD) as a result of poorly executed or no remediation on site. AMD is known to be the biggest environmental problem facing the United States mining industry today (US EPA, 2000). AMD Production in the Subsurface AMD production begins with the presence of iron sulfide minerals, usually pyrite (FeS 2 ), but also including pyrrhotite (Fe 1-x S, x=0 to 0.2), chalcopyrite (CuFeS 2 ), and sphalerite ((Zn, Fe)S). These are accessory minerals of coal and can be found adjacent to mine voids as well near or at the surface in spoils. These minerals may be oxidized by O 2 2- in groundwater to form sulfate (SO 4 ) and dissolved ferrous iron (Fe(II)) (Equation 1). 2-2FeS 2pyrite + 2H 2 O + 7O 2 2Fe SO 4 + 4H + (Equation 1) Pyrite oxidation is typically limited in subsurface environments due to limited oxygen availability, but introduction of aerated meteoric water that infiltrates mine voids may serve to replenish dissolved oxygen (Eby, 2004). The acid that is produced promotes dissolution and enhanced solubility of Fe(II), which leaches out of host rock or spoil (US EPA, 2000). Fe(II) is then oxidized by O 2 to form ferric iron (Fe(III)) (Equation 2). 4Fe 2+ + O 2 + 4H + 4Fe 3+ +2H 2 O (Equation 2) 6
20 A positive feedback loop begins to form. The oxidation of Fe(II) is the rate-limiting step; however the rate at which this process occurs may be increased by the presence of Fe(II)-oxidizing bacteria (Fe(II)OB) by five or six orders of magnitude (Lacey and Lawson, 1970). Microorganisms often facilitate many chemical reactions in the environment. Oxidation and reduction (redox) reactions mediated by microorganisms often lead to a change in solubility of participating minerals (Eby, 2004). Acidithiobacillusferrooxidans, an acidophilic and chemolithotrophic Fe(II)OB, is widely accepted as the most significant species to catalyze the oxidation of metal sulfides (Schrenk et al., 1998). A similar bacterium, Leptospirillumferrooxidans, is also recognized as an important biological mediator in AMD environments (Bruneel et al., 2006). A. ferrooxidans and L. ferrooxidans grow by oxidation of ferrous iron coupled to oxygen reduction. This biologically mediated reaction requires an aerobic environment and has been observed at ph as low as 0.7 (Schrenk et al., 1998). Concurrently, the sulfide moiety of pyrite undergoes abiotic oxidation in the presence of Fe(III) and water; producing more Fe(II), sulfate and protons (Equation 3). FeS 2pyrite +14Fe 3+ +8H 2 O 15Fe SO H + (Equation 3) This continues to lower the ph, which solubilizes Fe(II) and other minerals from the host rock (Eby, 2004). Metals such as aluminum, manganese, copper and lead are also generally present at high concentrations (Cravotta, 2008). This is due to acid leaching the metals from micas and feldspars present in minerals (US EPA, 2000). When associated with coal spoils, AMD results from insufficient calcareous strata, such as limestone or dolomite, mixed in the overburden to neutralize acid production (Blowes et al., 2003). Once the AMD reaches the terrestrial surface, the surrounding environment can change drastically. 7
21 AMD at the Surface When AMD reaches the terrestrial surface, it is often characterized by ph values as low as 2 and high concentrations of sulfate, calcium, sodium, and potassium (Blowes et al., 2003). The effluent may contain dissolved metals such as iron, manganese, and lead (US EPA, 2000). Dissolved ferric iron will precipitate oxyhydroxides observed in the form of rust colored mounds or sludge at the surface (Equation 4) (Sand, 1989). Fe 3+ +3H 2 O Fe(OH) 3 + 3H + (Equation 4) This precipitation also helps to reduce metal load in solution (Schrenk et al., 1998). If the effluent emerges directly into a stream or body of water then the AMD is neutralized by well-buffered natural waters (US EPA, 2000). This results in yellowboy, an iron oxide precipitate that results from the mixing of iron-rich AMD and oxygenated waters (PA-DEP, 1999). This reaction will only take place if enough oxygen is present in the water. Yellowboy may cover plant and animal life, deplete dissolved oxygen, and discolor water. The time frame in which AMD production takes place depends on several factors, including surrounding mineralogy, availability of water, and oxygen (US EPA, 2000). This means that the potential for AMD production in a given system may change over time with fluctuations in precipitation, surface drainage, and land usage. A location may have the mineralogical potential (i.e. abundant sulfide-containing phases) to produce harmful AMD. If it is too deep and anoxic or hydrologically confined by another geologic unit then AMD production may be minimal. If a site is already producing AMD, its ability to continue production depends on such factors as grain size, permeability, and availability of iron sulfide minerals (US EPA, 2000). Because of this, it may be difficult to determine how long a site will continue to produce AMD. In an undisturbed system, pyrite oxidation and AMD production may continue for thousands of years. A site that 8
22 was actively mined may only have several years of lag time between surface disturbance and first observation of AMD production (Kuipers et al., 2006). Site Description The site chosen for this study is the Ohio Valley Mushroom Farm, located in North Lima, Mahoning County, OH (40º56 09 N, 80º40 04 W) (Figure 1). Throughout this thesis US standard map units will be employed, as this is the system originally used.this area receives annual average precipitation of 3 feet and an average annual temperature of 48ºF. The Mushroom Farm has a history of surface and underground coal mining with minor remediation completed (Cheryl Socotch, personal communication). Currently, it is a site plagued with acid-mine drainage as a result (Figure 2). The primary coal seams mined at the Mushroom Farm include the Middle Kittanning (Mkt) No. 6 and the Upper Freeport No. 7 (Figure 3) (Cheryl Socotch, personal communications). Although areas directly adjacent to the east and west of the Mushroom Farm were extensively surface mined for the Lower Kittanning No. 5 (recognized for higher sulfur content), as well as No. 6 and 7. These members are Middle Pennsylvanian, of the Allegheny Group. The Mkt coal seam displays an average thickness of 3 feet with a thin layer of shale parting separating the unit into two benches of varying thickness (Lamborn, 1942). The Mkt No. 6 is overlain with thick shale and sandstone, which make up the Upper Kittanning, Lower and Upper Freeport members above. There are several minor clay and limestone layers present throughout the members although the overburden in these areas has been deemed deficient in calcium carbonate (Cheryl Socotch, personal communication). The Upper Freeport No. 7 coal seam lies above, with an average thickness of 3 feet. Above the No. 7 seam lies the thick Lower Mahoning shale and 9
23 Figure 1. Map of Ohio with county borders, highlighting Mahoning County. Metric not shown as data is in the form of standard US units. 10


24 11 Figure 2. Aerial photograph of the Mushroom Farm site, North Lima, OH. Circled in red is the area where backfill from surface mining contains spoil. Inset photo is facing northeast towards rental home on property, with students walking over an AMD covered front yard.
 pointing out")
25 Figure 3. Stratigraphic column of Allegheny Group (Middle Pennsylvanian) pointing out primary coal seams mined at the Mushroom Farm site (USGS, 2004). 12
26 sandstone member. The No. 6 and 7 coal seams can be traced into eastern Pennsylvania and Western Kentucky. According to the United States Department of Agriculture s soil survey (2012) the predominant original soil types present at the Mushroom Farm include the Loudonville loam (LdB) and the Canfield silt loam (CdB). Both share a parent material of till, which corresponds to the Lavery Till present on site, a Quaternary end moraine deposit. Both soil types have moderately high drainage potential, and have no flooding or ponding frequency. These soil types typically occur over sandstone bedrock. The history of the Mushroom Farm location is diverse. There was underground mining conducted on the property pre-smcra during the late 1800 s, extracting coal from seam No. 5 (Cheryl Socotch, personal communication). Since then the mine has been sealed shut, with the last survey of the mine completed in 1900 (Cheryl Socotch, personal communication). The old mine entrance is located near BH-11 (Figure 4). Surface mining was later carried out on the property and surrounding area by Ferris Coal Company between 1980 and 1986, however reclamation of the site did not take place until 1993 (Cheryl Socotch, personal communication). The coal seam mined was the Upper Freeport No. 7, with subsequent spoil varying from silty clays to sandy silt with gravel (Appendix A). There is a rental house on the property, built between 1972 and 1980 (observed from aerial photography). During surface mining, the land owner farmed mushrooms in a structure near the back of the property that is no longer standing. The structure was built before the rental house, between 1965 and 1972 (observed from aerial photography). While mushroom farming was in progress the local water table may have been lowered temporarily due to the magnitude of water that was pumped for the mushrooms. Mushroom farming stopped in 1993 (Cheryl Socotch, personal communications). 13


27 Figure 4. Aerial photograph of Mushroom Farm site, with a red dot indicating the location of the sealed entrance to the abandoned mine void, for photographs refer to Figure
28 Acid-mine drainage was first detected at the Mushroom Farm rental property in It was described as red water seeping in the basement walls and observed in a nearby stream (Cheryl Socotch, personal communications). Since then the presence of acid-mine drainage has changed the face of the property. Seepage began from a small hillside behind the house on the property, cover the lawn, and filled the basement of the house. The rental property was vacated within several months. Currently, AMD flows as a sheet covering the side and front yards of the abandoned rental home, inducing iron mounds composed almost exclusively of Fe(III) (hydr)oxide precipitates (observed on site). It crosses the driveway and enters what is now a wetland area, and can be seen in aerial photos emerging, southwest of the property along State Route 164. Ohio s Interest in the Mushroom Farm Site Ohio Department of Natural Resources (ODNR) is involved in monitoring water quality at the Mushroom Farm, as it has been designated as a high priority for cleanup by the ODNR, Division of Mineral Resources Management (Cheryl Socotch, personal communication). In 2002 ODNR installed 11 wells, however one of them was destroyed accidentally by the land owner, leaving 10 wells available for monitoring (Figure 5). They are placed throughout the property and surrounding area. Most of the wells are drilled into spoil, with only BH-11 reaching the abandoned mine void behind the house. The immediate area surrounding the Mushroom Farm was mined under ODNR permitting (D-0371), although it was later abandoned and surface reclamation was completed through the Division s Bond Forfeiture program. Since portions of the area underlying the Mushroom Farm were deep mined during pre-law (SMCRA) period of time, bond money is not available for clean-up and remediation costs (Brent Means, 15

29 Figure 5. Aerial photo showing location of observation wells installed by ODNR in 2002 and MW-1, which was drilled separately as a water supply well in 1978 (Base map Google Earth, 2012). 16
30 personal communication). As such, ODNR has expressed interest in identifying the source(s) and severity of AMD at the Mushroom Farm site. Hypothesis I hypothesize that there is a detectable geochemical difference between acid mine drainage that results from a surface or deep mine. Surface mine spoil and underground mine voids represent different environments for AMD formation due to their hydrogeologic constraints. The Mushroom Farm will serve as an example of AMD potentially resulting from two different sources simultaneously. The source of AMD will be established by location using geochemical analysis and hydrogeologic properties of the site. AMD can be characterized in terms of ph, common anions and cations, as well as iron content (Blowes et al., 2003). If the sampling location of the AMD is known to be either from surface mine spoil or a mine void, it can be counted as a representative sample of its known environment. The geochemical analysis of each sampling location will express unique characteristics of pyrite oxidation based on its position hydrogeologically. Previous Studies Many studies have characterized a specific region s post-mining state because of potential negative effects on the surrounding environment from mining activities. Groundwater contamination is a concern associated with AMD production, as enriched metal concentrations and pollutants like oil and grease are typical in mining effluents (Tiwary, 2001). Cravotta (2008) analyzed hydrogeochemical data for 140 abandoned mines in the anthracite and bituminous coalfields of Pennsylvania. One goal of his study 17
31 was to establish correlations between ph, trace metals and rare earth elements. The outcome was that most rare earth elements and trace metals negatively correlated with ph. These findings were consistent with solubility control mechanisms and sorption (Cravotta, 2008). Cravotta also found that none of the 140 sampled areas met US Environmental Protection Agency continuous-concentration criteria for protection of freshwater aquatic organisms. Hawkins (2004) studied the factors that influence groundwater regime in surface mine spoil in the Appalachian Plateau, and included characteristics such as spoil lithology and thickness, particle size, age of reclamation, and pit floor dip angle and direction. Hydrologic variables are important considerations where groundwater is participating in pyrite oxidation, because they influence the ability of groundwater to flow and interact with the surface spoil. Hawkins (2004) found that spoil tends to be extremely heterogeneous and the hydraulic conductivity (K value) found at a well most likely represents the spoil immediately surrounding the well. Discharge rate is proportional to hydraulic conductivity, so it is important to measure this variable when evaluating rate of flow through an aquifer. The information from this study can be used when forecasting water levels and K values in an area prior to surface mining. Tiwary (2001) studied coal mining overburden dumps with respect to environmental impacts on the local water regime. Several coalfields in India were the focus of this study. AMD was not found at all of the coalfields due to low sulfur content of the coal. Other coalfields were also studied that included the presence of AMD due to pyrite oxidation. AMD in these areas had low ph ( ), and high iron and manganese concentrations (50-84 mg/l and 2.6-3mg/L respectively). A goal of this study was to establish a way to control AMD at an overburden dump. Tiwary (2001) suggests burying the waste under water in an anoxic environment to prevent metal sulfide oxidation. This was first achieved by Amyot and Vezina, (1997) in Solbec Mine, Canada. Another benefit to this 18
32 method is the enhancement of activities of sulfate-reducing bacterial populations. These anaerobic bacteria couple oxidation of organic carbon or H 2 to the reduction of sulfate to sulfide, which contributes to the precipitation of metal sulfides, thereby reducing potential for groundwater contamination (Tiwary 2001). Geldenhuis and Bell (1998) studied a coal mine in eastern Transvall, South Africa. The goal was to characterize the hydrogeochemical conditions and AMD at the site to determine the source of the pollution. The initial investigation was carried out through the inspection of topographic maps and old mine drawings, and data from limited water quality analyses. An empirical model was then created to simulate and quantify groundwater flow through the mined area. The results showed that the AMD was coming from old coal mining areas which had been backfilled. There were control reservoirs put in place for drainage of these backfilled areas, but many of them overflowed and seepage resulted. It is recognized that any remediation measures taken here will include minimizing water flow through backfilled areas by imposing clay layers as a means of confinement, as well as directing seepage through a soil-bentonite mixture to allow for filtration (Geldenhuis and Bell, 1998). Summing up the Mushroom Farm Project This project contributes to knowledge gained in previous studies and addresses geochemical aspects of AMD supported by local hydrology. Unlike much research that only focuses on surface mine spoil, this project compares the geochemistry of surface mine spoil and an underground mine void. A detailed hydrogeochemical analysis of each environment has been completed in efforts to establish unique geochemical signatures. 19
33 CHAPTER II METHODS Sampling Campaign A suite of surface and groundwater samples were collected seasonally (February, May, August and November of 2010) in efforts to characterize the geochemistry and hydrology of groundwater at the Mushroom Farm property. This accounted for wet and dry seasonal variability. Surface waters were collected from 4 sites: the head of the stream adjacent to the abandoned mine entrance, discharge from the basement window facing northwest, the sheetflow which emerges from a seep in the hillside and runs over the front lawn and driveway, and the wetland entrance closest to the driveway (Figure 6). When available, groundwater samples were collected from BHs 1, 3, 4, 5, 9, 10 and 11 (Figure 6). Data from MW-1 was collected in February, however the water was too deep to retrieve a sample. This well was sealed shut upon return in May. Water Sample Collection and Chemical Analyses The temperature, ph, dissolved oxygen content (DO), and conductivity were determined using a multiparameter YSI 556 MPS meter held in the water sample once it was collected, or suspended in the well if there was not enough water available to collect a sample. Water samples were collected using a peristaltic pump or bailer, into a bucket where a sample bottle was submerged and filled. The samples were filtered in the field 20


34 21 Figure 6. Map of observation wells with enlarged photo showing surface sample locations (Base map Google Earth, 2012).
35 to remove any solids larger than 0.2μm. Samples for analysis of Fe, Mn, Ca, Al, K, and Na were preserved with 0.5 M HCl in the field (Senko et al., 2008). These samples were stored in 45 ml polypropylene centrifuge bottles, held in a cooler bag for transport back to the laboratory. Water samples collected for alkalinity titrations were held in glass bottles, sealed immediately in the field with minimal head space. A Dionex DX-120 ion chromatography system fitted with an AS4 column with conductivity detection (Sunnyvale, CA) was used to quantify Cl -, NO 3-2-, and SO 4 immediately upon return from the field, these samples were run in duplicate for quality control. Ferrous (Fe 2+ ) iron concentrations were determined colorimetrically using the ferrozine assay, all samples were run in duplicate for quality control (Stookey, 1970). Inductively coupled plasma (ICP) spectrometry was used to determine Al concentrations using a Perkin Elmer P-400. Dissolved Mn, Mg, Ca, K, Na, and Fetotal concentrations were determined by atomic absorption spectrometry (AA) using a PerkinElmer AAnalyst 700 flame Spectrophotometer (Waltham, MA). Alkalinity was determined via titration using M sulfuric acid and methyl orange (Almgren, et al, 1983). Web-Phreeq: Aqueous Geochemical Modeling (Saini-Eidukat and Yahin, 1999) was used to simulate equilibrium speciation of inorganic solutes in water samples, much like Foos (1997) used WATEQ4F to calculate aqueous phases in stream water containing AMD in Summit County, Ohio. Data from summer 2011 was used in Web-Phreeq to evaluate ionic speciation of Fe 2+, Fe 3+, Al, and Ca in water samples. Iron, aluminum, and calcium were chosen for modeling because these ions are typically present in AMD at high concentrations, along with acidic ph values (Foos, 1997). Geochemical signatures were established based on aqueous chemical speciation of AMD constituents. 22
36 Hydrologic Analyses Data were collected at the Mushroom Farm site in order to construct water level contour maps for each season to display groundwater levels. Static water level (swl) was determined using a water-level probe and measuring tape. The total depth, land elevation, and local geology from each well were obtained from well logs provided by ODNR (Appendix A). Well log elevations were ground truthed using 1 meter resolution (horizontal) LiDAR data provided by the Ohio Geographically Referenced Information Program (OGRIP). The same LiDAR data was converted to a digital elevation model (DEM) using Global Mapper 13, in order to create a base map for showing groundwater flow direction in comparison with current topography. Specific yield (S y ) is a ratio that represents the volume of water that will drain under the force of gravity compared to the total volume of rock or soil (Fetter, 1994). S y is a function of aquifer material, with maximum values (~0.20) occurring in medium to coarse sand-size sediments (Fetter, 1994). The S y ratio can be multiplied by the total volume of an aquifer to calculate how much water would drain under gravitational forces. In this study S y was calculated in the area containing spoil with an assumed representative composition of 50% sand (Sy=0.18) and 50% shale/clay (Sy=0.05). Height of the aquifer for total volume calculations was determined by averaging seasonal swls at each observation well, then subtracting the corresponding bedrock elevation, in order to establish the height of the water column that exists in the spoil. The region is a polygon shape that was split into triangles for area measurements, then multiplied by height, ending in total volume. Volume was multiplied by S y ratio, resulting in a volume of water that can be assumed to be flowing through the spoil under the force of gravity. S y was also determined for the area containing the underground mine void with no spoil present. A sandstone lithology was assumed for the area (S y =0.15), in conjunction 23
37 with well log lithologies. Volumetric calculations were done the same as above. The volume of the mine void was estimated and subtracted from total aquifer volume and a different representative S y value was chosen for the mine void (S y =0.98). Sy values were multiplied by respective aquifer volumes, added together, and the number generated represents the volume of water that can be assumed to be flowing through the non-spoil area and mine void under gravitational forces. Calculating a quantity of water with S y allows for comparison of groundwater volume flowing through designated areas. The mass of iron and sulfate was also calculated with S y volumes and associated concentrations. Aerial Photography Analysis Historical aerial photography was acquired from the National Agriculture Imagery Program (NAIP), which is administered by the United States Department of Agriculture (USDA) s Farm Service Agency (FSA) in Salt Lake City, Utah. In order to gain a full understanding of the current hydrogeologic state, groundwater movement prior to any mining activity is useful to establish. This was done by monitoring specific surficial features recognizable in aerial photography, such as lakes, surface seeps, buildings, etc. The result is a timeline showing the lifespan of each feature. This analysis helps to illustrate how the hydrology has changed at the Mushroom Farm through different land use activities. 24
38 CHAPTER III RESULTS AND PRELIMINARY INTERPRETATIONS Current Conditions ( data) The Mushroom Farm site can be broken into three different sections based on data collected and groundwater movement observed (Figures 7 and 8). The first section is to the north, around the local topographic high spot, and includes BHs 5, 6, 7, and 8. The second section is to the southeast of the topographic high, and includes BHs 2, 3, 4 and MW-1. The third section is to the southwest of the topographic high, in vicinity of the rental house and includes BHs 9, 10, 11, 1, and surface sample locations. Though all three sections interact, evaluating them separately can enhance understanding of the individual characteristics of the groundwater moving through these areas. SWLs were collected from selected wells seasonally from winter of 2010 to fall of SWLs from the time the wells were drilled in 2002 are also known from well logs. This information was used to create maps in order to characterize groundwater flow and compare the flow from 2002 to Any seasonal changes can also be detected with these maps. Northern Section (BHs 5, 6, 7, 8) In 2002, when the wells at the Mushroom Farm property were first drilled, the only well to flow artesian was BH7 (Appendix A). This well has a total depth of 44.0 ft. and is drilled through several different spoils, as described on the corresponding well 25
39 Mushroom Farm Site, North Lima, OH BH8 BH6 BH7 BH5 BH9 BH10 stream window BH11 wetland sheetflow BH1 BH4 BH3 BH2 MW-1 Figure 7. Map showing surface topography of Mushroom Farm site along with groundwater and surface water sampling locations. Basemap is DEM made from LiDAR (OGRIP, 2012). 26
40 Mushroom Farm Site, North Lima, OH BH8 Northern Section BH7 BH6 BH5 BH9 BH10 stream window BH11 wetland sheetflow Southwestern Section BH1 BH4 Southeastern Section BH3 BH2 MW-1 Figure 8. Map of surface topography showing sampling locations separated into sections based on flow regime. (OGRIP, 2012). 27
41 log (Figure 9). This well is located on the west side of a topographic high spot, at an elevation of 1158 ft. above sea level (Figure 10). The groundwater in the area of BH7 mainly drains to the west toward BH8 following a decrease in topography. The land surface elevation between BH7 and BH8 decreases by 9 ft., however the SWL currently drops 41.7 ft. This is likely due to the fact that BH8 is not in an area affected by mining, and it is drilled through loam into sandstone bedrock, which likely has high porosity and permeability making it easier for groundwater to flow through it. Currently there is water seeping from the ground near BH7 toward the west, suggesting the groundwater movement in this area has not changed dramatically since 2002 (Figure 11). BH6 is located at the northern portion of the surface mined area at an elevation of 1157 ft. (Figure 10). This well was drilled through several different spoils before hitting a layer of gray clay with coal and shale chips, where the SWL occurred at an elevation of ft. (Figure 9). This is 43.8 ft. lower than SWL at BH7, which can be explained by the topography. BH6 is located on the northwest side of a small hill, which provides for a small drainage divide between BH6 and BH7. This divide allows the water that recharges the area to flow west from BH7 and northwest from BH6. BH5 is located at a surface elevation of 1169 ft., on the downward sloping east side of the topographic high spot (opposite BH4). This well was drilled 49 ft. through spoils that vary in lithology with depth. At the time of drilling (2002) SWL was very low ( ft. above sea level). BH5 was surveyed seasonally from , with a consistently low SWL during winter, spring and summer months. However, SWL during fall was ft., an increase of ~30 ft. This is likely due to the high amount of precipitation which occurred that fall (Table 1). A water sample was never obtained due to water levels being too low, or the well not recharging during pumping. 28
42 29 Figure 9. Northern Section observation wells showing lithology (provided on well logs found in Appendix A), and static water levels labeled by the first two letters of the season they were collected in 2011, or an X signifying static water level at time of drilling (2002) at appropriate elevations listed South to North.
43 Mushroom Farm Site, North Lima, OH BH8 BH6 BH7 BH5 Figure 10. Detail map of Northern Section observation wells. 30

44 Figure 11. Aerial photograph with red circle around seep near BH7. 31
45 Table 1. Precipitation totals for each month sampling took place (NOAA, 2012). Season Month Precipitation (cm) Winter February 3.46 Spring May 9.72 Summer September 4.06 Fall December
46 Southeastern Section (BHs 2, 3, 4, and MW-1): Hydrologic data as well as water samples were collected seasonally from BHs 1, 3, 4, 9, 10, and 11. Samples were analyzed for temperature, conductivity, ph, dissolved oxygen, and common ions. This geochemical data provides evidence in support of ground water flow predictions. BH4 is located south and slightly west of BH5 (Figure 12). BH4 is at a surface elevation of 1151 ft., drilled a total of 39.2 ft. through one spoil type (Figure 13). BH3 has a surface elevation of 1130 ft. and a total depth of 24.5 ft. This well is drilled through spoil, which is lithologically different than that of BH4 (Figure 13). The relationship of ground water flow between several wells in this region is depicted in Figure 14, showing changes in SWL over time. SWL of BH2 was included in 2002 sampling, however due to destruction during harvesting this well is no longer available to sample. BH2 is located south of BH3, at a slightly higher surface elevation of 1136 ft. (Figure 13). SWL from MW-1 is included in 2010 winter sampling, but in Spring sampling, the well was sealed shut. MW-1 was not an observation well installed by ODNR. It was drilled in 1978 and used for mushroom production until Also highlighted in Figure 14 is the location of an AMD seep. This seep is located southeast of BH3 running along the railroad tracks (Figure 15). This AMD seep became apparent in aerial photography in 2005 and has increased in surface area and color since then. In 2002, Spring 2011, and Summer 2011, ground water is flowing away from BH3 and away from the location of the AMD seep (Figure 14). In winter 2010 and fall 2011, ground water is flowing toward BH3 and toward the AMD seep. This suggests that a fluctuation in ground water flow does not allow the seep to discharge ground water constantly all year around. This is likely the reason it took longer to develop, in contrast to other related seeps in the area (Table 2). 33
47 Mushroom Farm Site, North Lima, OH BH5 BH4 BH2 BH3 MW-1 AMD seep Figure 12. Detail map of Southeastern Section observation wells, MW-1 (a sealed water supply well), and associated AMD seep in relation to Mushroom Farm site (OGRIP, 2012). 34
48 35 Figure 13. Southeastern Section observation wells showing lithology (provided on well logs found in Appendix A), and static water levels labeled by the first two letters of the season they were collected in 2011, or an X signifying static water level at time of drilling (2002) at appropriate elevations listed South to North.
49 A. BH5 B C D E BH BH BH MW AMD seep F G MW-1 BH2 BH3 BH4 feet above sea level BH Wi Sp Su Fa Figure 14. (A-F) Mapview of Southeastern Section observation wells with static water level (feet above sea level) when available and associated flow lines. (Colors of map reflect surface elevations, refer to Figure 7). (A) Mapview with wells labeled and associated seep; (B) Data shown for 2002; (C) Winter 2010; (D) Spring 2011; (E) Summer 2011; (F) Fall (G) Southeastern Section static water level over time. 36

 show the seep looking")
50 37 Figure 15. Aerial and ground-based photographs showing AMD seep along railroad, highlighted in red box. Inset photos (2012) show the seep looking towards the south and northwest, respectively.
51 Table 2. Summary of surface seep lifespan identified in historical aerial photography of the Mushroom Farm site. (Refer to Appendix B for aerial photos). 38
52 Figure 14 shows how SWL is generally higher in fall, corresponding to high precipitation (Table 1). BH4 held an unusually high SWL in winter 2010, which is not expected as precipitation in winter was very low and surrounding wells had SWL approximately 30 ft. lower than BH4 (Figure 14). This area is not likely to have a perched water table or any type of similar structure, as the ground water flows exclusively through mine spoil. BH4 holds the lowest recorded winter ground water temperature (3.98ºC), suggesting there could be some frozen water stuck somewhere in the casing of BH4 artificially holding a high SWL for the season. Figure 16 shows spatial geochemical relationships between BH 3, 4, 5, and MW-1, (where data was available). The arrows represent ground water flow direction, according to hydrologic data. On average, BH4 contains a higher sulfate concentration than BH3 (Figure 16). Sulfate is the result of pyrite oxidation (Equation 5), which suggests a higher concentration of pyrite within spoil surrounding BH4 than BH3. In general, temperature increases (1-10 C ) as ground water flows from one well to another (Figure 17). This may be explained by equation 5, as it is exothermic and releases energy as the iron and sulfur are oxidized. Dissolved oxygen remained lowest in BH3 with each season, regardless of flow direction (Figure 18). This is likely due to ferrous iron oxidation, which consumes dissolved oxygen and may be catalyzed by microorganisms (Equation 6). 2FeS 2pyrite + 2H 2 O + 7O 2 2Fe SO 4 + 4H + (Equation 5) 4Fe 2+ + O 2 + 4H + 4Fe 3+ +2H 2 O (Equation 6) The ph is lower on average at BH4 than BH3 (Figure 19). This is expected as the process of pyrite oxidation reduces ph by producing acid (Equation 1). These acidic waters will aid in the leaching of manganese, magnesium, and aluminum out of micas and feldspars present in clay minerals (US EPA, 2000). Therefore it is not surprising that 39
53 A. B. BH5 C. D. E BH BH BH2 MW-1 AMD seep F BH3 BH4 SO 2-4 (mg/l) Wi Sp Su Fa Figure 16. (A-E) Mapview of Southeastern Section observation wells with SO 2- concentrations (mg/l) when available and flow 4 lines. (Colors of map reflect surface elevations, refer to Figure 7). (A) Mapview with wells labeled and associated seep; (B) Data shown for Winter 2010; (C) Spring 2011; (D) Summer 2011; (E) Fall of (F) Southeastern Section SO 2- concentrations 4 over time. 40
54 A. B. BH5 C D. E BH BH BH2 MW AMD seep F MW-1 BH2 BH3 BH4 BH5 temperature ( C) 0 1Wi2010 Sp Su Fa Figure 17. (A-E) Mapview of Southeastern Section observation wells with temperature ( C) when available and flow lines. (Colors of map reflect surface elevations, refer to Figure 7). (A) Mapview with wells labeled and associated seep; (B) Data shown for Winter 2010; (C) Spring 2011; (D) Summer 2011; (E) Fall of (F) Southeastern Section temperature ( C) over time. 41
55 A. B. BH5 C D. E BH BH BH2 MW AMD seep F MW-1 BH2 BH3 BH4 DO (mg/l) 4 BH Wi2010 Sp Su Fa Figure 18. (A-E) Mapview of Southeastern Section observation wells with DO values (mg/l) when available and flow lines. (Colors of map reflect surface elevations, refer to Figure 7). (A) Mapview with wells labeled and associated seep; (B) Data shown for Winter 2010; (C) Spring 2011; (D) Summer 2011; (E) Fall of (F) Southeastern Section DO values over time. 42
56 A. B. BH5 C. 2.9 D. E BH BH BH2 MW AMD seep F MW-1 BH2 BH3 BH4 BH5 ph 3 2 1Wi2010 Sp Su Fa Figure 19. (A-E) Mapview of Southeastern Section observation wells with ph values when available and flow lines. (Colors of map reflect surface elevations, refer to Figure 7). (A) Mapview with wells labeled and associated seep; (B) Data shown for Winter 2010; (C) Spring 2011; (D) Summer 2011; (E) Fall of (F) Southeastern Section ph values over time. 43
57 BH4 consistently contained higher concentrations of these elements than BH3 (Figure 20). On average, Fe(II), Fe(III), and Fe(total) concentrations were higher in BH3 than BH4 (Figures 21, 22, 23). This is expected due to the close proximity of the AMD seep and the iron oxyhydroxides that have precipitated out of the ground water at the associated seep (Figure 15). Southwestern Section (BHs 1, 9, 10, 11, and surface samples) BHs 5, 4, 3, 2 and MW-1 represent ground water flow on the southeast side of the topographic high at the Mushroom Farm. The area to the southwest is represented by BHs 9, 10, 11, 1, and surface sample locations: basement window, stream head, sheet flow, and wetland entrance (Figure 24). BH9 is at surface elevation 1146 ft. drilled through spoil, down to sandstone (Figure 25). BH10 is south of BH9, at surface elevation 1125 ft., and drilled through spoil. BH11 is south of BH10, at surface elevation 1115 ft., and drilled through silty sand and sandstone to the mine void (left from the underground coal mining that took place in the late 1800 s). BH1 is located southeast of BH11, at surface elevation 1112 ft., and in an undisturbed area (no spoil). The surface sample locations include a natural stream channel located near BH11 and the abandoned underground mine entrance (Figure 26). Also included in surface samples are the discharge coming from the basement window on the west side of the rental house (Figure 27), the sheetflow emerging from a seep behind the house to the east (Figure 28), and the wetland which occupies a depression across the driveway, (Figure 29), that is fed mainly from the stream channel. The stream, basement window, and sheetflow are all at surface elevation 1108 ft., and the wetland is located at surface elevation 1095 ft. Figure 30 shows ground water elevations and flow direction on the west side of the study area, around BHs 9, 10, 11, 1 and surface sample locations. The ground 44
58 45 Figure 20. Graphs showing elemental concentrations (mg/l) over time of (A) Manganese, (B) Magnesium, and (C) Aluminum.
59 A. BH5 B. C. D. E BH BH BH2 MW-1 AMD seep F BH3 BH4 Fe 2+ (mg/l) Wi2010 Sp Su Fa Figure 21. (A-E) Mapview of Southeastern Section observation wells with Fe 2+ concentrations (mg/l) when available and flow lines. (Colors of map reflect surface elevations, refer to Figure 7). (A) Mapview with wells labeled and associated seep; (B) Winter 2010; (C) Spring 2011; (D) Summer 2011; (E) Fall of (F) Southeastern Section ferrous iron (Fe 2+ ) concentrations (mg/l) over time. 46
60 A. BH5 B. C. D BH BH BH2 MW-1 AMD seep E BH3 BH4 Fe 3+ (mg/l) Wi Sp Su Figure 22. (A-E) Mapview of Southeastern Section observation wells with Fe 3+ concentrations (mg/l) when available and flow lines. (Colors of map reflect surface elevations, refer to Figure 7). (A) Mapview with wells labeled and associated seep; (B) Data shown for Winter 2010; (C) Spring 2011; (D) Summer 2011; (E) Southeastern Section ferric iron (Fe 3+ ) concentrations (mg/l) over time. 47
61 A. BH5 B. C. D BH BH BH2 MW-1 AMD seep E BH3 BH4 Fe(tot) (mg/l) Wi Sp Su Figure 23. (A-E) Mapview of Southeastern Section observation wells with Fe (tot) concentrations (mg/l) when available and flow lines. (Colors of map reflect surface elevations, refer to Figure 7). (A) Mapview with wells labeled and associated seep; (B) Data shown for Winter 2010; (C) Spring 2011; (D) Summer 2011; (E) Southeastern Section total iron concentrations (mg/l) over time. 48
62 Mushroom Farm Site, North Lima, OH BH9 stream window wetland BH10 BH11 sheetflow BH1 Figure 24. Detail map of Southwestern Section observation wells and surface sample locations in relation to Mushroom Farm Site (OGRIP, 2012). 49
63 50 Figure 25. Southwestern Section observation wells showing lithology (provided on well logs found in Appendix A), and static water levels labeled by the first two letters of the season they were collected in 2011, or an X signifying static water level at time of drilling (2002) at appropriate elevations listed South to North.
 Facing east, the head of the stream begins to discharge below the old mine entrance, which is now covered by vegetation.")
64 51 Figure 26. Photographs of stream and mine entrance. (A) Facing east, the head of the stream begins to discharge below the old mine entrance, which is now covered by vegetation. (B) Downstream, facing west, shows a sampling event and data collection taking place in the stream at the Mushroom Farm site.
 Close up of side of house, showing where groundwater exits the basement window. (C) Basement window discharge site, a multiparameter meter is submerged for data collection.")
65 52 Figure 27. Photographs showing water in vicinity of the house. (A) The front of house, facing Northeast. (B) Close up of side of house, showing where groundwater exits the basement window. (C) Basement window discharge site, a multiparameter meter is submerged for data collection. (D) Side of house, facing Southwest, showing how water that has discharged covers the surface.

 Facing Northeast, (B) Facing")
66 53 Figure 28. Photographs showing sheetflow in vicinity of house. (A) Facing Northeast, (B) Facing Northwest, (C) Facing Southwest towards access road.
 From access road showing surface runoff flow direction, facing southwest, (B) Entrance")
67 54 Figure 29. Photographs showing wetland area, circled in red. (A) From access road showing surface runoff flow direction, facing southwest, (B) Entrance of wetland, facing southwest.
68 A. B. C. D. BH BH10 stream window BH11 wetland sheetflow BH E. F. G BH9 BH10 BH11 BH1 feet above sea level Wi Sp Su Fa Figure 30. (A-F) Mapview of Southwestern Section observation wells with static water level (feet) when available and associated flow lines. (Colors of map reflect surface elevations, refer to Figure 7). (A) Mapview with wells labeled and associated seep; (B) Data shown for 2002; (C) Winter 2010; (D) Spring 2011; (E) Summer 2011; (F) Fall of (G) Southeastern Section observation well static water level over time. 55
69 water in this area is flowing southeast very consistently. The surface sample locations were observed as points of discharge throughout sampling, and aerial photo analysis shows they were also in existence at the time the wells were drilled in BH1 and BH11 were either flowing artesian or had a SWL within a foot from top of casing when sampled and at time of drilling. There is also AMD seeping from the ground around BH1. As ground water moves through the spoils located around BH9 and BH10, it then travels south to BH11 where it enters the underground mine void, which is located at an elevation of 1100 ft (Figure 30). MW-1 also detected a mine void at elevation 1088 ft. It is likely these wells both intercept the same mine and are connected. This mine acts as a holding tank for ground water, with the void space filling up completely before gravity forces the water to continue its path southward, toward BH1. There is AMD seeping from the ground around BH1, even though it was drilled in an undisturbed area, this well also generally flows artesian like BH11 (Figure 31). Both SWL and aqueous geochemistry observed at sampling locations can help to establish the path of ground water flow. The ph follows a decreasing trend as ground water moves from BH9 in the north to the surface sample locations in the south (Figure 32). This is expected as the AMD begins to emerge from the ground beyond BH10. The emerging ground water is responsible for the deposition of yellowboy, an iron oxyhydroxide precipitate that covers what was once the yard of the rental property, flowing across the driveway and into the wetland (Figure 29). Iron, sulfate, manganese and magnesium follow a general increase as the ground water travels south toward BH1 (Figure 33). The increase in sulfate concentration can be explained by pyrite oxidation within spoils. The increase of Fe(II) is stabilized by a decreasing ph. A ph of 4.5 and below is ideal for ferrous iron in solution, as a ph of 4.5 and higher increases potential to rapidly undergo abiotic oxidation (Walsh and Mitchell, 1972). Fe(III) is the result of 56

70 Figure 31. Photograph of BH11 well casing flowing during a sampling event in
71 A. B. 8 BH Winter Spring Summer Fall Average ph ph BH10 stream window BH11 wetland sheetflow BH wetland stream BH1 BH11 BH10 BH9 sheetflow window South North Figure 32. (A) Mapview of Southwestern Section with sampling locations labeled (Colors of map reflect surface elevations, refer to Figure 7). (B) Graph showing Southwestern Section seasonal ph values from South to North displaying overall increasing trend to North. 58
72 59 Figure 33. Graph showing Southwestern Section seasonal elemental concentrations listed from South to North of (A) total iron, (B) sulfate, (C) manganese, and (D) magnesium.
73 Fe(II) undergoing oxidation (refer to Equation 2 in previous section). Magnesium and manganese are generally found in high concentrations in areas with AMD, as a low ph leaches these elements from clay minerals. BH1 is drilled into an undisturbed area, however the geochemistry of the ground water behaves much like that of BH11 from the mine void (Appendix A). This suggests a short travel time between the mine void and BH1, as to not dilute or influence the ground water chemistry. As ground water moves from the mine void located beneath BH11, it moves in several directions. The first direction is artesian flow through BH11. Another direction of flow is toward BH1. Ground water exits the mine void and flows south seeping from the ground and also causing this well to generally flow artesian. The next direction ground water likely moves is south of the mine void several meters, discharging at the stream (northwest of the rental house) and the seep (east of the rental house) which is the source of the sheetflow on the property. Ground water is also leaking into the basement of the rental house, which started in 1990 and was reported by the tenants at that time. The basement acts as a second holding tank for ground water. It is filled to the top now and discharges predominantly through the window located on the northwest side of the house, where it joins with the sheetflow covering the yard. The time and distance water travels through or above ground has a direct impact on its chemistry. For example if water is traveling through spoil interacting with pyrite, we might expect a low ph value with high iron and sulfate concentrations. Whereas if water is traveling over the surface interacting with the atmosphere and meteoric water we might expect a high dissolved oxygen content and a circum-neutral ph value. The geochemistry of water discharging from the basement window of the rental house is similar to that of BH11 (the mine water), as it only travels a short distance through the ground to reach the basement, leaving the ground water somewhat unaltered by surroundings. The stream also shows similarities in geochemistry to the mine water, since it is exposed to 60
74 the atmosphere and flows turbulently, which can alter water chemistry. The sheetflow is expected to show some differences in geochemistry because it has had more travel time through the ground (spoil, bedrock, etc) and was not sampled until after it has flowed several meters over the surface. The wetland is a natural continuation of the stream, however geochemistry is not expected to be the same as it flows ~200 ft. before crossing the driveway and entering the wetland area. Average ph remains ~4.2 between BH11 and the stream, dropping to ~3.2 in the sheetflow and wetland (Figure 32). Dissolved oxygen remains low (below 2mg/L) in BHs 10, 11, 1 and the basement window (Figure 34). The stream, sheetflow, and wetland carry a higher concentration of DO, as those areas of flow are all exposed to the atmosphere. These exposed sample locations contained higher ferrous iron and lower ferric iron concentrations than the basement window, this is likely due to oxygenated waters promoting oxidation of Fe(II) to Fe(III) (Figure 35). Sulfate concentration decreased as water traveled from the basement window, stream, sheetflow and to the wetland (Figure 33). Sulfate concentrations in the basement window are very similar to those in BH11, suggesting there is minimal geochemical alteration to the ground water coming from the mine void and leaking into the basement. The decrease in sulfate concentration from the basement window and into the stream, sheetflow, and wetland are likely due to the uptake of sulfate ions through the precipitation of Schwertmannite [general formula Fe 8 O 8 (OH) 6 SO 4 nh 2 O], a ferric iron (hydr)oxysulfate that commonly precipitates in sulfate containing waters with ph ~3.0 (Bingham et al., 1994). X-ray diffraction (XRD) analysis of uninoculated media from the Mushroom Farm site revealed schwertmannite to be a predominant solid-phase present (Bertel, et al., 2012). Sulfate follows a similar trend as Fe 2+ (Figures 33 and 34). This is expected as ferrous iron is oxidized (and used up) to produce Fe 3+, which then complexes with sulfate in the water and subsequently precipitate as schwertmannite. Average magnesium, aluminum, and manganese 61
75 A. B BH Winter Spring Summer Fall Average DO DO (mg/l) BH10 stream window BH11 wetland sheetflow BH wetland 1 2 stream sheetflow window BH1 BH11 BH10 BH9 South North Figure 34. (A) Mapview of Southwestern Section with sampling locations (Colors of map reflect surface elevations, refer to Figure 7). (B) Graph showing Southwestern Section seasonal dissolved oxygen (DO) values from South to North. 62
76 63 Figure 35. Graph showing Southwestern Section seasonal elemental concentrations listed from South to North showing seasonal concentrations of ferrous and ferric iron (Panels A and B respectively), and (C) seasonal ph values.
77 concentrations are all in close proximity of each other across surface samples (Figure 33). Manganese may be removed from solution due to adsorption on iron hydroxide precipitate surfaces (Foos, 1997). It is of note how much higher the concentrations of these ions are within surface samples, than they are in BH9 and BH10. The solubility of these metals is increased by a low ph, which is what we observe across these sampling locations (Figure 35). Underground Mine Void (BH11 and MW-1) The area in which the underground mine void is located at the Mushroom Farm site is especially difficult to characterize, since there is little historical data available for it. The American Institute of Professional Geologists (AIPG) has provided an Underground Abandoned Mine Data Sheet for a drift mine (one that follows a coal seam) located in the approximate area (Appendix A). This information states mining was completed in the late 1800 s and last surveyed in The size and exact perimeter of the mine are not known. It is likely that the mine voids at BH11 and MW-1 are part of this abandoned drift mine. Data could only be collected at MW-1 in winter 2011, due to it being sealed off upon return in the spring. Figure 36a shows a map view of approximately where the mine void is located for reference. A cross sectional view is also presented with winter 2011 SWLs (Figure 36b). BH11 would likely be flowing artesian if the water was not frozen in the top of well casing. The water table is lower at MW-1 by 15 ft., following a similar slope of the mine void. This slope suggests a regional dip, as the mine follows the coal seam. However, it is difficult to know from this data if this shows true or apparent dip. Regardless of dip, the difference in SWL is significant if we assume the rocks between these wells have similar permeability. MW-1 lies in the southeastern 64
 Map of surface topography with expanded view showing potential mine void location in relation to Mushroom Farm site. Mine void location based upon BH11 and MW-1 well logs (Appendix A).")
78 A. Mushroom Farm Site, North Lima, OH BH11 BH9 BH10 BH11 BH1 BH1 MW-1 MW-1 Figure 36. Underground mine map and cross section. (A) Map of surface topography with expanded view showing potential mine void location in relation to Mushroom Farm site. Mine void location based upon BH11 and MW-1 well logs (Appendix A). (B) Generalized cross section of area between BH11 and MW-1, with interpolated water table and mine void area. The elevation of the land surface between BH11 and MW-1 varies, as seen in panel A. This variation is most likely reflected in the water table, however a generalized water table is shown. 65
79 section of the site, while BH11 lies in the southwestern section. The ground water flow directions in these two sections are slightly different, yet these two wells are ultimately connected underground. Therefore the difference in SWL may be explained by ground water recharge, in that the overall recharge is mainly directed to the southwest (Figure 37). Figure 37 shows how there is potential for twice the volume of ground water to be storedin the southwest, than southeast, using a conservative estimate. This is likely as surface elevations are lower to southwest, than the southeast. Figure 38 highlights the recharge area as determined by SWLs of discharge points. BH11 is located in the inundated area, whereas MW-1 is not. Therefore it is understandable that the water table is higher in proximity of BH11 than MW-1 and ground water is flowing in general to the southwest. Overview of Current Ground water Hydrology The ground water hydrology at the Mushroom Farm site can be broken down into three sections based on flow regime. The Northern Section mainly flows west following sloping topography from the high spot. The Southeastern Section mainly flows southeast, although has some seasonal variability between BH3 and BH4. The Southeastern Section also reveals an AMD seep west of the railroad. The Southwestern Section mainly flows southwest, and also has AMD discharging at the surface. The underground abandoned mine void likely connects BH11 to MW-1, and acts as a holding tank for ground water, before it emerges in the Southwestern Section. The lithology at the Mushroom Farm site is not homogeneous; it includes sandstone, silts, clays, and spoils. Differing flow directions and lithologies influence the geochemistry of ground water. It is therefore not surprising that we find certain geochemical and hydrologic similarities in water samples from the same section. 66
80 Mushroom Farm Site, North Lima, OH BH8 0 BH BH BH10 8 stream window 13 wetland BH sheetflow 12 BH2 BH5 14 West polygon volume 15 = 6,053,562 ft 3 BH9 East polygon volume = 30 BH4 3,030,291 ft 3 23 BH3 BH MW-1 Figure 37. Map showing surface topography of the Mushroom Farm site split into East and West polygons, shows sampling locations along with height of water column rounded to the nearest foot found above bedrock in each well. BHs 2, 6, 7, and 8 use depth to water values found on well logs from time of drilling (Appendix A). All other locations use average depth to water value from sampling events. Depth to water was then subtracted from depth to bedrock, to determine height of water column. Polygons were split into triangles in order to determine area, then the water height from the 3 points of the triangle were averaged and multiplied by the area found to determine volume of triangle. Triangle volumes were then added together to determine total volume of polygon. This calculation assumes 100% porosity and permeability to simple show the potential volume of water that could possibly be flowing through ground above bedrock in each polygon 67
.")
81 Figure 38. Map depicting the Mushroom Farm site inundated by water (orange) up to 1115 feet above sea level. This elevation was determined based upon static water levels of discharge points (surface sampling locations and wells flowing artesian). The area above water (above 1115 ft amsl) can be considered as possible recharge zone. 68
82 WebPHREEQ Results Geochemical modeling of surface and ground water was completed with data from summer 2011 sampling (Appendix B) in order to identify and establish relationships based on aqueous chemical speciation. Iron, both ferrous and ferric, aluminum, and calcium speciation are compared across water samples. These specific ions were chosen for modeling because AMD is typically characterized by high concentrations of these elements, along with ph values as low as 2 (Foos, 1997). Speciation Descriptions The oxidation of ferrous iron is ph dependent. At a low ph, Fe 2+ is stable as a soluble ion. However as ph is increased, it also increases the rate at which Fe 2+ is oxidized to Fe 3+, effectively removing Fe 2+ from solution. Modeling shows ferrous iron speciation to be dominated by aqueous Fe 2+ ions (Figure 39). Other major species involve ferrous iron complexing with sulfate or sulfide, even though sulfur concentrations were put in to the modeling program based on sulfate concentration. Sulfate ions form under the process of pyrite (FeS 2 ) oxidation, more specifically when the sulfur is oxidized. These ions may combine with Fe 2+, forming FeSO 4. The modeling also produced Fe(HS) 2 as a species present in water samples. This is most likely due to charge balance, as any sulfide present is likely oxidized to sulfate, rather than complexing with iron. Fe 3+ is a product of pyrite oxidation and is not a soluble cation. However, Fe 3+ may combine with hydroxyl or sulfate ions to form soluble complexes. These reactions are controlled by dissolved oxygen, temperature, and most importantly ph. The equilibrium reaction (Equation 7) below summarizes the ferric speciation which results from reacting with oxygenated waters. 69


83 70 Figure 39. Ferrous iron speciation in Summer 2011 surface and groundwater samples, as determined by Web-Phreeq: Aqueous Geochemical Modeling (Saini-Eidukat, and Yahin, 1999).
84 Fe 3+ + OH - FeOH 2+ + OH - Fe(OH) +2 + OH - Fe(OH) 3 + OH - Fe(OH) - 4 (Equation 7) By adding more Fe 3+ ions, other ferric iron hydroxides develop such as Fe 3 (OH) +5 4 and Fe 2 (OH) +4. When the ph of surrounding waters is alkaline the reaction tends to the 2 right producing mainly Fe(OH) 3 and consuming hydroxyl ions. If the ph is acidic, the reaction moves to the left producing mainly FeOH 2+ or Fe(OH) +2. Sulfuric acid present, due to pyrite undergoing a series of oxidation and hydrolysis reactions, contributes to an acidic ph. This acid dissociates and the resulting sulfate ions combine with Fe 3+ ions forming ferric sulfate complexes (Equation 8). Fe 3+ + SO 2-4 FeSO +4 + SO 2-4 Fe(SO 4 ) -2 (Equation 8) The reaction moves to the right as ph grows to be more acidic. The overall availability of Fe 3+ ions is based upon the rate limiting step in pyrite oxidation, which can be accelerated by dissolved oxygen and certain microbes. Aluminum speciation is ph dependent. Water dissociates to react with aluminum, resulting in aluminum hydroxides and protons. The aluminum hydroxides produced behave differently based on ph of surrounding waters; they are amphoteric hydroxides which can effectively donate or accept a proton. The equilibrium reaction below displays this process (Equation 9). Al 3+ + OH - AlOH 2+ + OH - Al(OH) +2 + OH - Al(OH) 3 + OH - Al(OH) - 4 (Equation 9) If surrounding water is acidic the reaction will shift to the left, releasing OH - ions and suspending Al 3+ in solution. However, if water is alkaline the reaction will move to the right, consuming OH - ions and producing aluminum hydroxides. In an AMD environment 71
85 water is not the only thing available for aluminum to react with; sulfuric acid is also present which dissociates into sulfate ions that combine with aluminum (Equation 10). This occurs when the ph is low. Al SO 2 AlSO SO 2 Al(SO 4 ) - (Equation 10) 2 Calcium speciation is dominated by Ca 2+ ions and CaSO 4. Calcium cations are water soluble. Calcium sulfate generally exists in mineral forms like gypsum, but is also soluble in water. Aqueous calcium concentrations generally result from dissolution of calcium carbonate. Sulfate ions are formed in the process of pyrite oxidation, which then may complex with calcium. Speciation Analysis BH9 and BH10 are located to the west side of the study area (Figures 5 and 7). Ground water movement in this area is interpreted to be mainly flowing southwest (Figure 30). Ground water from BH9 is likely to be flowing more to the west, than south towards BH10 based on iron and aluminum speciation (Figures 39, 40, and 41). If ground water was making a direct path from BH9 to BH10, we would expect more similarities in speciation. Fe 2+ and Ca show the most similarities (Figure 39 and 42 respectively), where as Fe 3+ and aluminum differences (Figures 40 and 41) are a function of different ph values (as it changes from 7.14 at BH9 to 4.67 at BH10). In general, geochemical modeling shows a relationship with BH10 and BH11. Calcium, aluminum, Fe 2+, and Fe 3+ show similar patterns in speciation, with values being off by as much as 20% (Figures 39, 40, and 41). It is likely that ground water from BH10 flows south towards BH11, undergoing chemical changes most likely in the mine void before exiting through BH11. 72

86 73 Figure 40. Ferric iron speciation in Summer 2011 surface and groundwater samples, as determined by Web-Phreeq: Aqueous Geochemical Modeling (Saini-Eidukat, and Yahin, 1999).

87 4 Figure 41. Aluminum speciation in Summer 2011 surface and groundwater samples, as determined by Web-Phreeq: Aqueous Geochemical Modeling (Saini-Eidukat, and Yahin, 1999). 74

88 75 Figure 42. Calcium speciation in Summer 2011 surface and groundwater samples, as determined by Web-Phreeq: Aqueous Geochemical Modeling (Saini-Eidukat, and Yahin, 1999).
89 The strongest relationship exists among BH11, BH1, the stream, and basement window. Fe 3+, aluminum, and calcium speciation are almost identical with differences less than 5% (Figures 40, 41, and 42). Fe 2+ speciation is also strikingly similar across these sampling locations, with strongest similarities between BH11 and the stream, and BH1 and the window, respectively (Figure 39). This is not surprising as BH11 is drilled into the mine void, and the stream-head (located several meters from the well head) represents the same water discharged and exposed to the atmosphere. BH1 and the basement window are on par with each other as these both represent water that has traveled from the mine void and through some medium (spoil/till/rock) for m before being captured for sampling. The wetland and sheetflow show a strong relationship regarding Fe 2+, aluminum, and calcium speciation (Figures 39, 41, and 42). Fe 3+ speciation differed mainly due to sulfate concentration, which was higher in the sheetflow than in the wetland (Figure 40). Geochemical modeling did not identify a significant relationship between BH4 and BH3. Not only is ground water flow direction variable depending on precipitation and time of year, other things like ph, DO, temperature and ion concentrations were consistently dissimilar between the two wells. Overall, geochemical modeling of surface and ground water at the Mushroom Farm site confirms aqueous chemical speciation relationships among sampling sites in the same section. BH3 and BH4 in the Southeastern Section show some variability, which was expected due to fluctuations in ground water flow in this area. The strongest relationship observed is between BH11, BH1, the stream, and the basement window of the rental home. These sampling locations occur in the Southwestern Section, which is also where AMD emerges and covers much of the surface. These relationships not only point out which locations are similar based on geochemistry, but also describe how iron, aluminum, and calcium are potentially behaving in the water. 76
90 Past Conditions Understanding the current hydrology and geochemistry at the Mushroom Farm site is a crucial step when characterizing ground water flow. In attempts to gain a full understanding of the current hydrogeologic state at the Mushroom Farm site, it is important to review past conditions and identify what has changed. Table 3 displays results from an aerial photo analysis, which dates back to 1959 (photography displayed in Appendix B). Evaluation of aerial photography suggests a series of land-use changes over the history of the site. Therefore, we can conclude that anthropogenic impace caused a difference between the current and past hydrogeology. The only major event that is not observed in the aerial photography provided by the Aerial Photography Field Office (APFO), a division of the United States Department of Agriculture (USDA), Farm Service Agency (FSA), is the underground mining because it occurred in the late 1800 s. There are few records in existence regarding this mine. Its actual location and perimeter are not known. Figure 36 represents the proposed mine location based on all historic information available. We must remember this mine lies in the subsurface of the Mushroom Farm property when reviewing other historic information that affects the surface. In 1959 and 1965 photos the Mushroom Farm property was easy to identify due to the roads in the area already being in place. In the general area the major land use was for agriculture and surface mining. In the 9-year gap between 1965 and 1972, the MF property began to be developed with the structure built that was used to house the actual mushroom farm. Between 1972 and 1981 major changes were made to the landscape. The rental house was built, crops were grown behind the house, and surface mining on permit # D-0371 by Ferris Coal Company was underway. The stream channel (that was sampled ) located northeast of the rental home is identifiable. The channel itself can be 77
91 Table 3. Summary of aerial photography analysis displaying a timeline of major events that changed the surface in some way as identified in historical aerial photography of the site, (Refer to Appendix B for aerial photos). 78
92 identified in the bedrock topography (Figure 43), and therefore the significance lays in the fact that it began to discharge water at this time. There also appeared to be some seepage in the area of what is now known as the location of BH1. The stream channel and surface seep are south of the permitted surface mined area in the vicinity of the underground mine. Between 1981 and 1983 the landscape changed once again. Surface mining on the MF property is the main activity, with a drainage pond located at the southeast end. This pond was reported consistantly to have a ph less 5.0 between 1985 and 1990 when it was removed (Cheryl Socotch, personal communications). The BH1 seep was obvious in photos. The seep located behind the MF rental home also began to take form. Another 9-year gap between 1985 and 1994 photos unveil a dynamically changed landscape. The surface mining concluded and backfilling of the area was complete in Associated drainage ponds were removed in 1990 (Cheryl Socotch, personal communications). It has been reported that tenants of the MF rental home complained of red water seeping into their basement starting in 1991 (Cheryl Socotch, personal communications). The rental home is located within 10 meters of the purported underground mine location (Figure 36); this is a likely source of the ground water that is leaking into the basement. Final reclamation and re-vegetation were not complete until October of A natural lake located southwest of the MF property that was observed in the photos is no longer in existence. This suggests that ground water flowed southwest in this area and is now being seeping out somewhere around the MF rental house instead of discharging into the lake. It is possible that the ground water is now entering the mine void due to an increase in permeability of the surface, diverting flow from the lake southwest of the property. A new drainage pond was installed, behind the MF structure. The wetland (which was sampled ) located across the access road/driveway to MF started to develop and hold water. 79


93 Figure 43. Aerial photograph showing surface stream channel impacted by AMD, which was sampled during Stream channel is also recognizable in bedrock topography, overlaying photograph (ODNR, 2007). 80
94 In the 2000 photograph the newest seep was located near what is now BH7 east of the tree line. Sometime between 2000 and 2005, the seep along the railroad to the east has developed, and ODNR drilled 11 observation wells in response to reported water quality problems. The color imagery of 2005 clearly depicts the extent to which AMD covered the surface near and around the MF rental home. From 2005 to 2012 the main difference is the increased surface area covered by AMD. The overall timeline of events reveals how changes on the surface influence the subsurface. Evaluation of changes in ground water movement over time can be used as a proxy for understanding and characterizing changes in hydrogeology. In simplest terms, the development of AMD at the Mushroom Farm follows surface mining and reclamation efforts. Although the area in question overlays a mine void from the late 1800 s, there were no major changes (in ground water movement) identified in aerial photography until surface mining started in From this analysis we can conclude that surface mining from permit D-0371 is directly related to the AMD discharges at the surface. 81
95 CHAPTER IV DISCUSSION Geochemical Signatures of Ground water from Mine Void and Surface Spoil The Mushroom Farm site is a somewhat unique AMD impacted system in that there were two types of coal mining conducted at two different times. The underground mining was done in the late 1800 s and surface mining followed almost 100 years later, beginning in The geochemistry of surface and ground water samples at the site can be used to compare AMD resulting from the mine void versus that which resulted from spoil left from surface mining. BH11 is the only observation well installed by ODNR that reaches the abandoned mine void. It is drilled through sediment and sandstone, which overlies the mine, and ends in an underclay, beneath a coal seam. The geochemistry of water from this well (data collected ) displays striking similarities to that of BH1. BH1 is located southeast of BH11 and was placed in an area undisturbed by mining, drilled through silt and clay. There is AMD seeping from the ground surrounding this well, first recognized in aerial photography in 1981 (Table 3). Figure 36 shows a proposed location of the mine void based on well log information for BH11 and MW-1 (Appendix A), and illustrates how close BH1 might be to the mine void. This close proximity explains why the geochemistry of BH11 water is so similar to that of BH1. The ground water from the mine void flows southwest towards BH1, causing this well to flow artesian most of the time and resulting in AMD seeping from the ground surrounding the well. Not 82
96 only did water samples recovered from BH1 and BH11 display similar temperature, conductivity, dissolved oxygen and ph, they also contained similar concentrations of measured ions (Fe 2+, Fe 3+, SO 2-, Mn, Al, Ca, and Mg) (Appendix C). This information 4 was used for aqueous geochemical modeling in Web-Phreeq (Saini-Eidukat and Yahin, 1999) to determine speciation of Fe 2+, Fe 3+, Al, and Ca, as these ions are typically found in high concentrations in AMD impacted waters (Cravotta, 2008). These results confirm a significant relationship between BH11 and BH1 regarding aqueous geochemical speciation (Figures 39-42). Web-Phreeq analysis also revealed that this relationship extends to the basement window and stream locations. This is not surprising as the stream begins at the abandoned mine entrance (Figure 26), and the basement is situated in the subsurface very close to the location of BH11 and the mine void. The geochemical characteristics of the water produced from the mine void are unaltered as the water moves from the mine and out to the stream, the basement, and to BH1. This information suggests a unique geochemical signature for AMD produced from the mine void in the form of ion speciation consistency. Surface mining at the Mushroom Farm site has left a reclaimed and re-vegetated area that contains two different spoil types, brown and gray (Appendix A). The brown spoil is characterized by sandy silt and sometimes contains gravel, clay, or shale chips. The gray spoil is characterized by sandstone, shale and silt. These spoil types are not arranged in any uniform manner across the site, and frequently one sampling location (observation well) shows more than one spoil type in the subsurface, even though we consider the overburden that was removed during surface mining to be homogenized before it replaced during reclamation. For this reason we can only distinguish an observation well as a location of spoil, or no spoil. BH1, described above, is in an undisturbed location, meaning there is no spoil present. However, BHs 3, 4, 9, and 10 are in areas of spoil. By 83
97 comparing the geochemistry and aqueous speciation results from Web-Phreeq modeling, an attempt can be made to characterize the surface-mined area. BHs 3 and 4 are located in the Southeastern Section and show seasonal variability in ground water flow direction (Figure 14). Notably, these wells also differ in ion concentrations, dissolved oxygen, and ph values (Appendix C). Web-Phreeq analysis did not show any strong relationships regarding iron, aluminum or calcium speciation (Figures 39-42). BH9 and BH10 are located in the Southwestern Section where ground water generally flows southwest year round (Figure 30). These wells show some striking geochemical dissimilarities. For example, when ferrous iron is high (~45-50 mg/l) in BH10 water, it is low (<10mg/L) in BH9 water and vice versa (Appendix C). Sulfate concentrations reach a low in BH10 water of mg/l, where as in BH9 water sulfate is observed as low as mg/l. In general, BH10 water contains higher concentrations than BH9 of Mn, Ca, Mg and Fe tot. Dissolved oxygen and ph are also inconsistent between the two sampling points. Although ground water in this region follows a southwestern path, it is likely that water from BH9 never actually flows through BH10. Ground water at BH9 likely flows more west than south, and ground water from BH10 likely gets intercepted by the mine void underground just south of the well (Figure 36). Establishing a geochemical signature for AMD impacted ground water flowing through the surface mined area was unsuccessful due to the number of variables upon which the geochemistry is dependent. The spoil type and lithology encountered at each well are somewhat different. The variable hydrology at each well, which is controlled by things like stratigraphy, bedding planes, permeability rates, and precipitation. A large reclaimed area, like that of the Mushroom Farm site, is likely to always encounter these differences, making it difficult to establish any one representative geochemical signature. 84
98 These difficulties can be summed up with the concept of hydrologic non-stationarity. This concept takes into account the fact that climate (and therefore hydrologic events due to climate) is not stationary, meaning hydrologic variables observed in the past will not be the same as those observed in the future (Olsen et al., 2010). Non-stationarity in hydrologic systems is also largely due to anthropogenic impact, including land use changes like mining, urbanization, or agriculture. The changes we observe at the Mushroom Farm over time are directly related to anthropogenic impact and therefore we can assume a non-stationary hydrologic system. With this assumption comes difficulty in long-term forecasting for water resources. Conventional statistical methods for water resource predictions are under some scrutiny as more models to reflect changing land use and subsurface characteristics are developed (Coulibaly and Baldwin, 2005). Tracking the Plume of Acid Mine Drainage AMD impacted waters typically contain high concentrations of metals along with an acidic ph (Cravotta, 2008). Iron and sulfate concentrations are often elevated due to the oxidation of pyrite (FeS 2 ) minerals found within mine waste (US EPA, 2000). By following iron and sulfate concentrations at the Mushroom Farm site we can track where AMD is actually being produced within the spoil and/or the mine void. Figures 39 and 40 show seasonal Fe (tot) and SO 2- concentrations respectively, along with the average 4 at each sampling location. There is an overall increase in total iron and sulfate moving north to south. This shows that although AMD is being produced in the reclaimed area to the north, it is not as severely impacted as the area to the south, where the rental home lies. This is expected as iron hydroxide deposits populate what was once the front yard, driveway, and general area around the rental home (Figures 26-29). 85
99 BH11, which is drilled into the mine void behind the rental home, contains some of the highest Fe (tot) and SO 2- concentrations observed in sampling (Figures 4 45 and 46). The plume of iron and sulfate-laden water produced in the mine void moves from the mine through the ground and seeps into the basement of the rental home, into the stream, out of the ground behind the house and around BH1. This suggests that AMD production is more extensive in the mine void than the backfilled area left from surface mining. It is likely that FeS-oxygen interactions are enhanced in the mine void, giving rise to water containing higher concentrations of Fe(II), sulfate, and other dissolved constituents. Figure 47 shows that BH11 water had some of the lowest DO concentrations observed, even though it is producing AMD. This suggests the ground water that enters the mine has a higher DO value than the water exiting the mine through BH11 (what is actually sampled) due to pyrite oxidation depleting dissolved oxygen in ground water. It can be assumed that the iron sulfide minerals present in the mine void exist in the walls of the mine, as they are accessory minerals to coal. The underground mining was completed over 100 years ago, before the SMCRA of 1977 was established which now regulates how mine waste is handled. It is likely then that any refuse from the underground mining was dumped back into the mine upon completion, and not moved elsewhere for disposal. The mine void filled with unconsolidated refuse and ground water was essentially dormant (producing minimal AMD) until surface mining at the Mushroom Farm site began. 86
100 Specific Yield: the volume of ground water involved The Mushroom Farm site is unique because there are two different post-mining environments present. The mine void has been in existence under the property for over 100 years. Surface mining took place on the property between 1981 and 1985, and backfilling took place in 1994 (Table 3). The resulting AMD deposits observed at the property therefore are not simply the product of the surface mining or the underground mining, but a combination of both. Figure 48 delineates the area to the north that includes observation wells installed by ODNR that were drilled through spoil in the area that was backfilled after surface mining. This area contains spoil that varies in lithology from sand to silt to shale. A representative mixture of spoil was assumed of 50% sand and 50% shale for specific yield (S y ) calculations. The volume of the polygon was determined with height being equal to that of the water column above bedrock (ground water that is flowing through spoil). The polygon was split into triangles for area calculations, with average water column height from three points used in final volume calculation. The S y determined was 1,940,986 ft 3, (which is the actual volume of ground water stored in the area of the polygon that will drain under the influence of gravity). Figure 49 delineates the area to the south that includes observation wells installed by ODNR that was unaffected by surface mining, or the area without spoil, at the Mushroom Farm site. Volume of the polygon was calculated the in same manner as Figure 48, with the exception of the mine void that lies within this polygon. The mine void area was subtracted from the total volume, and S y for the area unaffected was assumed to be 15% from a sandstone lithology. The mine void assumed 90% porosity and S y as it is a void space. Unknown dimensions of the void were estimated conservatively. The result is S y = 370,269 ft 3 of ground water. 87
101 With the exception of the AMD seep located west of the railroad (Figure 15), the majority of AMD seeping at the surface is in the location of the rental home and stream (Figure 44) in the section to the South. Considering S y to be the amount of ground water naturally flowing through the system, we observe a much greater volume of ground water in the area containing spoil to the North (Figure 45), than in the unaffected area in the south (Figure 46). We might expect more ground water to be flowing in the area showing the most pollution at the surface, however this is not the case. Most of the ground water flow is in the north, through spoil, and only a small percentage of ground water flow occurs in the south. Since we know the majority of ground water recharge occurs in the North, but severe AMD deposits and seeps occur in the South, we can conclude that the undisturbed area is mainly responsible for producing such contamination. The geochemistry of the ground water grows more concentrated with iron and sulfate towards the South end of the site (Figures 47 and 48). Since this area is undisturbed by surface mining and contains no spoil, it is the abandoned mine void that is responsible for producing the mine drainage observed at the surface. Contaminant Transport: the mass of iron and sulfate Calculating S y produces an estimate of how much water is flowing through the subsurface in different areas of the Mushroom Farm site under the force of gravity. The major contaminants involved in AMD are iron and sulfate (Cravotta, 2008, and Foos, 1997). Using ion concentrations observed during sampling, an estimate can be made of the actual mass of contaminant transport that is occurring. The backfilled area to the North contains S y = 1,940,986 ft 3 or 54,962,507 L of ground water (Figure 45). The observation wells used to determine S y include BHs 2, 3, 88
102 4, 5, 6, 7, 8, 9, and 10. Though SWLs were able to be determined at these wells (from sampling, or 2002 data), water samples were not collected from each of them for laboratory analysis. For this reason, ionic concentration is estimated using data from BHs 3, 4, 9, and 10. This produces a very conservative approximation because we can assume the other wells not sampled in the area also have elevated iron and sulfate concentrations. Total iron and sulfate concentrations were averaged and multiplied by the total number of liters present. By this calculation, we can assume there is at least 1,821 kg of iron and 115,603 kg of sulfate presently flowing through the backfilled area. The undisturbed area to the south contains S y = 370,269 ft 3 or 10,484,830 L of ground water (Figure 46). The sampling locations used to determine S y include BHs 1, 2, 4, 10, and 11, along with MW-1 and surface sample locations (stream, wetland, window, and sheetflow). Total iron and sulfate concentrations from water from BHs 1 and 11, and surface sample locations were used to calculate the mass of contaminants available for transport in the undisturbed section. Again, the total concentrations were averaged and multiplied by total number of liters of ground water. The mass of total iron in ground water flowing through the undisturbed area is 790 kg, and total sulfate is 50,269 kg. The total volume of ground water calculated to be flowing through the undisturbed area is equal to only 19% of the total volume flowing through the area containing surface spoil. From this calculation alone one might assume the larger problem lies within the larger volume of water. However, the mass of both iron and sulfate found in the undisturbed area are equal to 43% of that of which is found in the area containing surface spoil. Though iron and sulfate estimates for the area containing spoil are conservative, these differences are quite staggering and reinforce the fact that the undisturbed area is producing significantly more AMD than the area containing spoil, regardless of total ground water volumes. 89

103 Figure 44. Aerial photograph showing several observation wells installed by ODNR and associated AMD emerging at surface. 90
. All other locations use average depth to water value from 2010-2011 sampling events.")
104 Figure 45. Map highlighting the area where spoil is found, shows sampling locations along with height of water column rounded to the nearest foot found above bedrock in each well (OGRIP, 2012). BHs 6, 7, and 8 use depth to water values found on well logs from time of drilling (Appendix A). All other locations use average depth to water value from sampling events. Depth to water was then subtracted from depth to bedrock, to determine height of water column. The polygon was split into triangles in order to determine area, then the water height from the 3 points of the triangle were averaged and multiplied by the area found to determine volume of triangle. Triangle volumes were then added together to determine total volume of polygon. Total volume was multiplied by Specific Yield (Sy) percentage (assuming a mixture of sand and clay), to determine the actual volume of water stored in the area of the polygon that will drain under the influence of gravity. 91
105 Figure 46. Map highlighting area unaffected by surface mining, shows sampling locations along with height of water column rounded to the nearest foot found above bedrock in each well (OGRIP, 2012). BH2 uses depth to water value found on well logs from time of drilling (Appendix A). All other locations use average depth to water value from Depth to water was then subtracted from depth to bedrock, to determine height of water column. The polygon was split into triangles in order to determine area, then the water height from the 3 points of the triangle were averaged and multiplied by the area found to determine volume of triangle. Triangle volumes were then added together to determine total volume of polygon. The total volume of the mine void was calculated with heights found on well logs for BH11 and MW-1 (10ft and 6 ft, respectively), a length of 1000 ft, and a conservative width of 5ft was estimated. The volume of the mine void equates to 40,000ft3, and is assumed to have 90% porosity as it is an open void. The mine void volume was subtracted from total volume, the total volume was multiplied by Specific Yield (Sy) percentage (assuming sandstone with Sy=15% ). The new total volume was added to the porous volume of the mine void in order to determine the actual volume of water stored in the area of the polygon that will drain under the influence of gravity. 92
106 Figure 47. Graph of individual and average seasonal total iron concentrations, showing general decrease to the north. The Secondary Maximum Contaminant Level (SMCL) for iron based on Ohio EPA drinking water regulations is highlighted with a red line representing 0.3 mg/l, showing how polluted the sampling locations are from acid mine drainage production (Ohio EPA, 2010) 93
107 Figure 48. Graph of individual and average seasonal sulfate concentrations, showing general decrease to the North. The Secondary Maximum Contaminant Level (SMCL) for sulfate based on Ohio EPA drinking water regulations is highlighted with a red line representing 250 mg/l, showing how polluted the sampling locations are from acid mine drainage production (Ohio EPA, 2010). 94
108 Figure 49. Graph showing seasonal and average dissolved oxygen concentrations. BH11 holds some of the lowest values observed. 95
109 Lifespan of Acid-Mine Drainage The estimate of total iron and sulfate mass in the ground water of the undisturbed section (south) is likely more accurate than the estimate for the backfilled area (north), due to what data was available. However, even a conservative estimate can provide helpful information to estimate the life span of an AMD producing site. Numerical models take into account many parameters when assessing an AMD-impacted site over time, such as grain size, porosity, permeability, pyrite concentration, overburden thickness, mine type, reclamation practice, climate, geographic location, etc (Blowes et al., 2003, Corazao et al., 2006, Bezuidenhout and Rousseau, 2006). Due to the number of variables that affect AMD production over time, there has not been a conclusive numerical model established to apply to the Mushroom Farm site. However, modeling results do display agreement in an overall life span of hundreds to thousands of years for mine drainage production at post-mining sites. Bezuidenhout and Rousseau (2006) suggested that an environment with low porosity, high moisture saturation, high pyrite concentration, and an increased depth of spoil can potentially produce AMD for over 10,000 years. Generally, numerical models are developed to monitor reclamation efforts such as limestone drains at AMD impacted sites, which are generally tested for several months or years (Cravotta and Trahan, 1996). The limiting reagent in AMD production is the availability of iron sulfide minerals, most notably pyrite (FeS 2 ). Therefore, AMD production essentially occurs until pyrite supply is fully depleted. If nothing else, it is clear that without remediation efforts the abandoned mine and the surface spoil at the Mushroom Farm site will be active AMD producers for decades if not centuries to come. 96
110 AMD Development on the Surface Figure 37 shows what the Mushroom Farm site would look like with the ground flooded to 1115 ft. above sea level, with the remaining uncovered land surface inferred as the recharge zone. The areas of AMD deposits only occur in the submerged areas. S y calculations reveal that there is a greater volume of ground water and mass of contaminants (iron and sulfate) flowing through the recharge zone, than in the areas where AMD deposits at the surface. However, further calculations reveal that roughly double the amount of iron and sulfate per unit volume of ground water are being produced in the submerged area, than the recharge zone. Aerial photography demonstrates how new areas of seepage have developed over time since 1959 (Table 3). With this information we can conclude that before the AMD production at the Mushroom Farm ends (due to complete depletion of pyrite) that the surface area impacted by AMD will likely increase. Furthermore, areas impacted by AMD will only develop in the submerged area (Figure 37). The Cause of AMD at the Mushroom Farm Geochemistry is used to determine the ground water constituents present. Geochemical modeling is then used to determine ionic speciation of the ground water, and hydrologic calculations used to determine how much and where ground water is presently flowing. It is important to understand the current conditions of the Mushroom Farm site in order to understand how it has changed through time. Aerial photography collected since 1959 offers information of how land use has changed and in turn how the hydrogeology has been affected. 97
111 Though aerial photography is not collected every single year, it is collected frequently enough to reveal major changes on the surface. The first notable change to the landscape shows in 1981 photography. The rental home was built and surface mining was underway. Some seepage began to occur around BH1 and drainage ponds were constructed. The surface mining concluded in It was another five years before final reclamation and re-vegetation were complete in aerial photography reveals new locations of AMD seepage near the rental home. There must be ground water in the subsurface to have AMD seeping at the surface. Ground water is largely precipitation that has infiltrated into the ground. Infiltration rates change over time in post-mining environments and are controlled by things like grain size, precipitation, vegetation, and slope (Jorgensen and Gardner, 1987, Willard et al., 2010). Therefore in a post-mining environment, regardless of precipitation rates, there is a possibility for increased or decreased infiltration. Jorgensen and Gardner (2007) studied reclaimed minesoils on surface mines of different ages, and concluded that the necessary components which increase infiltration rates over time include low silt and clay percentages, high slope, and good vegetation cover. Guebert and Gardner (2001) found that newly reclaimed minesoils in Pennsylvania exhibit low infiltration rates (1-2cm/h) and within 4 years infiltration returns to pre-mined rates (8 cm/h). During the five-year gap between the conclusion of surface mining and final reclamation, infiltration rates likely skyrocketed because there was no overburden, topsoil, or vegetation to absorb or block precipitation (Figure 50). This likely allowed the underground mine void to intercept more ground water than normal aerial photography shows the newly reclaimed area, with not much vegetation visible until year-2000 photos. The area known to contain spoil is situated on and around a local high spot in bedrock topography. The infiltration rate at the Mushroom Farm site is likely increasing over time as healthy 98
112 Figure 50. This is a simple cross section of the Mushroom Farm house and the area to the northeast that was surface mined. (A) This panel shows the house and water table previuos to surface mining. (B) This panel shows how close the water table is to the surface as mining takes place. Precipitation now has a direct path to the subsurface. Water encountered during mining is usually pumped out or drained into ponds. The property was left in a similar state for 5 years before final reclamation was complete. (C) This panel shows the post-mining water table and how the reclaimed area has been backfilled with material that now acts as a catch basin with high infiltration. This raises the water table closer to the surface and contributes to seepage and discharge. 99
113 vegetation spreads over the spoil, which includes various sand, silt, and clay percentages, over a sloping surface. With the abandoned underground mine void present in the subsurface of the Mushroom Farm site, the question should not have been if AMD would result, but when. It was not until surface mining and reclamation changed the permeability of the surface that AMD began to result from the mine void and breach the surface. It is clear with Sy calculations that it is not necessarily the volume of water present which determines the significance of pollution, but more so what the ground water is flowing through (i.e. spoil, abandoned mine, undisturbed strata). Mushroom Farm AMD and Local Drinking Water Supply The AMD produced at the Mushroom Farm site poses an environmental hazard as there are people who rely on well water for their drinking water supply in the area. One homeowner lives west of the study site at Blosser Road (Figure 51). This homeowner had a water well drilled on their property in 1989 (soon after surface mining concluded at the Mushroom Farm site, before reclamation was complete). Their well reaches a depth of 209 ft., but hit water at a depth of 12 ft. The original well log lists sand for the first 24 feet of drilling, followed by 38 ft. of clay (Appendix A). Not addressing topsoil or vegetation constraints, infiltration into sand would be extremely high. Figure 51 shows how a stream that now flows with AMD-laden waters makes a traverse from the Mushroom Farm site, west towards Blosser Road and the homeowner s well. It is not unlikely that AMD has infiltrated into the aquifer from which this homeowner receives water. According to Ohio EPA drinking water standards, iron has a Secondary Maximum Contaminant Level (SMCL) of 0.3 mg/l and sulfate has a SMCL of 250 mg/l. It should 100


114 Figure 51. Aerial photograph of the Mushroom Farm site, (circled on right), with arrows following stream of AMD flowing west towards a home that uses well water located at Blosser Road, North Lima, OH (circled on left). 101
115 be noted that during sampling at the Mushroom Farm site that the lowest total iron level detected was 30.9 mg/l and the highest was mg/l (Figure 45). Average sulfate ranged from to mg/l (Figure 46). Though infiltration may slightly reduce iron and sulfate concentrations, having these in such elevated quantities in drinking water are undesirable. 102
116 CHAPTER V CONCLUSIONS The Mushroom Farm site is home to a unique post-mining environment involving an abandoned mine void from the late 1800 s and surface spoil from the late 1900 s. I hypothesized that there is a detectable geochemical difference in AMD that results from a surface mine or an underground mine. A geochemical signature of AMD-impacted ground water from the abandoned mine void has been established via geochemical speciation modeling. However, ground water flowing through CaCO 3 deficient surface spoil proved to be too heterogeneous to establish any significant speciation trends. The AMD deposits at the surface are due to ground water flowing through the abandoned mine void, which likely extends in an east-west direction beneath the site. This mine void was somewhat dormant for almost 100 years before strip mining altered permeability and infiltration rates at the surface. When surface mining was complete, there was a five year gap before the area was backfilled, during which precipitation had a direct path to the subsurface. After backfilling and revegetation were complete the surface mined area acted as a catch basin, with increased permeability and an elevated water table (Figure 50). The area containing surface spoil is perched on a sandstone bedrock hill, which acts as a recharge zone, whereas AMD-impacted ground water discharges in areas of lower elevation. The surface area affected by AMD discharge is likely to increase over time, exacerbating the environmental hazard present, unless remediation is performed. 103
117 This study serves as an example of what can happen when surface mining is conducted in an area where there is a pre-existing mine void present. The hydrogeochemical characterization of AMD produced at this site, as well as historical aerial photo analysis, reveal how the reclaimed surface mined lands and the underground mine void each play a part in producing AMD. This is especially important in eastern Ohio, where over 1,000 abandoned underground mine voids exist (Ohio Division of Geological Survey, 2012). These mines are hazardous as they create environmental problems such as AMD, and can also lead to subsidence which may damage buildings and homes. The future of the Mushroom Farm site is not certain. Without remediation AMD will continue to produce until complete depletion of pyrite within the mine void and surface spoil occurs. Soil cores in the area containing surface spoil may be useful in calculating the amount of pyrite within the spoil that is reacting to produce AMD. It also may be useful to continue monitoring not only the ODNR observation wells present, but also water wells belonging to land owners in the area to gain a full understanding of how much pollution is in the ground water and where it is headed. Using iron and sulfate concentrations together with a known mass of pyrite situated in the surface spoil, an estimated rate of pyrite oxidation could be determined. The extent of the mine void is not known, and without historical records only a geophysical survey of the site will reveal its true size and shape. This information would be useful in forecasting recharge and discharge rates. Anthropogenic changes over time to the landscape are inevitable. Knowledge of the subsurface is crucial when large scale changes are made that affect things like permeability, overburden thickness and composition, and ground water recharge. 104
118 REFERENCES Amyot, G. and Vezina, S., 1997, Flooding as a reclamation solution to an acidic tailing pond, the Solbec Case: Proceedings of the Fourth International Conference on Acid Rock Drainage, Vancouver, B.C., Canada, 31st May 6th June 1997, Vol. II, p Bertel, D.D., Peck, J.J., Quick, T.J., and Senko, J.M., 2012, Iron transformations induced by an acid-tolerant Desulfosporosinus species: Applied Environmental Microbiology, v. 78, p Bezuidenhout, N. and Rousseau, P, 2006, Investigations into the depth and rate of weathering on Witwatersrand Gold Tailings Dam surfaces as key information for longterm and risk assessments in Preceedings, 7th International Conference on Acid Rock Drainage, American Society of Mining and Reclamation: St. Louis, MO, March 2006, p Bingham, J.M., Schwertmann, U., Pfab, G., 1994, Influence of ph on mineral speciation in a bioreactor simulating acid mine drainage, Applied Geochemistry, v. 11, p Blowes, D, Ptacek, C., Jambor, J., and Weisener, C., 2003, The geochemistry of acid mine drainage: Treatise on Geochemistry, v. 9. Editor: Barbara Sherwood Lollar. Executive Editors: Heinrich D. Holland and Karl K. Turekian. ISBN Elsevier, 2003 Boggs, S., 2006, Principles of sedimentology and stratigraphy: Pearson Prentice Hall, 662 p. Brant, R. A., and DeLong, R.M., 1960, Coal Resources of Ohio: Ohio Division Geological Survey Bulletin 58, p Bruneel, O., Duran, R., Casiot, C., Elbaz-Poulichet, F., and Personne, J-C., 2006, Diversity of microorganisms in Fe-As-Rich acid mine drainage waters of Carnoule`s, France: Applied and Environmental Microbiology, v. 72, p Corazao, J., Bay, D.S., Beckie, R., Klein, B, Mayer, U., Smith, L., Wilson, G.W., Brienne, S., Letient, H., 2006, Design and Construction of Field-Scale Waste Rock Test Piles at Antamina Mine, Peru: Waste Geotechnics, v. 25, p Coulibaly, P. and Baldwin C.K., 2005, Nonstationary hydrological time series forecasting using nonlinear dynamic methods: Journal of Hydrology, v. 307, p
119 Cravotta, C.A., 2008, Dissolved metals and associated constituents in abandoned coalmine discharges, Pennsylvania, USA. Part 1: Constituent quantities and correlations: Applied Geochemistry, v. 23, p Cravotta, C.A. and Trahan, M. K., 1996, Limestone drains to increase ph and remove dissolved metals from an acidic coal-mine discharge in Pennsylvania, in Proceedings, 13th Annual Meeting of the American Society for Surface Mining and Reclamation: American Society for Surface Mining and Reclamation, p Eby, G.N., 2004, Principles of Environmental Geochemistry, Brooks/Cole, Belmont, CA. Fetter, C.W., 1994, Applied Hydrogeology, Third edition: Upper Saddle River, NJ, Prentice-Hall, Inc., 691 p. Foos, A., 1997, Geochemical modeling of coal mine drainage, Summit County, Ohio: Environmental Geology, v. 31, p. 6. Geldenhuis, S., Bell, F.G., 1998, Acid mine drainage at a coal mine in the eastern Transvaal, South Africa: Environmental Geology, v. 34. Guebert, M. D., Gardner, T. W., Macropore flow on a reclaimed surface mine: infiltration and hillslope hydrology: Geomorphology, v. 39, p Hatcher, R. D., 2010, The Appalachian orogen: A brief summary Geological Society of America Memoirs, v. 206, p Hawkins, J.W., 2004, Predictability of surface mine spoil hydrologic properties in the appalachian plateau: Ground Water, v. 42, p. 7. Jorgensen, D.W. and Gardner, T.W., 1987, Infiltration capacity of disturbed soils: Temporal change and lithologic control: Journal of the American Water Resources Association, v. 23, p Kuipers, J.R., Maest, A.S., MacHardy, K.A., and Lawson, G., 2006, Comparison of predicted and actual water quality at Hardock Mines: The reliability of predictions in Environmental Impact Statements: Butte, MT, Kuipers & Associates and Buka Environmental, 228 p. Lacey, D.T., Lawson, F., 1970, Kinetics of the liquid-phase oxidation of acid ferrous sulfate by the bacterium Thiobacillus ferrooxidans: Biotechnology and Bioengineering, v. 12, p Lamborn, R. E., 1942, The Coal beds of Western Carroll County and the Coal Beds in Southeastern Mahoning County: Geological Survey of Ohio, Columbus, Fourth Series, Bulletin 43, p National Oceanic and Atmospheric Administration (NOAA), National Weather Service, 2012, y=099&type=precip (accessed January 2012) 106
120 Ohio Environmental Protection Agency (EPA), 2010, Drinking Water Standards for Ohio Public Water Systems DWStandardsList.pdf (accessed January 2012) Ohio Division of Geological Survey, 2012, Abandoned underground mines of Ohio: Ohio Department of Natural Resources, Division of Geological Survey Map EG-3, generalized page-size version with text, scale 1:2,000,000, 2 p. Ohio Geographically Referenced Information Program (OGRIP), 2012, Ohio Statewide Imagery Program: (accessed April 2012) Olsen, J.R, Kiang, J., and Waskom, R., Workshop on Nonstationarity, Hydrologic Frequency Analysis, and Water Management. Colorado Water Institute Information Series No Pennsylvania Department of Environmental Protection (PA-DEP) The Science of Acid Mine drainage and Passive Treatment. Harrisburg, PA: PA-DEP publication, Bureau of Abandoned Mine Reclamation. Pepper, J. F., 1934, The Taconic and Appalachian orogenies in the Hudson River region: Science, v. 80, p Ruppert, L.F., Trippi, M.H., and Slucher, E.R., 2010, Correlation chart of Pennsylvanian rocks in Alabama, Tennessee, Kentucky, Virginia, West Virginia, Ohio, Maryland, and Pennsylvania showing approximate position of coal beds, coal zones, and key stratigraphic units: U.S. Geological Survey Scientific Investigations Report , 9 p., 3 plates, available only online at (accessed January 2012) Saini-Eidukat, B. and Yahin, A., 1999, Web-phreeq: a WWW instructional tool for modeling the distribution of chemical species in water, Computers & Geosciences, v. 25, Issue 4, p , ISSN , DOI: /S (98) d0c9cb3c16d (accessed June 2012) Sand, W., 1989, Ferric iron reduction by Thiobacillus ferrooxidans at extremely low phvalues: Biogeochemistry, v. 7, p Schrenk, M.W., Edwards, K.J., Goodman, R.M., Hamers, R.J., and Banfield, J. F., 1998, Distribution of Thiobacillus ferrooxidans and Leptospirillum ferrooxidans: Implications for generation of acid mine drainage: American Association for the Advancement of Science, v. 279, p Senko, J.M., Wanjugi, P., Lucas, M., Bruns, M.A., and Burgos W.D., 2008, Characterization of Fe(II) oxidizing bacterial activities and communities at two acidic Appalachian coalmine drainage-impacted sites: International Scoiety for Microbial Ecology Journal, v. 2, p Stookey, L., 1970, Ferrozine - A New Spectrophotometric Reagent for Iron: Analytical Chemistry, v. 42, p
121 Tiwary, R.K., 2001, Environmental impact of coal mining on water regime and its management: Water, Air, and Soil Pollution, v Totten, S. M. and White, G. W., 1987, Glacial geology of Mahoning County, Ohio: Columbus, State of Ohio, Department of Natural Resources Division of Geological Survey, v. 139, 29 p. United States Energy Information Administration (US EIA), Coal Explained: Coal mining and transportation: mining (accessed September 2011) United States Energy Information Administration (US EIA), 2009, 2008 Annual Coal Report: (accessed September 2010) United States Energy Information Administration (US EIA), 2011, What is the role of coal in the United States?: (accessed September 2011) United States Environmental Protection Agency (US EPA), 2000, Abandoned mine site characterization and cleanup handbook, EPA 910-B , 129 p. United States Environmental Protection Agency (US EPA), 2000, Abandoned mine site characterization and cleanup handbook, EPA 910-B , 129 p. United States Geological Survey (USGS), 2004, Geologic Provinces of the Unites States: Appalachian Highlands Province: html (accessed January 2012) Walsh, F. and Mitchell, R., 1972, A ph-dependent succession of iron bacteria: Environmental Science & Technology, v. 6, p Willard, A. J., Pena-Yewtukhiw, E. M., Skousen, J., 2010, National Meeting of the American Society of Mining and Reclamation, Pittsburgh, PA, Bridhing Reclamation, Science and the Community, June 5-11, R.I. Barnhisel (Ed.) Published by ASMR, Lexington, KY. Weller, J.M., The Conception of Cyclical Sedimentation during the Pennsylvanian Period: Illinois State Geological Survey Bulletin 60, p
122 APPENDICES 109
123 APPENDIX A WELL LOGS FOR SAMPLING LOCATIONS, ABANDONED MINE DATA 110
124 111
125 112
126 113
127 114
128 115
129 116
130 117
131 118
132 119
133 120
134 121
135 122
136 123
137 124
138 125
139 126
140 127
141 128
142 129
143 130
144 131
145 132
146 133
147 134
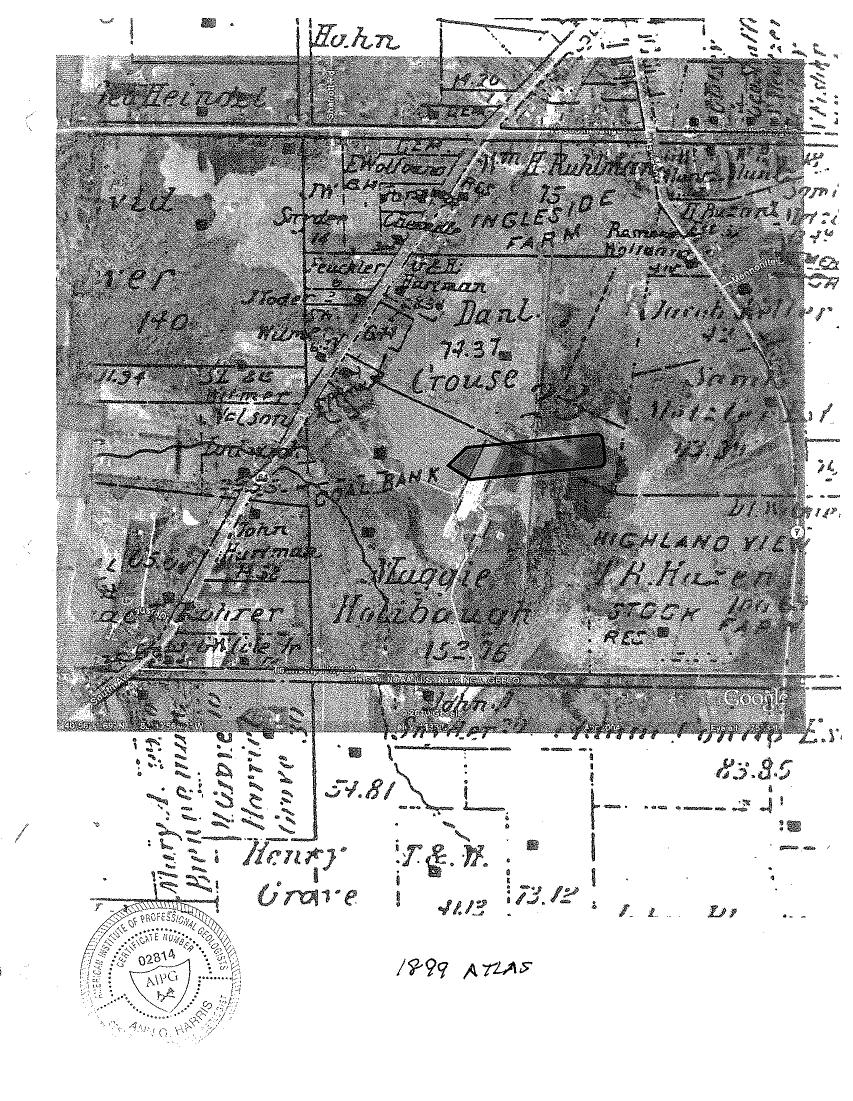
148 135
149 APPENDIX B HISTORICAL AERIAL PHOTOGRAPHY (PHOTOS ZOOMED TO THE MUSHROOM FARM SITE, NORTH LIMA, OH) 136
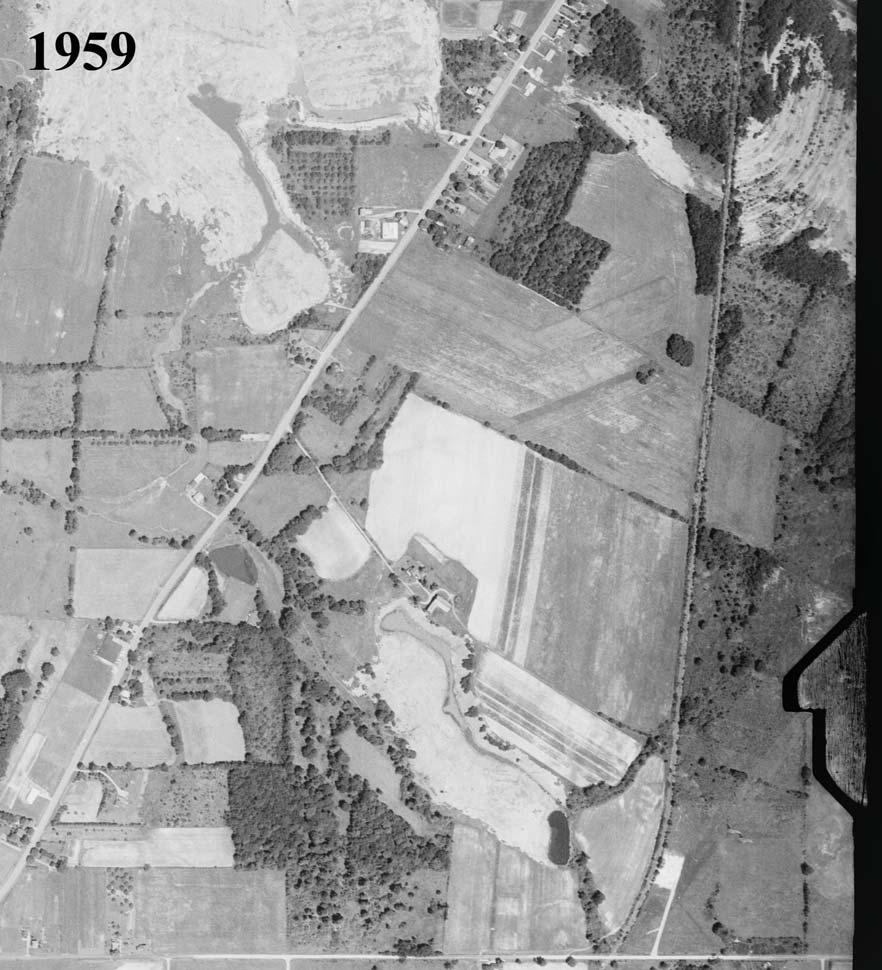
150 137
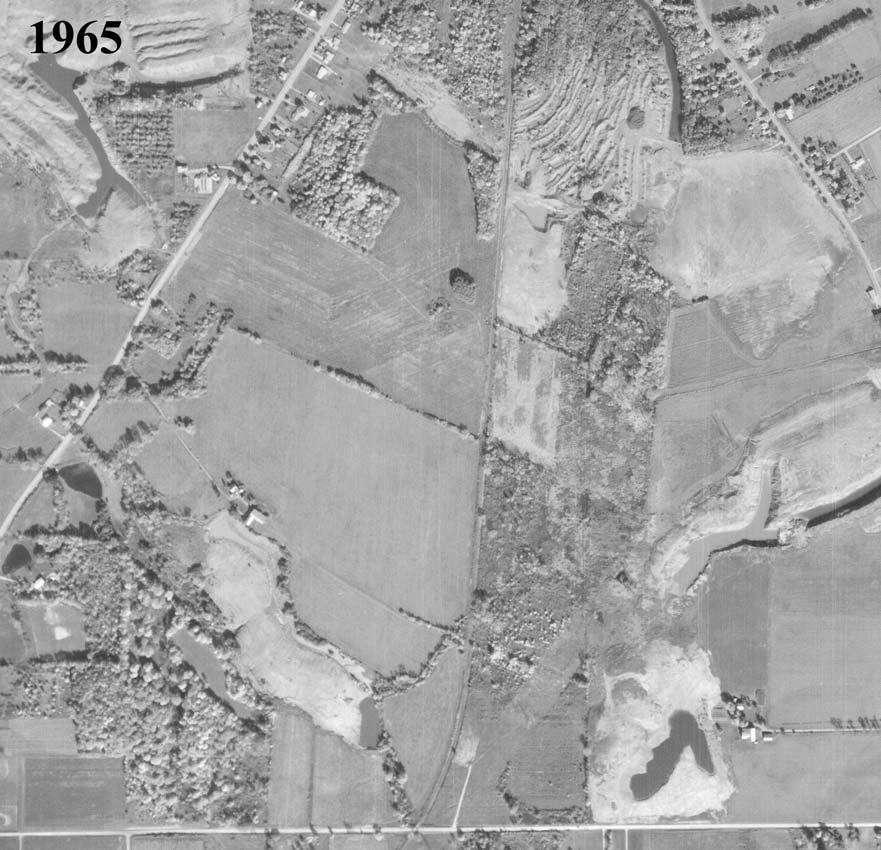
151 138
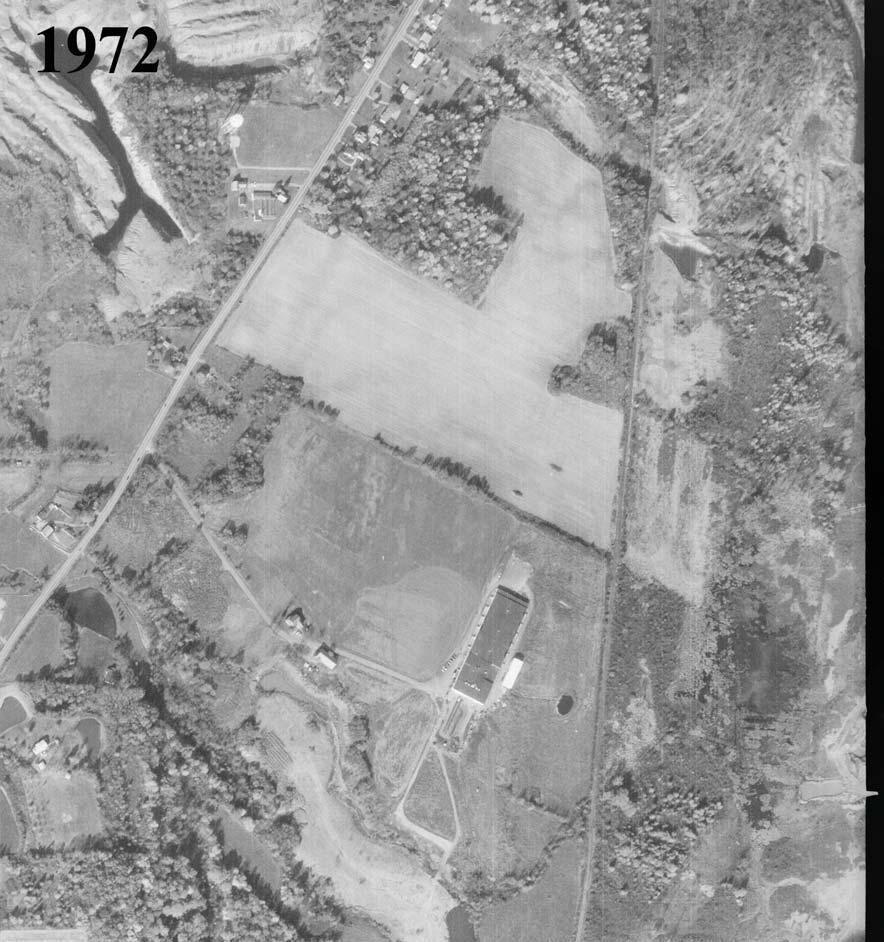
152 139
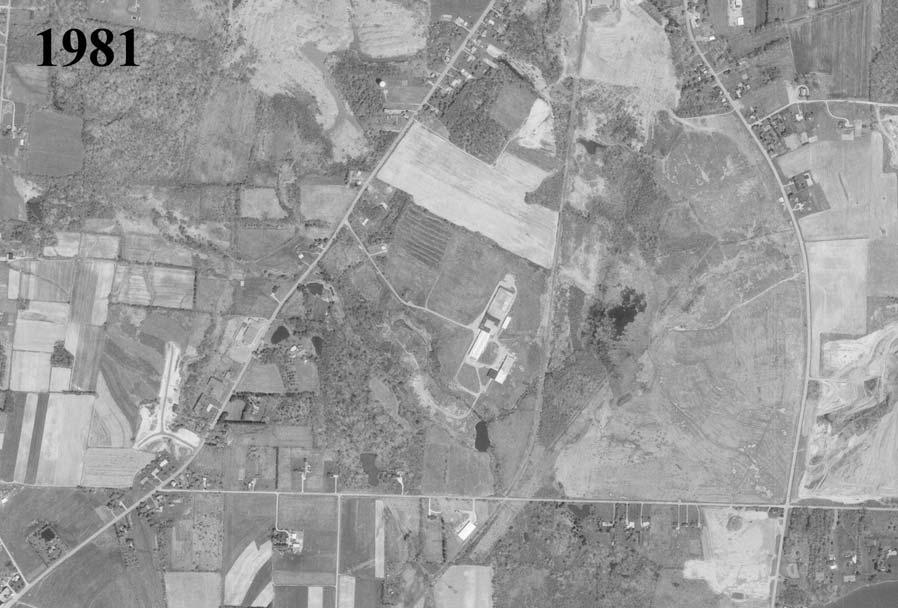
153 140
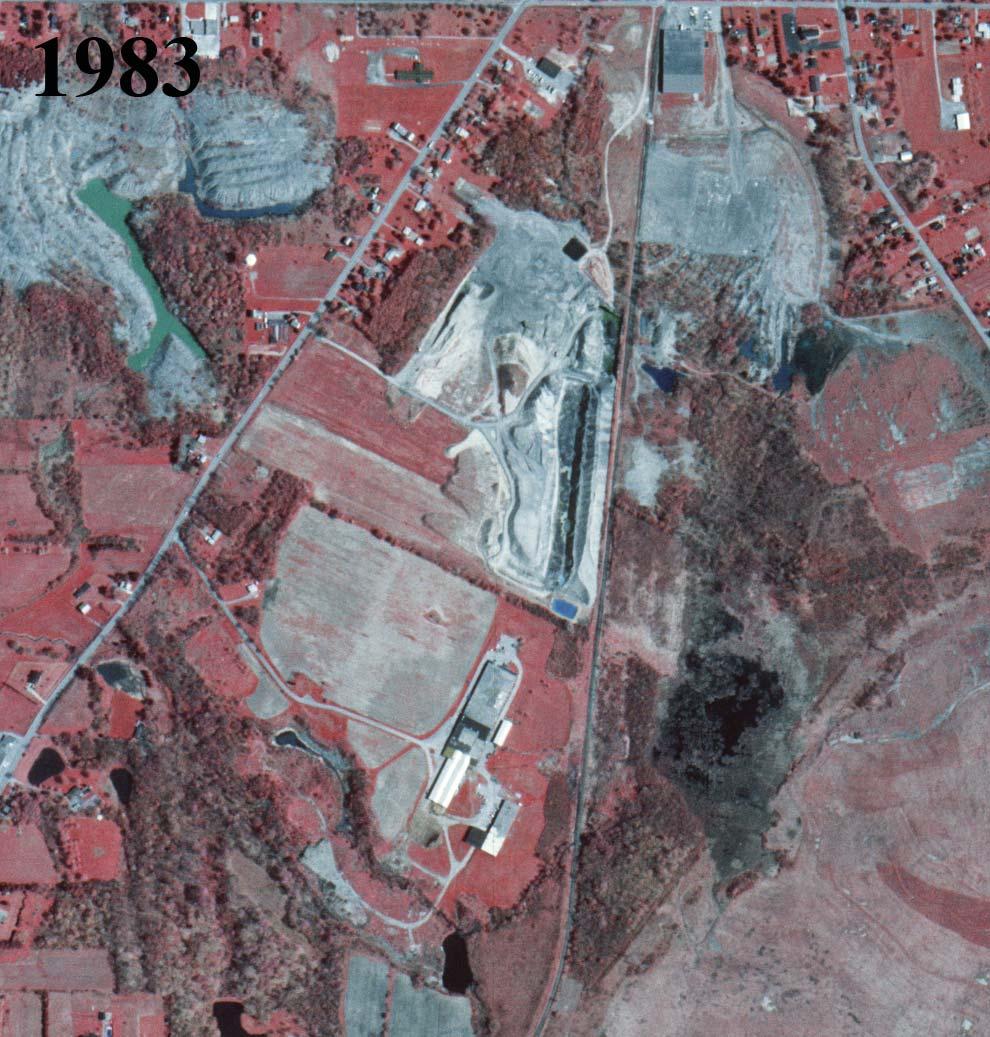
154 141
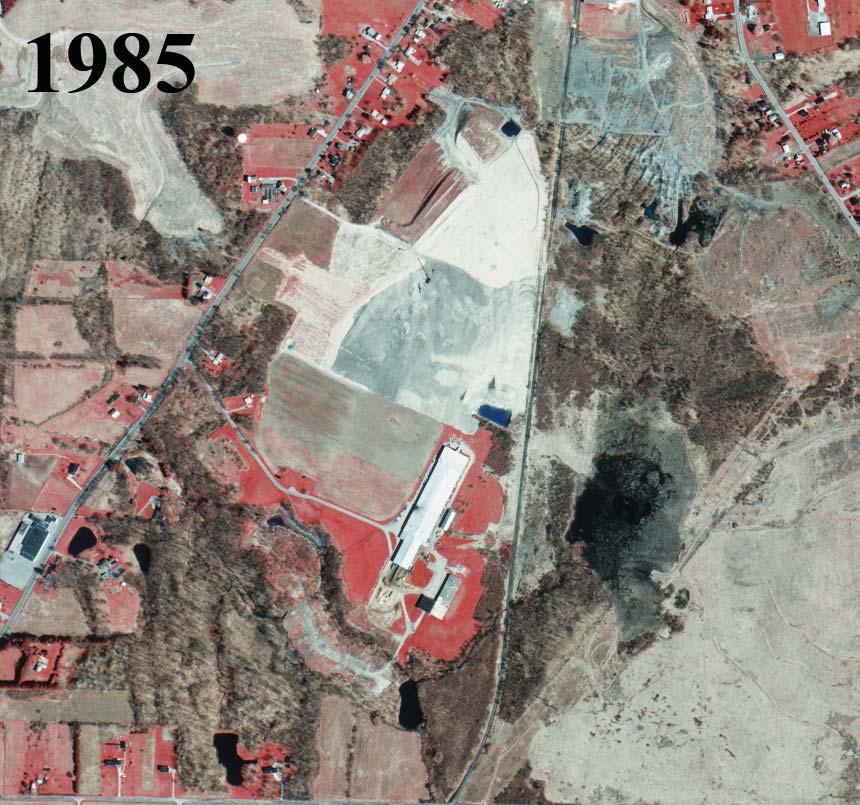
155 142
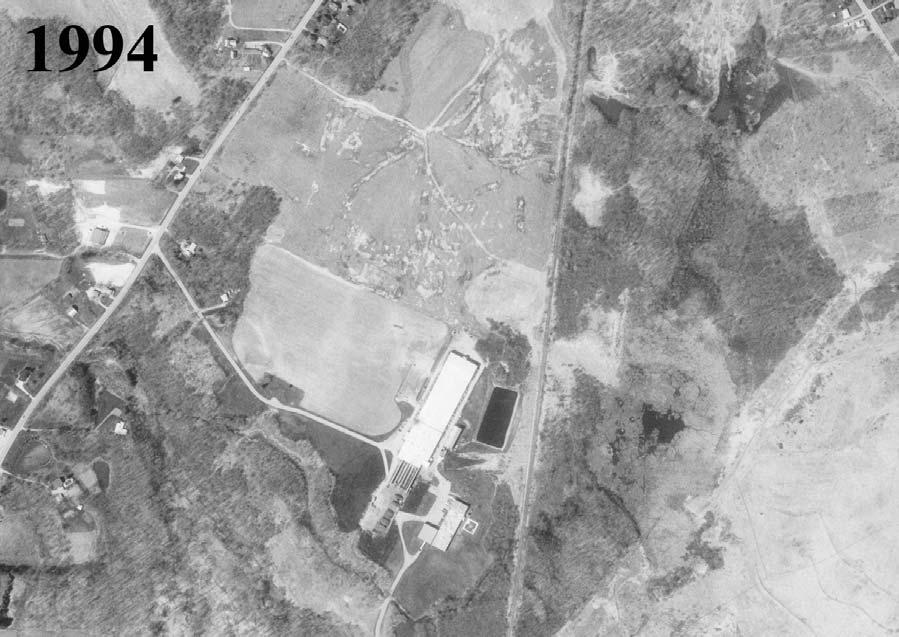
156 143
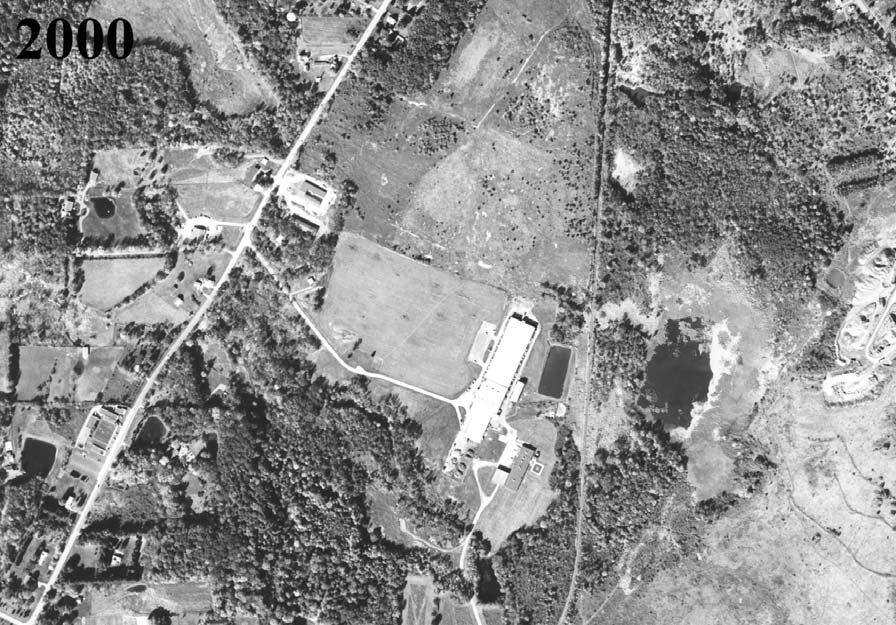
157 144
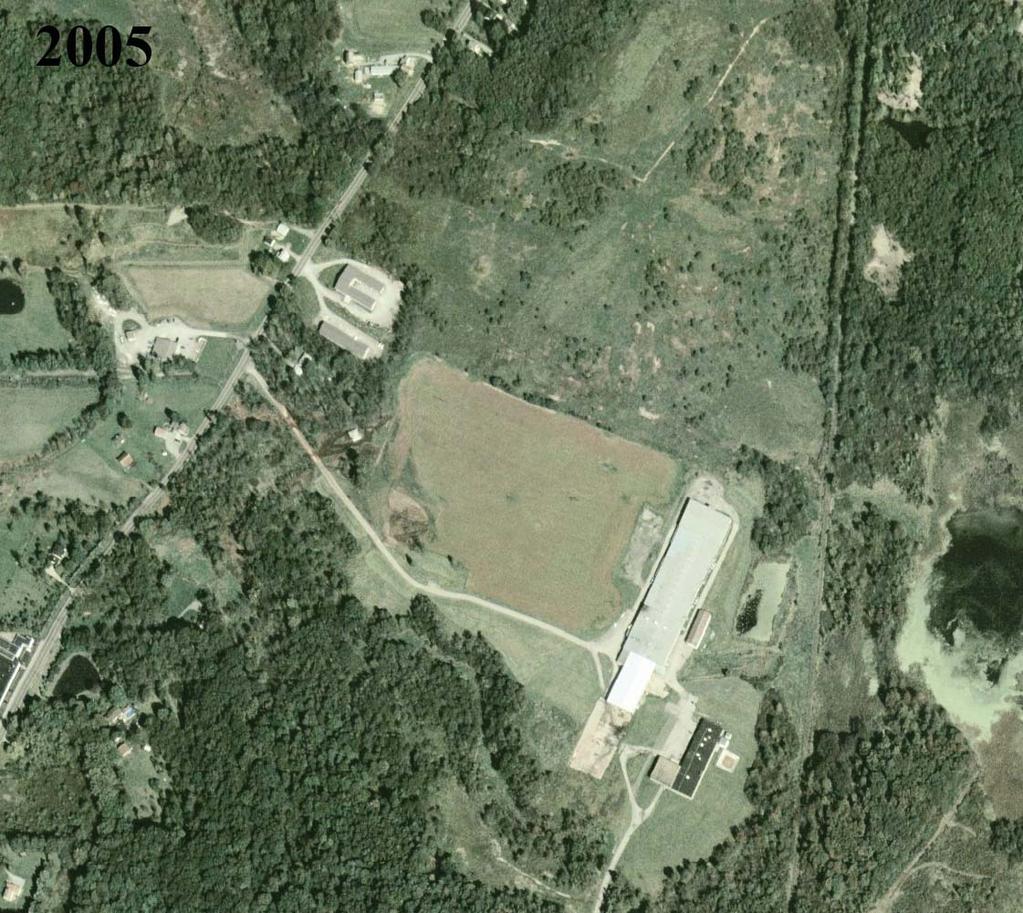
158 145
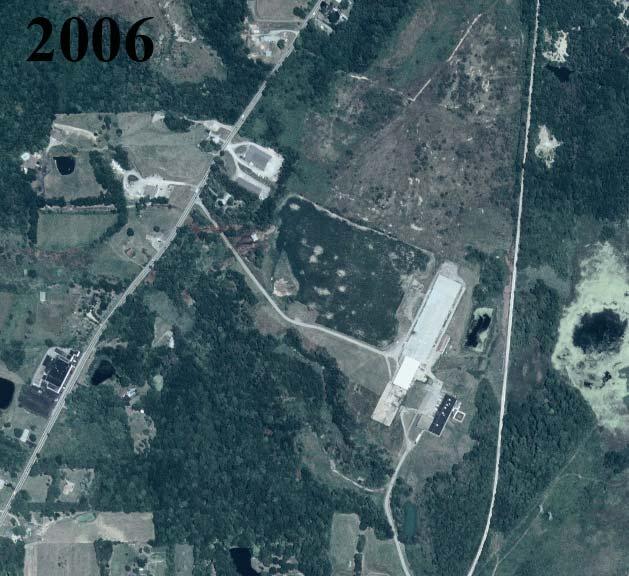
159 146
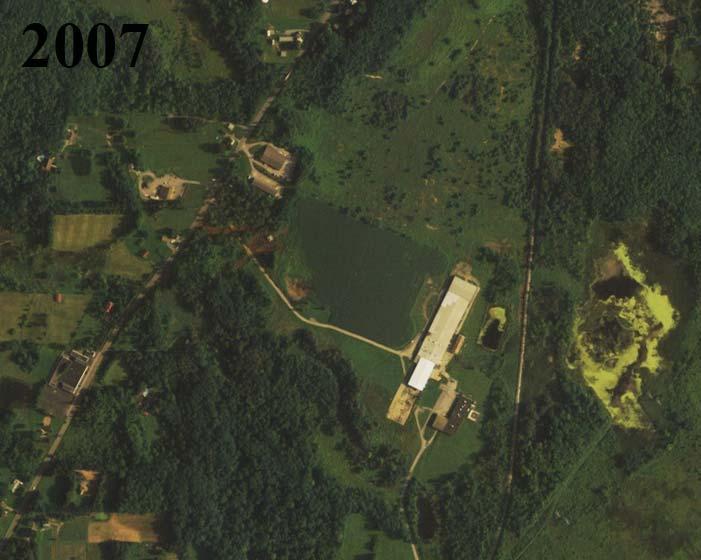
160 147
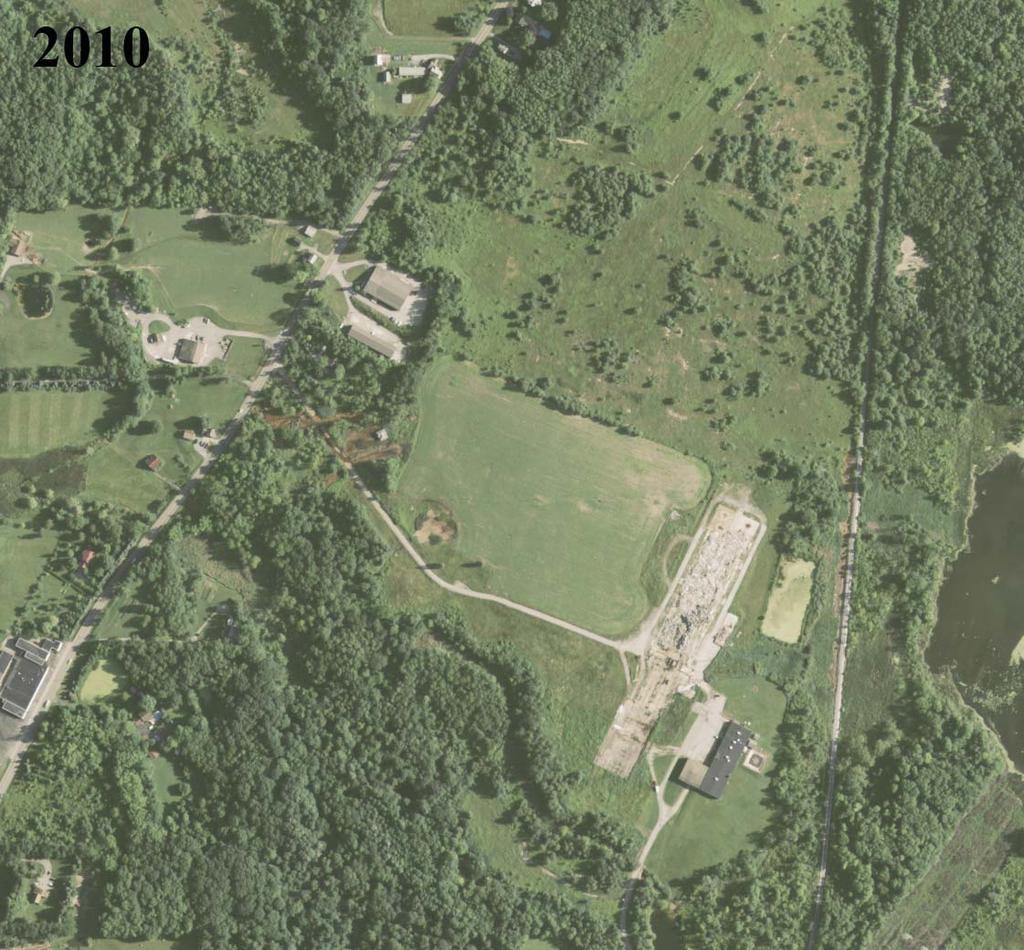
161 148
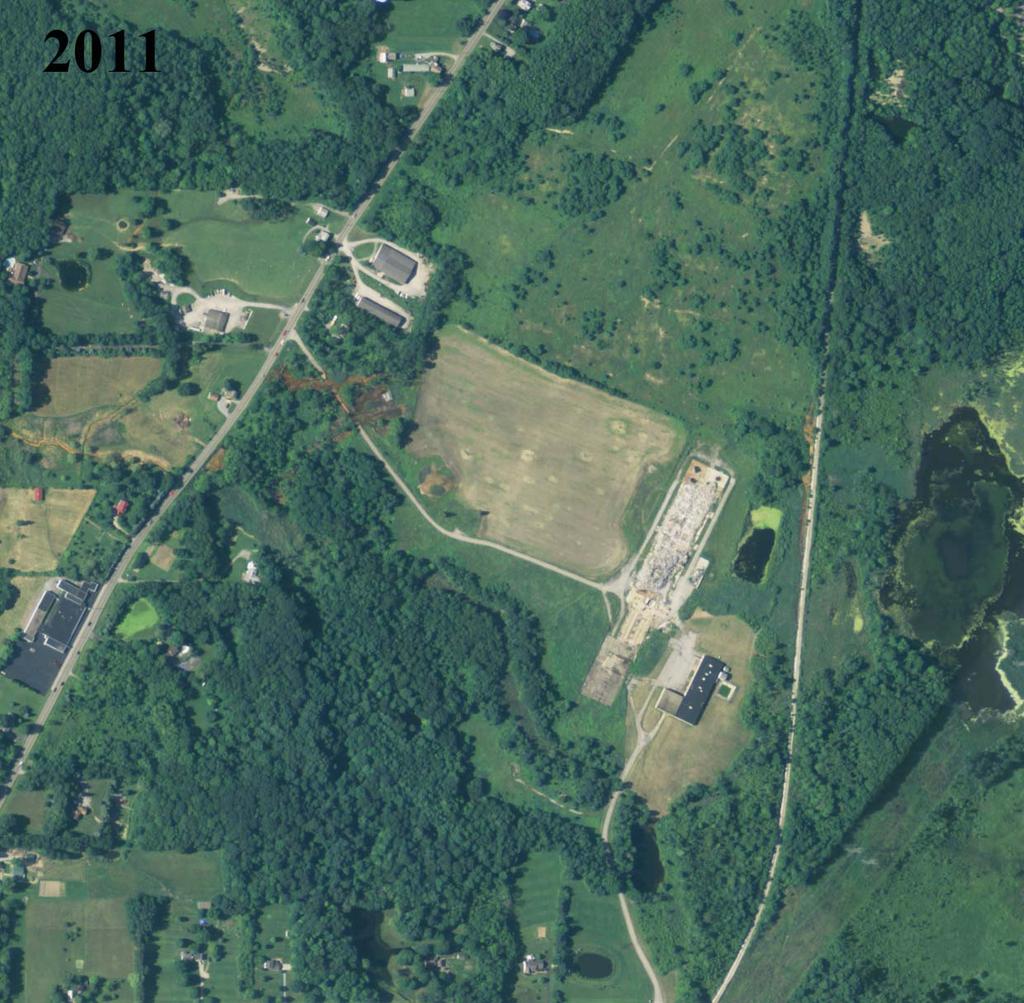
162 149
PREDICTION OF ACID MINE DRAINAGE POTENTIAL FROM COAL MINES
 PREDICTION OF ACID MINE DRAINAGE POTENTIAL FROM COAL MINES Arthur W. Rose, Professor of Geochemistry Eugene G. Williams, Professor of Geology Richard R. Parizek, Professor of Hydrogeology Acid mine drainage
Soils, Hydrogeology, and Aquifer Properties. Philip B. Bedient 2006 Rice University
 Soils, Hydrogeology, and Aquifer Properties Philip B. Bedient 2006 Rice University Charbeneau, 2000. Basin Hydrologic Cycle Global Water Supply Distribution 3% of earth s water is fresh - 97% oceans 1%
Groundwater Hydrology
 EXERCISE 12 Groundwater Hydrology INTRODUCTION Groundwater is an important component of the hydrologic cycle. It feeds lakes, rivers, wetlands, and reservoirs; it supplies water for domestic, municipal,
Terrain Units PALEOGEOGRAPHY: LANDFORM CREATION. Present Geology of NYS. Detailed Geologic Map of NYS
 NYS TOPOGRAPHY Why so? PALEOGEOGRAPHY: LANDFORM CREATION Prof. Anthony Grande AFG 014 Present Geology of NYS Detailed Geologic Map of NYS Generalized Geology Detailed Geology Hot links to the fold out
Name: Mid-Year Review #2 SAR
 Name: Mid-Year Review #2 SAR Base your answers to questions 1 through 3 on on the diagram below, which shows laboratory materials used for an investigation of the effects of sediment size on permeability,
Module 10: Resources and Virginia Geology Topic 4 Content: Virginia Geology Notes
 Virginia is composed of a very diverse landscape that extends from the beaches and barrier islands all of the way to the highly elevated Appalachian Plateau. Geologists have discovered ancient shallow
UNIT 4 SEDIMENTARY ROCKS
 UNIT 4 SEDIMENTARY ROCKS WHAT ARE SEDIMENTS Sediments are loose Earth materials (unconsolidated materials) such as sand which are transported by the action of water, wind, glacial ice and gravity. These
Maggie Payne Jim Turenne
 Maggie Payne Jim Turenne USDA-NRCS 60 Quaker Lane, Suite 46 Warwick, RI. 02886 401-822-8832 maggie.payne@ri.usda.gov U.S. Department of Agriculture 1935: Soil Conservation Service (SCS) Natural Resources
The Building of the NYC Region
 The Building of the NYC Region Definitions Fall Line marks the area where an upland region (continental bedrock) and a coastal plain meet Piedmont the plateau region of the eastern United States which
KANSAS GEOLOGICAL SURVEY Open File Report LAND SUBSIDENCE KIOWA COUNTY, KANSAS. May 2, 2007
 KANSAS GEOLOGICAL SURVEY Open File Report 2007-22 LAND SUBSIDENCE KIOWA COUNTY, KANSAS Prepared by Michael T. Dealy L.G., Manager, Wichita Operations SITE LOCATION The site was approximately four miles
Ecoregions Glossary. 7.8B: Changes To Texas Land Earth and Space
 Ecoregions Glossary Ecoregions The term ecoregions was developed by combining the terms ecology and region. Ecology is the study of the interrelationship of organisms and their environments. The term,
11/22/2010. Groundwater in Unconsolidated Deposits. Alluvial (fluvial) deposits. - consist of gravel, sand, silt and clay
 deposits. - consist of gravel, sand, silt and clay") Groundwater in Unconsolidated Deposits Alluvial (fluvial) deposits - consist of gravel, sand, silt and clay - laid down by physical processes in rivers and flood plains - major sources for water supplies
Groundwater in Unconsolidated Deposits Alluvial (fluvial) deposits - consist of gravel, sand, silt and clay - laid down by physical processes in rivers and flood plains - major sources for water supplies
Prof. Stephen A. Nelson EENS 111. Groundwater
 Page 1 of 8 Prof. Stephen A. Nelson EENS 111 Tulane University Physical Geology This page last updated on 20-Oct-2003 is water that exists in the pore spaces and fractures in rock and sediment beneath
The Geology of Sebago Lake State Park
 Maine Geologic Facts and Localities September, 2002 43 55 17.46 N, 70 34 13.07 W Text by Robert Johnston, Department of Agriculture, Conservation & Forestry 1 Map by Robert Johnston Introduction Sebago
Groundwater Resources of Missouri. Cynthia Brookshire, R. G.
 Groundwater Resources of Missouri Cynthia Brookshire, R. G. GROUNDWATER... Water beneath the Earth s surface within a zone of saturation AQUIFER... A geologic formation or group of formations that are
Shallow marine facies. Outline 13: The Paleozoic World. Shallow marine and terrestrial facies
 Outline 13: The Paleozoic World Shallow marine and terrestrial facies Shallow marine facies Sea level was much higher than today during much of the Paleozoic. Shallow epicontinental seas flooded continental
Michigan s Geology and Groundwater
 Michigan s Geology and Groundwater Ralph J. Haefner Deputy Director U.S. Geological Survey Michigan-Ohio Water Science Center Lansing, Michigan Outline About the USGS Geology 101 Michigan s geology Bedrock
AMD 101. Chemistry of Abandoned Mine Drainage. Bruce Golden WPCAMR
 AMD 101 Chemistry of Abandoned Mine Drainage Bruce Golden WPCAMR http://amrclearinghouse.org Western PA Coalition for Abandoned Mine Reclamation A helping hand to watershed groups grappling with the legacy
Glacial Geology of Moose Point State Park, ME
 Geologic Site of the Month May, 2013 Glacial Geology of Moose Point State Park, Maine 44 o 25 59.18"N, 68 o 56 37.11"W Text and photos by Woodrow B. Thompson, Department of Agriculture, Conservation &
Name. 4. The diagram below shows a soil profile formed in an area of granite bedrock. Four different soil horizons, A, B, C, and D, are shown.
 Name 1. In the cross section of the hill shown below, which rock units are probably most resistant to weathering? 4. The diagram below shows a soil profile formed in an area of granite bedrock. Four different
Unit 6: Interpreting Earth s History
 Unit 6: Interpreting Earth s History How do we know that the Earth has changed over time? Regent s Earth Science Name: Topics Relative Dating Uniformitarianism Superposition Original Horizontality Igneous
Sediment and sedimentary rocks Sediment
 Sediment and sedimentary rocks Sediment From sediments to sedimentary rocks (transportation, deposition, preservation and lithification) Types of sedimentary rocks (clastic, chemical and organic) Sedimentary
Geology 12 FINAL EXAM PREP. Possible Written Response Exam Questions
 Geology 12 FINAL EXAM PREP Possible Written Response Exam Questions Use this study guide to prepare for the written response portion of the final exam. Name FINAL EXAM - POSSIBLE WRITTEN RESPONSE QUESTIONS
TOPOGRAPHIC RELIEF MAP of NYS. LANDFORMS of NYS. Landforms. Creation of NYS Landforms 9/22/2011
 TOPOGRAPHIC RELIEF MAP of NYS LANDFORMS of NYS Prof. Anthony Grande AFG 2011 Landforms The basis of present-day landforms (surface features) is the bedrock geology that has been worked on by the forces
Connecticut's Aquifers
 Page 1 of 5 DEP Search: Connecticut's Aquifers The technical definition of the word "aquifer" is: any geologic formation capable of yielding significant quantities of water to wells. By that definition,
Chapter 13. Groundwater
 Chapter 13 Groundwater Introduction Groundwater is all subsurface water that completely fills the pores and other open spaces in rocks, sediments, and soil. Groundwater is responsible for forming beautiful
Geology and New England Landscapes
 Geology and New England Landscapes Jim Turenne, CPSS USDA-NRCS Warwick, RI. http://nesoil.com Why Geology? Provides the big picture of site conditions. Major part of soil formation (parent material and
Cretaceous, Dakota Formation, Terra Cotta Member South Side of I-70, Salina County, Kansas
 Cretaceous, Dakota Formation, Terra Cotta Member South Side of I-70, Salina County, Kansas Written By: Steven D.J. Baumann G-102010-1A Outcrop looking southeast Photo taken by: Steven Baumann on 10-20-2010
UNIT 4: Earth Science Chapter 21: Earth s Changing Surface (pages )
") CORNELL NOTES Directions: You must create a minimum of 5 questions in this column per page (average). Use these to study your notes and prepare for tests and quizzes. Notes will be turned in to your teacher
CORNELL NOTES Directions: You must create a minimum of 5 questions in this column per page (average). Use these to study your notes and prepare for tests and quizzes. Notes will be turned in to your teacher
Jim Turenne. Soils on Social Media
 Jim Turenne USDA-NRCS 60 Quaker Lane, Suite 46 Warwick, RI. 02886 401-822-8832 Jim.turenne@ri.usda.gov Soils on Social Media www.twitter.com/soilsne www.fb.com/soilsne www.nesoil.com U.S. Department of
FORENSIC GEOLOGY A CIVIL ACTION
 NAME 89.215 - FORENSIC GEOLOGY A CIVIL ACTION I. Introduction In 1982 a lawsuit was filed on behalf of eight Woburn families by Jan Schlictmann. The suit alleged that serious health effects (childhood
ADVENTURES IN WATER DEVELOPED BY LOUISVILLE WATER COMPANY
 ADVENTURES IN WATER DEVELOPED BY LOUISVILLE WATER COMPANY Tunneling for Water explains the science behind a first-of-its-kind project in the world! Louisville Water Company is the first water utility
EROSIONAL FEATURES. reflect
 reflect Have you ever looked at the land around you and wondered what processes shaped what you see? Perhaps you see mountains, valleys, rivers, or canyons. Do you know how long these geologic features
GEOLOGY MEDIA SUITE Chapter 5
 UNDERSTANDING EARTH, SIXTH EDITION GROTZINGER JORDAN GEOLOGY MEDIA SUITE Chapter 5 Sedimentation Rocks Formed by Surface Processes 2010 W.H. Freeman and Company Mineralogy of sandstones Key Figure 5.12
Section I: Multiple Choice Select the best answer to each question. Mark your final answer on the answer sheet. (1 pt each)
") Sedimentary Rocks & Surface Processes Quest Name: Earth Science 2013 Block: Date: Section I: Multiple Choice Select the best answer to each question. Mark your final answer on the answer sheet. (1 pt each)
Sedimentary Rocks & Surface Processes Quest Name: Earth Science 2013 Block: Date: Section I: Multiple Choice Select the best answer to each question. Mark your final answer on the answer sheet. (1 pt each)
Surface Processes Focus on Mass Wasting (Chapter 10)
") Surface Processes Focus on Mass Wasting (Chapter 10) 1. What is the distinction between weathering, mass wasting, and erosion? 2. What is the controlling force in mass wasting? What force provides resistance?
Surface Processes Focus on Mass Wasting (Chapter 10) 1. What is the distinction between weathering, mass wasting, and erosion? 2. What is the controlling force in mass wasting? What force provides resistance?
Figure 1 The map shows the top view of a meandering stream as it enters a lake. At which points along the stream are erosion and deposition dominant?
 1. In which type of climate does chemical weathering usually occur most rapidly? 1. hot and dry 3. cold and dry 2. hot and wet 4. cold and wet 2. Figure 1 The map shows the top view of a meandering stream
Erosional Features. What processes shaped this landscape?
 Have you ever looked at the land around you and wondered what processes shaped what you see? Perhaps you see mountains, valleys, rivers, or canyons. Do you know how long these geologic features have been
Chapter 2 Planet Earth
 Chapter 2 Planet Earth Section Notes Earth and the Sun s Energy Water on Earth The Land Close-up The Water Cycle World Almanac Major Eruptions in the Ring of Fire Quick Facts Chapter 2 Visual Summary Video
Sediment and Sedimentary rock
 Sediment and Sedimentary rock Sediment: An accumulation of loose mineral grains, such as boulders, pebbles, sand, silt or mud, which are not cemented together. Mechanical and chemical weathering produces
ENGINEER S CERTIFICATION OF FAULT AREA DEMONSTRATION (40 CFR )
") PLATTE RIVER POWER AUTHORITY RAWHIDE ENERGY STATION BOTTOM ASH TRANSFER (BAT) IMPOUNDMENTS LARIMER COUNTY, CO ENGINEER S CERTIFICATION OF FAULT AREA DEMONSTRATION (40 CFR 257.62) FOR COAL COMBUSTION RESIDUALS
PLATTE RIVER POWER AUTHORITY RAWHIDE ENERGY STATION BOTTOM ASH TRANSFER (BAT) IMPOUNDMENTS LARIMER COUNTY, CO ENGINEER S CERTIFICATION OF FAULT AREA DEMONSTRATION (40 CFR 257.62) FOR COAL COMBUSTION RESIDUALS
Lab 7: Sedimentary Structures
 Name: Lab 7: Sedimentary Structures Sedimentary rocks account for a negligibly small fraction of Earth s mass, yet they are commonly encountered because the processes that form them are ubiquitous in the
Weathering and Erosion
 Have you ever looked at the land around you and wondered how it was shaped? The geologic features that help define the world are still being shaped by the natural processes of weathering, erosion, and
LANDFORMS of NYS. Landforms. Exercise 4 9/13/2012. TOPOGRAPHIC RELIEF MAP of NYS. Physiographic map of NYS and vicinity showing Surface Features
 TOPOGRAPHIC RELIEF MAP of NYS LANDFORMS of NYS Prof. Anthony Grande AFG 2012 Landforms REMINDER: The basis of present-day landforms (surface features) is the bedrock geology that has been worked on by
Landslides and Ground Water Permeability with Respect to the. Contact Point of Glacial Lake Vermont and the Champlain Sea
 Landslides and Ground Water Permeability with Respect to the Contact Point of Glacial Lake Vermont and the Champlain Sea Sediments at Town Line Brook, Winooski, VT Michala Peabody Lara Vowles Abstract:
Chapter 2. Regional Landscapes and the Hydrologic Cycle
 Chapter 2. Regional Landscapes and the Hydrologic Cycle W. Lee Daniels Department of Crop and Soil Environmental Sciences, Virginia Tech Table of Contents Introduction... 23 Soils and landscapes of the
 12 10 8 6 4 2 0 40-50 50-60 60-70 70-80 80-90 90-100 Fresh Water What we will cover The Hydrologic Cycle River systems Floods Groundwater Caves and Karst Topography Hot springs Distribution of water in
3/5/05 Dr. Stewart 1
 I. Physiography of Appalachian Mountains A. Introduction 1. These mountains extend from NE Canada to Georgia 2. They are the remains of a deeply eroded, ancient mountain chain once larger than the Himalayans
3. The diagram below shows how scientists think some of Earth's continents were joined together in the geologic past.
 1. The map below shows the present-day locations of South America and Africa. Remains of Mesosaurus, an extinct freshwater reptile, have been found in similarly aged bedrock formed from lake sediments
Answers: Internal Processes and Structures (Isostasy)
") Answers: Internal Processes and Structures (Isostasy) 1. Analyse the adjustment of the crust to changes in loads associated with volcanism, mountain building, erosion, and glaciation by using the concept
Answers: Internal Processes and Structures (Isostasy) 1. Analyse the adjustment of the crust to changes in loads associated with volcanism, mountain building, erosion, and glaciation by using the concept
Physical Geography A Living Planet
 Physical Geography A Living Planet The geography and structure of the earth are continually being changed by internal forces, like plate tectonics, and external forces, like the weather. Iguaçu Falls at
GEOL.3250 Geology for Engineers Glacial Geology
 GEOL.3250 Geology for Engineers Glacial Geology NAME Part I: Continental Glaciation Continental glaciers are large ice sheets that cover substantial portions of the land area. In the region of accumulation
Topic 6: Weathering, Erosion and Erosional-Deposition Systems (workbook p ) Workbook Chapter 4, 5 WEATHERING
 Workbook Chapter 4, 5 WEATHERING") Topic 6: Weathering, Erosion and Erosional-Deposition Systems (workbook p. 95-125) Workbook Chapter 4, 5 THE BIG PICTURE: Weathering, erosion and deposition are processes that cause changes to rock material
Topic 6: Weathering, Erosion and Erosional-Deposition Systems (workbook p. 95-125) Workbook Chapter 4, 5 THE BIG PICTURE: Weathering, erosion and deposition are processes that cause changes to rock material
Your web browser (Safari 7) is out of date. For more security, comfort and the best experience on this site: Update your browser Ignore
 is out of date. For more security, comfort and the best experience on this site: Update your browser Ignore") Your web browser (Safari 7) is out of date. For more security, comfort and the best experience on this site: Update your browser Ignore BEDRO CK For the complete encyclopedic entry with media resources,
Your web browser (Safari 7) is out of date. For more security, comfort and the best experience on this site: Update your browser Ignore BEDRO CK For the complete encyclopedic entry with media resources,
Follow this and additional works at: Part of the Geology Commons
 Western Michigan University ScholarWorks at WMU Michigan Geological Repository for Research and Education Geosciences 2016 Geology of Michigan William B. Harrison III Michigan Geological Repository for
Paleo Lab #4 - Sedimentary Environments
 Paleo Lab #4 - Sedimentary Environments page - 1. CHARACTERISTICS OF SEDIMENT Grain size and grain shape: The sizes and shapes of sedimentary particles (grains) are modified considerably during their transportation
1. The timeline below represents time on Earth from the beginning of the Paleozoic Era Ato the present B.
 Name Roy G Biv 1. The timeline below represents time on Earth from the beginning of the Paleozoic Era Ato the present B. Which numbered position best represents the time when humans first appeared in the
LESSONS LEARNED FROM MINING-INFLUENCED WATERS STUDIES AT THE NEW MEXICO BUREAU OF GEOLOGY AND MINERAL RESOURCES
 LESSONS LEARNED FROM MINING-INFLUENCED WATERS STUDIES AT THE NEW MEXICO BUREAU OF GEOLOGY AND MINERAL RESOURCES Virginia T. McLemore New Mexico Bureau of Geology and Mineral Resources New Mexico Institute
1. Base your answer to the following question on The diagram below represents a part of the crystal structure of the mineral kaolinite.
 1. Base your answer to the following question on The diagram below represents a part of the crystal structure of the mineral kaolinite. An arrangement of atoms such as the one shown in the diagram determines
Mammoth Cave National Park, Kentucky
 Mammoth Cave National Park, Kentucky Objectives of Today s Lecture Refresher on Sedimentary Depositional Systems and Rock Classifications Transgressive and Regressive Marine Environments Carbonate Depositional
Cattaraugus Creek: A Story of Flowing Water and the Geology of the Channel It Flows Through Presentation to West Valley Citizen Task Force 4/27/16
 Cattaraugus Creek: A Story of Flowing Water and the Geology of the Channel It Flows Through Presentation to West Valley Citizen Task Force 4/27/16 Raymond C. Vaughan, Ph.D. What happens if you drop a
Earth s Structure and Natural Processes Practice Test
 Name: Earth s Structure and Natural Processes Practice Test Section: Directions: For each of the questions or incomplete statements below, choose the best of the answer choices given and write your answer
STUDY GUIDE FOR CONTENT MASTERY. Movement and Storage of Groundwater
 Groundwater SECTION 10.1 Movement and Storage of Groundwater In your textbook, read about the hydrosphere, precipitation and groundwater, and groundwater storage. Use the following terms to complete the
Practice 3rd Quarter Exam Page 1
 Name 1. Which characteristic would most likely remain constant when a limestone cobble is subjected to extensive abrasion? A) shape B) mass C) volume D) composition 2. Which activity demonstrates chemical
Plan of Development Mountain Valley Pipeline Project. APPENDIX P Plan for Unanticipated Discovery of Paleontological Resources
 APPENDIX P Plan for Unanticipated Discovery of Paleontological Resources Appendix P Plan for Unanticipated Discovery of Paleontological Resources Prepared by: TABLE OF CONTENTS 1.0 INTRODUCTION... 1 1.1
PALEOGEOGRAPHY of NYS. Definitions GEOLOGIC PROCESSES. Faulting. Folding 9/6/2012. TOPOGRAPHIC RELIEF MAP of NYS GRADATIONAL TECTONIC
 TOPOGRAPHIC RELIEF MAP of NYS PALEOGEOGRAPHY of NYS Prof. Anthony Grande AFG 2012 Definitions GEOLOGIC PROCESSES Geography: study of people living on the surface of the earth. Geology: the scientific study
SL GEOLOGY AND MINING. Coal bearing strata in the project area are referable primarily to the Allegheny Group of
 SL-145-1 GEOLOGY AND MINING Coal bearing strata in the project area are referable primarily to the Allegheny Group of Pennsylvania age. These rocks occur as dissected remnants overlying the ridge-forming
Bowen s Chemical Stability Series
 Lab 5 - Identification of Sedimentary Rocks Page - Introduction Sedimentary rocks are the second great rock group. Although they make up only a small percentage of the rocks in the earth s crust (~5%)
,Baynes Lake. TO...?&.?...A 2...KO.?'!!&... Sr. *logical Engineer
 > i evernment OF BRITISH COLUMBIA a TO...?&.?...A 2....KO.?'!!&... Sr. *logical Engineer... Grou,,water. Section Hydrology Division Wat.er... In~.~s.tiga.ti.On.s..Branck.... 5 u BJECT...C;.roun.dw.ater...Snve
WATER ON AND UNDER GROUND. Objectives. The Hydrologic Cycle
 WATER ON AND UNDER GROUND Objectives Define and describe the hydrologic cycle. Identify the basic characteristics of streams. Define drainage basin. Describe how floods occur and what factors may make
STUDY GUIDE FOR CONTENT MASTERY. Surface Water Movement
 Surface Water SECTION 9.1 Surface Water Movement In your textbook, read about surface water and the way in which it moves sediment. Complete each statement. 1. An excessive amount of water flowing downslope
HW #2 Landscape Travel from A to B 12,
 HW #2 Landscape 2016 Section: Name: ate: 1. ase your answer(s) to the following question(s) on the map below, which represents two bridges that cross the Green River. Letters,, and represent locations
Biosphere. All living things, plants, animals, (even you!) are part of the zone of the earth called the biosphere.
 are part of the zone of the earth called the biosphere.") Unit 1 Study Guide Earth s Spheres Biosphere All living things, plants, animals, (even you!) are part of the zone of the earth called the biosphere. Hydrosphere Water covers ¾ of the earth, made up mostly
Unit 1 Study Guide Earth s Spheres Biosphere All living things, plants, animals, (even you!) are part of the zone of the earth called the biosphere. Hydrosphere Water covers ¾ of the earth, made up mostly
Directed Reading. Section: Types of Maps
 Skills Worksheet Directed Reading Section: Types of Maps 1. What are some of the characteristics of an area shown on maps used by Earth scientists? a. types of animals, types of plants, types of minerals
Lecture Outlines PowerPoint. Chapter 5 Earth Science 11e Tarbuck/Lutgens
 Lecture Outlines PowerPoint Chapter 5 Earth Science 11e Tarbuck/Lutgens 2006 Pearson Prentice Hall This work is protected by United States copyright laws and is provided solely for the use of instructors
REMEDIATION OF SALT IMPACTED GROUNDWATER WITH ELECTROKINETICS. Paper by: Sean Kelly, Rick Churko, Sean Frisky, Anjum Mullick, Stuart Torr.
 REMEDIATION OF SALT IMPACTED GROUNDWATER WITH ELECTROKINETICS. Paper by: Sean Kelly, Rick Churko, Sean Frisky, Anjum Mullick, Stuart Torr. Alberta Transportation is supporting leading research in the use
Science EOG Review: Landforms
 Mathematician Science EOG Review: Landforms Vocabulary Definition Term canyon deep, large, V- shaped valley formed by a river over millions of years of erosion; sometimes called gorges (example: Linville
Sediment. Weathering: mechanical and chemical decomposition and disintegration of rock and minerals at the surface
 Sediment Some basic terminology Weathering: mechanical and chemical decomposition and disintegration of rock and minerals at the surface Erosion: removal of weathered rock and minerals from one place to
THE BEDROCK SURFACE AND FORMER DRAINAGE SYSTEMS OF MONTGOMERY COUNTY, OHIO 1
 THE BEDROCK SURFACE AND FORMER DRAINAGE SYSTEMS OF MONTGOMERY COUNTY, OHIO 1 STANLEY E. NORRIS, Geologist, U. S. Geological Survey, Columbus, Ohio INTRODUCTION The bedrock surface of Montgomery County,
Which particle of quartz shows evidence of being transported the farthest distance by the stream? A) B) C) D)
 B) C) D)") 1. Base your answer to the following question on the block diagram below, which represents the landscape features associated with a meandering stream. WX is the location of a cross section. Location A
1. Base your answer to the following question on the block diagram below, which represents the landscape features associated with a meandering stream. WX is the location of a cross section. Location A
3.0 GEOLOGY AND HYDROGEOLOGY
 3.0 GEOLOGY AND HYDROGEOLOGY 3.1 Methodology The Geological Survey of Ireland (GSI) publication Geology of South Cork was consulted to establish the nature of the bedrock lithology and Quaternary sediments.
Lecture Outline Wednesday - Friday February 14-16, 2018
 Lecture Outline Wednesday - Friday February 14-16, 2018 Quiz 2 scheduled for Friday Feb 23 (Interlude B, Chapters 6,7) Questions? Chapter 6 Pages of the Past: Sedimentary Rocks Key Points for today Be
Which map shows the stream drainage pattern that most likely formed on the surface of this volcano? A) B)
 B)") 1. When snow cover on the land melts, the water will most likely become surface runoff if the land surface is A) frozen B) porous C) grass covered D) unconsolidated gravel Base your answers to questions
1. When snow cover on the land melts, the water will most likely become surface runoff if the land surface is A) frozen B) porous C) grass covered D) unconsolidated gravel Base your answers to questions
Geologic Trips San Francisco and the Bay Area
 Excerpt from Geologic Trips San Francisco and the Bay Area by Ted Konigsmark ISBN 0-9661316-4-9 GeoPress All rights reserved. No part of this book may be reproduced without written permission in writing,
Introduction to Soil Science and Wetlands Kids at Wilderness Camp
 Introduction to Soil Science and Wetlands Kids at Wilderness Camp Presented by: Mr. Brian Oram, PG, PASEO B.F. Environmental Consultants http://www.bfenvironmental.com and Keystone Clean Water Team http://www.pacleanwater.org
Phanerozoic (last 0.54 by) Tectonics Climate Life
 Tectonics Climate Life") Phanerozoic (last 0.54 by) Tectonics Climate Life Tools for Locating Past Continent Positions Fossils depending on climate Alignment of geological features Geometrical fit of continental margins Similarity
Phanerozoic (last 0.54 by) Tectonics Climate Life Tools for Locating Past Continent Positions Fossils depending on climate Alignment of geological features Geometrical fit of continental margins Similarity
Required Materials Plummer, C., Physical geology. Columbus, OH: McGraw Hill Higher Education
 Butler Community College Science, Technology, Engineering, and Math Division Robert Carlson Revised Fall 2017 Implemented Spring 2018 Textbook Update Spring 2018 COURSE OUTLINE Physical Geology Course
Structural Geology Lab. The Objectives are to gain experience
 Geology 2 Structural Geology Lab The Objectives are to gain experience 1. Drawing cross sections from information given on geologic maps. 2. Recognizing folds and naming their parts on stereoscopic air
Pratice Surface Processes Test
 1. The cross section below shows the movement of wind-driven sand particles that strike a partly exposed basalt cobble located at the surface of a windy desert. Which cross section best represents the
mountain rivers fixed channel boundaries (bedrock banks and bed) high transport capacity low storage input output
 high transport capacity low storage input output") mountain rivers fixed channel boundaries (bedrock banks and bed) high transport capacity low storage input output strong interaction between streams & hillslopes Sediment Budgets for Mountain Rivers Little
mountain rivers fixed channel boundaries (bedrock banks and bed) high transport capacity low storage input output strong interaction between streams & hillslopes Sediment Budgets for Mountain Rivers Little
MEMORANDUM. wa.tsr..-z.n~.e.s-t.i~at.i.o.ns... Branch... Mr. Webster contends that prior to excavation of the gravel
 TO... J. C. Foweraker 2... Head Gr o w a t er S e c t i on... Hyar....og~~~.~.~vis.ion... wa.tsr..-z.n~.e.s-t.i~at.i.o.ns... Branch... eernment OF BRITISH COLUMBIA MEMORANDUM II 0 PROM A. P. Kohut, Geological
Sedimentary Geology. Strat and Sed, Ch. 1 1
 Sedimentary Geology Strat and Sed, Ch. 1 1 Sedimentology vs. Stratigraphy Sedimentology is the study of the origin and classification of sediments and sedimentary rocks Mostly the physical and chemical
Pre-Lab Reading Questions ES202
 ES202 The are designed to encourage students to read lab material prior to attending class during any given week. Reading the weekly lab prior to attending class will result in better grade performance
EPS 50 - Lab 10: Groundwater Flow and Glaciers
 Name: EPS 50 - Lab 10: Groundwater Flow and Glaciers Part 1: Groundwater Flow Part 2: Darcy s Law Part 3: Glacial Deposits and Flow -Chapter 17, p. 478-492: Hydrology of Groundwater -Chapter 17, p. 485-486:
Weathering, Erosion and Deposition
 Weathering, Erosion and Deposition Shaping the Earth s Surface Weathering the process of breaking down rocks into smaller fragments Erosion the transport of rock fragments from one location to another
Earth s Dynamic Surface
 Earth s Dynamic Surface Key Concepts What is the difference between physical and chemical weathering? How do water, ice, and wind change Earth s surface? Changing Earth s Surface What do you think? Read
Laboratory Exercise #3 The Hydrologic Cycle and Running Water Processes
 Laboratory Exercise #3 The Hydrologic Cycle and Running Water Processes page - 1 Section A - The Hydrologic Cycle Figure 1 illustrates the hydrologic cycle which quantifies how water is cycled throughout
Name: Period: Date: ID: A. Circle the choice that best completes the statement or answers the question and write the letter on the blank.
 Name: Period: _ Date: _ ID: A Unit 7 Practice Circle the choice that best completes the statement or answers the question and write the letter on the blank. 1. What term describes the movement of rock
Wisconsin s Hydrogeology: an overview
 2012 Soil and Water Conservation Society Conference Stevens Point, WI Feb 9, 2012 Wisconsin s Hydrogeology: an overview Ken Bradbury Wisconsin Geological and Natural History Survey University of Wisconsin-Extension
SAMPLE QUESTIONS FOR GEOLOGY 103, TEST 1
 SAMPLE QUESTIONS FOR GEOLOGY 103, TEST 1 The correct answers are listed at the bottom (no peeking!). These questions are to give you an idea of the type of questions that will be asked. They are not a