ESTUARINE HABITAT MAPPING IN THE DERWENT 2007 A Resurvey of Marine Habitats by SeaMap Tasmania
|
|
|
- Bethanie Craig
- 5 years ago
- Views:
Transcription

1 ESTUARINE HABITAT MAPPING IN THE DERWENT 2007 A Resurvey of Marine Habitats by SeaMap Tasmania V.L Lucieer, M. Lawler, M. Morffew and A. Pender June 2007
2 2
3 ESTUARINE HABITAT MAPPING IN THE DERWENT 2007 A Resurvey of Marine Habitats by SeaMap Tasmania V.L Lucieer, M. Lawler, M. Morffew and A. Pender Summary The Derwent Estuary is a large drowned river valley situated in south-east Tasmania that extends for a distance of 52 kilometres and covers an area of around 195 km 2 between Iron Pot and New Norfolk. The physical structure of the estuary varies substantially along its length, with the upper reaches highly stratified due to consistent freshwater input from the Derwent River and the lower reaches generally well mixed. The freshwater tends to flow on the surface along the eastern shore with saline water travelling upstream on the bottom. In 2001 the Derwent Estuary was first mapped by SeaMap Tasmania (Marine Research Laboratories, Tasmanian Aquaculture and Fisheries Institute). This year (2007), TAFI along with the Derwent Estuary Program (DEP) initiated a remap of the Derwent Estuary to update the bathymetric and habitat distribution GIS databases. The Derwent Estuary Program is committed to improving the environmental management strategy for the Derwent Estuary, together with an associated long-term monitoring program and agreements for implementation of specific environmental improvement programs. The results of this co funded survey provide natural resource managers, industry and the community with the information needed to contribute to biodiversity conservation and natural resource management of the Derwent Estuary. 3
4 Table of Contents 1. Introduction Methods Acoustic Data Collection Bathymetry Tidal correction of bathymetric data Bathymetric contour generation Video Data Collection Cartography Results Bathymetry Section A: Upper: Bridgewater Bridge to New Norfolk Habitat Distribution Algal Distribution Seagrass Distribution Section B: Middle: Tasman Bridge to Bridgewater Bridge Habitat Distribution Algal Distribution Seagrass Distribution Section C: Lower: Tasman Bridge to Iron Pot Habitat Distribution Algal Distribution Seagrass Distribution Introduced Species Summary of habitats across the Derwent Estuary Benthic habitat maps of the Derwent Estuary Conclusions...81 References...81 Appendix 1: Video Transect Locations...83 Appendix 2: Video Transect Descriptions...84 Appendix 3. Image Mapper CD...89 Appendix 4. Derwent Habitats and Bathymetry
5 1. Introduction The distribution of the Derwent Estuary s sub-tidal habitats between Iron Pot and New Norfolk were remapped between April and June 2007 in a study initiated by the Derwent Estuary Program. This report details marine habitats that were identified through field mapping using a combination of an echo-sounder and video assessment. Habitats were classified into several categories that generally represent seagrass, consolidated habitat and unconsolidated habitats. A number of video transects were also conducted across different habitats in order to describe the dominant flora. The estuary was classified and analysed in three sections, identified as the lower, middle and upper reaches, due to differences in the physical aspects of shoreline morphology, bathymetry and salinity. Rocky reef habitats occurred primarily in the lower reaches of the Derwent Estuary, although some narrow margins of reef were also present in the middle reaches. The structure of the macroalgae assemblages that occurred on these reefs varied substantially between eastern and western shorelines, position along the estuary and depth consistent with the results of the initial survey in 2001 (Jordan et al, 2001). In general, the habitat was dominated in the shallow depths by Lessonia corrugata and Ecklonia radiata while Carpoglossum confluens, E. radiata, Caulerpa sp., and unidentified red algae dominated the deeper section. Parts of the reef along the western shoreline also had a canopy Macrocystis pyrifera. The introduced algae Undaria pinnatifida also occurred in small amounts on the western shoreline between Tinderbox and the Alum Cliffs (Edgar 1997). The diversity and abundance of macroalgae decreased in the northern part of the lower reaches, with only small amounts of red and brown algae present on the rocky substrates within the middle reaches. Seagrass habitats were restricted to small beds within the lower (Halfmoon Bay and Opossum Bay) and middle parts (Cornelian Bay, Wilkinsons Point, Dogshear Point, Woodville Bay and Old Beach) of the Derwent Estuary that had a combined area of around 0.17 km 2. The beds consist primarily of Heterozostera tasmanica, although small amounts of Zostera muelleri were present on the inner margin of beds in the middle reaches. No beds of seagrass were found in either the northern or southern end of Ralphs Bay. The survey of 2001 was conducted in early winter and so it was not possible to compare to the results of this study (2007) which was conducted in early Autumn. Aquatic macrophytes occurred in large beds in the northern part of the middle section and southern part of the upper section of the Derwent Estuary. In the middle section, extensive beds occurred in the mouth of the Jordan River, southern side of the channel at Granton and northern side of the channel adjacent to Woods Point, usually from the shoreline to around 3 m deep. These beds had a combined area of around 2.5 km 2, with Ruppia megacarpa the dominant component, and smaller amounts of Heterozostera tasmanica. Ruppia megacarpa is able to tolerate the wide range of salinities (Edgar 1997) which occur in this middle and upper section of the Derwent River estuary. The density of Ruppia was high and evenly distributed across the beds in all areas, with often a large biomass of filamentous algae also present in the beds. 5
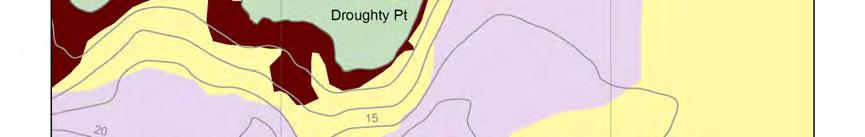
6 Unvegetated habitats were the most dominant habitat type within the Derwent Estuary representing around 40 % of all sub tidal habitats, although large differences occurred in the distribution of sediment type between the lower, middle and upper reaches. The lower reaches were represented by sand all depth zones in the mouth, the northern and southern parts of Ralphs Bay and in shallow depths on both eastern and western shores. Silt and sand occurred in the deeper section from around Halfmoon Bay to Gellibrand Point and the northern end of Ralphs Bay and in middle depths on the western shore from Cartwright Point to Sullivans Cove. On the eastern shore north of Droughty Point, sand/silt occurred adjacent to the sand beach habitats up to Kangaroo Bluff. The silt habitat occurred in the deeper parts of the lower reaches north of Gellibrand Point. The middle reaches of the estuary was dominated by silt habitat, although areas of sand occurred in shallow depths on the western shore up to Cornelian Bay and the eastern shore almost continuously up to Woodville Bay. A large area was also present between Dogshear Point and the eastern shoreline. Silt was restricted to several small areas including Elwick Bay and east of Dogshear Point. The channel region of the upper reaches was found to contain mostly silt, which also dominated the deeper sections. Approximately 70 introduced and cryptogenic species have been identified from within the Derwent River estuary (Aquenal 200, 2002). Several of these species have broad distributions within the lower and middle reaches of the river, including the introduced marine algae Undaria pinnatifida, the seastars Asterias amurensis, and Patiriella regularis, the screwshell Maoriculpus roseus, the Pacific oyster Crassostrea gigas, and the fan worm Myxicola infundibulu (Morrice 1995, Coughanowr 1997, Macleod and Helidoniotis 2005). Information on the distribution of these species was collected through these surveys. The main objectives of this survey were to: Provide detailed marine habitat maps at 1:12,500 scale of the Derwent Estuary from New Norfolk to the Iron Pot. Compile a spatial database (GIS) for all the seagrass and adjacent habitat types and publish the maps on the Land Information System Tasmania (LIST) web mapping site and the SeaMap Tasmania website (TUhttp:// ). To provide crucial information to the Derwent Estuary Program to assist in the establishment of a database for decision-making The outputs of the survey include: The production of 1:12,500 marine habitat maps in the identified areas published in hardcopy and on the Internet. Production of an internal report to the Derwent Estuary Program, detailing the biological and physical structure within the mapping areas and the extent of 6
7 key habitat types (spatial statistics from the GIS). Generation of a CD with Image Mapper software for viewing video linked to habitat maps and representative images and statistics of biological communities (Appendix 3) The results of this study contribute to the SeaMap Tasmania (TAFI) database providing natural resource managers, industry and the community with up to date information on the distribution and extent of marine habitats in Tasmanian waters. 7
8 2. Methods Information on the distribution of benthic habitats in this report was colleted through acoustic surveys, underwater video and visual observations. A review of the aerial photographs in DPIW s archives for the period did not present any photographs that were very useful to the delineation of marine habitat boundaries. This was either due to the scale of the photograph or due to the suspended matter in the water column making the differentiation of habitat types difficult. Field groundtruthing and survey work involved a series of transects perpendicular to the coast at distances no greater than 200 m apart. The final maps were produced based on the field data to determine the most likely position of habitat boundaries. To determine the correlation of physical data to the biotic component of habitat type, regular video transects were conducted perpendicular to the coast, and biotic elements and physical variables recorded. 2.1 Acoustic Data Collection Habitat boundaries were identified from 0-45 m using a Simrad ES60 acoustic echo sounder and video surveys. A series of parallel transects were conducted along the coastline spaced approximately 200 m apart. The echo sounder was set to ping every 0.5 seconds, with a pulse length of ms and a power setting of 100 W. The output from the echo sounder along with positional information from an OmniLite132 differential GPS unit was logged using the Simrad ES60 software (v Kongsberg, Simrad). The logged sounder output was imported into EchoView 3.30 (SonarData) for classification. Different benthic substrates were determined based on changes in the thickness and intensity of the echo sounder output. Harder substrates, which reflect more acoustic energy, appear with a stronger second echo, while rougher substrates, which scatter more of the acoustic energy, appear with a longer tail on the first echo. Seagrass could also be distinguished based on the presence of acoustic reflectance above the sounder detected bottom. These acoustically different echo returns were related back to substrate type based on ground truth information collected by underwater video. The echo sounder output was visually classified as per the classifications detailed in Table 1. Field data was sampled at fixed time intervals adhering to a zigzag pattern of transects perpendicular to the coast (Figure 1). These transects were run at 200 m intervals along the coastline, or more frequently where habitats changed rapidly or had patchy distributions. ArcPad 6.0 was employed in the field to display previous transects and help maintain a regular field-sampling regime. 2.2 Bathymetry Bathymetric data was recorded by the ES60 echo sounder. Logged data files were imported into EchoView 3.30 where the sounder detected bottom was checked for anomalies, corrected for the transducer depth and exported as a comma delimited text file containing depth and position. 8


.")
*(cos(π*((t-t 1 )/(t 2 -t 1 )+1))+1)/2] Where D i is corrected depth")


9 Figure 1. Acoustic transects sampled from the Iron Pot to New Norfolk Tidal correction of bathymetric data Depth measurements from the Simrad ES60 were tidally corrected. These depths were corrected for tidal variation based on the predicted tide heights from the National Tidal Facility ( The tidal cycle can be described by a harmonic equation: D i = D[h 1 +(h 2 -h 1 )*(cos(π*((t-t 1 )/(t 2 -t 1 )+1))+1)/2] Where D i is corrected depth and D is measured depth, h 1,2 correspond to the heights of the high and low tides, t 1,2 are the times of the high and low tides with t being the current time. This formula calculates the height of the tidal cycle for a given time and a given location and then applies this as a correction to the measured field data. All depth measures were corrected to Mean Sea Level based on the available standard port measurements. 9
10 2.2.1 Bathymetric contour generation A depth surface was generated from the field-collected data through the interpolation of depth (z) values. Interpolation is the procedure of predicting the values of attributes at unsampled sites from measurements made at point locations within the same area or region (Burrough and McDonnell, 1998). This transformation is based on the Triangular Irregular Network (TIN) data model. Contours in ArcGIS 9.2 were created by interpolating the point data into a TIN, then to create a smooth contour set the TIN was converted to a 5m grid and a 5x5 mean focal filter applied to the grid. The contour coverage provides another source of information from which the habitat polygons can be verified against, especially for seagrass, which has a maximum growth limitation. The contour intervals were generated at 5 m, 10 m, 20 m, 30 m, 40 m, and 50 m. 2.3 Video Data Collection A submersible digital video camera, MorphCam (MorphVision, NSW, Australia) was deployed at selected locations throughout the study region (Figure 2). This was used to verify the echo sounder substrate classification and obtain more detailed information on algal distribution. Positional information was recorded for each video drop as a series of GPS co-ordinates and also as a direct overlay of the GPS output (position, date and time) onto the video. The video was analysed for dominant flora and fauna for each habitat type. Algae and seagrasses were identified to the lowest taxonomic level possible, For many of the large brown algae, identification could be done to species level, where as red algae were only able to be identified as a group due to a combination of the resolution of the video and the general difficulty in identifying red algae (Fuhrer 1988). Appendix 1 and 2 detail the video analysis by site. 2.4 Cartography The classified data files from Echo View 3.30 were imported into ArcGIS 9.1 as point data and were used to generate shapefiles of the different habitat types by on-screen digitising. At the 1:2,000 scale, the points were carefully connected to form polygons of similar habitat type. The underwater video documentation was used to help verify the habitat type and the interface between different substrates. The classification table followed for the mapping of habitats on this section of coast is shown in Table 1. 10
11 Reef REEF The term reef applied to any consolidated substrate, though typically consists of rocky outcroppings. It may be of any profile or rugosity. COBBLE This definition referred to a hard bottom type consisting of boulders and smaller rocks. This category was usually found in the main channel areas with high flow rates, either tidal or fluvial and occasionally overlapped with the hard sand categories. Unconsolidated Substrates SAND Sand was the most commonly encountered unconsolidated substrate. It represents the coarser end of a scale of sediments from silt to sand, though was mostly found to be fine sand. SILT Silt substrate was only found in the deepest and largest central basins. This habitat category represents the finest unconsolidated substrate. Silt is characterised on the sounder by a lack of a second echo and often little scatter in the trace tail. Vegetated unconsolidated substrate SEAGRASS The seagrass category referred to the dense areas of seagrass where the substrate, usually sand, was completely covered by seagrass and the patch size is greater than 20 m wide. The dominant seagrass type mapped in the region was Heterozostera tasmanica. The habitat mapping presented here, details the extent of the larger beds of this species. AQUACTIC MACROPHYTES This category covers all the vegetated areas that are either unclear as to their specific habitat type, or are a habitat type that is not being mapped for this project. Almost all of the vegetated category mapped for this project consisted of saltmarsh within the intertidal zone within section A of the estuary. VEGETATED The term vegetated habitat referred to areas of dense vegetation that included seagrasses and other aquatic macrophytes that were so densely mixed it was difficult to map them as separate classes. In the case of the Derwent this included the seagrass species Heterozostera tasmanica and Ruppia megacarpa. Table 1. Habitat classes identified within the Derwent Estuary in Appendix 3 contains the habitat maps linked with the video file footage in Image Mapper for further display, query and analysis. Appendix 4 contains the ESRI shapefiles of the marine habitats and contours for the exclusive use of the Derwent Estuary Program. 11


12 Figure 2. Video transect points collected within the Derwent Estuary in


13 3. Results For this report, the results and analysis have been divided into three reporting sections as shown in Figure 3. A table detailing the extent of each habitat type is presented for each of these areas in the following section. Section A Section B Section C Figure 3. Reporting regions for the Derwent Estuary 2007 resurvey. 3.1 Bathymetry Depth and GPS position were constantly recorded during the field surveys. From this data bathymetric contours were generated. While the fine scale contours are printed on the 1: 12,500 habitats maps an overview of the bathymetry of the estuary is presented in Figure 4. 13


14 Figure 4. Bathymetry of the Derwent Estuary Section A: Upper: Bridgewater Bridge to New Norfolk The bathymetric record for Section A is shown in Figure 5. The habitat maps are presented in section 3.7 of this report. The bathymetric map shows that the region above the Bridgewater Bridge is mainly 5 m or less except for the main channel that is 10 m deep on average. 14
15 Figure 5. Section A Bathymetry from New Norfolk to Bridgewater Bridge Habitat Distribution The distributions of habitats (ha) by depth in Section A are shown in Table 2. At the top end of the estuary the majority of habitat consists of aquatic macrophytes and silt below low water mark and vegetated habitat from the low water mark to high water mark which could not be surveyed with by acoustic methods. Depth Aquatic range Macrophyte Cobble Reef Sand Seagrass Silt Vegetated Total ha ha ha ha ha Table 2. Distribution of marine habitats by depth in Section A Algal Distribution There was very little consolidated substrate in the upper Derwent. The majority of the consolidated substrate occurred in the main river channel around New Norfolk, which was dominated by cobble and rocky ridges. There was little algal growth on the consolidated substrate partially due to the lack of light penetrating through the water column, and partially due to the high sediment load covering the consolidated substrate Seagrass Distribution Extensive beds of the aquatic macrophyte Ruppia megacarpa and the seagrass Heterozostera tasmanica occurred on the shallow mud flats between the Bridgewater 15


16 Bridge and Dromedary. These beds were a mixture of both species, with Ruppia being the dominant component. The seagrass species, Heterozostera extended to approximately 2 m depth on the margins of the beds, with Ruppia common in less than 1 m depth. 3.3 Section B: Middle: Tasman Bridge to Bridgewater Bridge The bathymetric record for Section B is shown in Figure 6. The bathymetric map shows that the upper region below the Bridgewater Bridge has a depth of < 5 m and starts to become deeper from Cornelian Bay to the southern end of the estuary. Figure 6. Section B Bathymetry from Bridgewater Bridge to Tasman Bridge 16
17 3.3.1 Habitat Distribution The distributions of habitats (ha) by depth in Section B are shown in Table 3. A substantial amount of aquatic macrophytes (404 ha) was present to the southern side of the Bridgewater Bridge. The unconsolidated habitat was dominated by silt with only a small proportion of sand in this section of the estuary. Depth Aquatic Macrophyte Cobble Reef Sand Seagrass Silt Total ha ha 1.7ha 9.27ha ha Table 3. Distribution of marine habitats by depth in Section B Algal Distribution There was very little reef in the mid Derwent section, with the majority of the reef fringing the shoreline and extended to less than 2 m deep. The reef in the mid Derwent section was generally barren with little algal growth. The algae that was present was commonly filamentous red and brown algae Seagrass Distribution In the middle reaches of the Derwent, between the Tasman Bridge and the Bridgewater Bridge there were numerous large beds (9.27 ha or 0.09km 2 in total) of Heterozostera tasmanica, often mixed with the aquatic macrophyte Ruppia megacarpa. The major beds were located south of the Bridgewater Bridge, in the mouth of the Jordan River, and opposite Austins Ferry. There was also a small bed of Heterozostera tasmanica in Cornelain Bay. This section of the river also has small amounts of the intertidal seagrass Zostera mulleri in some of the sheltered bays on the western shoreline, including Cornelian Bay and Prince of Wales Bay. 3.4 Section C: Lower: Tasman Bridge to Iron Pot The bathymetric record for Section C is shown in Figure 7. The bathymetric map shows that below the Tasman Bridge a deep channel to 50 m is present. Ralphs Bay is characterised by depths of less than 5 m. Overall, the majority of area in the centre of the Derwent Estuary is characterised by depths between 20 and 30 metres. 17


18 Figure 7. Section C Bathymetry from the Tasman Bridge to Iron Pot Habitat Distribution The distribution of habitats by depth is Section C is shown in table 4. The majority of reef habitat in this section was present in the 0-5 m depth range. Cobble and aquatic macrophytes were not mapped in this section. The deeper areas of this section consisted of silt habitat moving to sand up into the shallower regions. 18
19 Depth Aquatic Macrophyte Cobble Reef Sand Seagrass Silt Total ha 10, ha ha ha Table 4. Distribution of marine habitats by depth in Section C Algal Distribution The majority of the macro algae occurred in this section of the Derwent. The waters of the lower Derwent have a stronger marine influence than further up the estuary, with the algal communities reflecting this influence. The algae on the eastern and western shorelines and Ralphs Bay showed differences in the algal composition, and so are described separately Western Shoreline The section of coast from Tinderbox to Sandy Bay contains a significant proportion of the reef habitat within the Derwent Estuary. The distribution of algae along this section of coast reflects the more oceanic influence of Storm Bay. A mix of brown algae including Ecklonia radiata, Lessonia corrugata, Cystophora confluens, Acrocarpia paniculata and Carpoglossum confluens dominated the shallow water. Smaller amounts of Sargassum sp., Caulocystis sp., mixed red algae, Ulva and Caulerpa sp. were also present along this section of coast. Beyond 5 metres, where light was limited, red algae became the more dominant component, although this became sparse and patchy below 7 metres depth. The introduced kelp, Undaria pinitifida was also present in small quantities below 5 metres depth. On the fringes of the deeper sections of reef occasional sponges were noted. Macrocystis pyrifera was present on the shoreline from Tinderbox to Taroona, especially just south of Blackmans Bay Eastern Shoreline The eastern shoreline of the Derwent River has less of an oceanic influence than the western shoreline. This is reflected in the algal community structure. Around South Arm, at the entrance to the river a suite of algae including Ecklonia Ulva, Acrocarpia, Cystophora and Sargassum occur in the shallow water, with Carpoglossum and mixed red algae generally in the deeper water. Further up the river past Opossum Bay Ecklonia radiata, Cystophora sp. and mixed reds dominated in shallow water to around 3 metres depth. Below this depth, the algae generally dropped out, with the reef remaining relatively barren. The further north the samples were taken, the less the large macro algaes were noted Ralphs Bay There was little reef mapped within Ralph s Bay, however at the entrance to the bay a significant area was identified. A mix of Codium sp., filamentous brown algae and mixed red algae dominated the habitats in less than 3 metres. Invertebrate communities generally dominated deeper reef in this area, with the reef in this area being covered in fine sediments. 19
20 3.4.3 Seagrass Distribution In the lower reaches, below the Tasman Bridge, Heterozostera tasmanica was the dominant seagrass species. Beds were observed between the 1 m and 5 metre depth range in Halfmoon Bay, Opossum Bay, and off Taroona. These beds generally had short to medium blade length, with sparse to dense growth. In 2000, a large bed of seagrass was mapped in the northern part of Opossum Bay. This bed was lost in early 2001 during a large storm event, which washed most of the sand away and exposed the underlying reef. 3.5 Introduced Species Several introduced species were observed on the video including the seastar Asterias amurensis, the New Zealand screwshell Maoriculpus roseus, the fan worm Myxicola infundibulum, the Pacific oyster, Crassostrea gigas, and the kelp Undaria pinnatifida. A total of 63 video transects were used to identify the broad patterns of these species distribution in the river (Appendix 1 and 2). However, as this was not a comprehensive video survey for introduced species, these ranges are indicative only. The seastar, Asterias amurensis, showed a broad distribution through the lower and middle Derwent, including Ralphs Bay. This species was predominantly observed on soft sediment habitat, but also occurred on reef. In the middle reaches, between Sullivans Cove and Dogshear Point, the seastar Patiriella regularis was observed on silt habitat in many of the video transects. This seastar is believed to have been introuduced from New Zealand with the introduction of oysters in the early 1900s (Edgar 1997). The New Zealand screw shell, Maoriculpus roseus, was only observed in the lower Derwent, especially around Opossum Bay, Taroona, and the entrance to Ralphs Bay. The majority of the shells were observed on soft sediment habitat, with a small amount occurring within gutters in reef. Live screw shells were observed in the mid Derwent between Opossum Bay and Taroona, however the majority of screw shells observed were dead shell. The fan worm, Myxicola infundibulum, was observed on silt substrate in the mid Derwent between Elwick bay and Sandy Bay, and also in Ralphs Bay. Burrows were also observed between Bridgewater and Opossum Bay. As this species has the ability to quickly retract its feeding tentacles, these burrows may have belonged to this species, but it is impossible to determine using towed video. Oysters were observed on the video in the mid Derwent, especially between Cornelian Bay and Austins Ferry. This species predominantly occurs in the intertidal zone, which was unable to be surveyed using the vessel towed video. Thus, this distribution reflects the subtidal distribution of this species and not those found on intertidal rock platforms. The introduced kelp Undaria pinnatifida was found to occur on the deeper margins of reef along the western shoreline of the lower Derwent, from Tinderbox to Taroona. This species was first noted in the Tinderbox marine reserve in the late 1990 and this distribution represents the population spreading from this site. 20
21 3.6 Summary of habitats across the Derwent Estuary Tables 5 to 8 summaries the distribution of marine habitats of the Derwent Estuary by section; by depth; and across the entire estuary as a per centage cover of all habitats identified. Table 5 summarised the marine habitats by section. The majority of the area in Section A is characterised by aquatic macrophytes, silt and vegetated habitat in the zone between the high and low water mark. Small amounts of reef and cobble were also present. In section B larger amounts of reef were identified with silt and aquatic macrophytes still being the dominant habitats. In section C aquatic macrophytes or cobble were not mapped. This section contained the largest proportion of reef and sand habitat with silt habitat dominating the deeper waters in the centre of the estuary. Habitat Section A Section B Section C Total (ha) Aquatic Macrophytes Cobble Reef Sand Seagrass Silt Vegetated Table 5. Summary of marine habitats by Section. Table 6 presents the distribution of all habitat types across the entire estuary by depth. Aquatic macrophytes occurred predominantly in the 0-5 metre depth range of the estuary. Cobble was identified in depths between 0 and 10 metres. Fringing reef dominated in the 0-5 m depth range but was present in all depth strata of the estuary. Seagrass was mainly present in the 0-5 depth strata with a small amount identified in the 5-10 metre depth range. Sand was the dominant unconsolidated habitat type in the Section C of the estuary but was replaced by silt in the deeper margins. Depth Aquatic Macrophytes Cobble Reef Sand Seagrass Silt Vegetated Total ha 27.16ha ha ha 17.96ha ha ha Table 6. Distribution of marine habitats by depth across the entire estuary Table 7 and 8 show the percentage cover of each habitat type by section and across the whole estuary. The estuary is dominated by unconsolidated habitats with sand representing 53.37% and silt 39.9% of all habitats surveyed. Aquatic macrophytes were the next dominant habitat at 3.39% followed by reef, 2.1%. Section Aquatic Total Cobble Reef Sand Seagrass Silt Vegetated Macrophytes A 33.3 % 3.48% 3.54% 0% 0% 34.4% 25.32% 100% B 15.74% 0% 1.84% 0.066% 0.36% 82% 0% 100% C 0% 0% 2.06% 64.38% 0.054% 33.5% 0% 100% Table 7. Percentage of habitat cover across each section of the estuary 21
22 Aquatic Macrophytes Cobble Reef Sand Seagrass Silt Vegetated Total 3.39% 0.14% 2.1% 53.37% 0.09% 39.9% 1.01% 100% Table 8. Percentage of habitat cover across the whole estuary 22


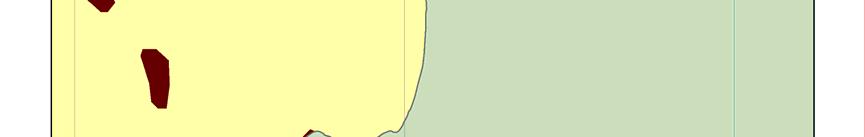
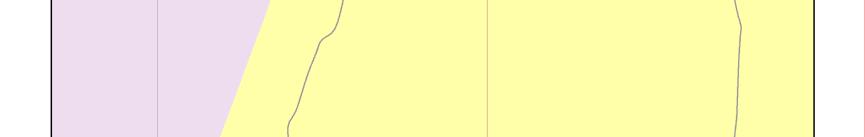
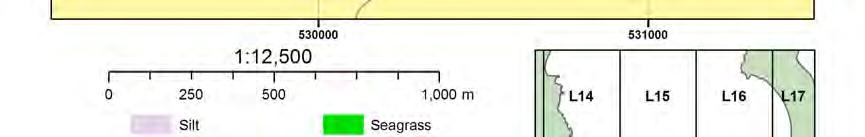
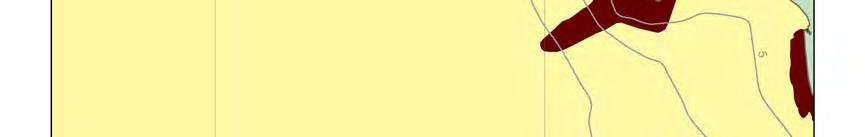
23 3.7 Benthic habitat maps of the Derwent Estuary The habitat maps of the Derwent Estuary, as determined by the map index in Figure 8, are presented in this section. Figure 8. Map Index for marine habitat maps from New Norfolk to Iron Pot 23


24 24


25 25 Resurvey of the Derwent Estuary 2007


26 26


27 27 Resurvey of the Derwent Estuary 2007


28 28


29 29 Resurvey of the Derwent Estuary 2007


30 30


31 31 Resurvey of the Derwent Estuary 2007


32 32


33 33 Resurvey of the Derwent Estuary 2007


34 34


35 35 Resurvey of the Derwent Estuary 2007


36 36


37 37 Resurvey of the Derwent Estuary 2007


38 38


39 39 Resurvey of the Derwent Estuary 2007


40 40


41 41 Resurvey of the Derwent Estuary 2007


42 42


43 43 Resurvey of the Derwent Estuary 2007


44 44


45 45 Resurvey of the Derwent Estuary 2007


46 46


47 47 Resurvey of the Derwent Estuary 2007


48 48


49 49 Resurvey of the Derwent Estuary 2007


50 50


51 51 Resurvey of the Derwent Estuary 2007


52 52


53 53 Resurvey of the Derwent Estuary 2007


54 54


55 55 Resurvey of the Derwent Estuary 2007


56 56


57 57 Resurvey of the Derwent Estuary 2007


58 58


59 59 Resurvey of the Derwent Estuary 2007


60 60


61 61 Resurvey of the Derwent Estuary 2007


62 62


63 63 Resurvey of the Derwent Estuary 2007


64 64


65 65 Resurvey of the Derwent Estuary 2007

66 66


67 67 Resurvey of the Derwent Estuary 2007


68 68


69 69 Resurvey of the Derwent Estuary 2007


70 70


71 71 Resurvey of the Derwent Estuary 2007


72 72


73 73 Resurvey of the Derwent Estuary 2007


74 74


75 75 Resurvey of the Derwent Estuary 2007


76 76


77 77 Resurvey of the Derwent Estuary 2007


78 78


79 79 Resurvey of the Derwent Estuary 2007


80 80
81 4. Conclusions A resurvey of the distribution of marine habitats of the Derwent Estuary was conducted from April to June 2007 by SeaMap Tasmania. The initial habitat mapping survey was completed in 2001 by Jordan et al (2001) as part of a NHT project (CMP22338) focusing on the integration of science and management for the development of a monitoring program for the Derwent Estuary. Comparisons have not been made between the results of this survey and the initial mapping report due to the temporal and technical difficulties in detecting change in benthic marine habitats. Single beam acoustics do not have a high degree of signal fidelity which is due to a number of parameters and this makes comparison between results over different seasons, sea conditions and between different acoustic sounders impossible. The distribution of several habitat classes have been presented and discussed in this report. The image mapper product and shapefiles attached in Appendices 3 and 4 are for the discrete use of the Derwent Estuary Program and remain the copyright of the Tasmanian Aquaculture and Fisheries Institute. The results of this survey provide natural resource managers, industry and the community with the information needed to contribute to biodiversity conservation and natural resource management of the Derwent Estuary. It provides further information needed to define and measure marine habitat extents in Tasmanian waters and increases our knowledge to improve impact assessments to protect the health and condition of sub tidal marine habitats. References Aquenal (2000) Biological characterisation of the Derwent River main channel and wetlands between New Norfolk and Bridgewater. Report prepared for NSR Environmental Consultants Pty Ltd and Norske Skog Paper Mills (Australia) Ltd. Aquenal (2002) Exotic marine pests survey Port of Hobart, Tasmania. Final Report for Hobart Ports Corporation, Pty Ltd. 159 pp. Burrough, A. and McDonnell, R (1998) Principles of Geographic Information Systems. Oxford University Press, New York. Coughanowr, C. (1997) State of the Derwent Estuary: a review of environmental quality data to Supervising Scientist Report 129, Supervising Scientist Canberra. Edgar, G (1997) Australian Marine Life; the plants and animals of temperate waters. Reed Books, Australia. Fuhrer, B.A (1988) Seaweeds of Australia. Edited by Christianson, I.G., Clayton, M.N and Allender, B.M. Reed Books, Australia. 81
82 Jordan, A.R., Lawler, M and Halley, V (2001) Estuarine habitat mapping in the Derwent- integrating science and management. NHT Final Report, NHT Project Number CMP Macleod, C. and Helidoniotis, F. (2005) Ecological status of the Derwent and Huon estuaries. NHT/NAP Project No NHT/NAP Final Report. 109 pp. Morrice, M.G (1995) The distribution and ecology of the introduced northern Pacific seastar, Asterias amurensis (Lutken), in Tasmania. Final report to the Australian Nature Conservation Agency, Feral Pests Program, No 35. Tasmanian Museum and Art Galley, February
83 Appendix 1: Video Transect Locations Appendix 1 outlines the location of individual video drops conducted within the estuary and the ID numbers correspond to the site descriptions in Appendix 2. 83
84 Appendix 2: Video Transect Descriptions Video Video Name Latitude Longitude Depth Observation ID # V01 UD_ _V m Reef with thick silt covering, occasional submerged logs. Some small unidentifiable fish V02 UD_ _V m Silt with some reef patches. No algal growth. Some small unidentifiable fish possibly Pseudaphritis urvili V03 UD_ _V m Reef with patches of silt. Very little light penetrating the upper layers of the water column. No algal growth and few signs of fauna, some unidentifiable fish V04 UD_ _V m Silt, with bacterial mat in deeper water V05 UD_ _V m Silt V06 UD_ _V m Silt onto a sparse bed of seagrass (Heterozostera tasmanica) V07 UD_ _V m Silt onto a sparse bed of seagrass (Heterozostera). Seagrass with large amount of associated brown algae V08 UD_ _V m Silt onto Ruppia sp. V09 MD_ _V m Silt with a small amount of fine shell grit, a few patches of seagrass (Heterozostera) with long blades. Dense seagrass bed at end of transect V10 MD_ _V m Dense Heterozostera with long blades. Sediment fine silt with some small burrows V11 MD_ _V m Silt with some seagrass (Heterozostera) and large amounts of epiphyte and associated algae V12 MD_ _V m Silt with few features V13 MD_ _V m Seagrass with large amount sediment cover. Relatively long blades and some patches of epiphyte growth V14 MD_ _V m Silt with oysters growing on it onto seagrass (Heterozostera) V15 MD_ _V m Silt with oysters onto seagrass (Heterozostera). Some Patiriella sea stars observed V16 MD_ _V m Silt with lots of shell grit onto oyster beds with some seagrass in shallow (Heterozostera). Asterias is found here on the silt and oysters V17 MD_ _V m Silt with lots of burrows. Some mollusc tracks, little visible fauna V18 MD_ _V m Silt with large amounts of dead oyster shell onto reef with some living oyster. Both sea stars Asterias and Patiriella are found here along with some Myxicola polychaete V19 MD_ _V m Silt onto reef with oyster and Asterias sea star. The reef has sparse algal cover of mainly red algae. The silt has some Asterias and Patiriella sea stars V20 MD_ _V m Silt onto reef with dense population of oysters. The sea star Patiriella is found 84
85 on the silt here, while Astrerias is on the reef V21 MD_ _V m Silt onto seagrass (Heterozostera sp.) The sea star Patiriella sp. occurs on the silt at this location V22 MD_ _V m Barren reef with light cover of red alga onto silt. Both sea stars Patiriella sp. and Asterias sp. are on both the reef and silt V23 MD_ _V m Silt up to reef at the base of Bedlam Walls. Asterias is present on the silt and reef. The sea star Patiriella sp. is also present on the reef. Little algal growth on the reef with only sparse red alga and turfing browns V24 MD_ _V m Silt with oyster shells on to cobbly reef with Asterias. The silt is densely populated with Myxicola sp. polychaete. The reef has limited algal growth with only turfing browns and some red algae V25 MD_ _V m Cornelian Bay. Seagrass bed (Heterozostera sp.) Some sea stars (Asterias sp.) present V26 MD_ _V m Silt with lots of filamentous brown algae. The sea star Asterias amurensis. and the polychaete Myxicola sp. are present V27 MD_ _V m Silt with many small to medium burrows, a few Asterias V28 MD_ _V m Silt with shell grit, a few rocks and tyres. Numerous burrows and Myxicola fan worms on sediment in deeper water, Asterias and Patiriella sea stars also present V29 SB_ _V m Sand with patches of algal growth including filamentous red/brown and Ulva. Numerous Asterias, small burrows and Myxicola sp. polychaete fan worms V30 TR_ _V m Dense Heterozostera with relatively short blades, and associated mixed red algae and Ulva. Sand generally bare leading into reef with Cystophora, mixed red algae V31 TR_ _V m Dense Heterozostera with some Cystophora and mixed red algae. Into patchy reef with low cover of Ecklonia, Cystophora and mixed red algae V32 TR_ _V m Dense Heterozostera tasmanica to 4 m depth, becoming sparse to 6 m. Occasional patches of reef amongst seagrass with Ecklonia, Cystophora, Caulocystis, Sargassum, mixed red algae and Ulva V33 KB_ _V m Reef comprising barren sand scoured rocks on sand edge in shallow water. In deeper water algal cover includes Caulerpa and mixed red algae in patches, with increasing amounts of Cystophora, Carpoglossum, Acrocarpia 85
86 and Ecklonia. Small amounts of Codium sp., some Undaria pinnaitifida V34 KB_ _V m Bare sand with a few New Zealand screw shells, moving onto low relief reef. Algal cover low to medium, with a combination of Ecklonia, mixed red algae, Cystophora and Acrocarpia. Some coralline algae and the occasional sponge V35 KB_ _V m Sand with fine shell grit, some patchy reef with Ecklonia and coralline algae V36 KB_ _V m Reef with little algal cover, small patches of coralline algae, majority covered with invertebrate sediment matrix, a small amount of Ecklonia also present. Numerous Asterias and dead screw shells within reef structure. Sand with fine shell grit and numerous Asterias V37 KB_ _V m Reef with a dense algal cover in shallow water decreasing with depth to become relatively barren at depth. In less than 5 m algae dominated by a mix of Cysophora sp. and Acrocarpia sp., with small amounts of Lessonia corrugata and Ecklonia radiata on more exposed rocks and ledges. Small amounts of mixed red algae and Ulva sp. also present in the shallow depth range. Carpoglossum confluens more common in 5 6 m. Below 6 m algae becoming more sparse with a mix of red algae, occasional Undaria pinaitifida plant, and the stalked ascidian Pyura sp. Below 7.5 m generally barren with occasional tufts of red algae and Undaria. Light sediment cover on deeper reef with a few sponges on deep reef margin. Occasional New Zealand screw shell (Maoriculpus roseus) on reef V38 KB_ _V m Bare sand with ripples V39 KB_ _V m Reef comprising large boulders with mixed algal cover. Major components of the algal community include mixed red algae, Ulva, Cystophora, Ecklonia, Acrocarpia, and Lessonia. Small amounts of Undaria and Sargassum were also present as was the stalked ascidian Pyura sp. V40 KB_ _V m Bare sand with ripples, some shell grit V41 KB_ _V m Reef with a mixed algal community including Carpoglossum, Acrocarpia, Ecklonia, Caulerpa, Cystophora and mixed red algae. Macrocystis pyrifera also present V42 SB_ _V m Reef with a mix of Ecklonia, Ulva, Acrocarpia, Codium and coralline algae in depths less than 3 m. Below 3 m substrate a mix of barren rocks and shell. Small amount of mixed red algae and also Myxicola worms. Below 5 m depth 86
87 more consistent rock with occasional mixed red algae and a small amount of Ecklonia and Undaria V43 BR_ _V m Sand with patches of shell and shell grit. Some patches of mixed red algae and a small amount of Codium. A few Myxicola sp. polychaete worms and numerous Asterias amurensis V44 RB_ _V m Reef with Ecklonia and Cystophora in m. Sparse algae below 2.5 m mainly mixed red algae, Ulva, Ecklonia and Codium. Very little algae below 5m. A few sponges below 7 m and some dead New Zealand screw shells V45 RB_ _V m Silt with occasional sponge. Finger sponge and zoanthids on bridge section. Some New Zealand screw shells on sediment and Holothurians V46 RB_ _V m Reef to 3 m depth, with Codium, filamentous brown and red algae. Sand below 3m with a mixture of fan worms, Asterias, Ulva, cunjevoi (Pyura sp.), mixed red algae and Codium. Burrows in deeper water V47 RB_ _V m Sand with Asterias and fan worms V48 RB_ _V m V49 RB_ _V m V50 RB_ _V m Barren rock with some sponge and occasional patches of coralline algae. Asterias, New Zealand screw shells, holothurians and fan worms (Myxicola sp.) present Silt with fan worms (Myxicola sp.), dead New Zealand screw shells and Asterias sp. Silt with Asterias and New Zealand screw shells. Lots of burrows in deeper parts V51 RB_ _V m Silt with burrows V52 OP_ _V m Reef with Ecklonia, Cystophora and mixed red algae in less than 2 m depth. In 2-3 m depth occasional patches of Ecklonia and mixed red algae, and lesser amounts of Cystophora and Codium Sediment below 3m with Asterias, Cunjevoi and some Myxicola sp. fan worms V53 OP_ _V m Sand with light cover of diatoms. Patches of cobble with some filamentous red alga. More extensive patches of cobble also with small amounts of Cystophora, Carpoglossum and Zonaria but generally barren. Occasional dead screw shell V54 OP_ _V m Small band of Heterozostera tasmanica on edge of reef. Reef generally barren with some Cystophora and mixed red algae. Moving into sand with some sparse seagrass and diatom cover V55 OP_ _V m Sand substrate with a small amount of 87
88 dead cockle shell. Patches of Heterozostera with light epiphyte and associated algae, including filamentous red algae and Ulva. Light diatom growth on sediment, and some Cunjevoi. Numerous Asterias in deeper areas V56 OP_ _V m Reef covered with sediment and invertebrate matrix in deeper parts and small amounts of coralline and red algae. In shallower water Ecklonia dominates with small amount of filamentous red algae and Carpoglossum. Sand patches with fine shell grit and some dead screw shell in gutters. Sand on outer margin with Asterias V57 OP_ _V m Reef with dense cover of Ecklonia in shallow. Coralline, mixed red algae, Cystophora and Ulva also present. Rapidly onto sand with a few sparse blades of Heterozostera V58 SA_ _V m Sand with sparse Heterozostera, some associated filamentous red algae. Some Myxicola fan worms amongst seagrass and light diatom cover V59 SA_ _V m Reef with dense Carpoglossum, mixed red algae, Ecklonia Ulva, Acrocarpia, Cystophora and Sargassum. Into sand with patches of shell grit and cunjevoi V60 SA_ _V m Reef with Acrocarpia, mixed rad algae, Carpoglossum, Cystophora, Ecklonia. Carpoglossum more dominant on deeper reef. Bare sand on outer margin of reef V61 SA_ _V m Bare sand with small amount of shell grit, into patches of dense shell grit V62 LD_ _V m Silt with fine shell grit and numerous New Zealand screw shells. A few tracks in sediment. Some Asterias V63 LD_ _V m Silt with a few small burrows and occasional small patches of filamentous algae. Asterias V64 LD_ _V m Bare sand with some shell grit. Some Asterias 88
89 Appendix 3. Image Mapper CD The Image Mapper CD located at the back of this report links the marine habitat maps and contours with all of the video files recorded. Appendix 4. Derwent Habitats and Bathymetry CD 2 located at the back of this report contains the ESRI shapefiles for the habitats and bathymetry of the Derwent Estuary in MGA94 Zone 55 projection. These shapefiles are for the exclusive use of the Derwent Estuary Program. The metadata for these data layers is inclusive on the CD. 89
Relatively little hard substrate occurs naturally in the
 CHAPTER FIVE Rock Habitats Relatively little hard substrate occurs naturally in the estuary, owing mainly to the vast quantities of fine sediment that have been deposited by the rivers. Rock habitat is
MAINTENANCE DREDGE BENTHIC ASSESSMENT SUNSET POINT FARM LLC LONG POINT KEY MONROE COUNTY, FLORIDA. Prepared by:
 MAINTENANCE DREDGE BENTHIC ASSESSMENT SUNSET POINT FARM LLC LONG POINT KEY MONROE COUNTY, FLORIDA Prepared by: December 11, 2016 INTRODUCTION The owners of the Sunset Point Farms LLC, located on the northern
Create your own map for tidepooling, beach field trips, boating, camping, kayaking, fishing, and exploring the beaches in Southcentral Alaska.
 Create your own map for tidepooling, beach field trips, boating, camping, kayaking, fishing, and exploring the beaches in Southcentral Alaska. Here s an opportunity to download and customize your own free
Habitat Mapping in The Hauraki Gulf Marine Park. Dan Breen
 Habitat Mapping in The Hauraki Gulf Marine Park Dan Breen Outline 1. Intro Habitat mapping 2. Coastal marine habitats and marine protected areas in the New Zealand Territorial Sea: a broad scale gap analysis
TASMANIAN SEAGRASS COMMUNITIES
 TASMANIAN SEAGRASS COMMUNITIES by Christopher Grant Rees, B.Ed (}Ions.) Submitted in partial fulfilment of the requirement for the degree of Master of Environmental Studies (By Coursework) Centre for Environmental
Joint Federal Agency Submerged Aquatic Vegetation Survey Guidance for the New England Region Updated August 11, 2016
 Joint Federal Agency Submerged Aquatic Vegetation Survey Guidance for the New England Region Updated August 11, 2016 FOREWORD This guidance is the result of on-going interagency collaboration between the
Significant Ecological Marine Area Assessment Sheet
 Significant Ecological arine Area Assessment Sheet Name: Eastern Bay of Island Biogenic Soft Sediment Complex Summary: The semi-sheltered areas between the central islands of the Eastern Bay of Islands
"The Relationship Between Seagrass Cover and Species- richness of Invertebrates"
 "The Relationship Between Seagrass Cover and Species- richness of Invertebrates" SCIE 2204: Marine Systems The Cottesloe Marine Ecosystem Research Project 2014 By Baronie Shaw, K., Bortoloso, T., Cargill,
Coastal and Marine Ecological Classification Standard (CMECS)
") Coastal and Marine Ecological Classification Standard (CMECS) Mark Finkbeiner NOAA Coastal Services Center Presented at the International Workshop on Seabed Mapping Methods and Technology 18 October 2012
Coastal and Marine Ecological Classification Standard (CMECS) Mark Finkbeiner NOAA Coastal Services Center Presented at the International Workshop on Seabed Mapping Methods and Technology 18 October 2012
Biological survey of species diversity of sea grass beds in selected sites of southern Sri-Lanka.
 Biological survey of species diversity of sea grass beds in selected sites of southern Sri-Lanka. Hikkaduwa,Weligama,Polhena. Harishcandra K.A.D.A.T FS/2006/010 Introduction. 1.What are Sea grasses? 2.Distribution
Environmental Science
 Environmental Science A Study of Interrelationships Cui Jiansheng Hebei University of Science and Technology CH06 Kinds of Ecosystems and Communities Chapter Objectives After reading this chapter, you
Hydroacoustic survey and bathymetric map creation for Brant Lake, New York
 Hydroacoustic survey and bathymetric map creation for Brant Lake, New York Holly A. Waterfield CLM 1 INTRODUCTION Brant Lake is located in Warren County, New York, within the bounds of the Adirondack Park.
Conserving freshwater ecosystem values in Tasmania, Australia: identification and application of freshwater conservation management priority areas
 Conserving freshwater ecosystem values in Tasmania, Australia: identification and application of freshwater conservation management priority areas Danielle Hardie 1 and Peter Davies 2 1 Department of Primary
Benthic habitat mapping using multibeam sonar
 Benthic habitat mapping using multibeam sonar Iain M. Parnum 1, Alexander Gavrilov 1 and Justy Siwabessy 2 1. Centre for Marine Science and Technology, Curtin University, Perth, Australia 2. Geoscience
Project 1.3.1: Improved knowledge of biota, habitats and risks. Project Leader: Dr Mick Haywood, CSIRO Division of Marine and Atmospheric Research
 Marine and Tropical Sciences Research Facility (MTSRF) June 2007 Milestone Report Project 1.3.1: Improved knowledge of biota, habitats and risks Project Leader: Dr Mick Haywood, CSIRO Division of Marine
West of Wedge Zone Assessment
 Appendix 11 West of Wedge Zone Assessment INITIAL ENVIRONMENTAL ASSESSMENT FOR THE ESTABLISHMENT OF A NEW MARINE FARMING ZONE: WEST OF WEDGE, SOUTHERN TASMANIA Report to Tassal November 2016 www.aquenal.com.au.au
RED LIST OF EUROPEAN HABITATS. Marine Results Presentation 24 th May, 2016
 RED LIST OF EUROPEAN HABITATS Marine Results Presentation 24 th May, 2016 Geographical scope of the project Habitat Typology One typology for marine and terrestrial At the same time... revision of EUNIS
Types of intertidal communities
 Between the tides Marine ecosystems 1 Intertidal Delimited by the highest high tide and the lowest low tides marks The best studied and best-understood by humans Relatively easy to sample compared to other
Subtidal permanently flooded with tidal water. Irregularly exposed surface exposed by tides less often than daily
 Types of Wetlands Tidal Systems COASTAL WETLAND ECOSYSTEMS Tidal Salt Marshes Tidal Freshwater Marshes Mangrove Wetlands Tidal Estuarine Wetland 1 Definition and Formation of Estuaries u Estuary : partially
Types of Wetlands. Tidal Systems
 Types of Wetlands Tidal Systems 1 COASTAL WETLAND ECOSYSTEMS Tidal Salt Marshes Tidal Freshwater Marshes Mangrove Wetlands 2 Tidal Estuarine Wetland 3 Definition and Formation of Estuaries Estuary: : partially
Current and Future Technology Applications for Coastal Zone Management. Bruce K. Carlisle, Acting Director Office of Coastal Zone Management
 Current and Future Technology Applications for Coastal Zone Management Bruce K. Carlisle, Acting Director Office of Coastal Zone Management The Massachusetts Coastal Zone Management Program Approved in
High Resolution Numerical Models of Tidal Marshes in the Delaware Bay
 High Resolution Numerical Models of Tidal Marshes in the Delaware Bay Ramona Stammermann Dept. of Civil, Architectural & Environmental Engineering, Drexel University, Philadelphia, PA Michael Piasecki
Treasure Coast Science Scope and Sequence
 Course: Marine Science I Honors Course Code: 2002510 Quarter: 3 Topic(s) of Study: Marine Organisms and Ecosystems Bodies of Knowledge: Nature of Science and Life Science Standard(s): 1: The Practice of
Submersible investigation of unconfirmed western Miami Terrace habitat
 Submersible investigation of unconfirmed western Miami Terrace habitat Prepared By: Brian K. Walker, Ph.D. Nova Southeastern University Oceanographic Center 6/08/2015 On June 5, 2015 Nova Southeastern
Cross walking to the New Coastal and Marine Ecological Classification Standard (CMECS)
") Cross walking to the New Coastal and Marine Ecological Classification Standard (CMECS) Mark Finkbeiner and Chris Robinson NOAA Coastal Services Center EBM Tools Webinar 16 May 2013 Outline What is CMECS
Cross walking to the New Coastal and Marine Ecological Classification Standard (CMECS) Mark Finkbeiner and Chris Robinson NOAA Coastal Services Center EBM Tools Webinar 16 May 2013 Outline What is CMECS
Ecological mapping using satellite imagery: an Abu Dhabi case study Middle East Geospatial Forum 16 th February 2015
 Ecological mapping using satellite imagery: an Abu Dhabi case study Middle East Geospatial Forum 16 th February 2015 Richard Flemmings rf@proteusgeo.com About Proteus Formed in UAE 2011 We specialise in
Aim and objectives Components of vulnerability National Coastal Vulnerability Assessment 2
 ASSESSING THE UTILITY OF GEOMORPHIC SENSITIVITY MAPPING ON THE ILLAWARRA COAST Pamela Abuodha, Christina Baker, Chris Sharples, Darren Skene and Colin Woodroffe Geoquest Research Centre, University of
Marine biologists have identified over 250,000 marine species. This number is constantly increasing as new organisms are discovered.
 A wide variety of organisms inhabit the marine environment. These organisms range in size from microscopic bacteria and algae to the largest organisms alive today blue whales, which are as long as three
Geoduck Floating Nursery Monitoring Plan, Quarterly Reporting
 December 23, 2014 Mason County Department of Community Development Attn: Grace Miller, Senior Planner 411 N. Fifth Street PO Box 279 Shelton, WA 98584 Re: Geoduck Floating Nursery Monitoring Plan, Quarterly
Coastal and Marine Ecological Classification Standard (CMECS)
") Coastal and Marine Ecological Classification Standard (CMECS) Kathy Goodin, NatureServe EMECS, August 2011 Baltimore, MD 1 Outline Objectives & Process Classification Content Questions 2 Objectives Develop
Coastal and Marine Ecological Classification Standard (CMECS) Kathy Goodin, NatureServe EMECS, August 2011 Baltimore, MD 1 Outline Objectives & Process Classification Content Questions 2 Objectives Develop
National Marine Sanctuary Program
 National Marine Sanctuary Program NMSP/USGS Joint Seabed Mapping Initiative: September 2004 AA National Ocean Service National Marine Sanctuaries Interim Report September 2004 Background: Since 2002,
Bishopville Prong Study
 Bathymetric and Sediment Assessment in the Bishopville Prong of St. Martin River Darlene V. Wells, Richard A. Ortt, Jr., and Stephen Van Ryswick Funded by MCBP 2011-2012 Implementation Grant Objectives
APPENDIX E-4. Field Report: Intertidal Habitat and Marine Biota Survey
 APPENDIX E-4 Field Report: Intertidal Habitat and Marine Biota Survey Field Report Intertidal Habitat and Marine Biota Survey of the Vallejo Marine Terminal Site, Vallejo, California April 18, 2014 Prepared
SEDIMENT TRANSPORT IN RIVER MOUTH ESTUARY
 SEDIMENT TRANSPORT IN RIVER MOUTH ESTUARY Katsuhide YOKOYAMA, Dr.Eng. dredge Assistant Professor Department of Civil Engineering Tokyo Metropolitan University 1-1 Minami-Osawa Osawa, Hachioji,, Tokyo,
Australian Coastal Councils Conference
 Australian Coastal Councils Conference 11 March 2015 Estimating Future Coastal Inundation and Erosion Hazards Dr Andrew McCowan Dr Christine Lauchlan-Arrowsmith Warwick Bishop Background Victorian Future
THE INTERTIDAL ZONE AND BENTHIC ORGANISMS
 THE INTERTIDAL ZONE AND BENTHIC ORGANISMS EPSS 15 Lab #8 OUTLINE I. Intertidal zonation Tides Biotic zonation Physical conditions & biotic interactions II. Intertidal organisms & adaptations Snails Mussels
Appendix E: Cowardin Classification Coding System
 Appendix E: Cowardin Classification Coding System The following summarizes the Cowardin classification coding system and the letters and numbers used to define the USFWS NWI wetland types and subtypes:
Depositional Environment
 Depositional Environment Sedimentary depositional environment describes the combination of physical, chemical and biological processes associated with the deposition of a particular type of sediment. Types
Setting Priorities for Eelgrass Conservation and Restoration. Robert Buchsbaum Massachusetts Audubon Society
 Setting Priorities for Eelgrass Conservation and Restoration Robert Buchsbaum Massachusetts Audubon Society Eelgrass habitat values A rich, productive habitat for many marine organisms Nursery habitat
Unit 4 - Water. Earth s Interior. Earth s Interior. Continental Drift. Continental Drift. Continental Drift. Crust. Mantle. Core.
 Unit 4 - Water How did the oceans form? What special adaptations do saltwater organisms have? Where does our water come from? How do humans affect the Earth s water? Crust Rigid outer shell of Earth Oceanic
Ocean Floor. Continental Margins. Divided into 3 major regions. Continental Margins. Ocean Basins. Mid-Ocean Ridges. Include:
 Ocean Floor Divided into 3 major regions Continental Margins Ocean Basins Mid-Ocean Ridges Continental Margins Include: Continental Shelves Continental Slopes Continental Rise 1 Continental Shelves Part
Photosynthetic Habitats
 6. Kelps, Mangroves & Photosynthetic Habitats Photosynthetic Habitats Kelps Anatomy Community Ecosystem Mangroves Anatomy Community Ecosystem Other photosynthetic habitats Seagrasses Dr Rhian G. Waller
FINMARINET: Inventories and Planning for the Marine Natura 2000 Network in Finland. A.2 Geological inventories of the seafloor Final Report
 LIFE07 NAT/FIN/000151 FINMARINET: Inventories and Planning for the Marine Natura 2000 Network in Finland A.2 Geological inventories of the seafloor Final Report Geological Survey of Finland, GTK 1. Introduction
A BIOLOGICAL MONITORING SURVEY OF REEF BIOTA WITHIN BATHURST CHANNEL, SOUTHWEST TASMANIA 2010 NEVILLE BARRETT, ELIZABETH OH, LISA MEYER, DANE JONES
 A BIOLOGICAL MONITORING SURVEY OF REEF BIOTA WITHIN BATHURST CHANNEL, SOUTHWEST TASMANIA 1 NEVILLE BARRETT, ELIZABETH OH, LISA MEYER, DANE JONES AND GRAHAM EDGAR Executive Summary The benthic reef communities
Earth / Environmental Science. Ch. 14 THE OCEAN FLOOR
 Earth / Environmental Science Ch. 14 THE OCEAN FLOOR The Blue Planet Nearly 70% of the Earth s surface is covered by the global ocean It was not until the 1800s that the ocean became an important focus
MaxDepth Aquatics, Inc.
 MaxDepth Aquatics, Inc. Bathymetry of Mirror Pond From Newport Bridge to Galveston Bridge Prepared for the City of Bend By Joseph Eilers & Benn Eilers MaxDepth Aquatics, Inc. Bend, OR June 2005 INTRODUCTION
Cowichan Estuary Habitat Mapping and Oyster Population Assessment. Cowichan Stewardship Round Table
 Cowichan Estuary Habitat Mapping and Oyster Population Assessment Presentation at Cowichan Stewardship Round Table June 21, 2018 By Dr. Goetz Schuerholz 1 More than 8000 drone photos taken stitched together
The Marine Environment
 The Marine Environment SECTION 16.1 Shoreline Features In your textbook, read about erosional landforms, beaches, estuaries, longshore currents, and rip currents. For each statement below, write or. 1.
Southeast Tasmania Temperate Reef Survey Post-Survey Report
 G E O S C I E N C E A U S T R A L I A Southeast Tasmania Temperate Reef Survey Post-Survey Report June 13 26, 2008 and February 23 March 14, 2009 Record S.L. Nichol, T.J. Anderson, M. McArthur, N. Barrett,
US ARMY CORPS OF ENGINEERS New England District BUILDING STRONG
 US ARMY CORPS OF ENGINEERS New England District STUDIES Sediment Sampling Biological Sampling (benthic community analysis) Hydroacoustic Surveys (side scan sonar, bathymetry) Remotely Operated Vehicle
2.2.7 Backbarrier flats
 FIGURE 24. VERTICAL PHOTOGRAPH SHOWING THE DEVELOPMENT OF SMALL PARABOLIC DUNES FROM BLOWOUTS IN A LARGE RELICT FOREDUNE NORTHWEST OF HUNTER'S CREEK. PHOTOGRAPH COURTESY OF CAR'T'ER HOLT HARVEY FORESTS
Using seascapes to help predict Australia s benthic marine habitat diversity in the development of a national system of marine protected areas
 Using seascapes to help predict Australia s benthic marine habitat diversity in the development of a national system of marine protected areas A.D. Heap 1, T. Whiteway 1, V. Lucieer 2, S. Nichol 1 1. Geoscience
Use of Elevation Data in NOAA Coastal Mapping Shoreline Products. Coastal GeoTools April 1, 2015
 Use of Elevation Data in NOAA Coastal Mapping Shoreline Products Coastal GeoTools April 1, 2015 - NOAA s Coastal Mapping Program & CUSP - Shoreline Uses, Delineation Issues, Definitions - Current Extraction
Modeling habitat suitability for the European green crab using the ShoreZone mapping system
 Modeling habitat suitability for the European green crab using the ShoreZone mapping system Jodi N. Harney, Ph.D. and John R. Harper, Ph.D. Coastal and Ocean Resources Inc. Mary Morris, R.P. Bio. Archipelago
Earth Science Lesson Plan Quarter 2, Week 10, Day 1
 Earth Science Lesson Plan Quarter 2, Week 10, Day 1 Outcomes for Today Standard Focus: PREPARE 1. Background knowledge necessary for today s reading. Beaches are created by the actions of waves, tides,
Mechanisms for persistence of Gracilariopsis andersonii in the Elkhorn Slough: links to sediments. Megan Wehrenberg Moss Landing Marine Labs
 Mechanisms for persistence of Gracilariopsis andersonii in the Elkhorn Slough: links to sediments Megan Wehrenberg Moss Landing Marine Labs Gracilariopsis andersonii in Central CA Intertidal Open Coast
The Systems Approach. Alun Williams, ABPmer
 The Systems Approach Alun Williams, ABPmer Overview What is A Systems Approach? Behavioural / Qualitative Modelling? System Definition / Mapping (Behavioural Statements Objective) What is a Systems Approach?
Marine Video Survey of Western Port
 Marine Video Survey of Western Port No. 176 October 2012 Sean Blake, David Ball, Allister Coots and Tim Smith April 2013 Fisheries Victoria Department of Primary Industries If you would like to receive
CHAPTER 28. PHYSIOGRAPHY Cook Inlet Drainages
 PEBBLE PROJECT ENVIRONMENTAL BASELINE DOCUMENT 2004 through 2008 CHAPTER 28. PHYSIOGRAPHY Cook Inlet Drainages PREPARED BY: Knight Piésold Ltd. PHYSIOGRAPHY COOK INLET DRAINAGES TABLE OF CONTENTS TABLE
The Coast: Beaches and Shoreline Processes
 1 2 3 4 5 6 7 8 9 The Coast: es and Shoreline Processes Trujillo & Thurman, Chapter 10 Oceanography 101 Chapter Objectives Recognize the various landforms characteristic of beaches and coastal regions.
OCEAN ZONES. 1. Intertidal Zone 2. Near-Shore Zone 3. Open-Ocean Zone
 OCEAN ZONES 1. Intertidal Zone 2. Near-Shore Zone 3. Open-Ocean Zone Where the Ocean Meets the Land (Place) Intertidal Zone The intertidal zone is the area between the high- and low-tide lines. At high
OCEAN ZONES. 1. Intertidal Zone 2. Near-Shore Zone 3. Open-Ocean Zone
 OCEAN ZONES 1. Intertidal Zone 2. Near-Shore Zone 3. Open-Ocean Zone Where the Ocean Meets the Land (Place) Intertidal Zone The intertidal zone is the area between the high- and low-tide lines. At high
Offshore Video Survey and Oceanographic Analysis: Georges Bank to the Chesapeake project
 Non-Technical Synopsis of the Offshore Video Survey and Oceanographic Analysis: Georges Bank to the Chesapeake project Executive Summary Dave Bethoney Kristin Kleisner Mark Anderson Changsheng Chen Bradley
200 Meters Down Topic: Ocean Zones (5 th 8 th grade)
") 200 Meters Down Topic: Ocean Zones (5 th 8 th grade) by Lodge 200 Meters Down Have you people heard about the plankton? Just tiny algae and it s floating, right What about the nekton like jellyfish? They
200 Meters Down Topic: Ocean Zones (5 th 8 th grade) by Lodge 200 Meters Down Have you people heard about the plankton? Just tiny algae and it s floating, right What about the nekton like jellyfish? They
Percent cover standards
 Percent cover standards 2% 12% 20% 30% 35% 55% 75% 90% SEAGRASS SPECIES CODES ZC Zostera capricorni Hu Halodule uninervis 5 longitudinal veins Cross veins Leaf grows straight from rhizome ie no shoot trident
Kigoma Bay bathymetry, sediment distribution, and acoustic mapping
 Kigoma Bay bathymetry, sediment distribution, and acoustic mapping Student: Gwynneth Smith Mentor: Kiram Lezzar Introduction Echosounding is a method commonly employed for determining the bathymetry of
The Coast: Beaches and Shoreline Processes Trujillo & Thurman, Chapter 10
 The Coast: es and Shoreline Processes Trujillo & Thurman, Chapter 10 Oceanography 101 Chapter Objectives Recognize the various landforms characteristic of beaches and coastal regions. Identify seasonal
Paleo Lab #4 - Sedimentary Environments
 Paleo Lab #4 - Sedimentary Environments page - 1. CHARACTERISTICS OF SEDIMENT Grain size and grain shape: The sizes and shapes of sedimentary particles (grains) are modified considerably during their transportation
Your web browser (Safari 7) is out of date. For more security, comfort and the best experience on this site: Update your browser Ignore
 is out of date. For more security, comfort and the best experience on this site: Update your browser Ignore") Your web browser (Safari 7) is out of date. For more security, comfort and the best experience on this site: Update your browser Ignore CO NTINENTAL SHEL F For the complete encyclopedic entry with media
Your web browser (Safari 7) is out of date. For more security, comfort and the best experience on this site: Update your browser Ignore CO NTINENTAL SHEL F For the complete encyclopedic entry with media
SUT WA Research Night
 SUT WA Research Night An introduction to acoustic seafloor observation and geostatistical data interpolation Elizabeth Mair BSc (GIS) Honours Curtin University Contents Project Introduction Methodology
Lecture Outline Wednesday - Friday February 14-16, 2018
 Lecture Outline Wednesday - Friday February 14-16, 2018 Quiz 2 scheduled for Friday Feb 23 (Interlude B, Chapters 6,7) Questions? Chapter 6 Pages of the Past: Sedimentary Rocks Key Points for today Be
an accessible interface to marine environmental data Russell Moffitt
 an accessible interface to marine environmental data Russell Moffitt The Atlas Project GOAL: To provide a single point of access to oceanographic and environmental data for use by marine resource researchers,
Marine habitat map of Northland: Mangawhai to Ahipara
 Marine habitat map of Northland: Mangawhai to Ahipara Version 1 April 2009 Vince Kerr Published by Department of Conservation P.O. Box 842 Whangarei 0140, New Zealand This report was prepared by Vince
Form 4 of Schedule 5 of the Exclusive Economic Zone and Continental Shelf (Environmental Effects Permitted Activities) Regulations 2013
 Regulations 2013") FORM 4 Permitted activities: Post-activity report Form 4 of Schedule 5 of the Exclusive Economic Zone and Continental Shelf (Environmental Effects Permitted Activities) Regulations 2013 How to use this
FORM 4 Permitted activities: Post-activity report Form 4 of Schedule 5 of the Exclusive Economic Zone and Continental Shelf (Environmental Effects Permitted Activities) Regulations 2013 How to use this
Evolution and Life in the Ocean
 Characteristics of All Living Things Contain matter in a highly organized state Capture, store and transmit energy; all organisms require energy Capable of reproduction Change through time and adapt to
Confidence Assessment Scoring System
 Confidence Assessment Scoring System Confidence field Confidence group Confidence question Comments Remote sensing data collection RemoteTechnique Were the techniques used appropriate for the ground type?
Relationships between Littoral Zone Habitats and lake water level fluctuation at Bear Lake,UT
 CEE 6440: GIS in Water Resources Term Paper: Fall 2015 Relationships between Littoral Zone Habitats and lake water level fluctuation at Bear Lake,UT Using ArcGIS and Python techniques Student: Matthew
Supplemental Slides. Shore: Junction of Land & Water. Junction of Land & Water. Sea Level Variations. Shore vs. Coast. Sea Level Variations
 Shore: Junction of Land & Water Supplemental Slides Sediments come off land Most get dumped at the beach Sediment interacts with ocean waves and currents Junction of Land & Water Features: Breaking waves,
Shore: Junction of Land & Water. Sediments come off land Most get dumped at the beach Sediment interacts with ocean waves and currents
 Shore: Junction of Land & Water Supplemental Slides Sediments come off land Most get dumped at the beach Sediment interacts with ocean waves and currents Junction of Land & Water Features: Breaking waves,
Developing a Seabed Resurvey Strategy: A GIS approach to modelling seabed changes and resurvey risk
 Developing a Seabed Resurvey Strategy: A GIS approach to modelling seabed changes and resurvey risk A. M. Bakare, J. G. Morley, R. R. Simons Department of Geomatic Engineering, University College London,
Evaluation of a new hydroacoustic substrate classification system for oyster reef mapping in Galveston Bay, Texas
 Evaluation of a new hydroacoustic substrate classification system for oyster reef mapping in Galveston Bay, Texas Introduction Importance of Oyster Reef Resources Vital in maintaining the Galveston Bay
Oceanography is the scientific study of oceans Oceans make up over 70% of the Earth s surface
 Oceanography Oceanography is the scientific study of oceans Oceans make up over 70% of the Earth s surface An ocean must be large and have features which set it apart from other oceans (currents, water
Risks to Estuarine Biota under Proposed Development in the Whitford Catchment Summary Report
 Risks to Estuarine Biota under Proposed Development in the Whitford Catchment Summary Report August 2003 TP204 Auckland Regional Council Technical Publication No. 204, 2003 ISSN 1175-205X ISBN -1-877353051
SIF_7.1_v2. Indicator. Measurement. What should the measurement tell us?
 Indicator 7 Area of natural and semi-natural habitat Measurement 7.1 Area of natural and semi-natural habitat What should the measurement tell us? Natural habitats are considered the land and water areas
The Marine Environment
 The Marine Environment SECTION 16.1 Shoreline Features In your textbook, read about erosional landforms, beaches, estuaries, longshore currents, and rip currents. For each statement below, write true or
BIOLOGICAL OCEANOGRAPHY
 BIOLOGICAL OCEANOGRAPHY AN INTRODUCTION 0 ^ J ty - y\ 2 S CAROL M. LALLI and TIMOTHY R. PARSONS University of British Columbia, Vancouver, Canada PERGAMON PRESS OXFORD NEW YORK SEOUL TOKYO ABOUT THIS VOLUME
ARE YOU READY TO THINK? Look at the first slide THINK PAIR SHARE!
 ARE YOU READY TO THINK? Look at the first slide THINK PAIR SHARE! WHAT PROMINENT FEATURE CAN YOU IDENTIFY IN THIS PICTURE? What do you think the different colors represent? Who might find such a picture
Using Underwater Video to Map Subtidal Habitats and Eelgrass (Zostera marina) Around Prudence Island, Rhode Island
 Around Prudence Island, Rhode Island") Narragansett Bay Research Reserve Using Underwater Video to Map Subtidal Habitats and Eelgrass (Zostera marina) Around Prudence Island, Rhode Island Technical Report 1 2013:2 Kenneth B. Raposa, Ph.D. Research
Narragansett Bay Research Reserve Using Underwater Video to Map Subtidal Habitats and Eelgrass (Zostera marina) Around Prudence Island, Rhode Island Technical Report 1 2013:2 Kenneth B. Raposa, Ph.D. Research
Adaptive Bathymetric System Mapping of Champagne Reef and Scott s Head
 Adaptive Bathymetric System Mapping of Champagne Reef and Scott s Head TRAVIS ROOF¹ ABSRACT Bathymetric maps are crucial not only for navigational purposes but also for conservation of marine environments.
Highland Lake Bathymetric Survey
 Highland Lake Bathymetric Survey Final Report, Prepared For: The Town of Highland Lake 612 Lakeshore Drive Oneonta, AL 35121 Prepared By: Tetra Tech 2110 Powers Ferry Road SE Suite 202 Atlanta, GA 30339
Appendix G.19 Hatch Report Pacific NorthWest LNG Lelu Island LNG Maintenance Dredging at the Materials Offloading Facility
 Appendix G.19 Hatch Report Pacific NorthWest LNG Lelu Island LNG Maintenance Dredging at the Materials Offloading Facility Project Memo H345670 To: Capt. David Kyle From: O. Sayao/L. Absalonsen December
Geol 117 Lecture 18 Beaches & Coastlines. I. Types of Coastlines A. Definition:
 I. Types of Coastlines A. Definition: 1. Shore = narrow zone where ocean meets land (e.g. beach) 2. Coast is a broad area where both ocean and land processes act a. Includes onshore marshes, dunes, sea
The Application of CHRIS Data to the Multi-temporal & Multi-angular Study of Near-shore Marine Bathymetry
 The Application of CHRIS Data to the Multi-temporal & Multi-angular Study of Near-shore Marine Bathymetry PhD/Postgrad students: Libby Boak Stacy Mitchell AJ Lau Indrie Miller School of Biological, Earth,
Abstract. Introduction
 Southern California Aquaculture Site Assessment Model Caitlyn Raines University of Redlands Master of Science in Geographic Information Systems Program Abstract The Southern California Aquaculture Site
Baseline Estuarine-Upland Transition Zone
 Baseline Estuarine-Upland Transition Zone in SF, San Pablo and Suisun Bays 10/5/18 Prepared for San Francisco Bay Joint Venture (SFBJV) Prepared by Brian Fulfrost, Principal bfaconsult@gmail.com with additional
A SURVEY OF THE WESTERN BLUE GROPER IN WESTERN SOUTH AUSTRALIA
 A SURVEY OF THE WESTERN BLUE GROPER IN WESTERN SOUTH AUSTRALIA By Scoresby A. Shepherd and James B. Brook Reef Watch, c/o Conservation Council of South Australia, 120 Wakefield St, Adelaide, 5000. 4 January
Reading Material. See class website. Sediments, from Oceanography M.G. Gross, Prentice-Hall
 Reading Material See class website Sediments, from Oceanography M.G. Gross, Prentice-Hall Materials filling ocean basins Dissolved chemicals especially from rivers and mid-ocean ridges (volcanic eruptions)
GEOGRAPHIC INFORMATION SYSTEMS AND IT SOLUTIONS FOR THE ENVIRONMENT
 GEOGRAPHIC INFORMATION SYSTEMS AND IT SOLUTIONS FOR THE ENVIRONMENT Mission We focus on Solutions is a worldwide operating business offering Geographic Information Systems and IT solutions to assist environmental
C. STUDENT FIELD DATA SHEETS
 C. STUDENT FIELD DATA SHEETS Student Name Date Time Stream Location Parameter to find Your Group s Results Units trial trial average Transparency cm Water Temperature Air Temperature Weather N sunny N
Spatial variation in the abundance of eelgrass (Zostera marina) at eight sites in western Newfoundland, Canada 5/5/2015 V2.0
 at eight sites in western Newfoundland, Canada 5/5/2015 V2.0") Spatial variation in the abundance of eelgrass (Zostera marina) at eight sites in western Newfoundland, Canada 5/5/2015 V2.0 1 Summary The abundance of eelgrass (Zostera marina) was quantified at eight
Spatial variation in the abundance of eelgrass (Zostera marina) at eight sites in western Newfoundland, Canada 5/5/2015 V2.0 1 Summary The abundance of eelgrass (Zostera marina) was quantified at eight